This study analyzed order fulfillment times for 1,000 products ordered from Amazon and other major online retailers to compare their performance. The results showed that on average, Amazon fulfilled orders in 1.92 days while other retailers took 4.81 days. Amazon delivered orders faster than competitors for 81% of products. Amazon had particularly strong fulfillment for books, delivering orders on average twice as fast as other retailers. The study concludes that Amazon's superior fulfillment infrastructure gives it a significant competitive advantage over retailers that have not invested similarly in online order fulfillment.
This Research deals with the supply chain
management (SCM) provide us a high practical rapidity flow of
high quality, significant information that will assist suppliers to
provide a constant and specifically timed flow of resources to
customers. However, unplanned demand oscillations, including
those caused by stock outs, in the supply chain performance
development produce distortions. There are numerous causes,
often in combination that will cause these supply chain
distortions to start what has become known as the “Bullwhip
Effect”.
While the devil is generally hidden in the details, as is the
case here, the most common drivers of these demand distortions
are: Customers, Promotions, Sales, Manufacturing Policies,
Processes, Systems and Suppliers. The “Bullwhip Effect” has in
the past been recognized as normal, and in fact, thought to be a
predictable part of the order-to-delivery cycle. In this paper we
propose a novel effective approach to find the MSE (Mean square
error) with the help of MAMDANI Fuzzy logic.
The 27 Amazon FBA Business Valuation Metrics That Actually MatterBryan O'Neil
Find out what really makes an Amazon business valuable and which metrics to keep in mind when building your business with the intention of selling it one day.
How to Improve Your Amazon Operations to Grow Purchase Orders & ProfitabilityTinuiti
Amazon is constantly changing. Today, vendors have more insight & tools than ever before to improve their operational performance and Amazon competency. Unfortunately, interpreting and implementing these changes are challenging.
But for Amazon vendors who want to scale sales, it’s essential to use Vendor Central data to create a holistic product catalog analysis, the dynamic factors affecting sales & profitability, and how that aligns with Amazon’s ongoing PO process.
Some Topics We’ll Discuss:
-Leveraging Amazon’s Retail Analytics (Basic + Premium)
-Demystifying Your Amazon Vendor Central Data
-Warehouse Functions & Their Impact on Inventory Availability
-Understanding Amazon’s Demand Forecasting Model
-Combining Operational Data into Your AMS Strategy
our Privacy Policy.
Don’t Miss Out—Former Manager, Vendor Management at Amazon and now CPC Strategy’s Manager of Amazon Vendor Operations, Eric Kauss, is joined by our Head of Markeptlace Strategy, Pat Petriello, for a webinar that delves into maintaining a operationally efficient & profitable business on Amazon.
1. Vasquez Rocks (10700 Escondido Canyon Road, Agua Dulce, CA .docxpaynetawnya
1. Vasquez Rocks (
10700 Escondido Canyon Road, Agua Dulce, CA
91350)
2. Palmdale Ro
ad Cut (
332 West Avenue South Palmdale, CA 93551
3. St. Francis Dam (Road pullout ¾ mile southwest of
35622 San
Francisquito Canyon Rd., Santa Clarita,
CA)
Introduction
This section should be a brief summary of the general setting (ie. who you were with and why, and an overview of the paper)
•Data
This section should be descriptions of what you saw, without interpretation.
•Interpretation
This section should explain what you think your observations from the previous section mean.
•Conclusion
This section should
be a summary of your overall take -away from the trip.
Also link your interpretations to the impact the geologic processes we covered have on humans.
In order to help you fill these sections, keep the following in mind at each stop when we are in the field:
1) What is the name of the fault seen at each stop, and what kind of fault is it?
2) What features did you see that indicate that there is a fault at each stop?
3) What potential threats to society did we see?
4) What other information did you learn about the fault?
5) What is the significance?
Please be concise to explain about every single stops, there are three stops.
Paul A. Souders/Corbis
Chapter
eleven
Chapter Outline
Introduction
11.1 The Role of Inventory
11.2 Periodic Review Systems
11.3 Continuous Review Systems
11.4 Single-Period Inventory Systems
11.5 Inventory in the Supply Chain Chapter Summary
Managing Inventory throughout the Supply Chain
Chapter ObjeCtives
By the end of this chapter, you will be able to:
· Describe the various roles of inventory, including the different types of inventory and inventory drivers, and distinguish between independent demand and dependent demand inventory.
· Calculate the restocking level for a periodic review system.
· Calculate the economic order quantity (EOQ) and reorder point (ROP) for a continuous review system, and determine the best order quantity when volume discounts are available.
· Calculate the target service level and target stocking point for a single-period inventory system.
· Describe how inventory decisions affect other areas of the supply chain. In particular, describe the bullwhip effect, inventory positioning issues, and the impacts of transportation, packaging, and material handling considerations.
326
CHAPTER 11• Managing Inventory throughout the Supply Chain
327
Inventory Management at Amazon.com
Baumgarten/VARIO IMAGES/SIPA/Newscom
Employees pick items off the shelves at an Amazon.com warehouse in Leipzig, Germany.
WHEN they first started appearing in the late 1990s, Web- based “e-tailers” such as Amazon.com hoped to replace the “bricks” of traditional retailing with the
“clicks” of online ordering. Rather than opening dozens or even hundreds of stores filled with expensive inventory, an e-tailer could run a single virtual store that served cus-tomers around the globe. Their business model suggested ...
By: Sean Doyle & Martin McDermott
AB/MT219: Marketing
Marketing Research Plan Proposal Example
Client Name: ZMX Global, Inc.
Brand: Bon Vivant: Organic Gourmet
1
Marketing Research Plan Proposal
Introduction
Headquartered in New York City, ZMX Global, Inc. is a large global food company
operating in over 51 countries around the world. Most commonly known as a fine foods
company, ZMX Global, Inc. has an impressively unparalleled portfolio of brands and
products with an international appeal. ZMX Global, Inc. focuses on providing exquisite
culinary products to consumers by being the top purveyor of premium quality ingredients to
the finest food retailers in the world. One renowned brand owned by ZMX Global, Inc.,
known as Bon Vivant, provides the highest quality frozen foods in the retail marketplace.
Bon Vivant produces frozen entrées to meet the needs of consumers in the market for frozen
readymade meals.
Purpose Statement
Through conducting secondary research, the ZMX Global, Inc. marketing team has
identified a steady demand for organic foods in the consumer marketplace in the U.S.A.
(Beesley, 2009). Based on this trend, the marketing team has created a preliminary product
line idea called Bon Vivant Organic Gourmet, a readymade frozen organic food product
offering. The purpose of this marketing research plan proposal is to present a process for
collecting and analyzing data that will be used to determine the need for a new frozen organic
food product line in the consumer marketplace. The proposed marketing research will
provide insightful decision-making information to assist ZMX Global, Inc. leadership in
determining the value in moving forward with the development of the Bon Vivant Organic
Gourmet product line (Lamb et al., 2014).
Marketing Research Process
Upon approval by ZMX Global, Inc. leadership, this marketing research project will
be assigned to the Frozen Foods Product Manager for completion, and a budget will be
2
finalized for consideration. This proposed research design is cost efficient and can be
executed within a two week time period if funded.
Research Questions
The following marketing research problem and opportunity questions inform the
research design specifications for this project:
1. Is there a demand for an organic frozen food product line in the consumer marketplace?
2. What type of consumer would purchase a frozen organic food meal?
3. What geographic locations will result in volume sales of readymade frozen organic meals?
Planning the Research Design
Both quantitative and qualitative analysis will be conducted using the following types
of data:
Secondary Data. To be collected from the innumerable resources inside and outside
of the organization, secondary data will be used to assist in answering the research questions.
Secondary data deriving from inside the organization will consist of product ...
Agenda
Overview
Problem Statements
Strategic Options
Strategy Recommendations
VRIN Framework
Specific Plans
Conclusion
*roastery @ new york
Recommendation - talk about chosen one last
Overview
About SBUX
“To inspire and nurture the human spirit – one person, one cup and one neighborhood at a time.” (Mission)
“To establish Starbucks as the premier purveyor of the finest coffee in the world while maintaining our uncompromising principles while we grow.” (Vision)
The Four Pillars of SBUX (Strategy)
Offering ‘third-place’ experience
Selling coffee of the highest quality
International market expansion with the focus on emerging economies
Integrating technology into various business processes
About SBUX
Founded by three partners who attended USF
March 31st 1971 - First Sbux @ Seattle, Washington
1996 - First abroad location @ Tokyo, Japan
Jerry Baldwin, Zev Siegl, Gordon Bowker
As of Now
6 continents, 78 countries
29,000+ locations
14,606 stores in the United States
14, 718 international stores
Currently, Starbucks has 59% market in the coffee industry
Conflicts @ SBUX
Problem Statement #1
California Judge rule Starbucks have failed to prove significant health risk with their procedure of roasting coffee which can lead to major financial risks.
Cancer Warning Signs
Proposition 65 - requires coffee retailers to warn customers about chemical
Acrylamide - chemical produced after roasting coffee beans - high doses can cause cancer
Failure to warn = Fines up to millions $
WHY NOT?
Not specific (other companies involved)
Minor Issue
Common
Lots of places and items has warning signs but are ignored
Loyal customers aren’t phased
“A cancer warning would be annoying but wouldn’t stop me from treating myself to three lattes a week.” -Darlington Ibekwe, Lawyer in LA
WHY NOT? = why didn’t the group choose this problem statement to focus on
Problem Statement #2
Starbucks fail to recognize the small, local businesses that provides low-cost, but high quality products thus competing against the corporation.
Mom & Pop Competition
They can offer lower coffee price and provide similar coffee drinks
They have local support
Some coffee shops has more variety (Iron Horse - coffee cocktail)
WHY NOT?
Not ALL mom & pops has cheap prices
Convenience is huge factor for Sbux
Pricing
Time (24 hour stores)
Multiple locations
Iron Horse Coffee Bar @
Maiden Lane, SF downtown
*pricing few cents more than Sbux
Alex
Problem Statement #3
While fulfilling the 4th pillar (technology integration), Starbucks failed to pay close attention to the other three pillars resulting in a decline in customer loyalty.
Technological Aspects
Mobile & Online Pay
Bottleneck - customers orders multiple drinks
Slow down service
Long lines discourages incoming customers
Third-Party Delivery
UberEats & Postmates adds on to the traffic
Increased traffic means longer waits for non-online customers
Alex
Chosen: Technological Aspects
Why?
Hits ALL FO.
Product research is the process of gathering information and analyzing data about a specific product or market to gain insights into consumer needs, preferences, trends, and competition. It involves conducting thorough investigations, surveys, interviews, and analysis to understand the target audience, identify market opportunities, and make informed decisions about product development, pricing, marketing strategies, and overall business planning. The goal of product research is to gather reliable data and insights that can guide businesses in creating successful products that meet customer demands and drive profitability.
Product research is the process of gathering information and analyzing data about a specific product or market to gain insights into consumer needs, preferences, trends, and competition. It involves conducting thorough investigations, surveys, interviews, and analysis to understand the target audience, identify market opportunities, and make informed decisions about product development, pricing, marketing strategies, and overall business planning.
2 Chapter 1 The Where, Why, and How of Data Collection Busines.docxlorainedeserre
2 Chapter 1 | The Where, Why, and How of Data Collection
Business Statistics
A collection of procedures and techniques that are used to convert data into meaningful information in a business environment.
1.1
Chapter 18 provides an overview of business analytics and introduces you to Microsoft analytics software called Microsoft Power BI. People working in this field are referred to as “data scientists.” Doing an Internet search on data mining will yield a large number of sites that describe the field.
In today’s workplace, you can have an immediate competitive edge over other new employees, and even those with more experience, by applying statistical analysis skills to real-world decision making. The purpose of this text is to assist in your learning and to complement your instructor’s efforts in conveying how to apply a variety of important statistical procedures.
Cell phone companies such as Apple, Samsung, and LG maintain databases with information on production, quality, customer satisfaction, and much more. Amazon collects data on customers’ online purchases and uses the data to suggest additional items the customer may be interested in purchasing. Walmart collects and manages massive amounts of data related to the operation of its stores throughout the world. Its highly sophisticated database systems contain sales data, detailed customer data, employee satisfaction data, and much more. Governmental agencies amass extensive data on such things as unemployment, interest rates, incomes, and education. However, access to data is not limited to large companies. The relatively low cost of computer hard drives with massive data storage capacities makes it possible for small firms and even individuals to store vast amounts of data on desktop computers. But without some way to transform the data into useful information, the data these companies have gathered are of little value.
Transforming data into information is where business statistics comes in—the statistical procedures introduced in this text are those that are used to help transform data into information. This text focuses on the practical application of statistics; we do not develop the theory you would find in a mathematical statistics course. Will you need to use math in this course? Yes, but mainly the concepts covered in your college algebra course.
Statistics does have its own terminology. You will need to learn various terms that have special statistical meaning. You will also learn certain dos and don’ts related to statistics. But most importantly, you will learn specific methods to effectively convert data into information. Don’t try to memorize the concepts; rather, go to the next level of learning called understanding. Once you understand the underlying concepts, you will be able to think statistically.
Because data are the starting point for any statistical analysis, Chapter 1 is devoted to discussing various aspects of data, from how to collect data to the differen ...
Competing retailers and inventory an empirical investigation of
Amazon Fulfillment
1. 1
EXECUTIVE REPORT – September 2016
FULFILLMENT TIME PERFORMANCE OF AMAZON RELATIVE TO
OTHER ONLINE RETAILERS – AN EMPIRICAL ANALYSIS
Rohit Das1
, Amanda Helminsky2
, Jingran Zhang2
, Sevilay Onal2
and Sanchoy Das2
1 College of Business, University of Illinois, Urbana-Champaign, IL 61820
2 College of Engineering, New Jersey Institute of Technology, NJ 07102
INTRODUCTION:
When selecting an online retailer, the two main criteria from a consumer perspective are the price and
fulfillment time. Where fulfillment time is defined as the interval between customer’s order placement and
onsite delivery. Previous studies have confirmed a strong relationship between order fulfillment times and
consumer buying behavior. These studies show that order fulfillment efficiency is an important determinant
of overall customer satisfaction and retention. The phenomenal growth of Amazon and its widespread
impact on the U.S. retail industry is now well documented. The general opinion is that Amazon has designed
and built a fulfillment infrastructure that allows it to achieve delivery times that significantly outperform all
other online retailers. One day and in some instances same day fulfillment, motivates customers to shift
their buying behavior to the web, and in most cases specifically to Amazon. The market shifts and economic
impacts of online buying on traditional retailers is clearly evident in their quarterly reports. This study shows
that building a competitive fulfillment infrastructure is key for any online retailer to effectively participate and
benefit from these market shifts.
While many retailers are able to offer competitive prices and an attractive product variety in their online
stores, we believe quick online fulfillment is not easily achieved from traditional warehouses and logistics
systems. This research uses a survey method to evaluate the fulfillment time performance behavior of
consumer orders made through the Amazon website and several competing online retailers. The goal of
the study is to empirically confirm whether the Amazon fulfillment infrastructure provides it with a
competitive advantage relative to other online retailers. Specifically, three research questions investigating
the comparative fulfillment times of Amazon versus other major retailers are analyzed. We explore the issue
of whether by simply offering products for online sale, a conventional retailer can effectively match the
fulfillment performance of Amazon. The results are important in that they provide fulfillment time
benchmarks for existing and new online retailers, allowing them to build a more directed and target driven
fulfillment strategy.
SURVEY DATA:
The survey method involved placing an online order for the identical product on both Amazon and a
competing online retailer. The sample set consisted of a thousand products (N=1000). To focus the results
on Amazon logistics and inventory policies, only Amazon Fulfilled products were selected. To ensure the
generality of the survey population, three factors were used in product selection: (i) Type – Five types that
are most commonly ordered in online retail were chosen, except for fashion the other retailer was limited
to one or two leading competitors; (ii) Price – Four pricing categories were assigned; and (iii) Size –
represented by the product volume, three categories were assigned. Factor selection was limited to causal
2. 2
factors that are most likely to influence the product flow and associated logistics. For example a large office
product (e.g. High back chair) is likely to have lower inventory levels and require more fulfillment resources,
likewise a small electronics product (e.g. Memory stick) requires significantly less resources. Fashion
represents a special case in that few identical products are available on both Amazon and a single
competing retailer, thus requiring the survey to expand the set of other retailers.
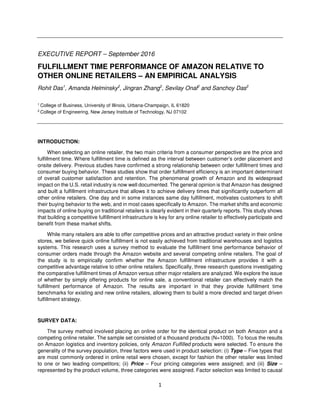
Table 1. SURVEY PRODUCT DISTRIBUTION (N=1000)
1. TYPE Ratio 2. PRICE Ratio 3. SIZE Ratio
Electronics (Best Buy/Walmart) 25% Less than $50 45% Small 43%
Home Improvement (Home Depot) 20% $50 to $100 20% Medium 42%
Fashion (Multiple) 20% $101 to $200 20% Large 15%
Office Products (Staples/Office Depot) 20% More than $200 15%
Books (Barnes & Noble) 15%
Table 1 shows the distribution of the surveyed products, specific competing retailers for each type are
also identified. Survey data was collected over a five week period (May to June 2016). To minimize the
effects of weekend logistic delays, order placement was done Sunday to Thursday. For every product both
the Amazon and competing retailer order were placed on the same day at the same time. For each product
three data points were collected: OP - Order placement date; OA - Amazon order fulfill promise date; and
OC – Competing retailer order fulfill promise date.
FULFILLMENT PERFORMANCE ANALYTICS
The performance metrics of interest are the Amazon Fulfillment Time: FA = OA – OP, and the
Competition Fulfillment Time: FC = OC – OP. The analytical dataset is then defined by FA and FC for all
N=1000 products. Where the fulfillment straddles a Sunday, then FA and/or FC is reduced by one. Less than
5% of the data set was adjusted by this rule. Three study questions were analyzed using the data set.
3. 3
R1 – Mean fulfillment time for Amazon orders is shorter than other retailers – Figure 1 shows the FA
and FC distributions across the survey set. The observed mean and standard deviation for FA was 1.92 and
2.43 days, while for FC it was 4.81 and 3.41 days. The shorter fulfillment time dominance of Amazon is
clear from figure 1. For 89% of orders FA was 2 days or less, while the corresponding ratio for FC was only
26%. An independent-samples t-test was conducted to compare FA and FC. A significant difference in FA
and FC was observed with conditions; t(999)=-22.5, p=0.05. These results suggest that the Amazon
fulfillment infrastructure allows them to achieve much shorter fulfillment times relative to the competition.
R2 – What is the fulfillment time difference between Amazon and other retailers – While R1 studied
the overall delivery performance, R2 focuses on each specific order. The study metric here is the fulfillment
time advantage of Amazon described by Δ = FC - FA. Figure 2 shows the Δ distribution across the survey
set. For 4% of orders Amazon was slower than the competition, while for 15% of orders they were equally
fast, but for 81% of orders Amazon was at least a day faster. Further analysis of the Δ distribution confirms
the fulfillment time dominance of Amazon, and we find that for 41% of orders Amazon was at least 4 days
faster than the competition.
R3 – What is the fulfillment time behavior within each survey factor – The purpose of this question
was to investigate the fulfillment time behavior within each factor. Table 2 shows the detailed behavior
within each factor, and interesting differences within each factor are clearly evident. The product type
analysis provides insights into Amazon’s behavior against specific retailers. An independent-samples t-
test was conducted to compare FA and FC for each retailer pair, and a significant difference was confirmed
at p=0.05: Best Buy/Walmart - t(249)=-7.1, Home Depot - t(199)=-7.9; Fashion Multiple - t(199)=-16.6;
Staples/Office Depot - t(199)=-7.4; and Barnes & Noble - t(149)=-44.0. The fulfillment dominance of
Amazon is strongest in the Books category and smallest in the Electronics category. Surprisingly, Fashion
had the fastest delivery times for both Amazon and other retailers along with with small variances.
The product size analysis exhibited, as expected, an increase in FA and FC with increasing size. Larger
products require more storage space and handling effort, both at the warehouse and on distribution
vehicles. But this differentiation was less evident in the competing retailer data, with only a 25% increase
in FC between small and large products.
The product price analysis displays contrasting behaviors, for Amazon an increase in fulfillment time is
observed with price, while for other retailers the time actually decreases. In particular the FA and FC
difference for products priced at less than $50 was surprisingly large.
4. 4
Table 2. ORDER FULFILLMENT TIMES (Days)
FACTOR
Amazon Other Retailers
Mean Std. Dev Mean Std. Dev
Product Type
Electronics (Best Buy/Walmart) 2.19 3.32 4.21 3.04
Home Improvement (Home Depot) 2.83 3.28 5.39 3.01
Fashion (Multiple) 1.21 1.39 3.45 1.44
Office Products (Staples/Office Depot) 1.32 0.82 4.09 5.42
Books (Barnes & Noble) 2.03 1.00 7.23 1.07
Product Size
Small 1.53 1.58 4.38 3.16
Medium 1.93 2.48 5.01 3.55
Large 3.03 3.67 5.48 3.55
Product Price
Less than $50 1.64 1.30 5.04 3.57
$55 to $100 1.64 1.61 4.91 3.71
$101 to $200 2.02 3.03 4.42 2.63
More than $200 2.98 4.11 4.55 3.45
CONCLUSIONS
From an analysis of the survey data, this study confirms the fulfillment time dominance of Amazon. The
study results show specifically the time advantages it has achieved through its warehousing and logistics
infrastructure. Clearly, an online retail strategy which does not include an innovative and detailed fulfillment
solution is unlikely to be successful. For the few products where Δ was zero or less, the most common
strategy was found to be BOFOS (Buy Online Fulfilment Out of Retail Stores). Possibly, this provides a
quick solution for an omnichannel retailer. But BOFOS fulfillment costs are likely to be much higher than a
dedicated online warehouse, so the strategy maybe shortsighted. For Amazon orders the study found that
5% had same day and 41% had next day fulfillment. As these ratios increase further the competitive
landscape for purely brick-and-mortar retail does not bode well.
Across all factors, large products had the longest fulfillment time for Amazon, this could be good and
bad news for competing retailers. As Amazon further evolves its fulfillment infrastructure large product times
may decrease significantly this increasing the competitive challenges for large product retailers.
Alternatively, other retailers could focus on large product fulfillment allowing them to match Amazon since
the Δ gap is relatively smaller. The fulfillment time behavior across product price and product size is
indicative of the weak online fulfillment infrastructure of the other retailers. In a related study we have
identified and described the explosive storage policy used at Amazon’s internet fulfillment warehouses plus
the extensive digital control of all transactional activities. Significant evolution and redesign will be required
from other retailers if they are to achieve fulfillment time parity with Amazon.
Correspondence: For additional information please contact Prof. Sanchoy Das at das@njit.edu