allstateOur Employee and Agent Family, Our Communities, Glossary of Terms, Financial Information, Board of Directors, Senior Management Team and Shareholder Information 1998
Similar to allstateOur Employee and Agent Family, Our Communities, Glossary of Terms, Financial Information, Board of Directors, Senior Management Team and Shareholder Information 1998
Similar to allstateOur Employee and Agent Family, Our Communities, Glossary of Terms, Financial Information, Board of Directors, Senior Management Team and Shareholder Information 1998 (20)
allstateOur Employee and Agent Family, Our Communities, Glossary of Terms, Financial Information, Board of Directors, Senior Management Team and Shareholder Information 1998
1. Our Employee and Agent Family
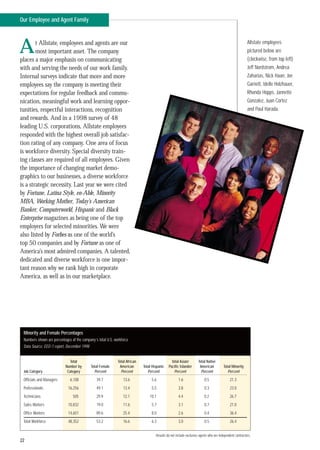
A t Allstate, employees and agents are our Allstate employees
most important asset. The company pictured below are
places a major emphasis on communicating (clockwise, from top left)
with and serving the needs of our work family. Jeff Nordstrom, Andrea
Internal surveys indicate that more and more Zaharias, Nick Haan, Joe
employees say the company is meeting their Garnett, Idelle Holzhauer,
expectations for regular feedback and commu- Rhonda Hopps, Jannette
nication, meaningful work and learning oppor- Gonzalez, Juan Cortez
tunities, respectful interactions, recognition and Paul Harada.
and rewards. And in a 1998 survey of 48
leading U.S. corporations, Allstate employees
responded with the highest overall job satisfac-
tion rating of any company. One area of focus
is workforce diversity. Special diversity train-
ing classes are required of all employees. Given
the importance of changing market demo-
graphics to our businesses, a diverse workforce
is a strategic necessity. Last year we were cited
by Fortune, Latina Style, en-Able, Minority
MBA, Working Mother, Today’s American
Banker, Computerworld, Hispanic and Black
Enterprise magazines as being one of the top
employers for selected minorities. We were
also listed by Forbes as one of the world’s
top 50 companies and by Fortune as one of
America’s most admired companies. A talented,
dedicated and diverse workforce is one impor-
tant reason why we rank high in corporate
America, as well as in our marketplace.
Minority and Female Percentages
Numbers shown are percentages of the company’s total U.S. workforce
Data Source: EEO-1 report, December 1998
Total Total African Total Asian/ Total Native
Number by Total Female American Total Hispanic Pacific Islander American Total Minority
Job Category Category Percent Percent Percent Percent Percent Percent
Officials and Managers 6,108 39.7 13.6 5.6 1.6 0.5 21.3
Professionals 16,256 49.1 13.4 5.5 3.8 0.3 23.0
Technicians 505 29.9 12.1 10.1 4.4 0.2 26.7
Sales Workers 10,832 19.0 11.6 5.7 3.1 0.7 21.0
Office Workers 14,651 89.6 25.4 8.0 2.6 0.4 36.4
Total Workforce 48,352 53.2 16.6 6.3 3.0 0.5 26.4
Results do not include exclusive agents who are independent contractors.
22
2. Our Communities
A llstate is a company of people who
care —about the people and commu-
nities we serve as well as the businesses we
manage. We have a proud history of promoting
auto and highway safety and working to
improve the neighborhoods in which we live
and work. Allstate has been a strong advo-
cate for such safety initiatives as air bags,
better bumpers, driver education and pro-
grams to combat drunk driving. More than
half of Allstate’s employees volunteer at the
local level. Employees and agents in 1998
pledged more than $3 million in the annual
giving campaign. And The Allstate
Foundation donated $9 million in 1998 for
neighborhood revitalization, auto and high-
way safety, and personal safety and security.
We’ve committed $45 million over five years
to neighborhood revitalization, insurance
education, and youth and safety programs in
seven major urban markets. And with Safe
Home America, we’ve launched a model
public-private partnership to build stronger,
safer communities —one block at a time. In
these and many other ways, Allstate employ-
ees and agents are giving something back
to the communities they serve, and building
stronger, safer neighborhoods that help
residents to become better insurance risks.
David Duplechian is on Gloria Keck assists Gene Matthews helps Amy Arteago volun-
the board of Mothers youngsters in com- the children of his teers for a variety of
Against Drunk Driving munity service projects community by serving local programs, includ-
and works with stu- in the Bedford- as chairman of the ing working with young
dents to encourage Stuyvesant section board of his local adults in hands-on
safe driving habits. of New York City. Boys & Girls Club. community service.
23
3. Automobile and Personal Safety
Allstate claim repre-
sentative David
Duplechian works
with student drivers
Daron Stevens and
Ashley Pinter in Lake
Charles, Louisiana, to
encourage safe dri-
ving habits as part of
MADD’S Tie One On
For Safety campaign.
Allstate’s commitment to automobile and highway safety
dates back to 1949. Since then the company has vigorously
promoted such important initiatives as better car bumpers,
air bag and seat belt use, child safety seats, theft preven-
tion, young driver programs and efforts to combat drunk
driving. Working with federal, state and not-for-profit
organizations, our efforts have helped bring about safer
cars and highways, stricter law enforcement and improved
highway safety for all Americans.
Neighborhood Revitalization
Allstate agent Gloria
Keck directs young-
sters in a garden
project sponsored by
Neighborhood Housing
Services in the
Bedford-Stuyvesant
community in
New York.
Allstate began as an urban insurer in 1931 and urban
markets still account for a major part of the company’s
business. To demonstrate the company’s commitment to
these markets, Allstate supports a number of organizations
and programs that promote home ownership, neighborhood
revitalization and economic development. They include
the National Civic League’s All-America City Awards,
National Council of LaRaza, Local Initiatives Support
Corporation (LISC), and The Neighborworks Network.
These and many other organizations we work with help
strengthen communities across the country.
24
4. Volunteerism
Allstate employee
Amy Arteago volun-
teers for a variety of
community programs
in the Seattle area,
including planting
trees as part of a
wetlands restoration
at the Black River in
Renton, Washington.
For more than two decades, Allstate’s volunteer program
has provided an opportunity for employees and agents to
serve their communities. More than 200 Allstate Helping
Hands committees across the country plan events that
focus volunteer efforts on health and human services pro-
grams, safety, neighborhood revitalization, at-risk youth
programs, education and other social issues. An estimated
54 percent of employees and agents volunteer in their
communities every year.
Youth Programs
Allstate agent Gene
Matthews helps
11-year-old Carolyn
Bustillo with crafts
activities at the Boys
& Girls Club in North
Port, Florida. As part
of his duties as club
chairman, Gene de-
votes 16 hours a week
to club business.
Allstate supports youth activities through donations and
volunteer efforts. The company has pledged $25 million in
financial and in-kind commitments to America’s Promise
— The Alliance for Youth. The company helps tens of
thousands of at-risk youth through community volunteer activ-
ities. One program funded by The Allstate Foundation in
partnership with The Boys & Girls Clubs of America is Street
SMART, which helps young people deal with life-threatening
issues in their daily lives and find positive alternatives.
25
5. Glossary of Terms
Operating Income
Written Premiums
Underwriting income plus income from
The total value of insurance coverage sold
investments, net of related taxes.
to policyholders in a calendar year. These
premiums will then be “earned” over the life
of the policy. Net Income
Operating income plus the gains and losses
from the sales of investments and the dis-
Revenues
position of businesses.
The sum of property-liability premiums
earned during a policy period, life insurance
premiums and contract charges and the Investments
The assets purchased with the premiums
money earned by holding or selling
collected from policyholders and share-
investments.
holders’ capital.
Underwriting Income
The profit or loss from the underlying
business that results when claims, claims
expense and operating expenses are
subtracted from premiums earned. Under-
writing income does not include the income
from investments that are held or sold.
Combined Ratio
The sum of the loss ratio and the expense
ratio. The loss ratio is the percent of premi-
ums that goes to pay claims; the expense
ratio is the percent of premiums that goes
to pay operating expenses. Together, they
measure how much of each premium dollar
is spent on operating expenses and claim
settlement costs. A combined ratio under
100 percent indicates that an underwriting
profit is being earned.
26
6. Financial Strength
Net Income Net Income per Total Assets
Diluted Common Share
$ in millions $ in billions
484 1,904 2,075 3,105 3,294 0.54 2.12 2.31 3.56 3.94 61.0 70.0 74.5 80.9 87.7
94 95 96 97 98 94 95 96 97 98 94 95 96 97 98
Allstate continues to operate from a position of financial
strength and stability with assets increasing to $88 billion
and shareholders’ equity of $17 billion. In 1998, Allstate
registered its fourth consecutive year of record results with
net income of $3.3 billion and operating earnings of
$2.6 billion. On a per share basis net income increased
10.7 percent to $3.94. Revenues increased 3.7 percent to
$25.9 billion, reflecting growth in premiums in each of
the company’s core lines of business.
27
7. 5-year Summary of Selected Financial Data
$ in millions except per share data
Consolidated Operating Results 1998 1997 1996 1995 1994
Revenues $25,879 $24,949 $24,299 $22,793 $21,109
Operating income 2,573 2,429 1,600 1,587 268
Realized capital gains and losses, after-tax 694 638 510 168 130
Net income 3,294 3,105 2,075 1,904 484
Earnings per share–diluted 3.94 3.56 2.31 2.12 0.54
Consolidated Financial Position
Investments $66,525 $62,548 $58,329 $56,505 $47,227
Total assets 87,691 80,918 74,508 70,029 60,988
Reserves for claims and life-contingent contract
benefits and contractholder funds 45,615 44,874 43,789 42,904 39,961
Debt 1,746 1,696 1,386 1,228 869
Mandatorily redeemable preferred securities
of subsidiary trusts 750 750 750 – –
Shareholders’ equity 17,240 15,610 13,452 12,680 8,426
Property-Liability Operations
Premiums written $19,515 $18,789 $18,586 $17,965 $16,739
Premiums earned 19,307 18,604 18,366 17,540 16,513
Net investment income 1,723 1,746 1,758 1,630 1,515
Operating income 2,211 2,079 1,266 1,301 81
Realized capital gains and losses, after-tax 514 511 490 158 145
Net income 2,760 2,670 1,725 1,608 312
Operating ratios
Claims and claims expense ratio 70.4 71.7 78.9 78.1 88.0
Expense ratio 22.8 22.3 21.6 22.3 23.3
Combined ratio 93.2 94.0 100.5 100.4 111.3
Life and Savings Operations
Premiums and contract charges $1,519 $ 1,502 $ 1,336 $ 1,368 $ 1,053
Net investment income 2,115 2,085 2,045 1,992 1,827
Operating income 392 377 368 327 226
Realized capital gains and losses, after-tax 158 123 20 10 (15)
Net income 550 497 388 337 211
Statutory premiums and deposits 5,902 4,946 5,157 4,874 4,539
Investments including Separate Accounts 41,863 37,341 33,588 31,065 26,197
For more detailed information see proxy statement.
28
8. Condensed Consolidated Income Statements
$ in millions except per share data
Year ended December 31,
Revenues 1998 1997 1996
Insurance premiums and contract charges $20,826 $20,106 $19,702
Net investment income 3,890 3,861 3,813
Realized capital gains and losses 1,163 982 784
Total revenues 25,879 24,949 24,299
Costs and Expenses
Insurance claims and contract benefits 16,016 15,751 16,800
Costs and expenses 5,205 4,826 4,699
Total costs and expenses 21,221 20,577 21,499
Gain (loss) on disposition of operations 87 62 (131)
Income from operations before income
tax expense, dividends on preferred
securities, and equity in net income of
unconsolidated subsidiary 4,745 4,434 2,669
Income tax expense 1,422 1,324 619
Income before dividends on preferred
securities and equity in net income of
unconsolidated subsidiary 3,323 3,110 2,050
Dividends on preferred securities
of subsidiary trusts (39) (39) (4)
Equity in net income of unconsolidated subsidiary 10 34 29
Net income $ 3,294 $ 3,105 $ 2,075
Earnings per share–diluted $ 3.94 $ 3.56 $ 2.31
For more detailed information see proxy statement.
Allstate has produced record net income for four
consecutive years. By increasing sales of core insurance
products, controlling the cost of claims and taking
advantage of investment opportunities, Allstate
increased net income to $3.3 billion in 1998.
29
9. Condensed Consolidated Balance Sheets
$ in millions
December 31,
Assets 1998 1997
Investments $66,525 $62,548
Premium installment receivables, net 3,082 2,959
Deferred policy acquisition costs 3,096 2,826
Reinsurance recoverables, net 1,932 2,048
Accrued investment income 751 711
Property and equipment, net 803 741
Cash 258 220
Other assets 1,146 1,283
Separate Accounts 10,098 7,582
Total assets $87,691 $80,918
Liabilities
Insurance reserves $24,482 $24,485
Contractholder funds 21,133 20,389
Unearned premiums 6,425 6,233
Claim payments outstanding 778 599
Other liabilities and accrued expenses 4,578 3,193
Deferred income taxes 461 381
Debt 1,746 1,696
Separate Accounts 10,098 7,582
Total liabilities 69,701 64,558
Mandatorily redeemable preferred securities of subsidiary trusts 750 750
Total shareholders’ equity 17,240 15,610
Total liabilities and shareholders’ equity $87,691 $80,918
For more detailed information see proxy statement.
30
10. Condensed Consolidated Statements of Cash Flows
$ in millions
Year ended December 31,
Cash Flows from Operating Activities 1998 1997 1996
Net income $ 3,294 $ 3,105 $ 2,075
Adjustments to reconcile net income to net cash
provided by operating activities (403) 237 961
Net cash provided by operating activities 2,891 3,342 3,036
Cash Flows from Investing Activities
Proceeds from sales 19,356 16,725 14,837
Investment collections 7,140 7,197 4,927
Investment purchases (26,744) (25,752) (22,647)
Change in short-term investments, net (610) 427 (764)
Change in other investments, net (95) (105) 12
Acquisition of subsidiary (275) – –
Proceeds from disposition of operations 49 138 378
Purchases of property and equipment, net (188) (150) (126)
Net cash used in investing activities (1,367) (1,520) (3,383)
Cash Flows from Financing Activities
Net cash provided by (used in)
financing activities (1,486) (1,718) 373
Net Increase in Cash 38 104 26
Cash at Beginning of Year 220 116 90
Cash at End of Year $ 258 $ 220 $ 116
For more detailed information see proxy statement.
Allstate is in the strongest financial position in its
history. With assets increasing to $88 billion, share-
holders’ equity of $17 billion and positive cash flows
from operations, Allstate is well positioned to execute
its strategies and grow the business.
31
11. Consolidated Financial Highlights for the Year
Allstate is engaged in the property-liability
insurance and life and savings businesses,
principally in the United States, Canada
and Germany. Allstate’s largest business is
the sale of private passenger auto and
homeowners insurance through its exclusive
agency force. The company’s other major
business is the sale of life insurance and
savings products, including annuity and
group pension products.
Revenues increased to $25.9 billion Consolidated revenues increased 3.7 percent or
$930 million in 1998 compared to 1997. Property-liability earned premiums
grew 3.8 percent or $703 million, accounting for most of the revenue growth dur-
ing the year. The improvement in revenues also included an increase of $29 million
in investment income and a $181 million increase in realized capital gains.
Revenues Operating Income
$ in billions $ in millions
1,600 2,429 2,573
Realized Capital Gains
Investment Income
Premiums
24.3 24.9 25.9
96 97 98 96 97 98
32
12. Operating income rose 5.9 percent Consolidated operating income rose to $2.6 bil-
lion for 1998, a 5.9 percent increase over 1997 and the fourth consecutive year
the company has posted record operating earnings. 1998’s performance was driven
by strong property-liability results despite the effects of increased catastrophes dur-
ing the year. Catastrophe losses for the year were $507 million after-tax versus an
unusually low $237 million after-tax in 1997.
Net income increased to $3.3 billion Consolidated net income increased 6.1 percent
to $3.3 billion or $3.94 per share on a diluted basis. The record income reflected
strong operating results in the property-liability business, which benefited from
growth in sales and favorable auto loss trends. The increase in net income also
reflected higher realized capital gains during the year.
Investments grew to $66.5 billion Consolidated investments for the company increased
6.4 percent or $4.0 billion during 1998, reflecting overall growth in the company.
Investment income for the year was up only slightly as increases in income due to the
growth of the portfolio were offset by a decline in the overall portfolio yield and the
impact of our ongoing share repurchase program. A decline in the average portfolio
yield occurs as new and reinvested funds are invested at rates that are lower than the
overall portfolio yield. Realized capital gains after-tax increased 8.8 percent over
1997, benefiting from the sale of the company’s real estate portfolio during the year.
1998 Investments
Net Income
$ in billions
$ in millions
Operating Income Fixed Income Securities Short-term
Realized Capital Gains Equities Other
Other Mortgage Loans
2,075 3,105 3,294
$.6
$2.5
$3.4
$6.4
$53.6
96 97 98
33
13. Property-Liability Highlights for the Year
Allstate’s property-liability business is
principally engaged in the sale of private
passenger auto and homeowners insurance
sold primarily through the company’s ex-
clusive agency force. Allstate is the second
largest personal property and casualty
insurer in the United States.
Premiums written grew 3.9 percent Property-liability premiums written were $19.5
billion in 1998, an increase of $726 million from 1997. Premiums written in our
core lines of standard auto, non-standard auto and homeowners increased 2.6 per-
cent, 6.0 percent and 7.8 percent respectively. The growth in the standard and non-
standard auto lines was attributable to increased renewals on existing policies and
higher average premiums. The increase in the homeowners business benefited from
growth in new business as well as higher average premiums.
Underwriting income increased 16.1 percent Property-liability underwriting income
was $1.3 billion in 1998, an increase of $181 million from 1997. The improve-
ment in the underlying results of the company was due to an increase in premiums
Premiums Written by Line Operating Ratios Underwriting Income (Loss)
$ in billions $ in millions
(85) 1,123 1,304
Standard Auto Other Expense Ratio
Non-standard Auto Claims and
Homeowners Claims Expense Ratio
18.6 18.8 19.5 100.5 94.0 93.2
96 97 98 96 97 98 96 97 98
34
14. earned and favorable auto loss trends. The combined ratio improved to 93.2 from
94.0 in the prior year despite a significant increase in catastrophes during the year.
Investments were $33.7 billion Property-liability investments increased $1.5 billion
or 4.5 percent in 1998. Investment income decreased slightly during the year as
income earned due to the increase in investments was offset by lower investment
yields and the effects of dividends paid to The Allstate Corporation. This decrease
was also heavily influenced by interest rates, which were at a 30-year low. Almost
80 percent of the portfolio is invested in fixed income securities, of which 93 per-
cent are rated investment grade. Realized capital gains after-tax increased slightly
during the year benefiting from the impact of the sale of real estate. The volatility
in the stock market during 1998 resulted in lower capital gains realized on common
stock compared to 1997.
Outlook The property-liability industry operates in a fiercely competitive environment.
Recent trends toward safer cars, declining medical cost inflation and lower interest
rates have resulted in decreasing premium levels in recent history. The personal lines
industry is growing at a 3 to 4 percent rate and our goal is to continue to outperform
the industry and our competitors. To grow our top line we must increase sales of
our core auto and homeowners lines through our exclusive agency force and also
through new channels such as independent agents. We must also retain our current
customers by providing them with the best customer experience in the industry. To
do this the company has realigned processes and expanded services, such as expanded
agency hours, targeted marketing programs and increased contact with key cus-
tomers. Although future medical and other claim costs may experience inflationary
pressure, our claim settlement processes have been redesigned to give Allstate a
competitive advantage in controlling these costs.
Catastrophe Losses (Pretax) 1998 Property-Liability Investments
$ in millions $ in billions
991 365 780 Fixed Income Securities– Fixed Income Securities–
Tax Exempt Taxable
Equities Other
$1.4
$5.8
$17.6
$8.9
96 97 98
35
15. Life and Savings Highlights for the Year
Allstate Life markets a broad line of life
insurance and savings products through a
diverse distribution network. Life insurance
and savings products are distributed
through Allstate agents, banks, brokers,
independent life insurance agents and direct
response marketing.
Statutory premiums increased 19.3 percent Life and Savings statutory premiums and
deposits were $5.9 billion, an increase of $956 million from 1997. The improvement
in statutory premiums, which include all premiums and deposits on life and annuity
products, was attributable to increased sales of group pension products and variable
annuities. Sales of variable annuity products increased 15.6 percent over 1997 as
variable products tend to be more attractive to consumers than fixed rate products
in low interest rate environments. Life and Savings GAAP revenues were $4.0 bil-
lion in 1998, an increase of $182 million over 1997.
Revenues Operating Income Net Income
$ in millions $ in millions $ in millions
3,412 3,777 3,959 368 377 392 388 497 550
96 97 98 96 97 98 96 97 98
36
16. Operating income grew to $392 million Life and Savings operating income was $392
million, a 4 percent increase over 1997. The increase in operating income was due
to increased fees earned on variable annuity products and improved investment
margins. Increases in operating income continue to be affected by a shift from fixed
to variable rate products in this lower interest rate environment. Operating income
is affected by this shift because at equal levels of sales, fixed products have tradition-
ally generated more operating income than variable products.
Net income up 10.7 percent Life and Savings net income increased $53 million to
$550 million. The improvement in net income was due to increased operating
earnings and after-tax realized capital gains.
Investments increased to $41.9 billion Life and Savings investments, including invest-
ments of the Separate Accounts, increased 12.1 percent or $4.5 billion. The
growth in investments was driven by a 33.2 percent increase in Separate Account
assets due to increased variable annuity sales, new sales of fixed annuity and life
products and market appreciation on fixed income securities.
Outlook The life and savings industry is experiencing increased competition due to
continued consolidation in the financial services sector. Life and Savings is well
positioned to compete in this industry with its diverse distribution network and a
wide variety of products that are designed for various interest rate environments. To
increase sales of life and variable annuity products, Life and Savings will continue
to expand through the bank and broker distribution channels and by leveraging the
Allstate agent distribution network and the Allstate brand name.
1998 Life and Savings Investments Investments Including
Separate Accounts $ in billions
$ in billions
Fixed Income Securities Equities 33.6 37.3 41.9
Mortgage Loans Other
$.7
$1.3
$3.3
$26.5
96 97 98
37
17. The Allstate Corporation Board of Directors
James G. Andress Warren L. Batts Edward A. Brennan
Chief Executive Officer Retired Chairman and Retired Chairman, President
Warner Chilcott PLC Chief Executive Officer and Chief Executive Officer
Tupperware Corporation Sears, Roebuck and Co.
James M. Denny Ronald T. LeMay Edward M. Liddy
Managing Director President and Chairman, President and
William Blair Capital Partners, L.L.C. Chief Operating Officer Chief Executive Officer
Sprint Corporation Allstate Insurance Company
H. John Riley Jr.
Michael A. Miles Joshua I. Smith
Chairman, President and
Special Limited Partner Chairman and
Chief Executive Officer
Forstmann Little & Co. Chief Executive Officer
Cooper Industries Inc. The MAXIMA Corporation
38
18. The Allstate Insurance Company Senior Management Team
Seated, left to right: Standing, left to right: Steven L. Groot
Edward M. Liddy Rita P. Wilson President
Chairman, President and President Allstate International
Chief Executive Officer Allstate Indemnity Company and
Deerbrook Insurance Company Michael J. McCabe
Ronald D. McNeil Senior Vice President
Senior Vice President Louis G. Lower, II Marketing and Brand
Product Operations Chairman Development
Allstate Life Insurance Company
Richard I. Cohen Joan M. Crockett
Senior Vice President Frank W. Pollard Senior Vice President
Property-Casualty Claim Service Senior Vice President and Chief Human Resources
Organization Information Officer
Robert W. Gary
Thomas J. Wilson Casey J. Sylla President
President Senior Vice President and Chief Property and Casualty
Allstate Life Insurance Company Investment Officer
Robert W. Pike
Edward J. Dixon Executive Vice President,
Senior Vice President Secretary and
Field Operations General Counsel
39
19. Shareholder Information
Corporate Headquarters/Home Office Transfer Agent/Shareholder Records
The Allstate Corporation For information or assistance regarding individual
2775 Sanders Road stock records, dividend reinvestment plan and
Northbrook, IL 60062-6127 voluntary cash payments, dividend checks,
(847) 402-5000 1099DIV and 1099B tax forms, direct deposit
http://www.allstate.com of dividend payments, or stock certificates, please
call (800) 355-5191 within the United States
or (201) 324-0313 outside the United States,
Annual Meeting
All shareholders are cordially invited to attend the or write:
annual meeting of The Allstate Corporation: First Chicago Trust Company,
Tuesday s May 18, 1999 s 1:30 p.m. a division of EquiServe
Chicago Botanic Garden P.O. Box 2500
1000 Lake Cook Road Jersey City, NJ 07303-2500
Glencoe, IL Internet: http://www.equiserve.com
Holders of common stock of record at the close of E-mail: fctc_Allstate@em.fcnbd.com
business on March 19, 1999, are entitled to vote at
the meeting. A notice of meeting, proxy statement Please use the following address for items sent
and proxy were mailed to shareholders with this by courier or overnight mail:
annual report. First Chicago Trust Company,
a division of EquiServe
Attention Stock Transfer Unit
525 Washington Boulevard
Jersey City, NJ 07310
The DirectSERVICE Investment Program
Shareholders can reinvest their Allstate cash
dividends as well as make optional cash deposits to
purchase additional shares of Allstate common
stock. Please write or call First Chicago Trust
Company as indicated above.
40
20. Common Stock and Dividend Information* Form 10-K, Other Reports
Shareholders may receive, without charge, a copy of
Dividends
High Low Close declared The Allstate Corporation’s Form 10-K annual report
1998 (filed with the Securities and Exchange Commission)
First quarter 49 3⁄16 4015⁄16 45 31⁄32 .135 and other public financial information, for the year
Second quarter 50 1⁄8 44 1⁄8 45 25⁄32 .135 ended Dec. 31, 1998, by contacting:
Third quarter 52 3⁄8 36 1⁄16 41 1⁄2 .135 Investor Relations
Fourth quarter 48 3⁄8 37 38 1⁄2 .135 The Allstate Corporation
3075 Sanders Road
1997
Northbrook, IL 60062-7127
Design: Meta-4 Incorporated/Chicago Feature Photography: Andy Goodwin Archive Photos: Customers Printing: Anderson Lithograph Printed on recycled paper
First quarter 34 1⁄8 28 1⁄8 29 11⁄16 .12
(800) 416-8803
Second quarter 38 1⁄2 29 5⁄16 36 1⁄2 .12
Third quarter 40 9⁄16 35 15⁄32 40 3⁄16 .12
Annual Report Recordings
Fourth quarter 47 3⁄16 38 15⁄32 45 1⁄4 .12
Audio cassette tapes of the Allstate annual report are
Stock price ranges are from the New York Stock Exchange Composite Listing.
available to the visually impaired, without charge, by
At February 18, 1999, there were 184,332 shareholders of record.
calling (800) 416-8803.
*Restated for the effects of the 2-for-1 stock split paid on July 1, 1998.
Investor Inquiries Stock Exchange Listing
Investor Relations The Allstate Corporation’s common stock is listed
The Allstate Corporation on the New York Stock Exchange under the trading
3075 Sanders Road symbol ALL. Common stock is also listed on the
Northbrook, IL 60062-7127 Chicago Stock Exchange.
(800) 416-8803
Independent Auditors
Deloitte & Touche LLP
Media Inquiries
Allstate Media Relations Two Prudential Plaza
2775 Sanders Road 180 North Stetson Avenue
Northbrook, IL 60062-6127 Chicago, IL 60601-6779
(847) 402-5600