1. For Immediate Release
Allstate Reports 2003 Second Quarter Net Income of $588 Million,
75% Increase in Net Income EPS,
33% Increase in Operating Income EPS
NORTHBROOK, Ill., July 16, 2003 – The Allstate Corporation (NYSE: ALL) today reported for the second
quarter of 2003:
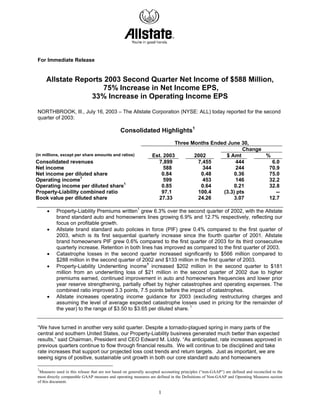
Consolidated Highlights1
Three Months Ended June 30,
Change
(in millions, except per share amounts and ratios) Est. 2003 2002 $ Amt %
Consolidated revenues 7,899 7,455 444 6.0
Net income 588 344 244 70.9
Net income per diluted share 0.84 0.48 0.36 75.0
Operating income1 599 453 146 32.2
Operating income per diluted share1 0.85 0.64 0.21 32.8
Property-Liability combined ratio 97.1 100.4 (3.3) pts --
Book value per diluted share 27.33 24.26 3.07 12.7
Property-Liability Premiums written1 grew 6.3% over the second quarter of 2002, with the Allstate
•
brand standard auto and homeowners lines growing 6.9% and 12.7% respectively, reflecting our
focus on profitable growth.
• Allstate brand standard auto policies in force (PIF) grew 0.4% compared to the first quarter of
2003, which is its first sequential quarterly increase since the fourth quarter of 2001. Allstate
brand homeowners PIF grew 0.6% compared to the first quarter of 2003 for its third consecutive
quarterly increase. Retention in both lines has improved as compared to the first quarter of 2003.
• Catastrophe losses in the second quarter increased significantly to $566 million compared to
$288 million in the second quarter of 2002 and $133 million in the first quarter of 2003.
Property-Liability Underwriting income1 increased $202 million in the second quarter to $181
•
million from an underwriting loss of $21 million in the second quarter of 2002 due to higher
premiums earned, continued improvement in auto and homeowners frequencies and lower prior
year reserve strengthening, partially offset by higher catastrophes and operating expenses. The
combined ratio improved 3.3 points, 7.5 points before the impact of catastrophes.
• Allstate increases operating income guidance for 2003 (excluding restructuring charges and
assuming the level of average expected catastrophe losses used in pricing for the remainder of
the year) to the range of $3.50 to $3.65 per diluted share. 1
“We have turned in another very solid quarter. Despite a tornado-plagued spring in many parts of the
central and southern United States, our Property-Liability business generated much better than expected
results,” said Chairman, President and CEO Edward M. Liddy. “As anticipated, rate increases approved in
previous quarters continue to flow through financial results. We will continue to be disciplined and take
rate increases that support our projected loss cost trends and return targets. Just as important, we are
seeing signs of positive, sustainable unit growth in both our core standard auto and homeowners
1
Measures used in this release that are not based on generally accepted accounting principles (“non-GAAP”) are defined and reconciled to the
most directly comparable GAAP measure and operating measures are defined in the Definitions of Non-GAAP and Operating Measures section
of this document.
1
2. insurance lines. We remain confident that we can grow without sacrificing profitability and that our
strategy of becoming better and bigger in our core protection business and broader in our ability to
provide a range of financial services to middle America continues to be the right one.
“The policies in force growth numbers for the quarter look especially encouraging in the core lines of
standard auto and homeowners. For standard auto, 35 states showed sequential increases and 32
states showed sequential increases in homeowners. We remain on track to deliver consistent sequential
quarter over quarter increases for standard auto and homeowners by the end of the year. Retention of
current business also showed positive gains.
“Once again, excluding catastrophe losses, we experienced solid improvements in claim frequencies,
which continue to offset relatively modest severity increases.
“We received good news from California in the quarter as our new auto rating plan was approved by the
department of insurance. This particular approval has enabled us to increase our marketing efforts in the
state and we have begun writing business under the new plan.
“It is still too early to declare victory, but our Encompass business turned in good underwriting results as
compared to the second of quarter of 2002 as it works toward lowering its combined ratio. The non-
standard auto business written by Deerbrook is growing and, like Encompass, is showing good
underwriting results compared to the second quarter of 2002.
“We believe we have positive momentum developing within our agency force across the country. Several
initiatives are contributing to the agency force’s solid performance, including a new compensation
package introduced this year that was designed to better align the business objectives of the agency
force with those of the company. The formation of an agent advisory council has provided a valuable
forum for the company and our agency force to review together new initiatives to enhance the success of
the channel. New investments in marketing, advertising, training and technology support have helped
drive an increase in sales leads. These moves have enhanced the improving relationship between the
company and its agency force.
“Allstate Financial is maintaining strong levels of production and the breadth of its product offering has
contributed to good results. In particular, fixed annuity sales were higher compared to the second quarter
of 2002 and variable annuity and institutional sales showed a sequential increase from the first quarter of
2003. Allstate Financial operating income, compared to second quarter of 2002, declined 8.4% to $131
million as the business unit continues to be challenged by the current economic environment. Our
investment portfolio yield continues to decline as premiums, deposits and investment cash flows are
invested at yields that are below the current portfolio average. We have reduced crediting rates on our in-
force fixed annuities to maintain investment margins. We are also making product modifications to
achieve profit objectives on new business sold in this challenging economic environment.
“As mentioned earlier, the quarter saw a large number of tornadoes with resulting damage to properties in
many parts of the country. We are in the business of restoring people’s lives when events like this occur,
and that’s what thousands of Allstate agents and claim adjusters have been doing this quarter. That is
the essence of the Allstate promise to its customers - “You’re in Good Hands” SM - and we are proud of
the dedicated men and women who prove it day in and day out.”
2
3. Summary of Consolidated Results
Three Months Ended Six Months Ended
June 30, June 30, Discussion of Second Quarter Results
($ in millions, except per share Est. Est.
amounts) 2003 2002 2003 2002
<
Consolidated revenues $7,899 $7,455 $15,760 $14,753 Higher Premiums earned in Property-Liability and
lower realized capital losses.
<
Operating income 599 453 1,272 941 Increase in Property-Liability Underwriting income,
after-tax of $131, $12 decrease in Allstate Financial
Operating income.
<
Realized capital gains and (11) (107) (16) (171) See the Components of realized capital gains and
losses, after-tax losses (pretax) table.
<
Cumulative effect of change in -- -- -- (331) Adoption of SFAS No. 142 for goodwill impairment in
accounting principle, after-tax 2002.
<
Net income 588 344 1,253 439 Increased Operating income and lower realized capital
losses.
Net income per share (diluted) 0.84 0.48 1.78 0.62
<
Operating income per share 0.85 0.64 1.80 1.32 Compared to First Call mean estimate of $0.75, with a
(diluted) range of $0.65 to $0.82.
<
Weighted average shares 706.6 712.1 705.9 712.9 During the first six months of 2003, Allstate purchased
outstanding (diluted) 1.92 million shares of its stock for $61.68 million, or an
average cost per share of $32.09.
<
Return on equity 10.7 5.3 10.7 5.3 Higher Net income and a sequential increase over the
prior 5 quarters.
<
Operating income return on 15.4 10.7 15.4 10.7 Higher Operating income and a sequential increase
1
equity over the prior 5 quarters.
<
Book value per diluted share 27.33 24.26 27.33 24.26 At June 30, 2003 and 2002 unrealized gains and
losses on fixed income securities, after-tax, totaling
est. $2,975 and $1,512, respectively, represented
$4.21 and $2.13, respectively of book value per
diluted share.
• Book value per diluted share increased 10.4% compared to December 31, 2002.
3
4. Property-Liability Highlights
Three Months Ended Six Months Ended
June 30, June 30, Discussion of Second Quarter Results
($ in millions, except ratios) Est. Est.
2003 2002 2003 2002
<
Property-Liability $6,422 $6,042 $12,359 $11,758 See the Property-Liability Premiums written by
Premiums written market segment and the Net rate changes approved
tables.
<
Property-Liability revenues 6,594 6,117 13,038 12,205 Premiums earned up $343 or 5.9%.
<
Net investment income 417 428 825 827 Higher portfolio balances due to positive cash flows
from operations, offset by lower yields.
<
Underwriting income (loss) 181 (21) 594 22 Higher Premiums earned, continued improvement in
auto and homeowners frequencies and lower prior
year reserve strengthening, partially offset by higher
catastrophes and higher operating expenses.
<
Operating income 496 335 1,114 709 Underwriting income after-tax up $131.
<
Realized capital gains and 23 (68) 50 (80) See the Components of realized capital gains and
losses, after-tax losses (pretax) table.
<
Cumulative effect of -- -- -- (48) Adoption of SFAS No. 142 for goodwill impairment
change in accounting in 2002.
principle, after-tax
<
Net income 521 267 1,166 586 Higher Operating income and higher realized capital
gains.
<
Catastrophe losses 566 288 699 398 Higher than prior year due to a higher number of
catastrophic events.
Ratios:
<
Combined ratio before 87.9 95.4 89.3 96.3 See the Effect of prior year reserve reestimates on
impact of catastrophes the combined ratio table.
Impact of catastrophes 9.2 5.0 5.8 3.5
<
Combined ratio 97.1 100.4 95.1 99.8 Includes the Allstate Protection Combined ratio of
96.2 compared to 100.3 in the second quarter of
2002.
• Allstate brand standard auto and homeowners PIF increased 0.4% and 0.6%, respectively, from
March 31, 2003 levels, driving the first sequential quarterly increase in standard auto PIF since the
fourth quarter of 2001 and the third consecutive quarterly increase in homeowners PIF.
For Allstate brand standard auto, 35 states representing 74.1% of the PIF had positive sequential
growth compared to March 31, 2003 levels. The state of Texas had positive sequential growth and
the state of California showed a slowing rate of decline, while the state of Florida continued to decline
during the quarter.
For Allstate brand homeowners, 32 states representing 83.3% of the PIF had positive sequential
growth compared to March 31, 2003. The states of Texas, California and Florida each had positive
sequential growth during the quarter.
• Allstate brand has achieved targeted profitability in most states and plans to increase marketing and
advertising expenditures, invest in agency productivity such as new sales and retention, while
4
5. continuing the implementation of strategic risk management practices which are proving to be
working quite well.
• Operating expenses increased as a result of pension expenses, employee and agent incentives and
guarantee fund expenses.
• Operating income reflects the positive impact of a $31 million adjustment for prior year tax liabilities.
Allstate Financial Highlights
Three Months Ended Six Months Ended
June 30, June 30, Discussion of Second Quarter Results
($ in millions) Est. Est.
2003 2002 2003 2002
1
<
Premiums and deposits $3,296 $3,325 $5,792 $6,115 Continued strong fixed annuity sales more than
offset by lower sales of institutional products and
variable annuities. See the Allstate Financial
Premiums and deposits table.
<
Allstate Financial 1,291 1,321 2,693 2,515 Higher Net investment income more than offset by
Revenues lower Premiums and contract charges.
<
Operating income 131 143 213 286 Lower mortality and investment margins.
<
Realized capital gains and (33) (37) (65) (89) See the components of realized capital gains and
losses, after-tax losses (pretax) table.
<
Cumulative effect of -- -- -- (283) Adoption of SFAS No. 142 for goodwill
change in accounting impairment in 2002.
principle, after-tax
<
Net income 98 106 148 (86) Lower Operating income
• Premiums and deposits for the second quarter of 2003 increased 32.1% over the first quarter of 2003
due to stronger sales of fixed and variable annuities and institutional products, and were comparable
to the prior year second quarter. The continued roll-out of the new Allstate Advisor variable annuity
and the rebound in equity markets in the second quarter of 2003 have contributed to six months of
increased variable annuity sales.
• Net cash payments for Allstate Financial’s variable annuity guaranteed minimum death benefits
(GMDB) were $27 million for the second quarter of 2003, net of reinsurance, hedging gains and
losses, and other contractual arrangements. This is $18 million above payments made in the second
quarter of 2002, and $6 million above the first quarter of 2003 payments. The increase in the second
quarter of 2003 reflects the cost of hedging this exposure in a rising equity market, while net
payments in prior periods were benefited by hedging.
GMDB values in excess of contractholders’ account values, payable if all contractholders were to
have died at June 30, 2003, were estimated to be $3.33 billion net of reinsurance, compared to $4.24
billion at March 31, 2003 and $4.07 billion at December 31, 2002.
• The weighted average interest crediting rate on fixed annuity and interest-sensitive life products in
force, excluding market value adjusted annuities, was approximately 100 basis points more than the
underlying long term guaranteed rates on these products.
5
6. THE ALLSTATE CORPORATION
CONSOLIDATED STATEMENTS OF OPERATIONS
Three Months Ended Six Months Ended
June 30, June 30,
Est. Percent Est. Percent
($ in millions, except per share data) 2003 2002 Change 2003 2002 Change
Revenues
Property-liability insurance premiums $ 6,146 $ 5,803 5.9 $ 12,145 $ 11,507 5.5
Life and annuity premiums
and contract charges 533 582 (8.4) 1,172 1,120 4.6
Net investment income 1,231 1,223 0.7 2,456 2,382 3.1
Realized capital gains and losses (11) (153) (92.8) (13) (256) (94.9)
Total revenues 7,899 7,455 6.0 15,760 14,753 6.8
Costs and expenses
Property-liability insurance
claims and claims expense 4,527 4,493 0.8 8,678 8,862 (2.1)
Life and annuity contract benefits 426 449 (5.1) 956 825 15.9
Interest credited to contractholder funds 460 423 8.7 913 852 7.2
Amortization of deferred policy
acquisition costs 961 926 3.8 1,974 1,811 9.0
Operating costs and expenses 728 658 10.6 1,481 1,298 14.1
Restructuring and related charges 14 35 (60.0) 37 55 (32.7)
Interest expense 67 68 (1.5) 134 137 (2.2)
Total costs and expenses 7,183 7,052 1.9 14,173 13,840 2.4
Gain on disposition of operations 3 - - 3 7 (57.1)
Income from operations before income
tax expense, dividends on preferred
securities and cumulative effect of change
in accounting principle, after tax 719 403 78.4 1,590 920 72.8
Income tax expense 129 57 126.3 332 145 129.0
Income before dividends on preferred
securities and cumulative effect of change
in accounting principle, after tax 590 346 70.5 1,258 775 62.3
Dividends on preferred securities
of subsidiary trust (2) (2) - (5) (5) -
Cumulative effect of change in accounting
principle, after tax - - - - (331) (100.0)
Net income $ 588 $ 344 70.9 $ 1,253 $ 439 185.4
Net income per share - Basic $ 0.83 $ 0.48 $ 1.78 $ 0.62
Weighted average shares - Basic 704.0 708.7 703.7 710.2
Net income per share - Diluted $ 0.84 $ 0.48 $ 1.78 $ 0.62
Weighted average shares - Diluted 706.6 712.1 705.9 712.9
6
7. THE ALLSTATE CORPORATION
CONTRIBUTION TO INCOME
Three Months Ended Six Months Ended
June 30, June 30,
Est. Percent Est. Percent
($ in millions, except per share data) 2003 2002 Change 2003 2002 Change
Contribution to income
Operating income before the impact of
restructuring and related charges $ 608 $ 476 27.7 $ 1,296 $ 977 32.7
Restructuring and related charges,
after-tax 9 23 (60.9) 24 36 (33.3)
Operating income 599 453 32.2 1,272 941 35.2
Realized capital gains and losses (11) (107) (89.7) (16) (171) (90.6)
Gain on disposition of operations 2 - - 2 5 (60.0)
Dividends on preferred securities
of subsidiary trust (2) (2) - (5) (5) -
Cumulative effect of change in
accounting principle - - - - (331) (100.0)
Net income $ 588 $ 344 70.9 $ 1,253 $ 439 185.4
Income per share (Diluted)
Operating income before the impact of
restructuring and related charges $ 0.85 $ 0.67 26.9 $ 1.83 $ 1.37 33.6
Restructuring and related charges,
after-tax - 0.03 (100.0) 0.03 0.05 (40.0)
Operating income 0.85 0.64 32.8 1.80 1.32 36.4
Realized capital gains and losses (0.01) (0.15) (93.3) (0.02) (0.24) (91.7)
Gain on disposition of operations - - - - 0.01 (100.0)
Dividends on preferred securities
of subsidiary trust - (0.01) (100.0) - (0.01) (100.0)
Cumulative effect of change in
accounting principle - - - - (0.46) (100.0)
Net income $ 0.84 $ 0.48 75.0 $ 1.78 $ 0.62 187.1
Book value per share - Diluted $ 27.33 $ 24.26 12.7 $ 27.33 $ 24.26 12.7
7
8. THE ALLSTATE CORPORATION
COMPONENTS OF REALIZED CAPITAL GAINS AND LOSSES (PRETAX)
Three Months Ended June 30, 2003 (Est.)
($ in millions) Property- Allstate Corporate
Liability Financial and Other Total
Valuation of derivative instruments $ 11 $ (17) $ - $ (6)
Settlements of derivative instruments - (4) - (4)
Sales 68 41 (1) 108
Investment write-downs (48) (61) - (109)
Total $ 31 $ (41) $ (1) $ (11)
Six Months Ended June 30, 2003 (Est.)
($ in millions) Property- Allstate Corporate
Liability Financial and Other Total
Valuation of derivative instruments $ 5 $ (22) $ - $ (17)
Settlements of derivative instruments 8 (2) - 6
Sales 128 64 (1) 191
Investment write-downs (73) (120) - (193)
Total $ 68 $ (80) $ (1) $ (13)
Three Months Ended June 30, 2002
($ in millions) Property- Allstate Corporate
Liability Financial and Other Total
Valuation of derivative instruments $ (10) $ (4) $ - $ (14)
Settlements of derivative instruments (60) 2 - (58)
Sales (17) (3) - (20)
Investment write-downs (27) (32) (2) (61)
Total $ (114) $ (37) $ (2) $ (153)
Six Months Ended June 30, 2002
($ in millions) Property- Allstate Corporate
Liability Financial and Other Total
Valuation of derivative instruments $ (24) $ (26) $ - $ (50)
Settlements of derivative instruments (66) 3 - (63)
Sales 6 (43) (1) (38)
Investment write-downs (45) (58) (2) (105)
Total $ (129) $ (124) $ (3) $ (256)
8
9. THE ALLSTATE CORPORATION
SEGMENT RESULTS
Three Months Ended Six Months Ended
June 30, June 30,
($ in millions) Est. Est.
2003 2002 2003 2002
Property-Liability
Premiums written $ 6,422 $ 6,042 $ 12,359 $ 11,758
Premiums earned $ 6,146 $ 5,803 $ 12,145 $ 11,507
Claims and claims expense 4,527 4,493 8,678 8,862
Amortization of deferred policy acquisition costs 858 802 1,685 1,585
Operating costs and expenses 566 495 1,151 984
Restructuring and related charges 14 34 37 54
Underwriting income (loss) 181 (21) 594 22
Net investment income 417 428 825 827
Income tax expense on operations 102 72 305 140
Operating income 496 335 1,114 709
Realized capital gains and losses, after-tax 23 (68) 50 (80)
Gain on disposition of operations, after-tax 2 - 2 5
Cumulative effect of change in accounting principle, after-tax - - - (48)
Net income $ 521 $ 267 $ 1,166 $ 586
Catastrophe losses $ 566 $ 288 $ 699 $ 398
Operating ratios
Claims and claims expense ratio 73.7 77.4 71.4 77.0
Expense ratio 23.4 23.0 23.7 22.8
Combined ratio 97.1 100.4 95.1 99.8
Effect of catastrophe losses on combined ratio 9.2 5.0 5.8 3.5
Effect of restructuring and related charges on combined ratio 0.2 0.6 0.3 0.5
Effect of Discontinued Lines and Coverages on combined ratio 0.9 0.1 0.7 0.1
Allstate Financial
Premiums and deposits $ 3,296 $ 3,325 $ 5,792 $ 6,115
Investments including
Separate Accounts assets $ 73,336 $ 64,427 $ 73,336 $ 64,427
Premiums and contract charges $ 533 $ 582 $ 1,172 $ 1,120
Net investment income 799 776 1,601 1,519
Contract benefits 426 449 956 825
Interest credited to contractholder funds 460 423 913 852
Amortization of deferred policy acquisition costs 92 114 264 222
Operating costs and expenses 161 163 329 313
Restructuring and related charges - 1 - 1
Income tax expense on operations 62 65 98 140
Operating income 131 143 213 286
Realized capital gains and losses, after-tax (33) (37) (65) (89)
Cumulative effect of change in accounting principle, after-tax - - - (283)
Net income (loss) $ 98 $ 106 $ 148 $ (86)
Corporate and Other
Net investment income $ 15 $ 19 $ 30 $ 36
Operating costs and expenses 68 69 135 139
Income tax benefit on operations (25) (25) (50) (49)
Operating loss (28) (25) (55) (54)
Realized capital gains and losses, after-tax (1) (2) (1) (2)
Dividends on preferred securities
of subsidiary trust (2) (2) (5) (5)
Net loss $ (31) $ (29) $ (61) $ (61)
Consolidated net income $ 588 $ 344 $ 1,253 $ 439
9
10. THE ALLSTATE CORPORATION
UNDERWRITING RESULTS BY AREA OF BUSINESS
Three Months Ended Six Months Ended
June 30, June 30,
Est. Percent Est. Percent
($ in millions) 2003 2002 Change 2003 2002 Change
Consolidated Underwriting Summary
Allstate Protection $ 234 $ (15) - $ 685 $ 32 -
Discontinued Lines and Coverages (53) (6) - (91) (10) -
Underwriting income (loss) $ 181 $ (21) - $ 594 $ 22 -
Allstate Protection Underwriting Summary
Premiums written $ 6,415 $ 6,040 6.2 $ 12,351 $ 11,753 5.1
Premiums earned $ 6,139 $ 5,800 5.8 $ 12,136 $ 11,501 5.5
Claims and claims expense 4,469 4,484 (0.3) 8,582 8,850 (3.0)
Amortization of deferred policy acquisition costs 858 802 7.0 1,685 1,585 6.3
Other costs and expenses 564 495 13.9 1,147 980 17.0
Restructuring and related charges 14 34 (58.8) 37 54 (31.5)
Underwriting income (loss) $ 234 $ (15) - $ 685 $ 32 -
Catastrophe losses $ 566 $ 288 96.5 $ 699 $ 398 75.6
Operating ratios
Claims and claims expense ratio 72.8 77.3 70.7 76.9
Expense ratio 23.4 23.0 23.7 22.8
Combined ratio 96.2 100.3 94.4 99.7
Effect of catastrophe losses
on combined ratio 9.2 5.0 5.8 3.5
Effect of restructuring and related
charges on combined ratio 0.2 0.6 0.3 0.5
Discontinued Lines and Coverages
Underwriting Summary
Premiums written $ 7 $ 2 - $ 8 $ 5 60.0
Premiums earned $ 7 $ 3 133.3 $ 9 $ 6 50.0
Claims and claims expense 58 9 - 96 12 -
Other costs and expenses 2 - - 4 4 -
Underwriting loss $ (53) $ (6) - $ (91) $ (10) -
Note: *Second quarter 2003 Discontinued Lines and Coverages Premiums written were positively impacted by a $4 million favorable reinsurance
settlement.
*Claims and claims expense for the Discontinued Lines and Coverages segment was negatively impacted by a $38 million prior year asbestos
reserve strengthening. This strengthening is to reserve the policy limits for a policyholder that is a Wellington Agreement participant, although
Allstate is not a signatory of the Wellington Agreement. The policyholder submitted new and unanticipated claims which were for previously
not designated, and therefore unexpected, coverage years.
*Claims and claims expense for the Discontinued Lines and Coverages segment was also impacted by a $12 million strengthening of an
allowance for uncollectible reinsurance recoverables.
10
11. THE ALLSTATE CORPORATION
PROPERTY-LIABILITY PREMIUMS WRITTEN BY MARKET SEGMENT
Three Months Ended Six Months Ended
June 30, June 30,
Est. Percent Est. Percent
($ in millions) 2003 2002 Change 2003 2002 Change
ALLSTATE BRAND
Standard auto $ 3,357 $ 3,141 6.9 $ 6,701 $ 6,336 5.8
Non-standard auto 498 602 (17.3) 1,029 1,229 (16.3)
Involuntary auto 69 47 46.8 119 97 22.7
Commercial lines 223 201 10.9 429 389 10.3
Homeowners 1,365 1,211 12.7 2,407 2,153 11.8
Other personal lines 357 334 6.9 655 612 7.0
5,869 5,536 6.0 11,340 10,816 4.8
IVANTAGE
Standard auto 325 319 1.9 610 605 0.8
Non-standard auto 45 25 80.0 86 44 95.5
Involuntary auto 11 2 - 20 2 -
Homeowners 138 132 4.5 248 240 3.3
Other personal lines 27 26 3.8 47 46 2.2
546 504 8.3 1,011 937 7.9
ALLSTATE PROTECTION 6,415 6,040 6.2 12,351 11,753 5.1
DISCONTINUED LINES
AND COVERAGES 7 2 - 8 5 60.0
PROPERTY-LIABILITY $ 6,422 $ 6,042 6.3 $ 12,359 $ 11,758 5.1
11
12. THE ALLSTATE CORPORATION
PROPERTY-LIABILITY NET RATE CHANGES APPROVED
Three Months Ended Six Months Ended
June 30, 2003 June 30, 2003
# of Weighted Average # of Weighted Average
States Rate Change (%) States Rate Change (%)
ALLSTATE BRAND
Standard auto 4 0.6 21 6.9
Non-standard auto - - 6 4.7
Homeowners 1 9.9 13 8.7
IVANTAGE
Standard auto (Encompass) 11 11.5 31 8.1
Non-standard auto (Deerbrook) 4 7.1 7 10.4
Homeowners (Encompass) 8 13.4 29 13.5
Note: Rate increases that are indicated based on a loss trend analysis to achieve a targeted return
will continue to be pursued in all locations and for all products
12
13. THE ALLSTATE CORPORATION
ALLSTATE PROTECTION MARKET SEGMENT ANALYSIS
Three Months Ended June 30,
($ in millions) Est. 2003 2002 Est. 2003 2002 Est. 2003 2002 Est. 2003 2002
Loss Ratio
Excluding the Effect
Premiums Earned Loss Ratio of Catastrophe Losses Expense Ratio
ALLSTATE BRAND
Standard auto $ 3,328 $ 3,151 74.1 75.4 69.7 74.0
Non-standard auto 534 620 71.9 75.6 70.0 75.2
Homeowners 1,207 1,041 68.8 86.2 42.3 69.5
Other 579 530 71.7 68.5 62.5 62.8
Total Allstate brand 5,648 5,342 72.5 76.8 63.2 72.1 22.9 22.1
IVANTAGE
Standard auto 299 298 73.9 76.5 72.2 74.2
Non-standard auto 40 18 82.5 116.7 82.5 116.7
Homeowners 122 116 85.2 102.6 59.8 77.6
Other 30 26 53.3 46.2 46.7 38.5
Total Ivantage 491 458 76.2 83.0 68.4 74.7 29.3 33.2
ALLSTATE PROTECTION $ 6,139 $ 5,800 72.8 77.3 63.6 72.3 23.4 23.0
Six Months Ended June 30,
($ in millions) Est. 2003 2002 Est. 2003 2002 Est. 2003 2002 Est. 2003 2002
Loss Ratio
Excluding the Effect
Premiums Earned Loss Ratio of Catastrophe Losses Expense Ratio
ALLSTATE BRAND
Standard auto $ 6,568 $ 6,245 72.8 74.9 70.6 73.9
Non-standard auto 1,082 1,245 73.6 75.6 72.6 75.3
Homeowners 2,381 2,048 62.8 85.6 44.9 73.0
Other 1,135 1,052 69.9 72.7 64.0 69.5
Total Allstate brand 11,166 10,590 70.5 76.8 64.7 73.5 23.1 22.0
IVANTAGE
Standard auto 595 598 73.8 76.8 72.9 75.8
Non-standard auto 76 31 82.9 106.5 82.9 106.5
Homeowners 243 232 74.9 91.8 57.6 76.3
Other 56 50 53.6 18.0 48.2 14.0
Total Ivantage 970 911 73.6 78.4 68.5 73.5 29.9 32.3
ALLSTATE PROTECTION $ 12,136 $ 11,501 70.7 76.9 64.9 73.4 23.7 22.8
Note: Other includes involuntary auto, commercial lines and other personal lines.
13
14. THE ALLSTATE CORPORATION
PROPERTY-LIABILITY
EFFECT OF PRETAX PRIOR YEAR RESERVE REESTIMATES ON THE COMBINED RATIO
Three Months Ended June 30,
Effect of Pretax Reserve
Reestimates on the
Pretax Reserve Reestimates Combined Ratio
Est. Est.
($ in millions) 2003 2002 2003 Change
Auto $ (6) $ 9 (0.1) (0.3)
Homeowners 1 83 - (1.4)
Other (4) 9 - (0.2)
Allstate Protection (9) 101 (0.1) (1.9)
Discontinued Lines and Coverages 57 7 0.9 0.8
Property-Liability $ 48 $ 108 0.8 (1.1)
Allstate Brand $ (27) $ 101 (0.4) (2.2)
Ivantage 18 - 0.3 0.3
Allstate Protection $ (9) $ 101 (0.1) (1.9)
Six Months Ended June 30,
Effect of Pretax Reserve
Reestimates on the
Pretax Reserve Reestimates Combined Ratio
Est. Est.
($ in millions) 2003 2002 2003 Change
Auto $ (38) $ 87 (0.3) (1.1)
Homeowners 15 233 0.1 (1.9)
Other 21 29 0.2 -
Allstate Protection (2) 349 - (3.0)
Discontinued Lines and Coverages 95 12 0.8 0.7
Property-Liability $ 93 $ 361 0.8 (2.3)
Allstate Brand $ (26) $ 349 (0.2) (3.2)
Ivantage 24 - 0.2 0.2
Allstate Protection $ (2) $ 349 - (3.0)
Note: Mold claims in the state of Texas during the second quarter of 2003 were insignificant
14
15. THE ALLSTATE CORPORATION
ALLSTATE FINANCIAL PREMIUMS AND DEPOSITS
Three Months Ended Six Months Ended
June 30, June 30,
Est. Percent Est. Percent
($ in millions) 2003 2002 Change 2003 2002 Change
Life Products
Interest-sensitive life $ 252 $ 256 (1.6) $ 495 $ 503 (1.6)
Traditional 92 101 (8.9) 179 188 (4.8)
Other 152 143 6.3 304 278 9.4
Subtotal 496 500 (0.8) 978 969 0.9
Annuities
Fixed annuities - deferred 1,354 1,131 19.7 2,280 1,775 28.5
Fixed annuities - immediate 178 169 5.3 443 353 25.5
Variable annuities 545 589 (7.5) 934 1,196 (21.9)
Subtotal 2,077 1,889 10.0 3,657 3,324 10.0
Institutional Products
Indexed funding agreements 151 76 98.7 265 175 51.4
Funding agreements backing medium-term notes 483 679 (28.9) 718 1,377 (47.9)
Other - 30 (100.0) 4 39 (89.7)
Subtotal 634 785 (19.2) 987 1,591 (38.0)
Bank Deposits 89 151 (41.1) 170 231 (26.4)
Total $ 3,296 $ 3,325 (0.9) $ 5,792 $ 6,115 (5.3)
Note: To conform to current period presentations, certain prior period balances have been reclassified.
15
16. THE ALLSTATE CORPORATION
CONSOLIDATED STATEMENTS OF FINANCIAL POSITION
June 30, Dec. 31,
(in millions, except par value data) 2003 (Est.) 2002
Assets
Investments
Fixed income securities, at fair value
(amortized cost $77,182 and $72,123) $ 83,939 $ 77,152
Equity securities, at fair value (cost $3,620 and $3,223) 4,411 3,683
Mortgage loans 6,310 6,092
Short-term 3,004 2,215
Other 1,541 1,508
Total investments 99,205 90,650
Cash 507 462
Premium installment receivables, net 4,325 4,075
Deferred policy acquisition costs 4,308 4,385
Reinsurance recoverables, net 2,931 2,883
Accrued investment income 974 946
Property and equipment, net 958 989
Goodwill 930 927
Other assets 1,093 984
Separate Accounts 11,823 11,125
Total assets $ 127,054 $ 117,426
Liabilities
Reserve for property-liability insurance
claims and claims expense $ 17,063 $ 16,690
Reserve for life-contingent contract benefits 10,979 10,256
Contractholder funds 43,358 40,751
Unearned premiums 8,834 8,578
Claim payments outstanding 666 739
Other liabilities and accrued expenses 9,927 7,150
Deferred income taxes 778 259
Short-term debt 95 279
Long-term debt 4,032 3,961
Separate Accounts 11,823 11,125
Total liabilities 107,555 99,788
Mandatorily Redeemable Preferred Securities of Subsidiary Trust 200 200
Shareholders' equity
Preferred stock, $1 par value, 25 million
shares authorized, none issued - -
Common stock, $.01 par value, 2.0 billion shares
authorized and 900 million issued, 704 million
and 702 million shares outstanding 9 9
Additional capital paid-in 2,610 2,599
Retained income 20,514 19,584
Deferred compensation expense (232) (178)
Treasury stock, at cost (196 million and 198 million shares) (6,247) (6,309)
Accumulated other comprehensive income:
Unrealized net capital gains and losses and net gains and losses on
derivative financial instruments 3,491 2,602
Unrealized foreign currency translation adjustments (26) (49)
Minimum pension liability adjustment (820) (820)
Total accumulated other comprehensive income 2,645 1,733
Total shareholders' equity 19,299 17,438
Total liabilities and shareholders' equity $ 127,054 $ 117,426
16
17. Definitions of Non-GAAP and Operating Measures
We believe that investors’ understanding of Allstate’s performance is enhanced by our disclosure of the
following non-GAAP financial measures. Our method of calculating these measures may differ from
those used by other companies and therefore comparability may be limited.
Operating income is Income before dividends on preferred securities and cumulative effect of change in
accounting principle, after-tax, excluding the effects of Realized capital gains and losses, after-tax, and
Gain on disposition of operations, after-tax. In our operating income computation, the net effect of
Realized capital gains and losses, after-tax, includes Allstate Financial’s DAC amortization and additional
future policy benefits only to the extent that they resulted from the recognition of Realized capital gains
and losses. Net income is the most directly comparable GAAP measure.
We use this measure to evaluate our results of operations and as an integral component for incentive
compensation. It reveals trends in our insurance and financial services business that may be obscured
by the net effect of Realized capital gains and losses and Gain on disposition of operations. These items
may vary significantly between periods and are generally driven by business decisions and economic
developments such as market conditions, the timing of which is unrelated to the insurance underwriting
process. Therefore, we believe it is useful for investors to evaluate these components separately and in
the aggregate when reviewing our performance. We note that the price to earnings multiple commonly
used by insurance investors as a forward-looking valuation technique uses operating income as the
denominator. Operating income should not be considered as a substitute for Net income and does not
reflect the overall profitability of our business.
The following tables reconcile Operating income and Net income for the second quarter and first six
months of 2003 and 2002.
For the three months ended June 30,
Property- Allstate
Liability Financial Consolidated Per diluted share
($ in millions, except per share Est. Est. Est. Est.
data) 2003 2002 2003 2002 2003 2002 2003 2002
Operating income $ 496 $ 335 $ 131 $ 143 $ 599 $ 453 $ 0.85 $ 0.64
Realized capital gains and losses 31 (114) (41) (37) (11) (153)
Reclassification of DAC amortization -- -- (11) (9) (11) (9)
Income tax benefit (expense) (8) 46 19 9 11 55
Realized capital gains and losses,
after-tax 23 (68) (33) (37) (11) (107) (0.01) (0.15)
Gain on disposition of operations,
after-tax 2 -- -- -- 2 -- -- --
Income before dividends on preferred
securities and cumulative effect of
change in accounting principle,
after-tax 521 267 98 106 590 346 0.84 0.49
Dividends on preferred securities of
subsidiary trust(s), after-tax -- -- -- -- (2) (2) -- (0.01)
Net income (loss) $ 521 $ 267 $ 98 $ 106 $ 588 $ 344 $ 0.84 $ 0.48
17
18. For the six months ended June 30,
Property- Allstate
Liability Financial Consolidated Per diluted share
($ in millions, except per share Est. Est. Est. Est.
data) 2003 2002 2003 2002 2003 2002 2003 2002
Operating income $ 1,114 $ 709 $ 213 $ 286 $ 1,272 $ 941 $ 1.80 $ 1.32
Realized capital gains and losses 68 (129) (80) (124) (13) (256)
Reclassification of DAC amortization -- -- (25) (3) (25) (3)
Income tax benefit (expense) (18) 49 40 38 22 88
Realized capital gains and losses,
after-tax 50 (80) (65) (89) (16) (171) (0.02) (0.24)
Gain on disposition of operations,
after-tax 2 5 -- -- 2 5 -- 0.01
Income before dividends on preferred
securities and cumulative effect of
change in accounting principle,
after-tax 1,166 634 148 197 1,258 775 1.78 1.09
Dividends on preferred securities of
subsidiary trust(s), after-tax -- -- -- -- (5) (5) -- (0.01)
Cumulative effect of change
in accounting principle, after-tax -- (48) -- (283) -- (331) -- (0.46)
Net income (loss) $ 1,166 $ 586 $ 148 $ (86) $ 1,253 $ 439 $ 1.78 $ 0.62
In this press release, we provide guidance on operating income per diluted share for 2003 (excluding
restructuring and related charges and assuming a level of average expected catastrophe losses used in
pricing for the remainder of the year). A reconciliation of this measure to Net income is not accessible on
a forward-looking basis because it is not possible to provide a reliable forecast of Realized capital gains
and losses, which can vary substantially from one period to another and may have a significant impact on
Net income. Because a forecast of Realized capital gains and losses is not accessible, neither is a
forecast of the effects of Realized capital gains and losses on DAC amortization, additional future policy
benefits and income taxes. It is also not possible to provide a reliable forecast of restructuring and
related charges. The other reconciling items between Operating income and Net income on a forward-
looking basis are Gains (loss) on disposition of operations after-tax and Cumulative effect of changes in
accounting principle which we assume to be zero for the remainder of 2003 and Dividends on preferred
securities of subsidiary trusts, which we estimate to be $0.02 per diluted share for 2003.
Underwriting income (loss) is Premiums earned, less Claims and claims expense (“losses”), Amortization
of DAC, Operating costs and expenses and Restructuring and related charges as determined using GAAP.
Management uses this measure in its evaluation of results of operations to analyze the profitability of our
Property-Liability insurance operations separately from investment results. It is also an integral
component of incentive compensation. We believe it is useful for investors to evaluate the components of
income separately and in the aggregate when reviewing our performance. Underwriting income (loss)
should not be considered as a substitute for Net income and does not reflect the overall profitability of our
business. Net income is the most directly comparable GAAP measure. A reconciliation of Property-
Liability Underwriting income to Net income is provided in the Segment Results table.
Operating income return on equity is a ratio found useful by investors that uses a non-GAAP measure.
It is calculated by dividing the rolling 12-month operating income by the average of the beginning and end
of the 12-month period shareholders’ equity after excluding the after-tax effect of unrealized net capital
gains. We use it to supplement our evaluation of net income and return on equity and because investors
often use this measure when evaluating the performance of insurers. Moreover, it enhances investor
understanding by eliminating the after-tax effects of realized and unrealized capital gains and losses and
the cumulative effect of changes in accounting, which can fluctuate significantly. Return on Equity is the
most directly comparable GAAP measure. The following table shows the two computations.
18
19. ($ in millions) For the twelve months ended
June 30,
Est. 2003 2002
Return on equity
Numerator:
Net income $ 1,948 $ 929
Denominator:
Beginning shareholders’ equity 17,217 17,570
Ending shareholders’ equity 19,299 17,217
Average shareholders’ equity $ 18,258 $ 17,394
ROE 10.7 5.3
Operating income return on equity
Numerator:
Operating income $ 2,406 $ 1,651
Denominator:
Beginning shareholders’ equity 17,217 17,570
Unrealized net capital gains 1,870 1,917
Adjusted beginning shareholders’ equity 15,347 15,653
Ending shareholders’ equity 19,299 17,217
Unrealized net capital gains 3,491 1,870
Adjusted ending shareholders’ equity 15,808 15,347
Average shareholders’ equity $ 15,578 $ 15,500
Operating income ROE 15.4 10.7
Operating Measures
We believe that investors’ understanding of Allstate’s performance is enhanced by our disclosure of the
following operating financial measures. Our method of calculating these measures may differ from that
used by other companies and therefore comparability may be limited.
Premiums written is the amount of premiums charged for policies issued during a fiscal period. Premiums
earned is a GAAP measure. Premiums are considered earned and are included in financial results on a pro-
rata basis over the policy period. The portion of premiums written applicable to the unexpired terms of the
policies is recorded as Unearned premiums on our Consolidated Statements of Financial Position.
The following table presents a reconciliation of premiums written to premiums earned.
Three Months Ended Six Months Ended
June 30, June 30,
($ in millions) Est. Est.
2003 2002 2003 2002
Premiums written $ 6,422 $ 6,042 $ 12,359 $ 11,758
(Increase) decrease in Unearned Premiums (270) (248) (248) (257)
Other (6) 9 34 6
Premiums earned $ 6,146 $ 5,803 $ 12,145 $ 11,507
19
20. Premiums and deposits is an operating measure that we use to analyze production trends for Allstate
Financial sales. It includes premiums on insurance policies and annuities and all deposits and other
funds received from customers on deposit-type products including the net new deposits of Allstate Bank,
which we account for under GAAP as increases to liabilities rather than as revenue.
The following table illustrates where Premiums and deposits are reflected in the consolidated financial
statements.
Three Months Ended Six Months Ended
June 30, June 30,
Est. Est.
($ in millions)
2003 2002 2003 2002
(1)
GAAP premiums $ 297 $ 348 $ 709 $ 656
Deposits to contractholder funds, separate
accounts and other 2,999 2,977 5,083 5,459
Total Premiums and deposits $ 3,296 $ 3,325 $ 5,792 $ 6,115
(1)
Life and annuity contract charges in the amount of est. $236 million and $234 million for the three months ended June 30, 2003
and 2002, respectively and est. $463 million and $464 million for the six months ended June 30, 2003 and 2002, respectively, which
are also revenues recognized for GAAP, have been excluded from the table above, but are a component of the Consolidated
Statements of Operations line item Life and annuity premiums and contract charges.
New sales of financial products by Allstate exclusive agencies is an operating measure that we use
to quantify the current year sales of financial products by the Allstate proprietary distribution channel.
New sales of financial products by Allstate exclusive agencies includes annual premiums on new
insurance policies, initial premiums and deposits on annuities, net new deposits in the Allstate Bank,
sales of other company’s mutual funds, and excludes renewal premiums. New sales of financial products
by Allstate exclusive agencies for the six months ended June 30, 2003 and 2002 totaled est. $783 million
and $760 million, respectively.
This press release contains forward-looking statements about our operating income for 2003 and
increases in PIF in our Property-Liability business. These statements are subject to the Private Securities
Litigation Reform Act of 1995 and are based on management’s estimates, assumptions and projections.
Actual results may differ materially from those projected in the forward-looking statements for a variety of
reasons. Projected weighted average rate changes in our Property-Liability business may be lower than
projected due to a decrease in PIF. Loss costs in our Property-Liability business, including losses due to
catastrophes such as hurricanes and earthquakes, may exceed management’s projections. Competitive
pressures could lead to sales of Property-Liability products, including private passenger auto and
homeowners insurance, that are lower than we have projected, due to our increased prices and our
modified underwriting practices. Investment income may not meet management’s projections due to poor
stock market performance or lower returns on the fixed income portfolio due to worsening credit
conditions. Significantly lower interest rates and equity markets could increase deferred acquisition cost
amortization, reduce contract charges, investment margins and the profitability of the Allstate Financial
segment. We encourage you to review the other risk factors facing Allstate that we disclosed in our
Notice of Annual Meeting and Proxy Statement dated March 28, 2003. We undertake no obligation to
publicly correct or update any forward-looking statements. This press release contains unaudited financial
information.
The Allstate Corporation (NYSE: ALL) is the nation’s largest publicly held personal lines insurer. Widely
known through the “You’re In Good Hands With Allstate®” slogan, Allstate provides insurance products to
more than 16 million households and has approximately 12,300 exclusive agents and financial specialists
in the U.S. and Canada. Customers can access Allstate products and services through Allstate agents,
or in select states at allstate.com and 1-800-Allstate®. EncompassSM and Deerbrook® Insurance brand
property and casualty products are sold exclusively through independent agents. Allstate Financial
Group includes the businesses that provide life and supplemental insurance, retirement, banking and
20
21. investment products through distribution channels that include Allstate agents, independent agents, and
banks and securities firms.
We post an interim investor supplement on our web site. You can access it by going to allstate.com and
clicking on “About Allstate.” From there, go to the “Find Investor Relations Information” button. We will
post additional information to the supplement over the next 30 days as it becomes available.
Contact:
Michael Trevino
Media Relations
(847) 402-5600
Robert Block, Larry Moews, Phil Dorn
Investor Relations
(847) 402-2800
###
21