Al6061 aging orientation distribution function plots
•Download as PPTX, PDF•
0 likes•690 views
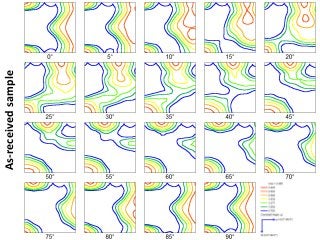
Al6061 aging orientation distribution function plots
Report
Share
Report
Share

Recommended
X ray diff lecture 3
The document discusses X-ray diffraction and crystallography. It begins by providing background on the discovery of X-rays by Wilhelm Röntgen in 1895. It then describes how X-rays are produced and their properties, including their short wavelength and ability to penetrate materials. A key section explains how X-ray diffraction occurs when crystals act as diffraction gratings for X-rays due to their periodic structure. Bragg's law is also summarized, relating the diffraction condition to the wavelength and angle of the X-rays scattering from the crystal lattice planes. The document overall provides an introduction to X-ray diffraction techniques used to study crystal structures.
Al6061 Nanoindentation results
The document contains the results of nanoindentation tests on Al6061 including statistical analyses of modulus, yield strength, and hardness values extracted from the load-displacement curves. Graphs show distributions of fitting parameters and residual errors from the nanoindentation data analysis as well as representative load-displacement, stress-strain, and contact area curves.
Ni pure mg corrected data
The document appears to contain statistical data from nanoindentation experiments, including mean, median, standard deviation, minimum and maximum values of modulus. It also includes graphs of stress-strain curves, load-displacement data, and strain-contact radius data. The document provides parameter values from fitting the indentation data, including modulus, R-squared values, and residual errors.
PCA on Optical images
This document analyzes changes in the microstructure of Al6061 as it ages. Images of samples annealed at different temperatures (400F, 525F, 650F, 775F) were taken and analyzed to quantify features like constituent particle volume fraction and spacing. Principal component analysis was used to identify correlations between measured microstructural parameters and how they change with increasing annealing temperature.
Nist project final report
This document summarizes research quantifying microstructural features and linking them to mechanical properties in aging Al6061 alloy. Optical microscopy, electron backscatter diffraction, and scanning electron microscopy were used to characterize precipitates, particles, and grain structure at different length scales. Properties like yield strength and tensile strength were measured. Principal component analysis was performed on the microstructural data to reduce dimensions and identify relationships between microstructure and properties. Future work involves higher throughput experiments, measuring local properties and microstructure, and including more microstructural statistics in the analysis to better understand structure-property-processing linkages.
Nist project final report
This document summarizes research quantifying microstructural features and linking them to mechanical properties in Al6061 during aging. Optical microscopy, electron backscatter diffraction, and scanning electron microscopy were used to characterize particle size, spacing, volume fraction, and grain properties at different aging temperatures. Tensile tests measured yield and ultimate strengths. Principal component analysis of 2-point statistics from the microstructural data revealed relationships between microstructure and properties. Future work involves high-throughput experiments and measuring local properties and microstructure to better understand structure-property linkages during aging of Al6061.
Nist project final report
1) The document analyzes microstructural features and mechanical properties of Al6061 alloy during aging.
2) Different techniques including EBSD, OM, SEM were used to characterize grain structure, precipitates, and particles at various length scales.
3) Principal component analysis was applied to microstructural datasets to identify linkages between microstructure and mechanical properties such as yield strength and tensile strength.
Nist project final report
1) The document discusses quantifying microstructural features and determining structure-property relationships during aging of Al6061.
2) Optical microscopy, scanning electron microscopy, and electron backscatter diffraction were used to characterize microstructural features like precipitates, particles, and grain structure at different length scales.
3) Mechanical properties like yield strength and tensile strength were measured and principal component analysis was used to link the properties to microstructural features identified from the image analysis techniques.
Nist project class report
The document describes a study that aims to quantify microstructural features in Al6061 aluminum alloy during aging processes using multiple experimental methods. Key microstructural features like grain size, shape, texture as well as constituent particle size, volume fraction, and spacing are analyzed using techniques like SEM, EBSD, and optical microscopy. Microstructural changes with increasing aging temperature and time are characterized.
Al6061 aging inverse pole figure maps
The document describes aging treatments performed on a sample at increasing temperatures for 2 hours each: it was aged at 400F for 2 hrs, then 525F for 2 hrs, then 650F for 2 hrs, and finally aged at 775F for 2 hrs.
Al6061 aging pole figure plots
The document reports maximum values from aging a sample at different temperatures for 2 hours. The as-received sample had a maximum value of 3.055. Aging at 400F and 525F decreased the maximum to 2.579 and 2.944 respectively, while aging at 650F and 775F increased the maximum slightly to 3.06 and decreased it to 2.744.
Al6061 aging grain aspect ratio plots
The document describes aging treatments performed on a sample at increasing temperatures for 2 hours each: it was aged at 400F for 2 hrs, then 525F for 2 hrs, then 650F for 2 hrs, and finally aged at 775F for 2 hrs.
Al6061 aging grain size distribution plots
The document describes aging treatments performed on a sample at increasing temperatures for 2 hours each: it was aged at 400F for 2 hrs, then 525F for 2 hrs, then 650F for 2 hrs, and finally aged at 775F for 2 hrs.
Sem images nist
This document contains a list of numbers ranging from 400 to 775 in increments of approximately 125. It appears to be measuring some value over a range but does not provide any additional context to explain what is being measured.
Pf nist
This document contains data from an experiment with 5 trials using different wavelengths of light. It lists the wavelength tested in nanometers and the maximum absorbance measured for each trial, with the highest absorbance of 2.769 recorded at a wavelength of 525 nanometers.
HIGH THROUGHPUT MICROSTRUCTURE-MECHANICAL PROPERTY DATA COLLECTION
This document discusses high throughput characterization of microstructures and their mechanical properties. It presents methods for collecting high resolution microstructure data more efficiently using adaptive scan patterns. It also discusses integrating nanoindentation with electron backscatter diffraction to efficiently connect the microstructure and mechanical response of materials at multiple length scales, from nanometers to millimeters. This would help determine how representative a small sample area is of the entire part and reduce the number of samples and tests needed.
SCALING OF MOS CIRCUITS m .pptx
this ppt explains about scaling parameters of the mosfet it is basically vlsi subject
This study Examines the Effectiveness of Talent Procurement through the Imple...
In the world with high technology and fast
forward mindset recruiters are walking/showing interest
towards E-Recruitment. Present most of the HRs of
many companies are choosing E-Recruitment as the best
choice for recruitment. E-Recruitment is being done
through many online platforms like Linkedin, Naukri,
Instagram , Facebook etc. Now with high technology E-
Recruitment has gone through next level by using
Artificial Intelligence too.
Key Words : Talent Management, Talent Acquisition , E-
Recruitment , Artificial Intelligence Introduction
Effectiveness of Talent Acquisition through E-
Recruitment in this topic we will discuss about 4important
and interlinked topics which are
Ericsson LTE Throughput Troubleshooting Techniques.ppt
Ericsson LTE Throughput Troubleshooting Techniques
Call Girls Chennai +91-8824825030 Vip Call Girls Chennai
Call Girls Chennai +91-8824825030 Vip Call Girls Chennai
原版制作(Humboldt毕业证书)柏林大学毕业证学位证一模一样
原件一模一样【微信:bwp0011】《(Humboldt毕业证书)柏林大学毕业证学位证》【微信:bwp0011】学位证,留信认证(真实可查,永久存档)原件一模一样纸张工艺/offer、雅思、外壳等材料/诚信可靠,可直接看成品样本,帮您解决无法毕业带来的各种难题!外壳,原版制作,诚信可靠,可直接看成品样本。行业标杆!精益求精,诚心合作,真诚制作!多年品质 ,按需精细制作,24小时接单,全套进口原装设备。十五年致力于帮助留学生解决难题,包您满意。
本公司拥有海外各大学样板无数,能完美还原。
1:1完美还原海外各大学毕业材料上的工艺:水印,阴影底纹,钢印LOGO烫金烫银,LOGO烫金烫银复合重叠。文字图案浮雕、激光镭射、紫外荧光、温感、复印防伪等防伪工艺。材料咨询办理、认证咨询办理请加学历顾问微bwp0011
【主营项目】
一.毕业证【微bwp0011】成绩单、使馆认证、教育部认证、雅思托福成绩单、学生卡等!
二.真实使馆公证(即留学回国人员证明,不成功不收费)
三.真实教育部学历学位认证(教育部存档!教育部留服网站永久可查)
四.办理各国各大学文凭(一对一专业服务,可全程监控跟踪进度)
如果您处于以下几种情况:
◇在校期间,因各种原因未能顺利毕业……拿不到官方毕业证【微bwp0011】
◇面对父母的压力,希望尽快拿到;
◇不清楚认证流程以及材料该如何准备;
◇回国时间很长,忘记办理;
◇回国马上就要找工作,办给用人单位看;
◇企事业单位必须要求办理的
◇需要报考公务员、购买免税车、落转户口
◇申请留学生创业基金
留信网认证的作用:
1:该专业认证可证明留学生真实身份
2:同时对留学生所学专业登记给予评定
3:国家专业人才认证中心颁发入库证书
4:这个认证书并且可以归档倒地方
5:凡事获得留信网入网的信息将会逐步更新到个人身份内,将在公安局网内查询个人身份证信息后,同步读取人才网入库信息
6:个人职称评审加20分
7:个人信誉贷款加10分
8:在国家人才网主办的国家网络招聘大会中纳入资料,供国家高端企业选择人才
SELENIUM CONF -PALLAVI SHARMA - 2024.pdf
Begin your journey to contribute to Selenium - A Talk at the Selenium Conference 2024
一比一原版(uoft毕业证书)加拿大多伦多大学毕业证如何办理
原版一模一样【微信:741003700 】【(uoft毕业证书)加拿大多伦多大学毕业证成绩单】【微信:741003700 】学位证,留信认证(真实可查,永久存档)原件一模一样纸张工艺/offer、雅思、外壳等材料/诚信可靠,可直接看成品样本,帮您解决无法毕业带来的各种难题!外壳,原版制作,诚信可靠,可直接看成品样本。行业标杆!精益求精,诚心合作,真诚制作!多年品质 ,按需精细制作,24小时接单,全套进口原装设备。十五年致力于帮助留学生解决难题,包您满意。
本公司拥有海外各大学样板无数,能完美还原。
1:1完美还原海外各大学毕业材料上的工艺:水印,阴影底纹,钢印LOGO烫金烫银,LOGO烫金烫银复合重叠。文字图案浮雕、激光镭射、紫外荧光、温感、复印防伪等防伪工艺。材料咨询办理、认证咨询办理请加学历顾问Q/微741003700
【主营项目】
一.毕业证【q微741003700】成绩单、使馆认证、教育部认证、雅思托福成绩单、学生卡等!
二.真实使馆公证(即留学回国人员证明,不成功不收费)
三.真实教育部学历学位认证(教育部存档!教育部留服网站永久可查)
四.办理各国各大学文凭(一对一专业服务,可全程监控跟踪进度)
如果您处于以下几种情况:
◇在校期间,因各种原因未能顺利毕业……拿不到官方毕业证【q/微741003700】
◇面对父母的压力,希望尽快拿到;
◇不清楚认证流程以及材料该如何准备;
◇回国时间很长,忘记办理;
◇回国马上就要找工作,办给用人单位看;
◇企事业单位必须要求办理的
◇需要报考公务员、购买免税车、落转户口
◇申请留学生创业基金
留信网认证的作用:
1:该专业认证可证明留学生真实身份
2:同时对留学生所学专业登记给予评定
3:国家专业人才认证中心颁发入库证书
4:这个认证书并且可以归档倒地方
5:凡事获得留信网入网的信息将会逐步更新到个人身份内,将在公安局网内查询个人身份证信息后,同步读取人才网入库信息
6:个人职称评审加20分
7:个人信誉贷款加10分
8:在国家人才网主办的国家网络招聘大会中纳入资料,供国家高端企业选择人才
办理(uoft毕业证书)加拿大多伦多大学毕业证【微信:741003700 】外观非常简单,由纸质材料制成,上面印有校徽、校名、毕业生姓名、专业等信息。
办理(uoft毕业证书)加拿大多伦多大学毕业证【微信:741003700 】格式相对统一,各专业都有相应的模板。通常包括以下部分:
校徽:象征着学校的荣誉和传承。
校名:学校英文全称
授予学位:本部分将注明获得的具体学位名称。
毕业生姓名:这是最重要的信息之一,标志着该证书是由特定人员获得的。
颁发日期:这是毕业正式生效的时间,也代表着毕业生学业的结束。
其他信息:根据不同的专业和学位,可能会有一些特定的信息或章节。
办理(uoft毕业证书)加拿大多伦多大学毕业证【微信:741003700 】价值很高,需要妥善保管。一般来说,应放置在安全、干燥、防潮的地方,避免长时间暴露在阳光下。如需使用,最好使用复印件而不是原件,以免丢失。
综上所述,办理(uoft毕业证书)加拿大多伦多大学毕业证【微信:741003700 】是证明身份和学历的高价值文件。外观简单庄重,格式统一,包括重要的个人信息和发布日期。对持有人来说,妥善保管是非常重要的。
DESIGN AND MANUFACTURE OF CEILING BOARD USING SAWDUST AND WASTE CARTON MATERI...
The need for ecofriendly materials as building materials in this century cannot be overemphasized
Sri Guru Hargobind Ji - Bandi Chor Guru.pdf
Sri Guru Hargobind Ji (19 June 1595 - 3 March 1644) is revered as the Sixth Nanak.
• On 25 May 1606 Guru Arjan nominated his son Sri Hargobind Ji as his successor. Shortly
afterwards, Guru Arjan was arrested, tortured and killed by order of the Mogul Emperor
Jahangir.
• Guru Hargobind's succession ceremony took place on 24 June 1606. He was barely
eleven years old when he became 6th Guru.
• As ordered by Guru Arjan Dev Ji, he put on two swords, one indicated his spiritual
authority (PIRI) and the other, his temporal authority (MIRI). He thus for the first time
initiated military tradition in the Sikh faith to resist religious persecution, protect
people’s freedom and independence to practice religion by choice. He transformed
Sikhs to be Saints and Soldier.
• He had a long tenure as Guru, lasting 37 years, 9 months and 3 days
Height and depth gauge linear metrology.pdf
Height gauges may also be used to measure the height of an object by using the underside of the scriber as the datum. The datum may be permanently fixed or the height gauge may have provision to adjust the scale, this is done by sliding the scale vertically along the body of the height gauge by turning a fine feed screw at the top of the gauge; then with the scriber set to the same level as the base, the scale can be matched to it. This adjustment allows different scribers or probes to be used, as well as adjusting for any errors in a damaged or resharpened probe.
More Related Content
More from alikhosravani
Nist project class report
The document describes a study that aims to quantify microstructural features in Al6061 aluminum alloy during aging processes using multiple experimental methods. Key microstructural features like grain size, shape, texture as well as constituent particle size, volume fraction, and spacing are analyzed using techniques like SEM, EBSD, and optical microscopy. Microstructural changes with increasing aging temperature and time are characterized.
Al6061 aging inverse pole figure maps
The document describes aging treatments performed on a sample at increasing temperatures for 2 hours each: it was aged at 400F for 2 hrs, then 525F for 2 hrs, then 650F for 2 hrs, and finally aged at 775F for 2 hrs.
Al6061 aging pole figure plots
The document reports maximum values from aging a sample at different temperatures for 2 hours. The as-received sample had a maximum value of 3.055. Aging at 400F and 525F decreased the maximum to 2.579 and 2.944 respectively, while aging at 650F and 775F increased the maximum slightly to 3.06 and decreased it to 2.744.
Al6061 aging grain aspect ratio plots
The document describes aging treatments performed on a sample at increasing temperatures for 2 hours each: it was aged at 400F for 2 hrs, then 525F for 2 hrs, then 650F for 2 hrs, and finally aged at 775F for 2 hrs.
Al6061 aging grain size distribution plots
The document describes aging treatments performed on a sample at increasing temperatures for 2 hours each: it was aged at 400F for 2 hrs, then 525F for 2 hrs, then 650F for 2 hrs, and finally aged at 775F for 2 hrs.
Sem images nist
This document contains a list of numbers ranging from 400 to 775 in increments of approximately 125. It appears to be measuring some value over a range but does not provide any additional context to explain what is being measured.
Pf nist
This document contains data from an experiment with 5 trials using different wavelengths of light. It lists the wavelength tested in nanometers and the maximum absorbance measured for each trial, with the highest absorbance of 2.769 recorded at a wavelength of 525 nanometers.
HIGH THROUGHPUT MICROSTRUCTURE-MECHANICAL PROPERTY DATA COLLECTION
This document discusses high throughput characterization of microstructures and their mechanical properties. It presents methods for collecting high resolution microstructure data more efficiently using adaptive scan patterns. It also discusses integrating nanoindentation with electron backscatter diffraction to efficiently connect the microstructure and mechanical response of materials at multiple length scales, from nanometers to millimeters. This would help determine how representative a small sample area is of the entire part and reduce the number of samples and tests needed.
More from alikhosravani (10)
HIGH THROUGHPUT MICROSTRUCTURE-MECHANICAL PROPERTY DATA COLLECTION
HIGH THROUGHPUT MICROSTRUCTURE-MECHANICAL PROPERTY DATA COLLECTION
Recently uploaded
SCALING OF MOS CIRCUITS m .pptx
this ppt explains about scaling parameters of the mosfet it is basically vlsi subject
This study Examines the Effectiveness of Talent Procurement through the Imple...
In the world with high technology and fast
forward mindset recruiters are walking/showing interest
towards E-Recruitment. Present most of the HRs of
many companies are choosing E-Recruitment as the best
choice for recruitment. E-Recruitment is being done
through many online platforms like Linkedin, Naukri,
Instagram , Facebook etc. Now with high technology E-
Recruitment has gone through next level by using
Artificial Intelligence too.
Key Words : Talent Management, Talent Acquisition , E-
Recruitment , Artificial Intelligence Introduction
Effectiveness of Talent Acquisition through E-
Recruitment in this topic we will discuss about 4important
and interlinked topics which are
Ericsson LTE Throughput Troubleshooting Techniques.ppt
Ericsson LTE Throughput Troubleshooting Techniques
Call Girls Chennai +91-8824825030 Vip Call Girls Chennai
Call Girls Chennai +91-8824825030 Vip Call Girls Chennai
原版制作(Humboldt毕业证书)柏林大学毕业证学位证一模一样
原件一模一样【微信:bwp0011】《(Humboldt毕业证书)柏林大学毕业证学位证》【微信:bwp0011】学位证,留信认证(真实可查,永久存档)原件一模一样纸张工艺/offer、雅思、外壳等材料/诚信可靠,可直接看成品样本,帮您解决无法毕业带来的各种难题!外壳,原版制作,诚信可靠,可直接看成品样本。行业标杆!精益求精,诚心合作,真诚制作!多年品质 ,按需精细制作,24小时接单,全套进口原装设备。十五年致力于帮助留学生解决难题,包您满意。
本公司拥有海外各大学样板无数,能完美还原。
1:1完美还原海外各大学毕业材料上的工艺:水印,阴影底纹,钢印LOGO烫金烫银,LOGO烫金烫银复合重叠。文字图案浮雕、激光镭射、紫外荧光、温感、复印防伪等防伪工艺。材料咨询办理、认证咨询办理请加学历顾问微bwp0011
【主营项目】
一.毕业证【微bwp0011】成绩单、使馆认证、教育部认证、雅思托福成绩单、学生卡等!
二.真实使馆公证(即留学回国人员证明,不成功不收费)
三.真实教育部学历学位认证(教育部存档!教育部留服网站永久可查)
四.办理各国各大学文凭(一对一专业服务,可全程监控跟踪进度)
如果您处于以下几种情况:
◇在校期间,因各种原因未能顺利毕业……拿不到官方毕业证【微bwp0011】
◇面对父母的压力,希望尽快拿到;
◇不清楚认证流程以及材料该如何准备;
◇回国时间很长,忘记办理;
◇回国马上就要找工作,办给用人单位看;
◇企事业单位必须要求办理的
◇需要报考公务员、购买免税车、落转户口
◇申请留学生创业基金
留信网认证的作用:
1:该专业认证可证明留学生真实身份
2:同时对留学生所学专业登记给予评定
3:国家专业人才认证中心颁发入库证书
4:这个认证书并且可以归档倒地方
5:凡事获得留信网入网的信息将会逐步更新到个人身份内,将在公安局网内查询个人身份证信息后,同步读取人才网入库信息
6:个人职称评审加20分
7:个人信誉贷款加10分
8:在国家人才网主办的国家网络招聘大会中纳入资料,供国家高端企业选择人才
SELENIUM CONF -PALLAVI SHARMA - 2024.pdf
Begin your journey to contribute to Selenium - A Talk at the Selenium Conference 2024
一比一原版(uoft毕业证书)加拿大多伦多大学毕业证如何办理
原版一模一样【微信:741003700 】【(uoft毕业证书)加拿大多伦多大学毕业证成绩单】【微信:741003700 】学位证,留信认证(真实可查,永久存档)原件一模一样纸张工艺/offer、雅思、外壳等材料/诚信可靠,可直接看成品样本,帮您解决无法毕业带来的各种难题!外壳,原版制作,诚信可靠,可直接看成品样本。行业标杆!精益求精,诚心合作,真诚制作!多年品质 ,按需精细制作,24小时接单,全套进口原装设备。十五年致力于帮助留学生解决难题,包您满意。
本公司拥有海外各大学样板无数,能完美还原。
1:1完美还原海外各大学毕业材料上的工艺:水印,阴影底纹,钢印LOGO烫金烫银,LOGO烫金烫银复合重叠。文字图案浮雕、激光镭射、紫外荧光、温感、复印防伪等防伪工艺。材料咨询办理、认证咨询办理请加学历顾问Q/微741003700
【主营项目】
一.毕业证【q微741003700】成绩单、使馆认证、教育部认证、雅思托福成绩单、学生卡等!
二.真实使馆公证(即留学回国人员证明,不成功不收费)
三.真实教育部学历学位认证(教育部存档!教育部留服网站永久可查)
四.办理各国各大学文凭(一对一专业服务,可全程监控跟踪进度)
如果您处于以下几种情况:
◇在校期间,因各种原因未能顺利毕业……拿不到官方毕业证【q/微741003700】
◇面对父母的压力,希望尽快拿到;
◇不清楚认证流程以及材料该如何准备;
◇回国时间很长,忘记办理;
◇回国马上就要找工作,办给用人单位看;
◇企事业单位必须要求办理的
◇需要报考公务员、购买免税车、落转户口
◇申请留学生创业基金
留信网认证的作用:
1:该专业认证可证明留学生真实身份
2:同时对留学生所学专业登记给予评定
3:国家专业人才认证中心颁发入库证书
4:这个认证书并且可以归档倒地方
5:凡事获得留信网入网的信息将会逐步更新到个人身份内,将在公安局网内查询个人身份证信息后,同步读取人才网入库信息
6:个人职称评审加20分
7:个人信誉贷款加10分
8:在国家人才网主办的国家网络招聘大会中纳入资料,供国家高端企业选择人才
办理(uoft毕业证书)加拿大多伦多大学毕业证【微信:741003700 】外观非常简单,由纸质材料制成,上面印有校徽、校名、毕业生姓名、专业等信息。
办理(uoft毕业证书)加拿大多伦多大学毕业证【微信:741003700 】格式相对统一,各专业都有相应的模板。通常包括以下部分:
校徽:象征着学校的荣誉和传承。
校名:学校英文全称
授予学位:本部分将注明获得的具体学位名称。
毕业生姓名:这是最重要的信息之一,标志着该证书是由特定人员获得的。
颁发日期:这是毕业正式生效的时间,也代表着毕业生学业的结束。
其他信息:根据不同的专业和学位,可能会有一些特定的信息或章节。
办理(uoft毕业证书)加拿大多伦多大学毕业证【微信:741003700 】价值很高,需要妥善保管。一般来说,应放置在安全、干燥、防潮的地方,避免长时间暴露在阳光下。如需使用,最好使用复印件而不是原件,以免丢失。
综上所述,办理(uoft毕业证书)加拿大多伦多大学毕业证【微信:741003700 】是证明身份和学历的高价值文件。外观简单庄重,格式统一,包括重要的个人信息和发布日期。对持有人来说,妥善保管是非常重要的。
DESIGN AND MANUFACTURE OF CEILING BOARD USING SAWDUST AND WASTE CARTON MATERI...
The need for ecofriendly materials as building materials in this century cannot be overemphasized
Sri Guru Hargobind Ji - Bandi Chor Guru.pdf
Sri Guru Hargobind Ji (19 June 1595 - 3 March 1644) is revered as the Sixth Nanak.
• On 25 May 1606 Guru Arjan nominated his son Sri Hargobind Ji as his successor. Shortly
afterwards, Guru Arjan was arrested, tortured and killed by order of the Mogul Emperor
Jahangir.
• Guru Hargobind's succession ceremony took place on 24 June 1606. He was barely
eleven years old when he became 6th Guru.
• As ordered by Guru Arjan Dev Ji, he put on two swords, one indicated his spiritual
authority (PIRI) and the other, his temporal authority (MIRI). He thus for the first time
initiated military tradition in the Sikh faith to resist religious persecution, protect
people’s freedom and independence to practice religion by choice. He transformed
Sikhs to be Saints and Soldier.
• He had a long tenure as Guru, lasting 37 years, 9 months and 3 days
Height and depth gauge linear metrology.pdf
Height gauges may also be used to measure the height of an object by using the underside of the scriber as the datum. The datum may be permanently fixed or the height gauge may have provision to adjust the scale, this is done by sliding the scale vertically along the body of the height gauge by turning a fine feed screw at the top of the gauge; then with the scriber set to the same level as the base, the scale can be matched to it. This adjustment allows different scribers or probes to be used, as well as adjusting for any errors in a damaged or resharpened probe.
FULL STACK PROGRAMMING - Both Front End and Back End
This ppt gives details about Full Stack Programming and its basics.
A high-Speed Communication System is based on the Design of a Bi-NoC Router, ...
The Network on Chip (NoC) has emerged as an effective
solution for intercommunication infrastructure within System on
Chip (SoC) designs, overcoming the limitations of traditional
methods that face significant bottlenecks. However, the complexity
of NoC design presents numerous challenges related to
performance metrics such as scalability, latency, power
consumption, and signal integrity. This project addresses the
issues within the router's memory unit and proposes an enhanced
memory structure. To achieve efficient data transfer, FIFO buffers
are implemented in distributed RAM and virtual channels for
FPGA-based NoC. The project introduces advanced FIFO-based
memory units within the NoC router, assessing their performance
in a Bi-directional NoC (Bi-NoC) configuration. The primary
objective is to reduce the router's workload while enhancing the
FIFO internal structure. To further improve data transfer speed,
a Bi-NoC with a self-configurable intercommunication channel is
suggested. Simulation and synthesis results demonstrate
guaranteed throughput, predictable latency, and equitable
network access, showing significant improvement over previous
designs
OOPS_Lab_Manual - programs using C++ programming language
This manual contains programs on object oriented programming concepts using C++ language.
Tools & Techniques for Commissioning and Maintaining PV Systems W-Animations ...
Join us for this solutions-based webinar on the tools and techniques for commissioning and maintaining PV Systems. In this session, we'll review the process of building and maintaining a solar array, starting with installation and commissioning, then reviewing operations and maintenance of the system. This course will review insulation resistance testing, I-V curve testing, earth-bond continuity, ground resistance testing, performance tests, visual inspections, ground and arc fault testing procedures, and power quality analysis.
Fluke Solar Application Specialist Will White is presenting on this engaging topic:
Will has worked in the renewable energy industry since 2005, first as an installer for a small east coast solar integrator before adding sales, design, and project management to his skillset. In 2022, Will joined Fluke as a solar application specialist, where he supports their renewable energy testing equipment like IV-curve tracers, electrical meters, and thermal imaging cameras. Experienced in wind power, solar thermal, energy storage, and all scales of PV, Will has primarily focused on residential and small commercial systems. He is passionate about implementing high-quality, code-compliant installation techniques.
Presentation on Food Delivery Systems
This presentation is about Food Delivery Systems and how they are developed using the Software Development Life Cycle (SDLC) and other methods. It explains the steps involved in creating a food delivery app, from planning and designing to testing and launching. The slide also covers different tools and technologies used to make these systems work efficiently.
Levelised Cost of Hydrogen (LCOH) Calculator Manual
The aim of this manual is to explain the
methodology behind the Levelized Cost of
Hydrogen (LCOH) calculator. Moreover, this
manual also demonstrates how the calculator
can be used for estimating the expenses associated with hydrogen production in Europe
using low-temperature electrolysis considering different sources of electricity
Recently uploaded (20)
This study Examines the Effectiveness of Talent Procurement through the Imple...
This study Examines the Effectiveness of Talent Procurement through the Imple...
Ericsson LTE Throughput Troubleshooting Techniques.ppt
Ericsson LTE Throughput Troubleshooting Techniques.ppt
Call Girls Chennai +91-8824825030 Vip Call Girls Chennai
Call Girls Chennai +91-8824825030 Vip Call Girls Chennai
1FIDIC-CONSTRUCTION-CONTRACT-2ND-ED-2017-RED-BOOK.pdf
1FIDIC-CONSTRUCTION-CONTRACT-2ND-ED-2017-RED-BOOK.pdf
DESIGN AND MANUFACTURE OF CEILING BOARD USING SAWDUST AND WASTE CARTON MATERI...
DESIGN AND MANUFACTURE OF CEILING BOARD USING SAWDUST AND WASTE CARTON MATERI...
FULL STACK PROGRAMMING - Both Front End and Back End
FULL STACK PROGRAMMING - Both Front End and Back End
A high-Speed Communication System is based on the Design of a Bi-NoC Router, ...
A high-Speed Communication System is based on the Design of a Bi-NoC Router, ...
OOPS_Lab_Manual - programs using C++ programming language
OOPS_Lab_Manual - programs using C++ programming language
Tools & Techniques for Commissioning and Maintaining PV Systems W-Animations ...
Tools & Techniques for Commissioning and Maintaining PV Systems W-Animations ...
Levelised Cost of Hydrogen (LCOH) Calculator Manual
Levelised Cost of Hydrogen (LCOH) Calculator Manual
Al6061 aging orientation distribution function plots
- 2. Aged at 400F for 2 hrs
- 3. Aged at 525F for 2 hrs
- 4. Aged at 650F for 2 hrs
- 5. Aged at 775F for 2 hrs