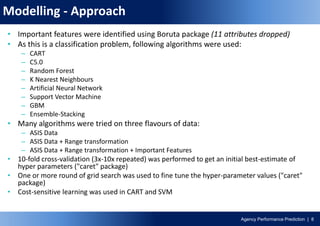
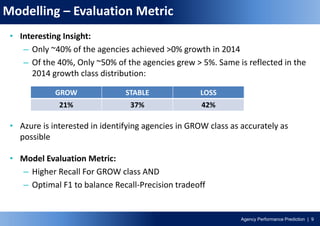
Download to read offline


![Agency Performance Prediction | 4
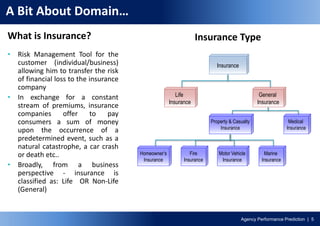
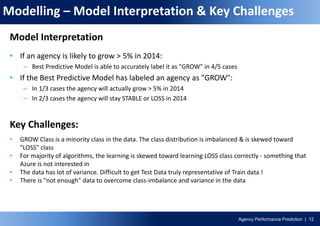
Insights Required & Business Benefits
What Insights Are Required?
Classify each agency into one of the following categories
– GROW: Business from the agency is likely to grow > 5% in 2014
– STABLE: Business from the agency is likely to stay flat with growth in the range [-5%,5%] in 2014
– LOSS: Business form the agency is likely to shrink > 5% (< -5% growth) in 2014
Note: Business growth is measured in terms of %growth in Average Monthly Written Premium Amount achieved by the Agency for a given year
Potential Business Benefits
• Improved understanding of Agency Performance - at a micro level & macro level
– How is an individual agency is likely to perform?
– How are all agencies in a state are likely to perform?
• Optimized utilization of Agency Development Funds](https://image.slidesharecdn.com/aigperformanceclassification-170112063410/85/AIG-Performance-Classification-4-320.jpg)
![Agency Performance Prediction | 7
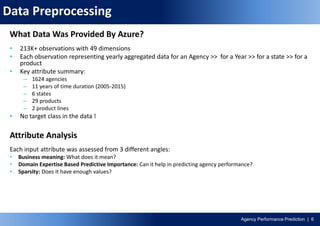
Data Preprocessing (Cont…)
Key Preprocessing Challenges:
SR# Challenge Category Challenge Resolution
1 Missing Values 1. Identified and dropped highly sparse attributes
2. Missing values encoded as "99999", "Unknown" were converted to NA during file read in R
2 Unwanted Data 1. Agencies, appointed as late as 2014 & for which 2014 growth rate can not be calculated - were
removed
2. Scope of analysis is "Personal Line (PL)" data, hence, Commercial Line (CL) data was filtered out
3 Unavailable Data New attributes created for all Quantity and Revenue attributes to average them over the # of months
data is available
4 Incomplete Data 2005 and 2015 data removed as data were available only for 8 & 5 months respectively
5 Repeating Data Agency specific attributes were detached from raw data, processed separately and later merge with
main data
6 Format Of Data For
Modelling
1. All Quantity attributes & revenue attributes were aggregated based on AGENCY_ID and YEAR
2. Each important attribute was expanded with AGENCY_ID in row and Year identifier in column
E.g. WrittenPremAmount column was converted to 2006_WrittenPremAmount,
2007_WrittenPremAmount....
7 No Target Class
Present
1. Lag variable was created for Written Premium Amount
2. Growth Rate for each agency for all years (2006-20014) was calculated
3. Each agency was assigned a class label based on 2014 growth rate:
• GROW class := 2014 growth rate > 5%
• STABLE class := 2014 growth rate in the range [-5%, 5%]
• LOSS class := 2014 growth rate < -5%](https://image.slidesharecdn.com/aigperformanceclassification-170112063410/85/AIG-Performance-Classification-7-320.jpg)
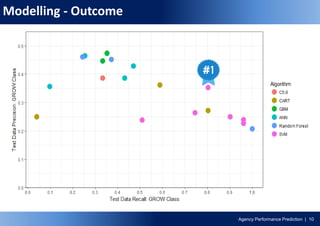
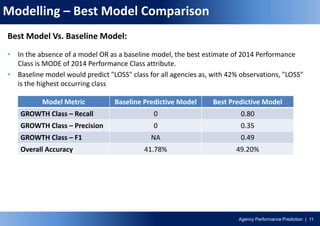


- The document discusses building a predictive model for classifying insurance agencies into one of three performance categories (GROW, STABLE, LOSS) based on past performance data from over 1,600 agencies. - Several machine learning algorithms were tested on preprocessed agency data, with the best model achieving a recall of 80% for the GROW class and overall accuracy of 49.2%, outperforming the baseline model. - Key challenges included class imbalance in the target variable and variance in the historical agency data.


