UNIT- 1
INTRODUCTION ANDDATA PREPROCESSING
Data Mining – Kinds of data to be mined – Kinds of patterns to be
mined – Technologies – Targeted Applications - Major Issues in Data
Mining – Data Objects and Attribute Types – Measuring Data similarity
and dissimilarity - Data Cleaning –Data Integration - Data Reduction –
Data Transformation – Data Discretization.
2.
Why Data Mining?
•Vast Data Collection:
Large volumes of data are generated daily across various sectors like
business, science, medicine, and social media. This data needs to be
analyzed to uncover valuable insights.
• Transition to the Data Age:
While we often refer to living in the "information age”, we are
actually in the "data age”, where terabytes and petabytes of data
flood into networks, the internet, and storage devices from various
daily life, highlighting the need for effective data analysis.
3.
• Rapid DataGrowth: The increase in data volume is due to
societal computerization and advancements in data
collection and storage technologies.
• Business Data Generation: Companies worldwide generate
massive datasets, including:
• Sales transactions
• Stock trading records
• Product descriptions and promotions
• Customer feedback
• Retail Example: Large retailers like Walmart handle hundreds
of millions of weekly transactions across global branches.
4.
• Scientific DataGeneration: Fields like science and
engineering continuously produce vast data, including:
• Remote sensing
• Scientific experiments
• System performance monitoring
• Environmental surveillance
• Scale of Data: These activities result in petabytes of data
being generated.
5.
The Need forData Mining
Telecommunication Networks:
• Global telecommunication networks handle vast amounts of data,
processing tens of petabytes of data traffic every day.
Medical Data:
• The healthcare industry generates large volumes of data from medical
records, patient monitoring, and medical imaging, requiring efficient
data analysis tools.
Web Searches:
• Search engines process billions of web searches daily, generating
petabytes of data that need to be analyzed.
6.
Social Media andCommunities:
• Social media platforms and online communities produce massive
amounts of data in the form of digital content, blogs, videos, and
social networks.
The Role of Data Mining:
• Powerful data mining tools are essential to manage and derive
valuable insights from such large datasets.
• Data mining, a young and promising field, helps to convert vast
amounts of data into organized knowledge, marking progress in the
transition from the data age to the information age.
7.
Example of DataMining in Action
Search Engine Queries as Data:
• Search engines like Google handle hundreds of millions of queries daily.
• Each query reflects a user's information needs, creating a massive
dataset for analysis.
Discovering Patterns:
• By analyzing these queries, data mining can uncover patterns that
provide valuable insights.
• For instance, Google's Flu Trends uses specific search terms related to
flu to track flu activity.
8.
Flu Trends Example:
•Google found a correlation between flu-related search terms and
actual flu symptoms, allowing Flu Trends to estimate flu activity up to
two weeks faster than traditional methods.
Impact of Data Mining:
• This example demonstrates how data mining can turn large datasets
into actionable knowledge, helping to address global challenges more
efficiently.
9.
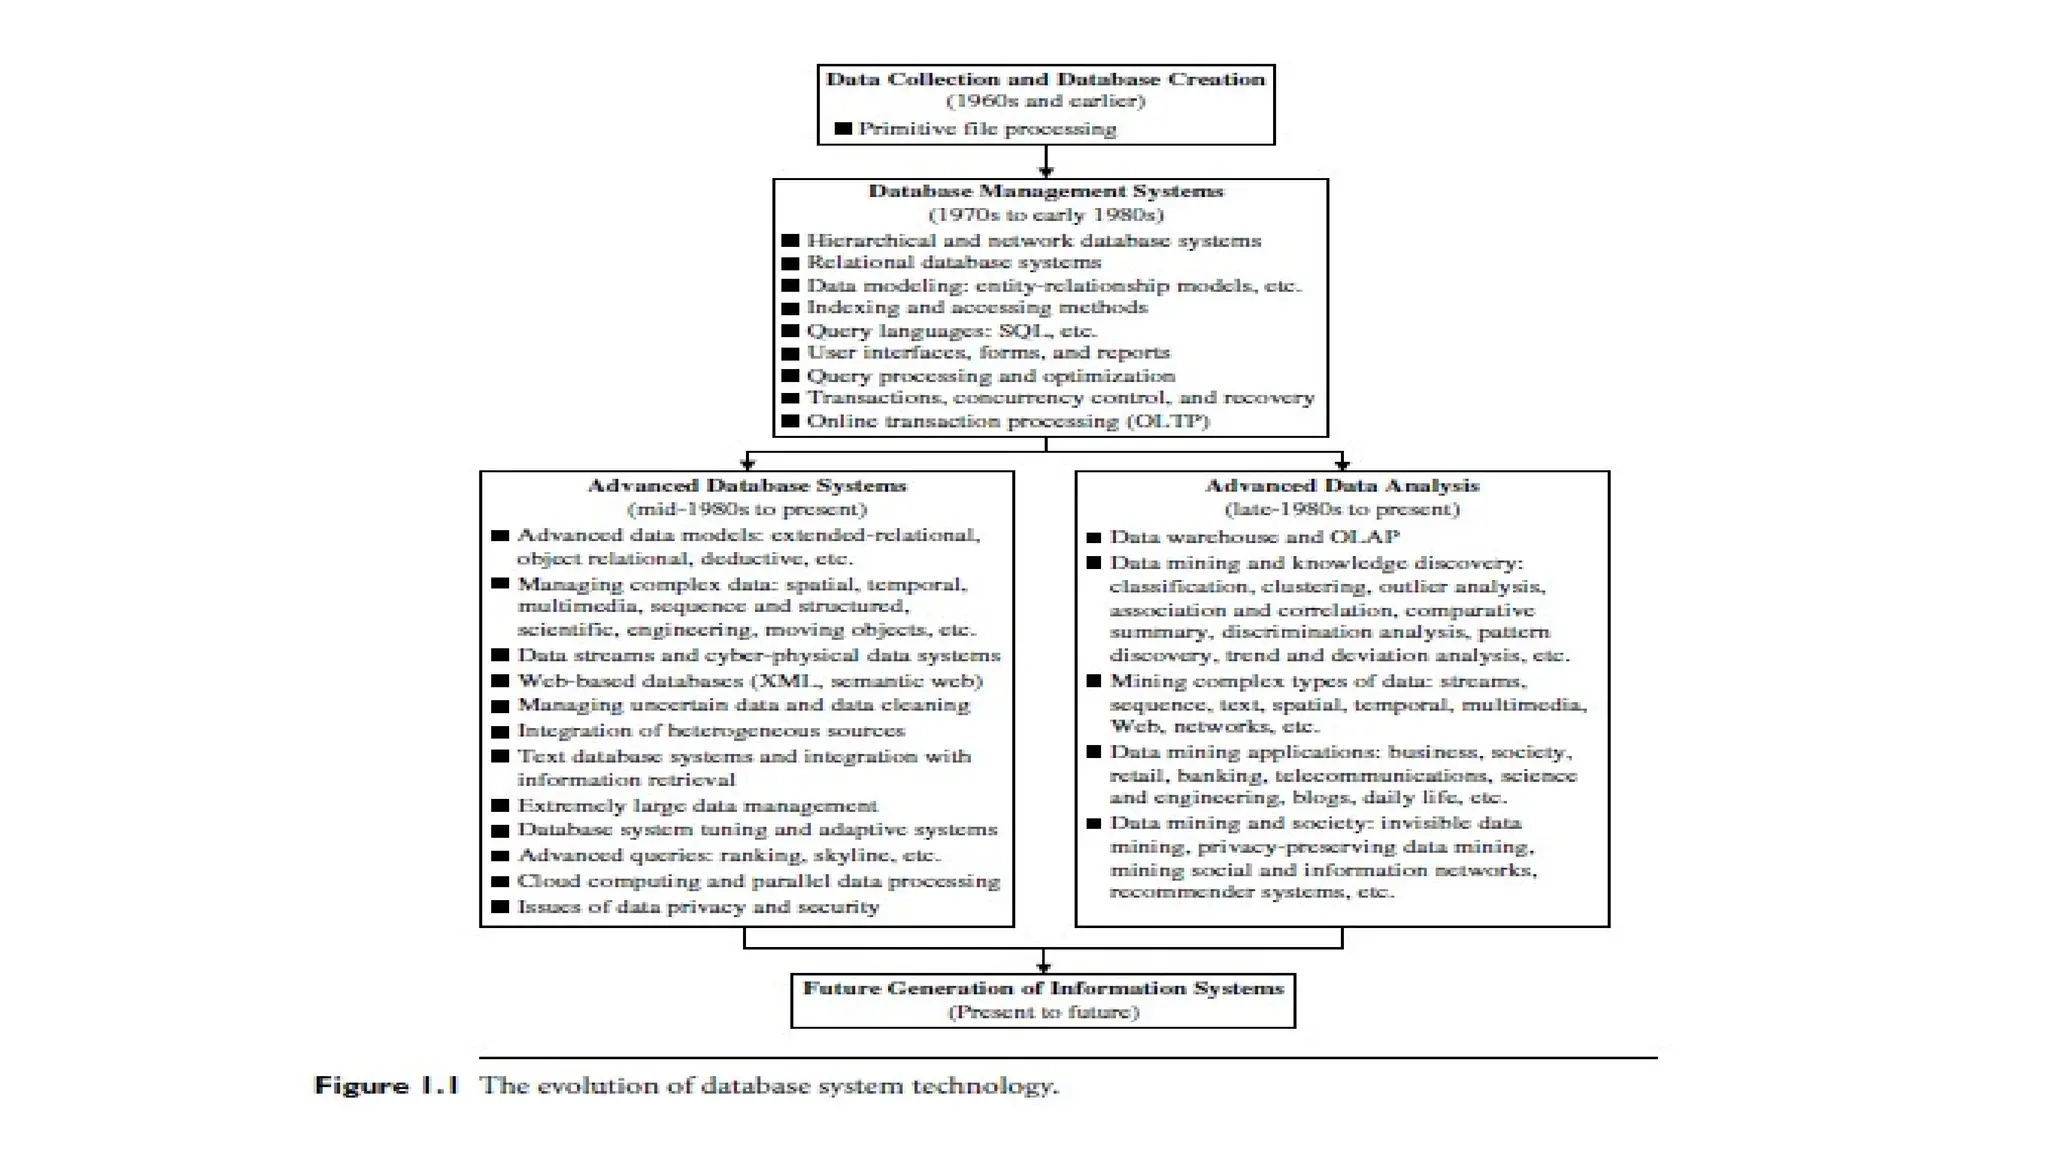
Data Mining asthe Evolution of Information Technology
Natural Evolution of IT:
• Data mining is the result of the continuous evolution in information technology,
particularly within the database and data management sectors.
Critical Functionalities in Data Management:
• The evolution of data management includes several key stages:
• Data Collection and Database Creation
• Data Storage, Retrieval, and Transaction Processing
• Advanced Data Analysis (including data warehousing and data mining).
Early Development:
• Early database systems laid the foundation for the creation of efficient storage,
retrieval, and query systems.
• These systems evolved from basic file processing to sophisticated database
systems.
10.
Advancements in DatabaseSystems:
• Starting from the 1970s, database systems advanced through
hierarchical and network models to relational database systems,
which store data in tables.
• This shift allowed for better data modeling, indexing, and easier user
access via query languages and interfaces.
Role of OLTP:
• Online Transaction Processing (OLTP) improved the efficiency of
databases by treating queries as read-only transactions, contributing
to the wide adoption of relational database technology for managing
large datasets.
11.
Data Mining asthe Next Step:
• The evolution from data storage and retrieval to advanced analysis has
naturally led to the rise of data mining, allowing for deeper insights and
knowledge extraction from large datasets.
New Data Models:
• From the mid-1980s onwards, research led to the creation of powerful
new data models such as extended-relational, object-oriented, object-
relational, and deductive models, expanding the capabilities of database
systems.
Application-Oriented Systems:
• Specialized database systems have emerged for specific applications,
including spatial, temporal, multimedia, active, stream and sensor,
scientific, engineering, and knowledge-based databases.
13.
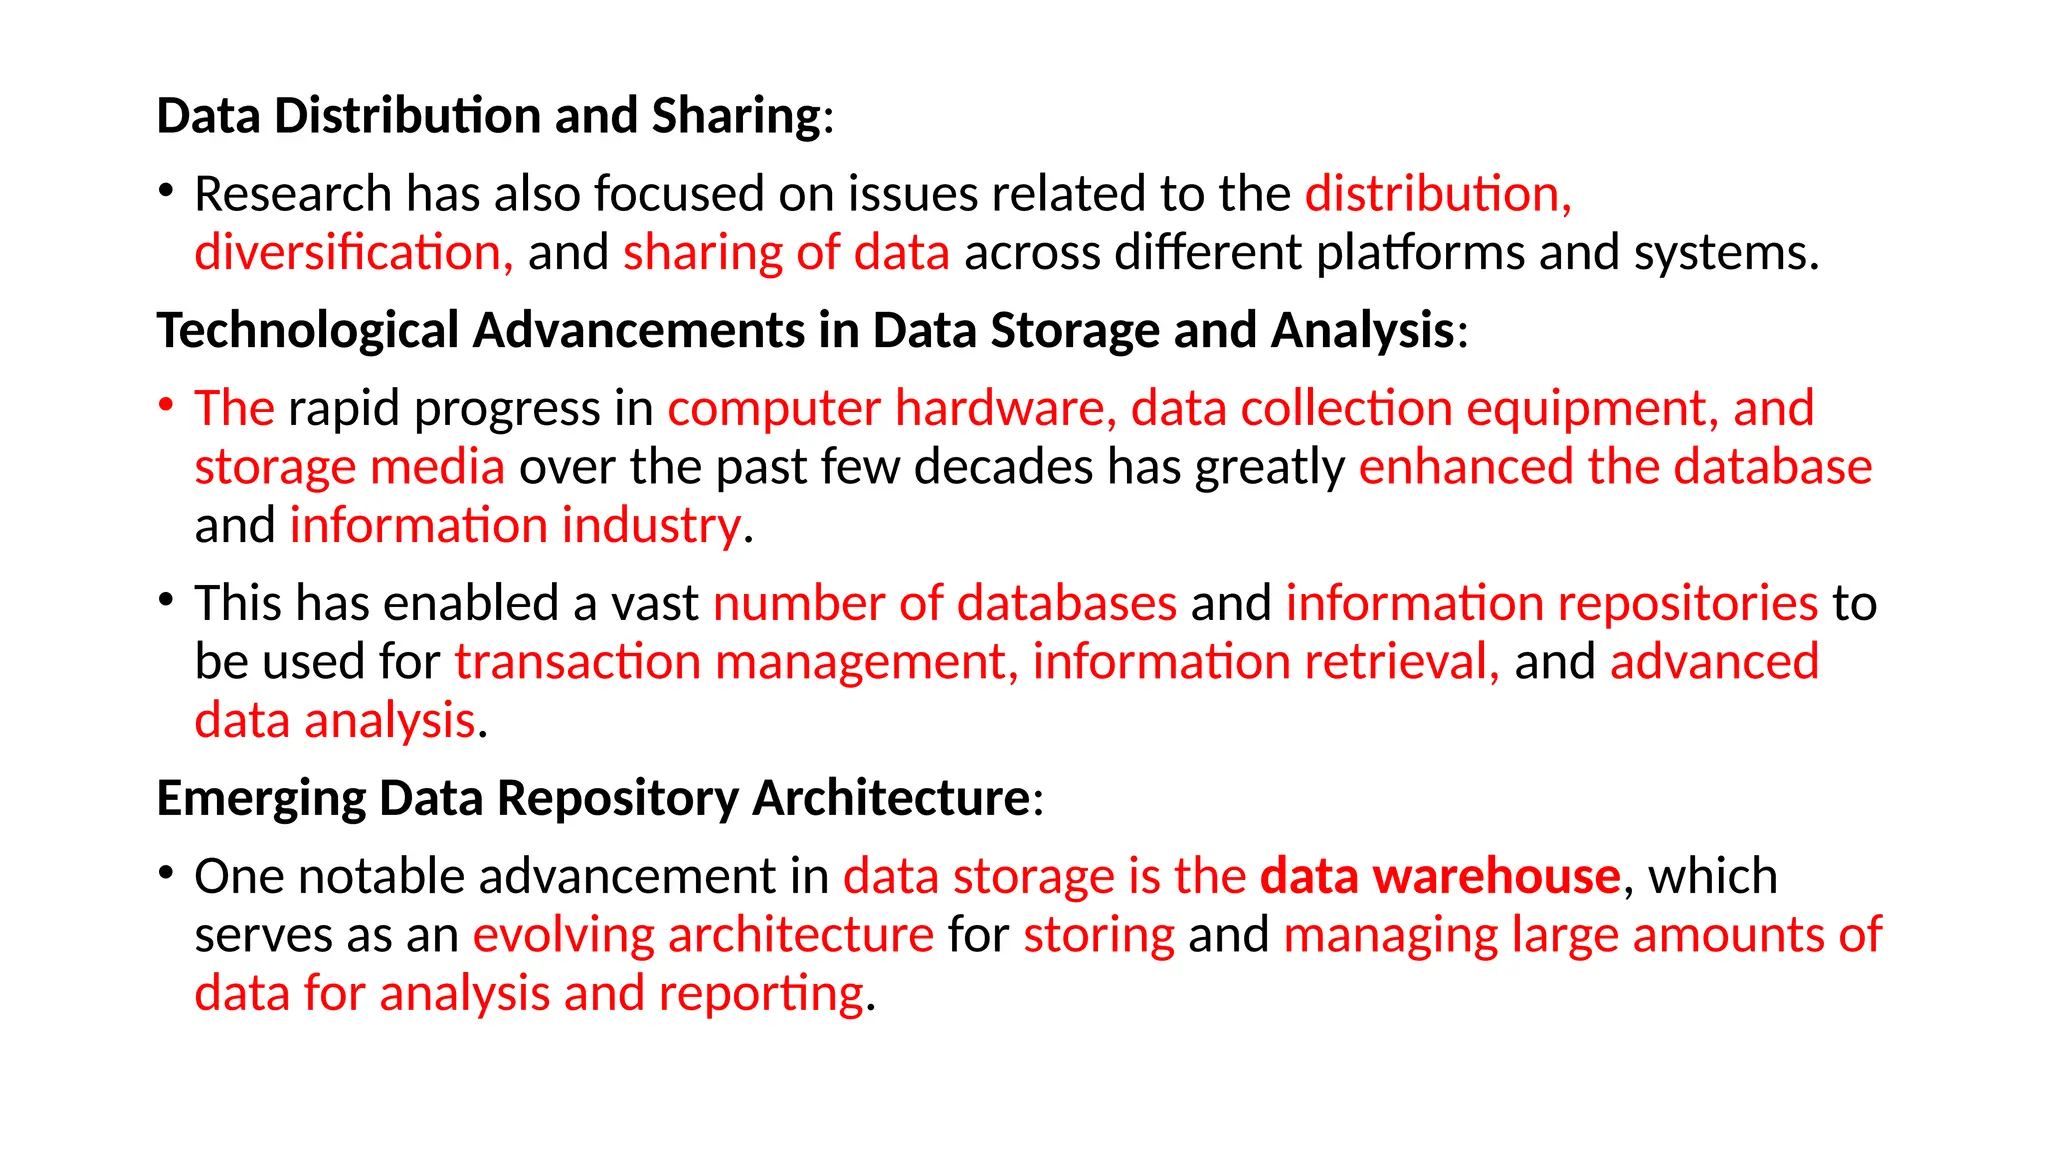
Data Distribution andSharing:
• Research has also focused on issues related to the distribution,
diversification, and sharing of data across different platforms and systems.
Technological Advancements in Data Storage and Analysis:
• The rapid progress in computer hardware, data collection equipment, and
storage media over the past few decades has greatly enhanced the database
and information industry.
• This has enabled a vast number of databases and information repositories to
be used for transaction management, information retrieval, and advanced
data analysis.
Emerging Data Repository Architecture:
• One notable advancement in data storage is the data warehouse, which
serves as an evolving architecture for storing and managing large amounts of
data for analysis and reporting.
14.
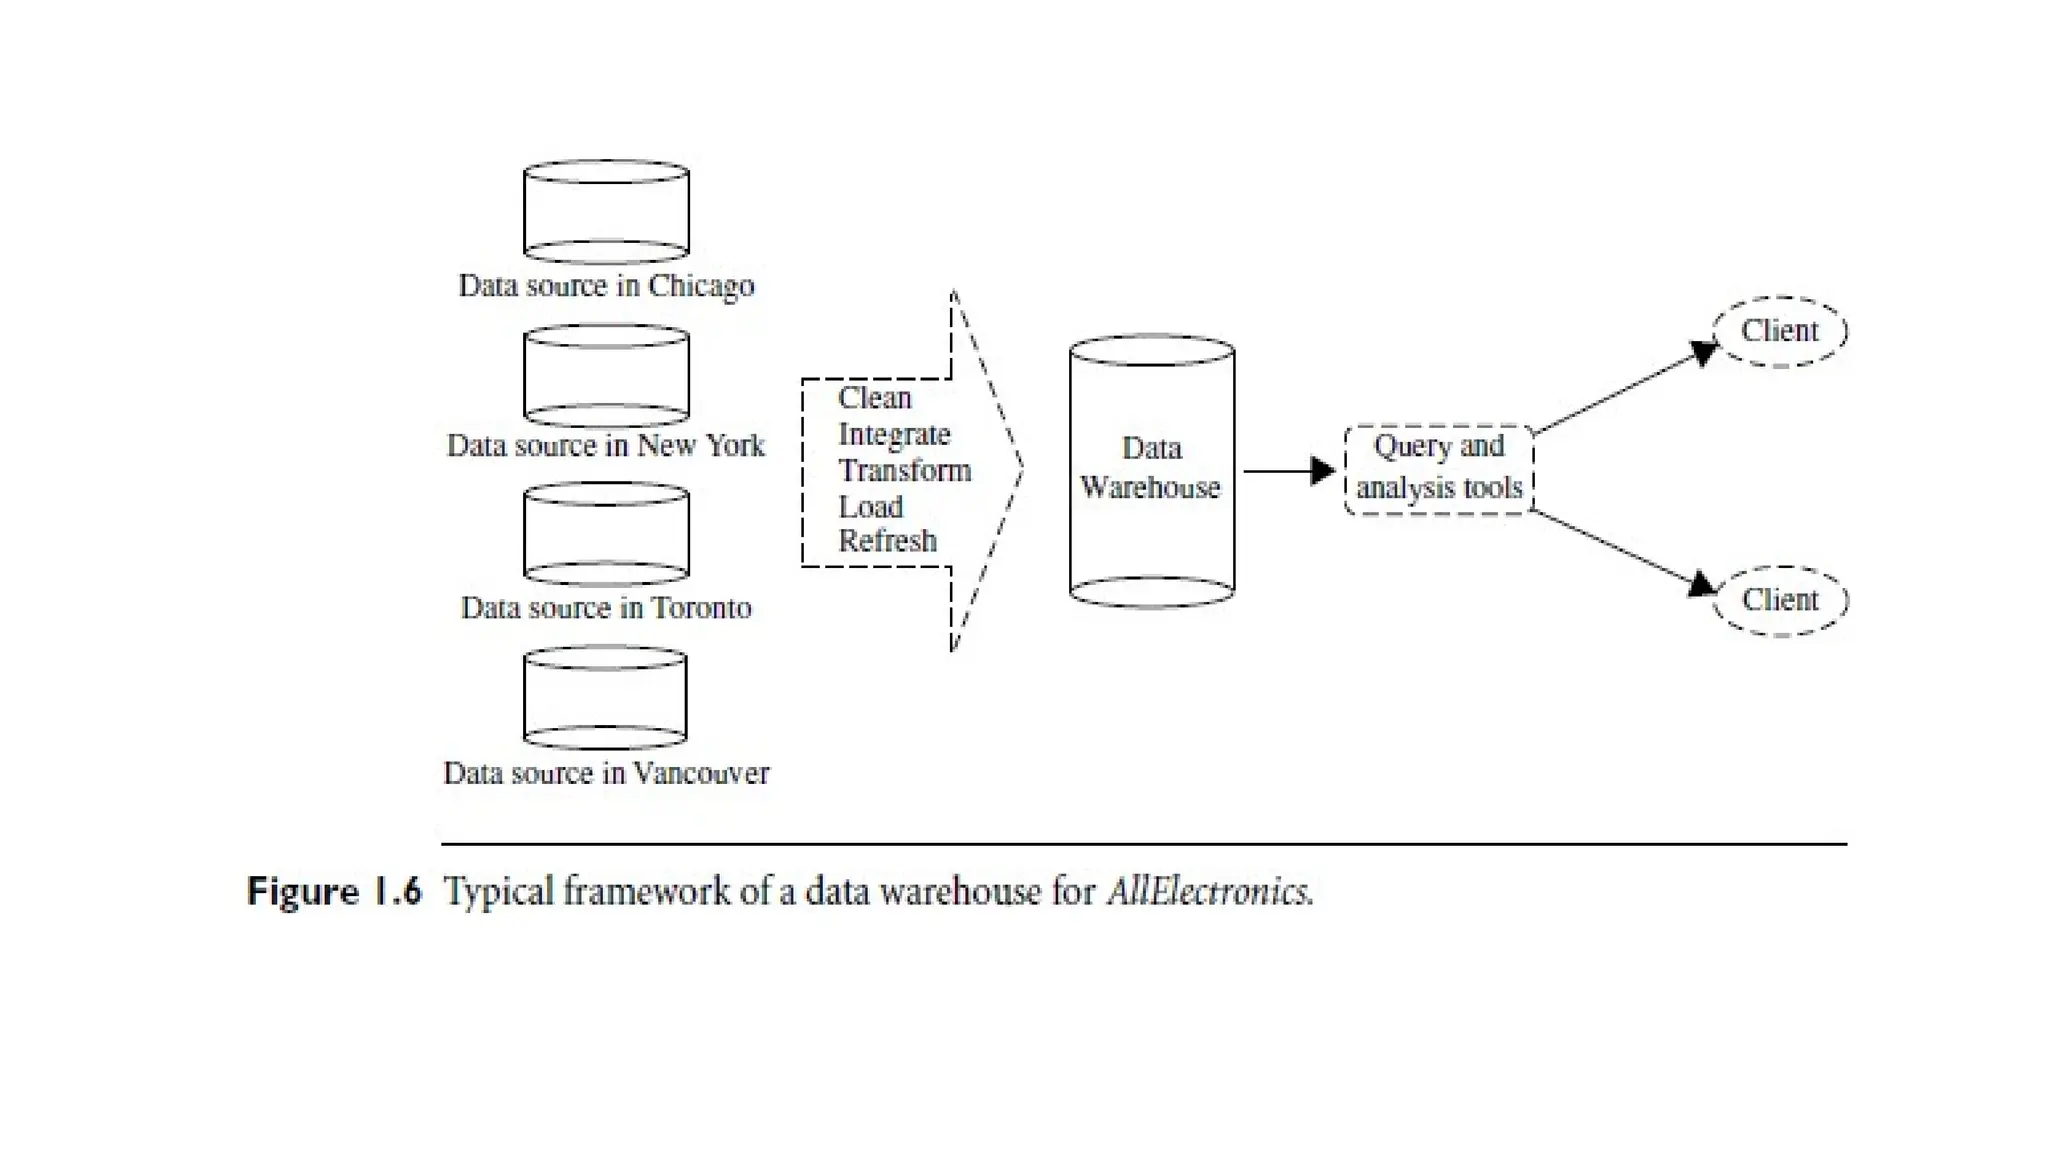
Data Warehouses andthe Need for Advanced Data Analysis Tools
Data Warehouse Technology:
• A data warehouse is a repository
• It integrates multiple heterogeneous data sources under a unified
schema to support decision-making.
• It includes essential components such as
- data cleaning,
- data integration, and
- online analytical processing (OLAP),
• Enables summarization, consolidation, and aggregation of data from
different perspectives.
15.
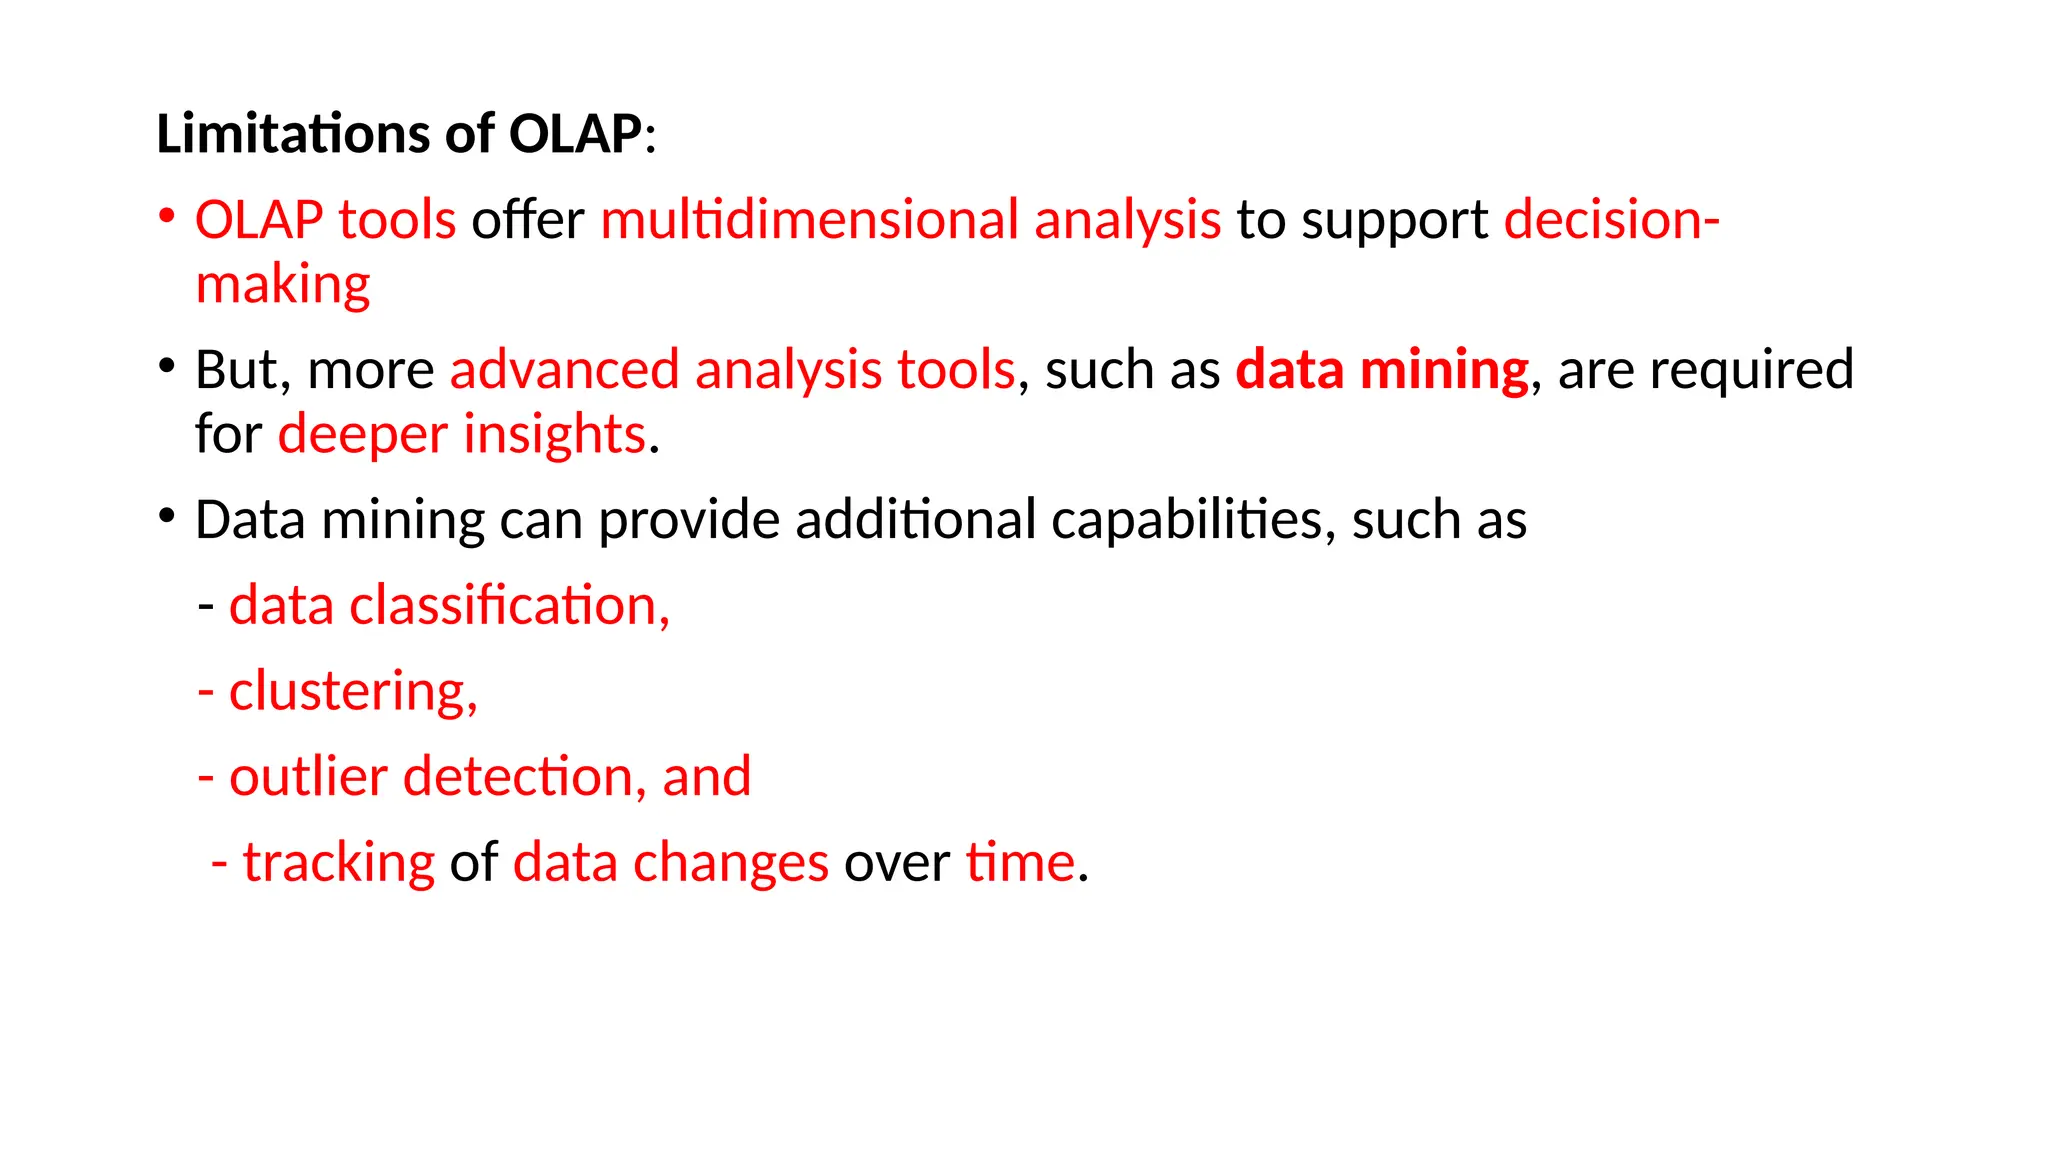
Limitations of OLAP:
•OLAP tools offer multidimensional analysis to support decision-
making
• But, more advanced analysis tools, such as data mining, are required
for deeper insights.
• Data mining can provide additional capabilities, such as
- data classification,
- clustering,
- outlier detection, and
- tracking of data changes over time.
16.
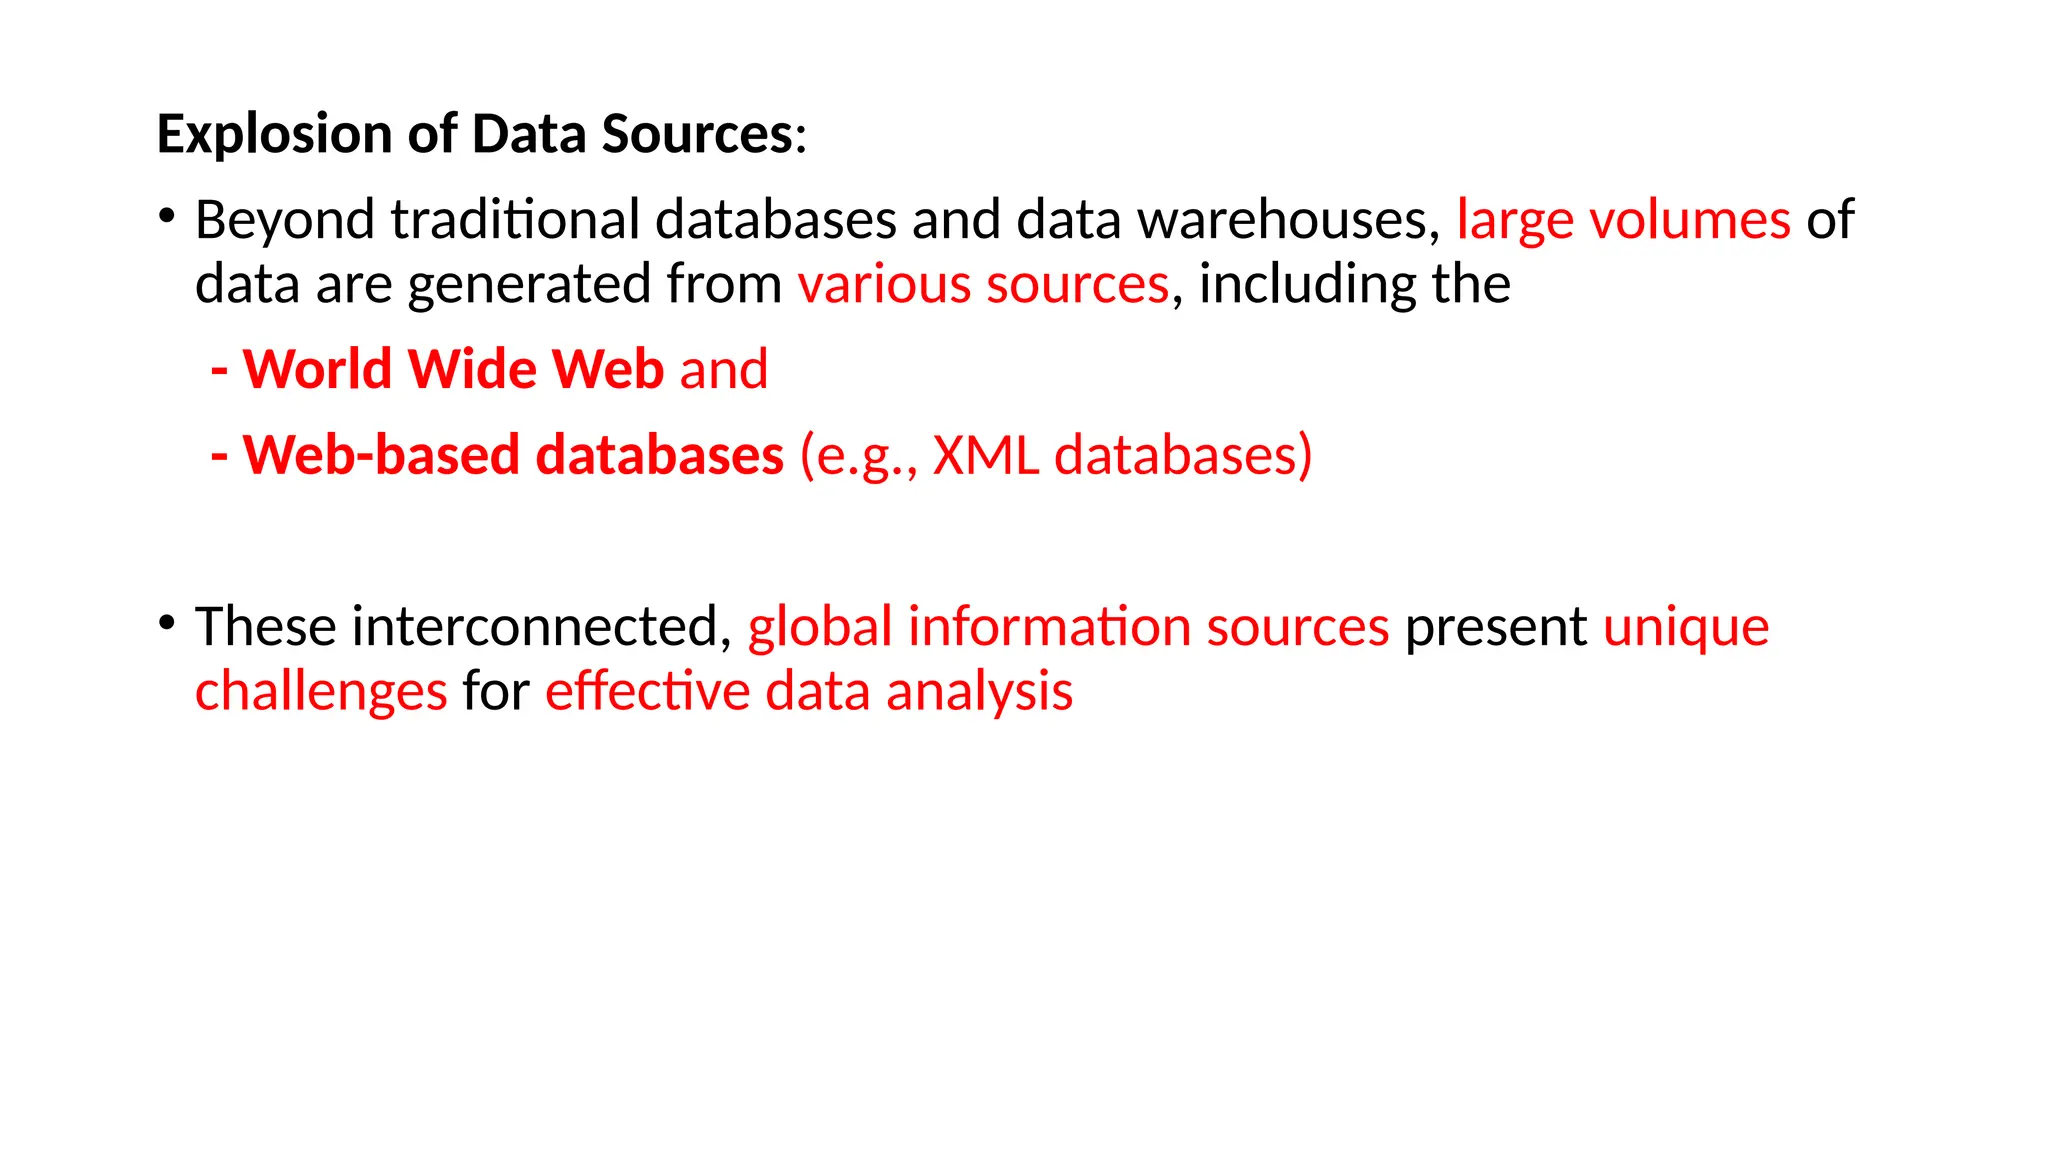
Explosion of DataSources:
• Beyond traditional databases and data warehouses, large volumes of
data are generated from various sources, including the
- World Wide Web and
- Web-based databases (e.g., XML databases)
• These interconnected, global information sources present unique
challenges for effective data analysis
17.
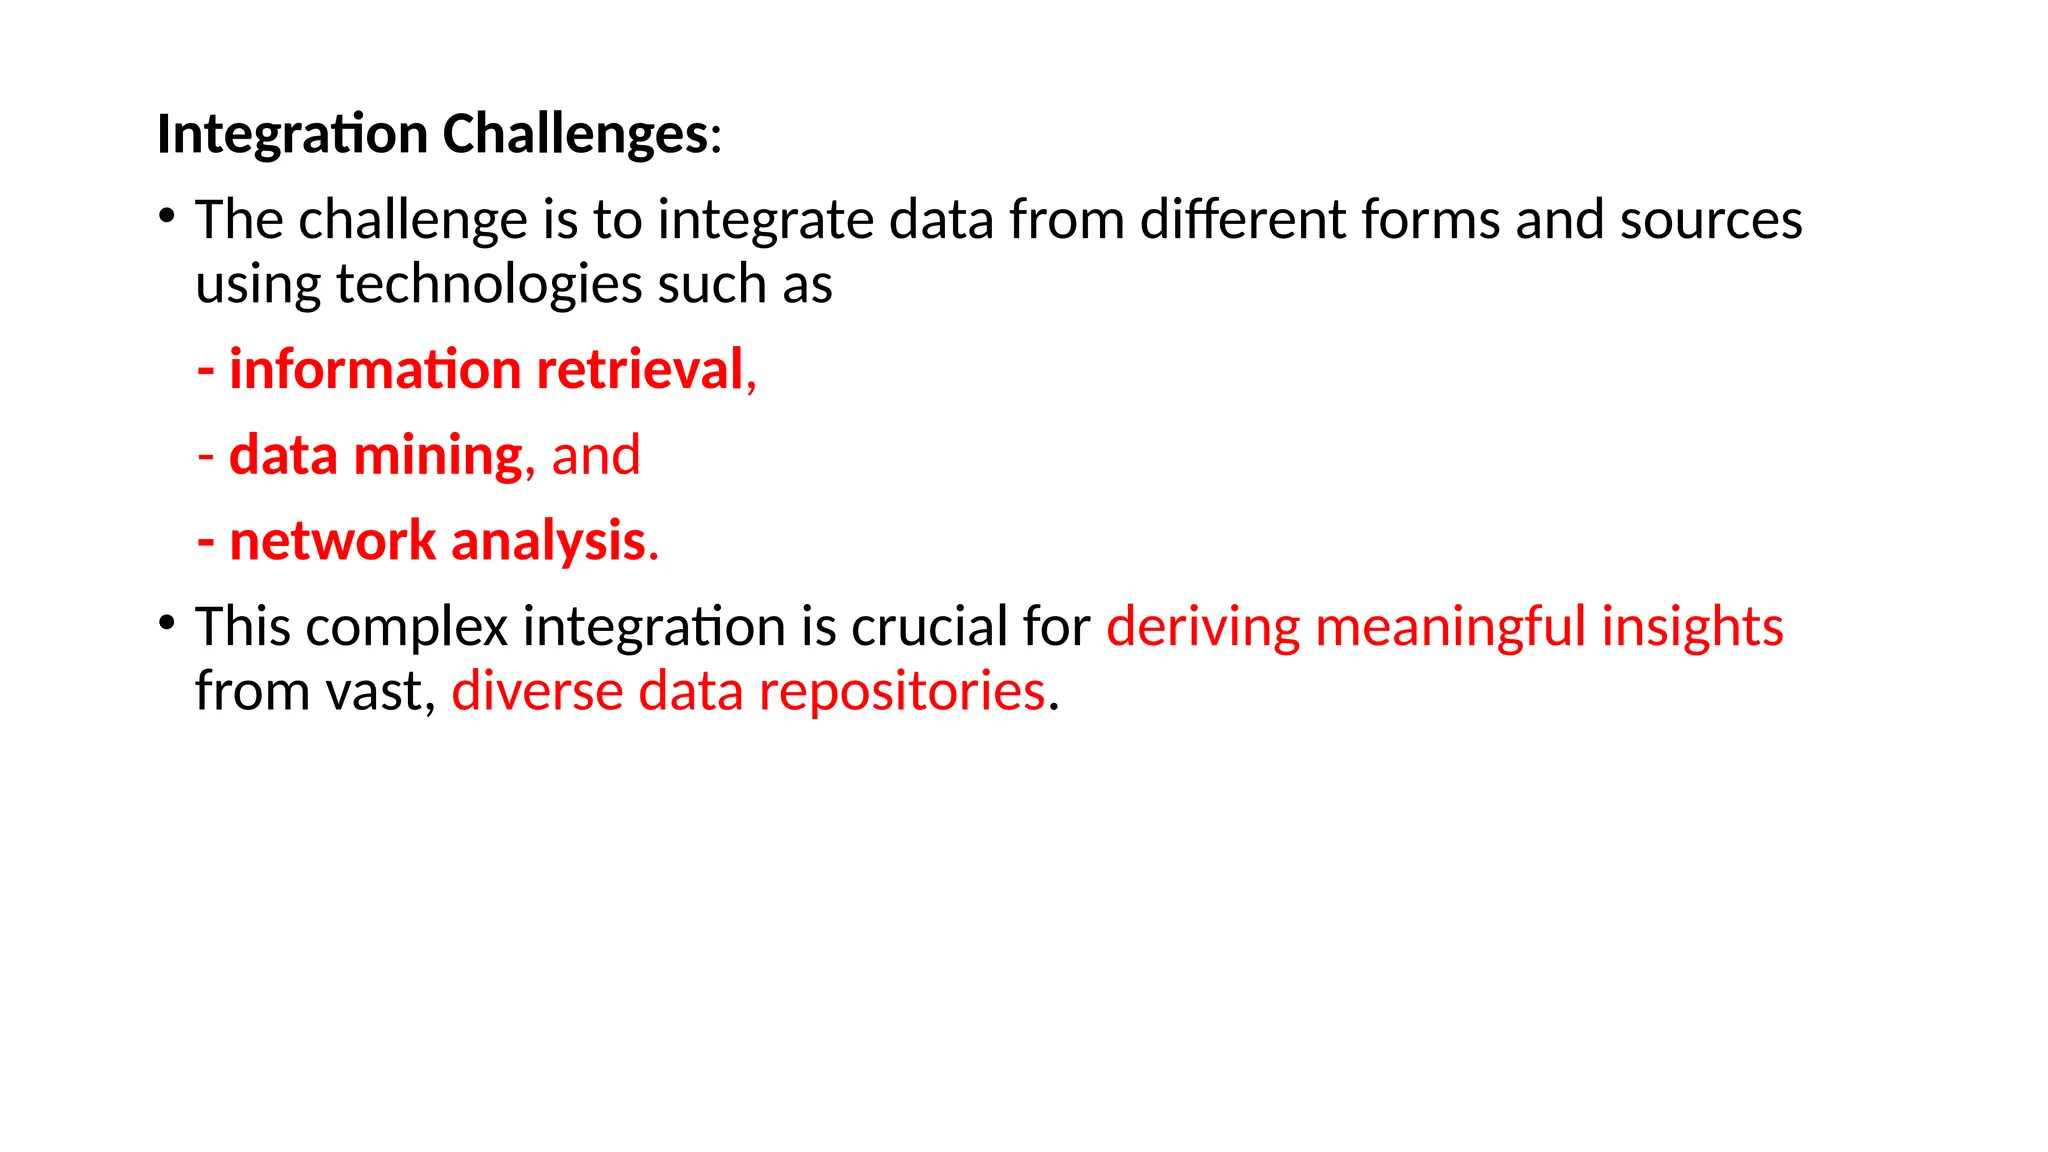
Integration Challenges:
• Thechallenge is to integrate data from different forms and sources
using technologies such as
- information retrieval,
- data mining, and
- network analysis.
• This complex integration is crucial for deriving meaningful insights
from vast, diverse data repositories.
18.
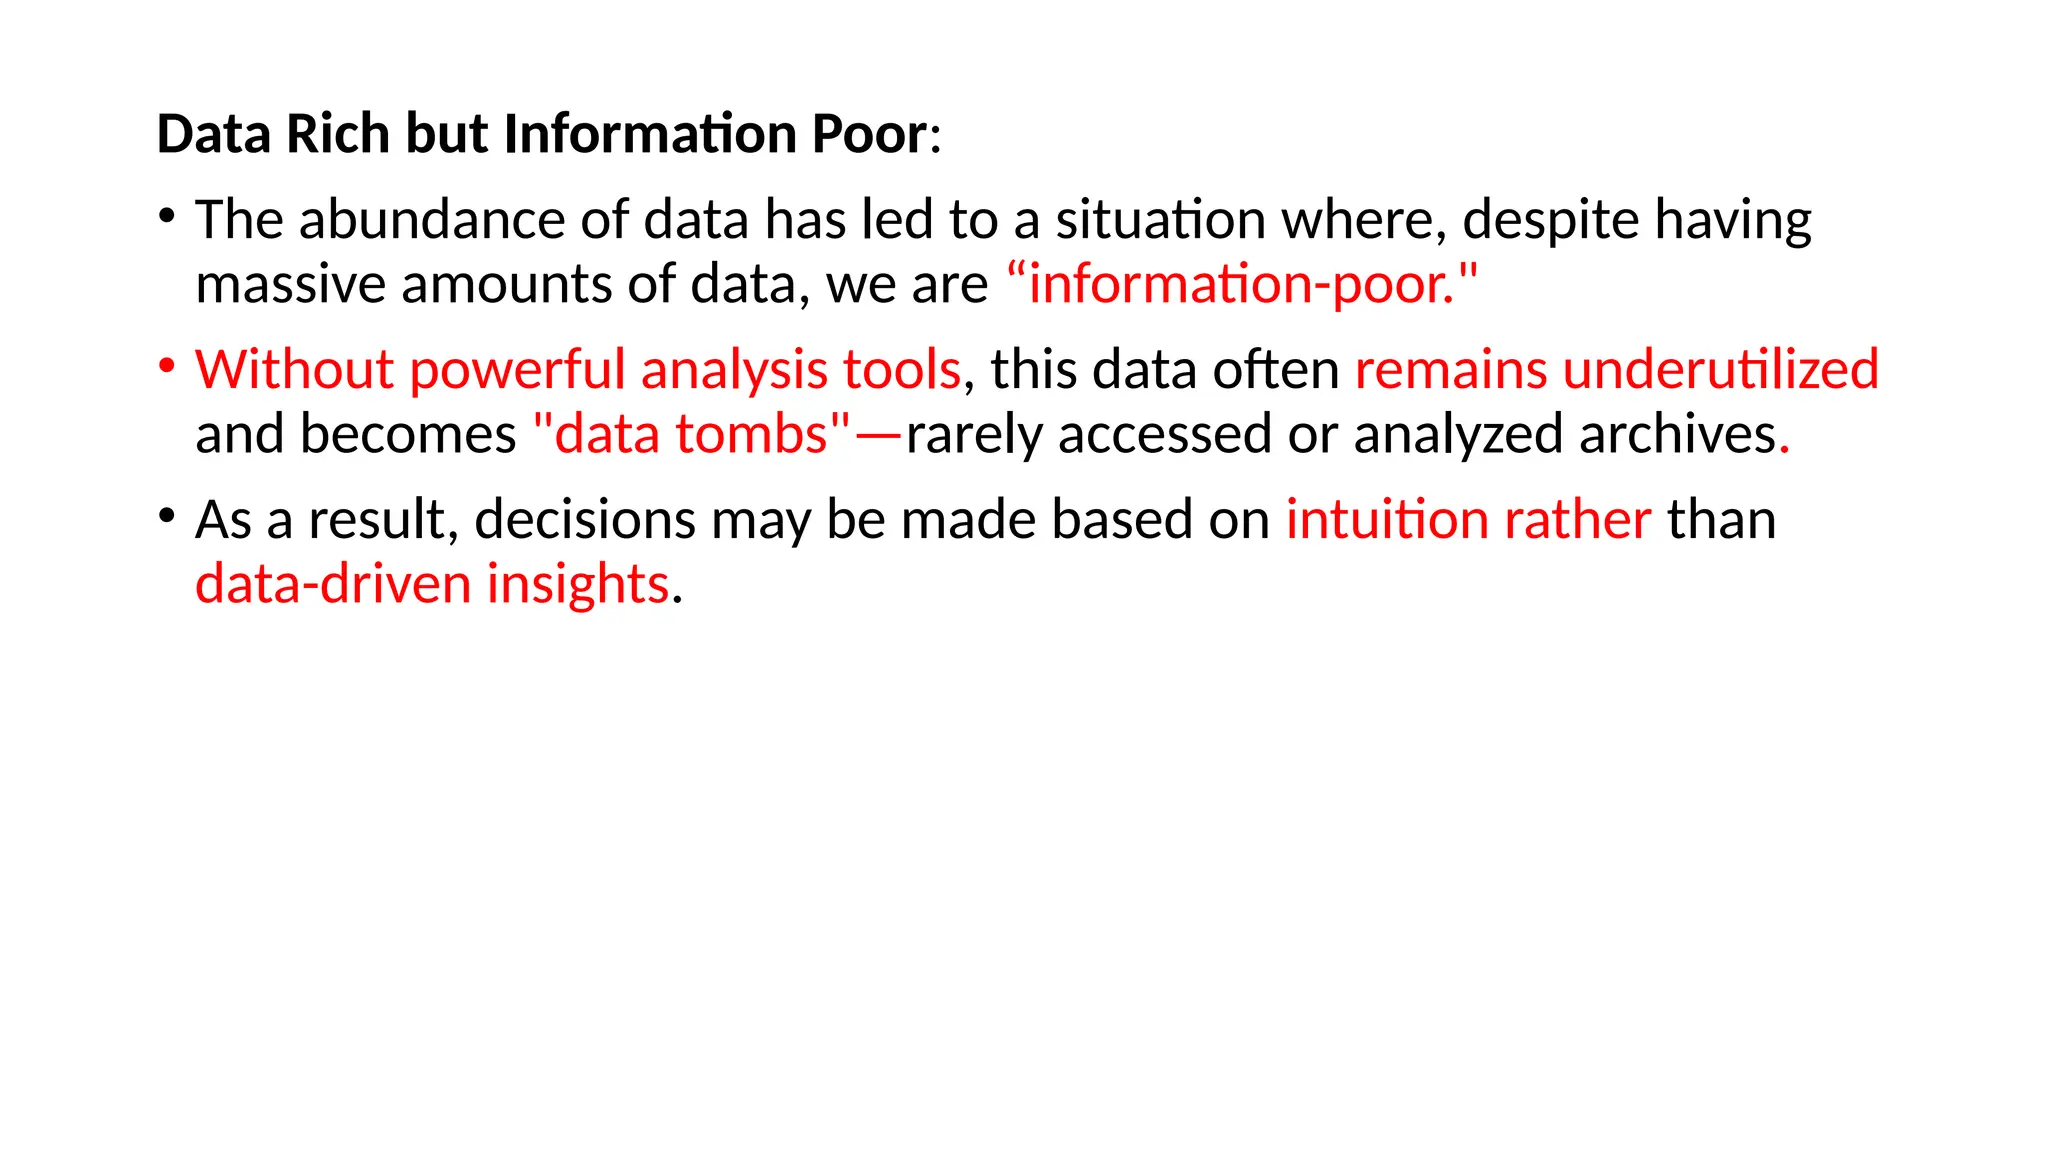
Data Rich butInformation Poor:
• The abundance of data has led to a situation where, despite having
massive amounts of data, we are “information-poor."
• Without powerful analysis tools, this data often remains underutilized
and becomes "data tombs"—rarely accessed or analyzed archives.
• As a result, decisions may be made based on intuition rather than
data-driven insights.
19.
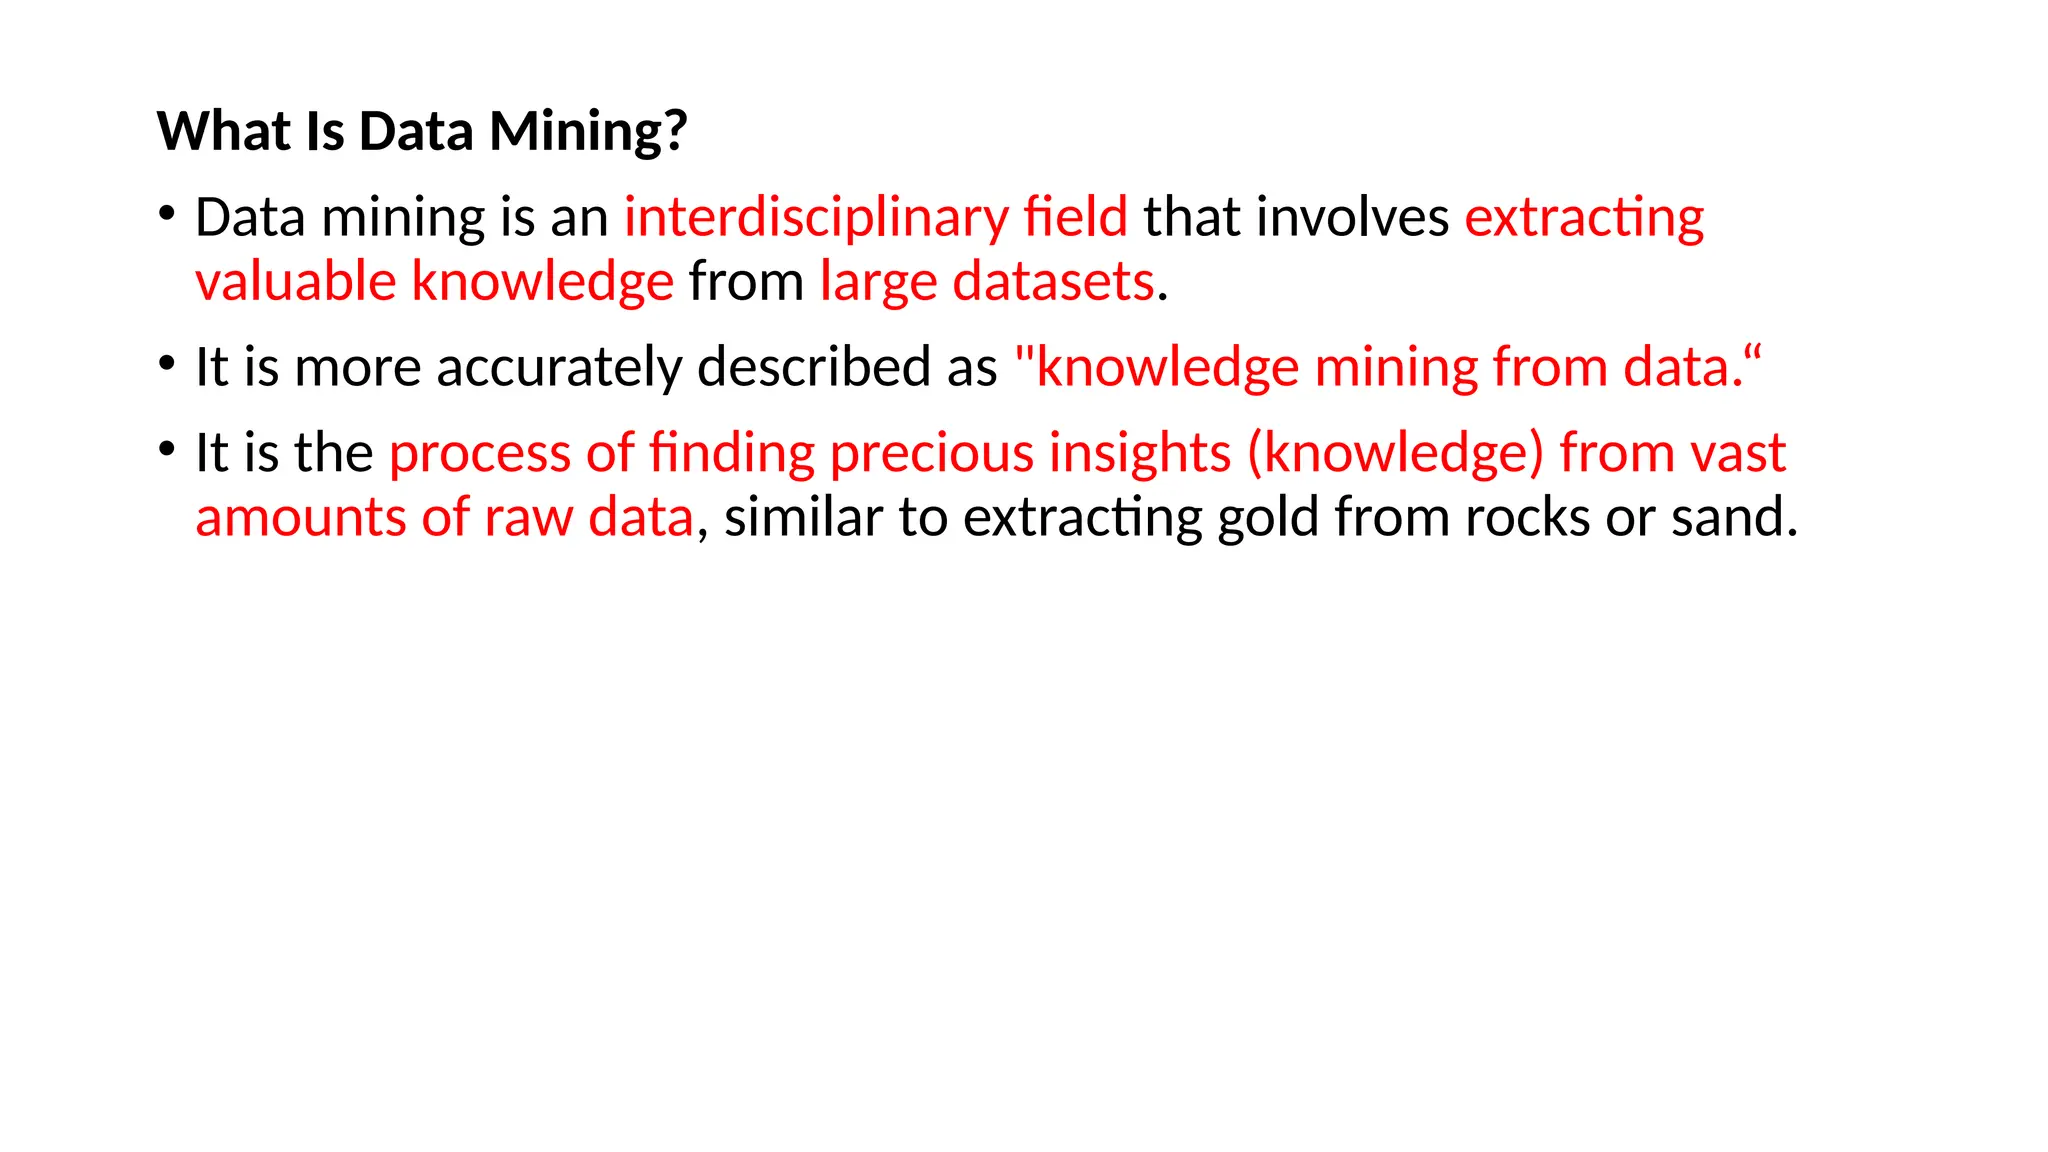
What Is DataMining?
• Data mining is an interdisciplinary field that involves extracting
valuable knowledge from large datasets.
• It is more accurately described as "knowledge mining from data.“
• It is the process of finding precious insights (knowledge) from vast
amounts of raw data, similar to extracting gold from rocks or sand.
20.
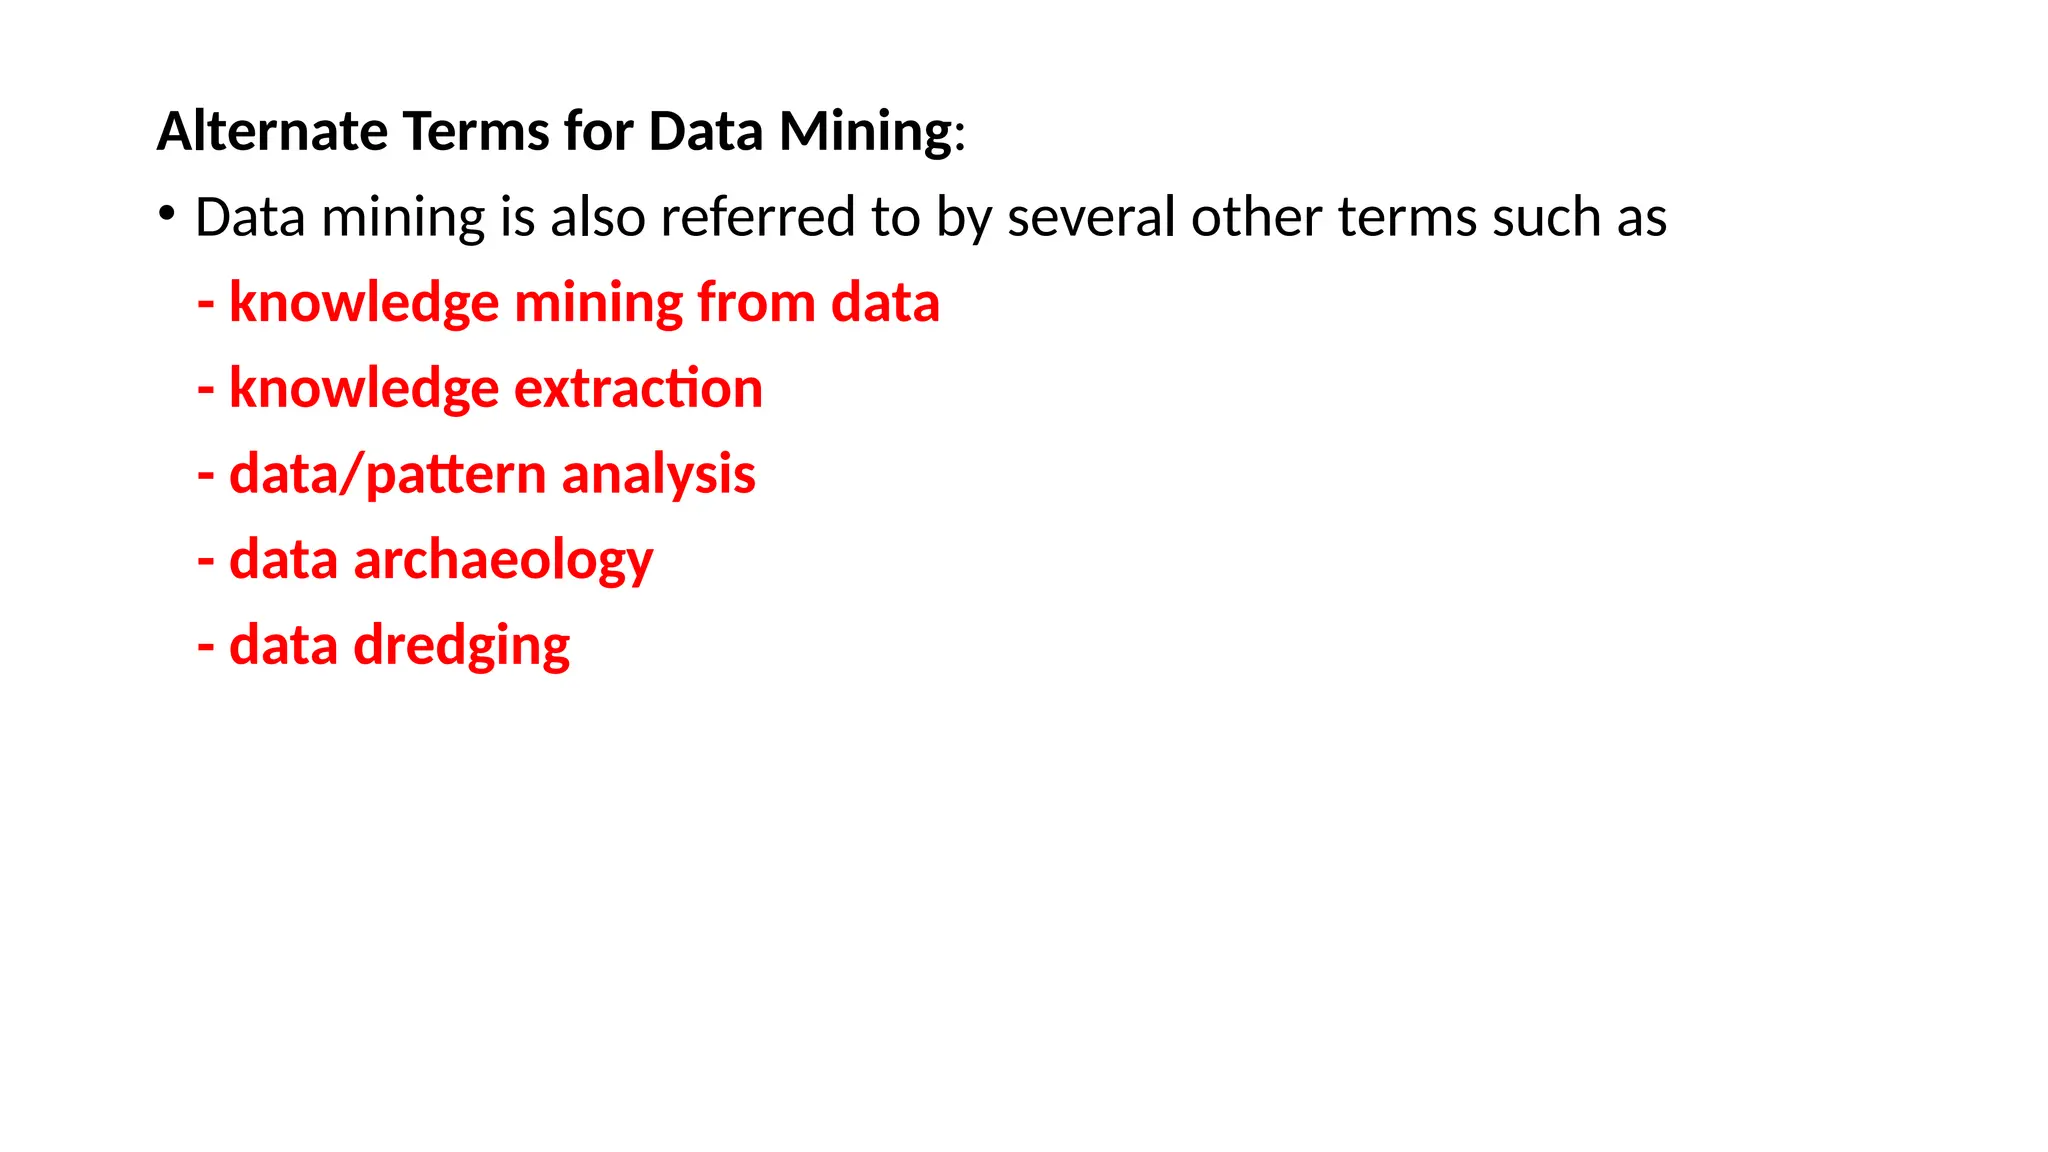
Alternate Terms forData Mining:
• Data mining is also referred to by several other terms such as
- knowledge mining from data
- knowledge extraction
- data/pattern analysis
- data archaeology
- data dredging
21.
Data Mining vs.Knowledge Discovery:
• Many people consider data mining to be synonymous with
Knowledge Discovery from Data (KDD), while others see it as just a
crucial step within the broader KDD process.
• The knowledge discovery process is iterative and involves several
steps, which include
- data preparation
- data cleaning
- pattern recognition
- actual mining of knowledge
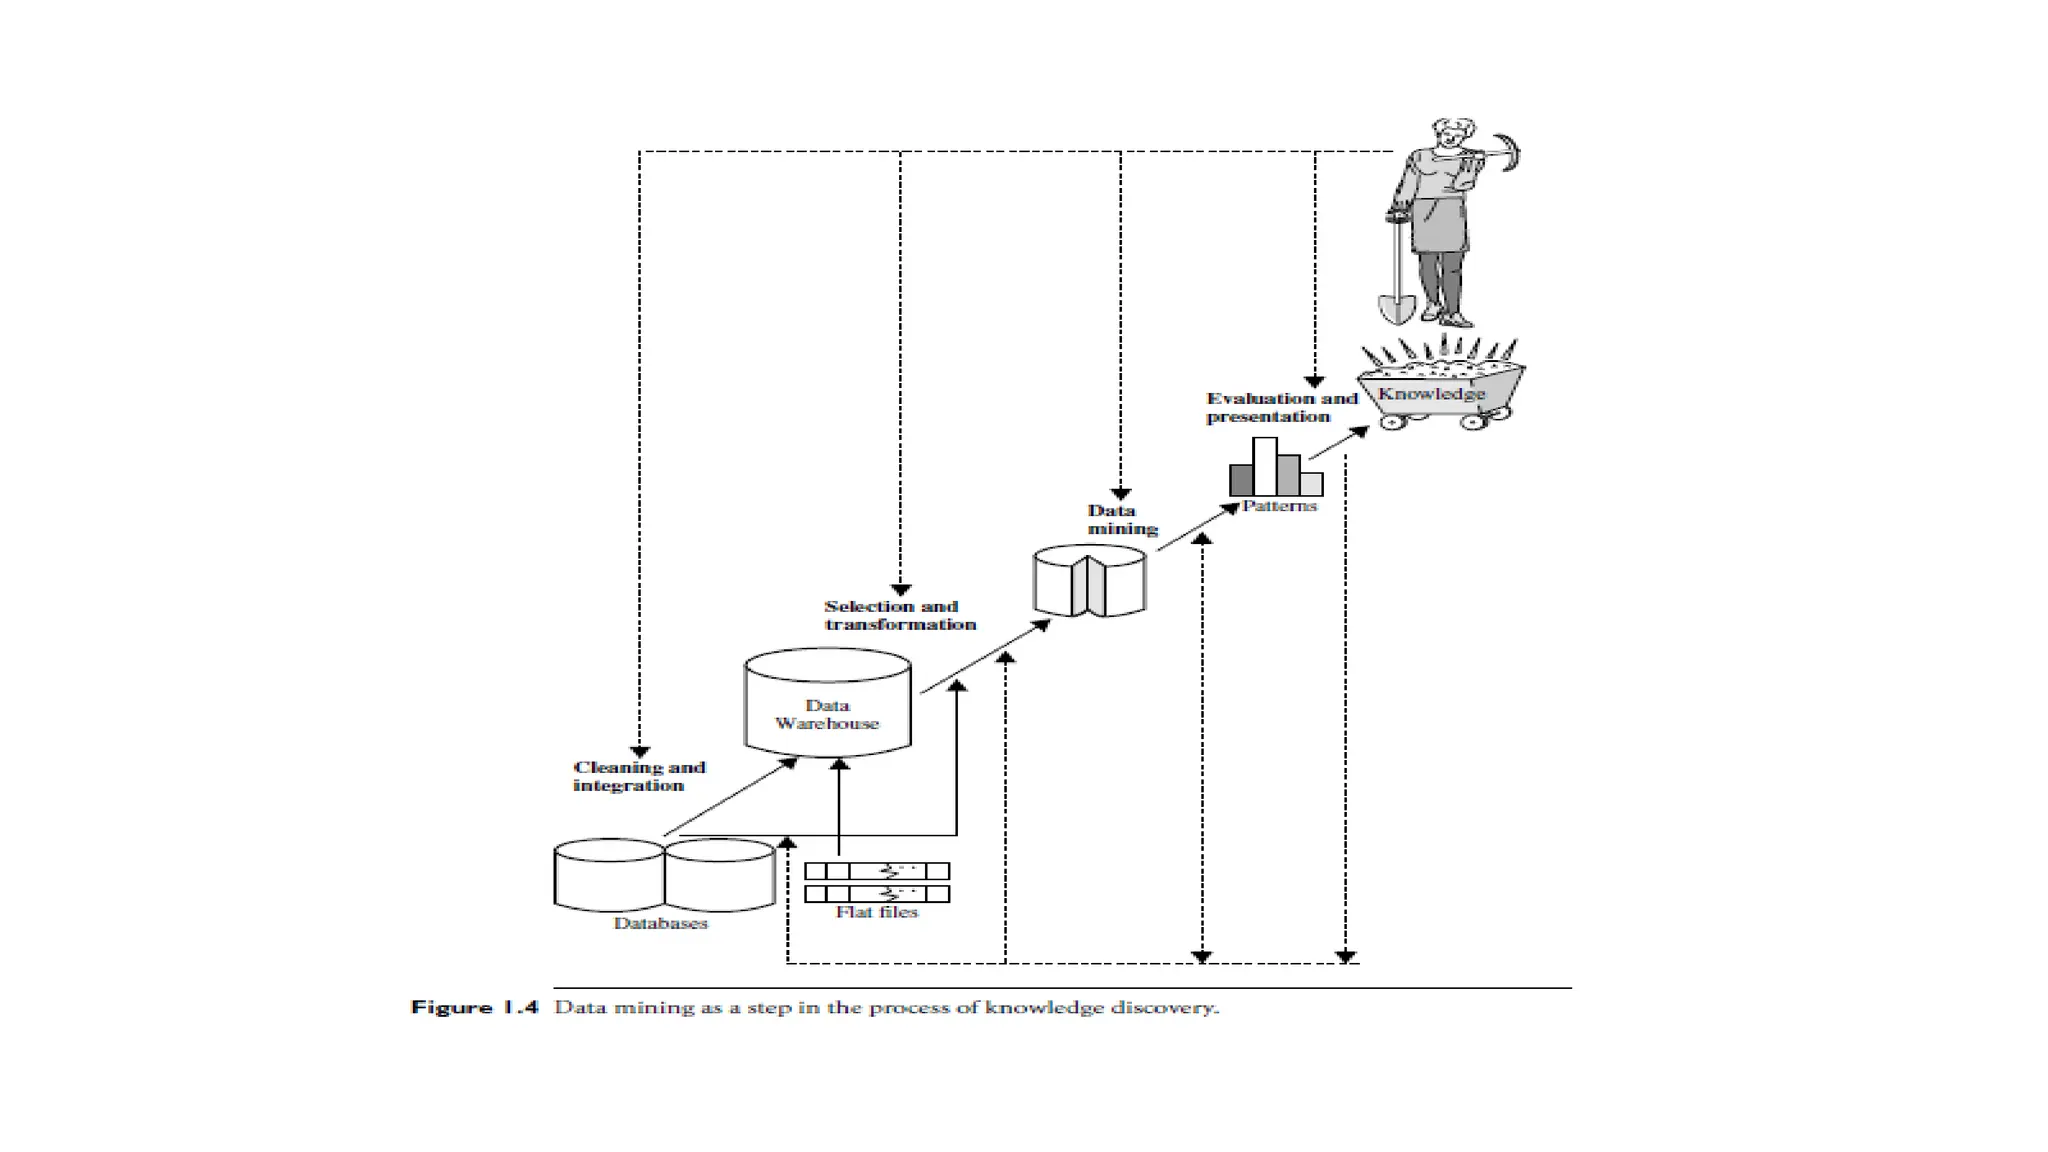
23.
1. Data cleaning(to remove noise and inconsistent data)
2. Data integration (where multiple data sources may be combined
3. Data selection (where data relevant to the analysis task are retrieved
from the database)
4. Data transformation (where data are transformed and consolidated
into forms appropriate for mining by performing summary or
aggregation operations)
5. Data mining (an essential process where intelligent methods are
applied to extract data patterns)
24.
6. Pattern evaluation(to identify the truly interesting patterns
representing knowledge based on interestingness measures)
7. Knowledge presentation (where visualization and knowledge
representation techniques are used to present mined knowledge to
users)
• Steps 1 through 4 are different forms of data preprocessing, where
data are prepared for mining.
• The data mining step may interact with the user or a knowledge base.
• The interesting patterns are presented to the user and may be stored
as new knowledge in the knowledge base.
25.
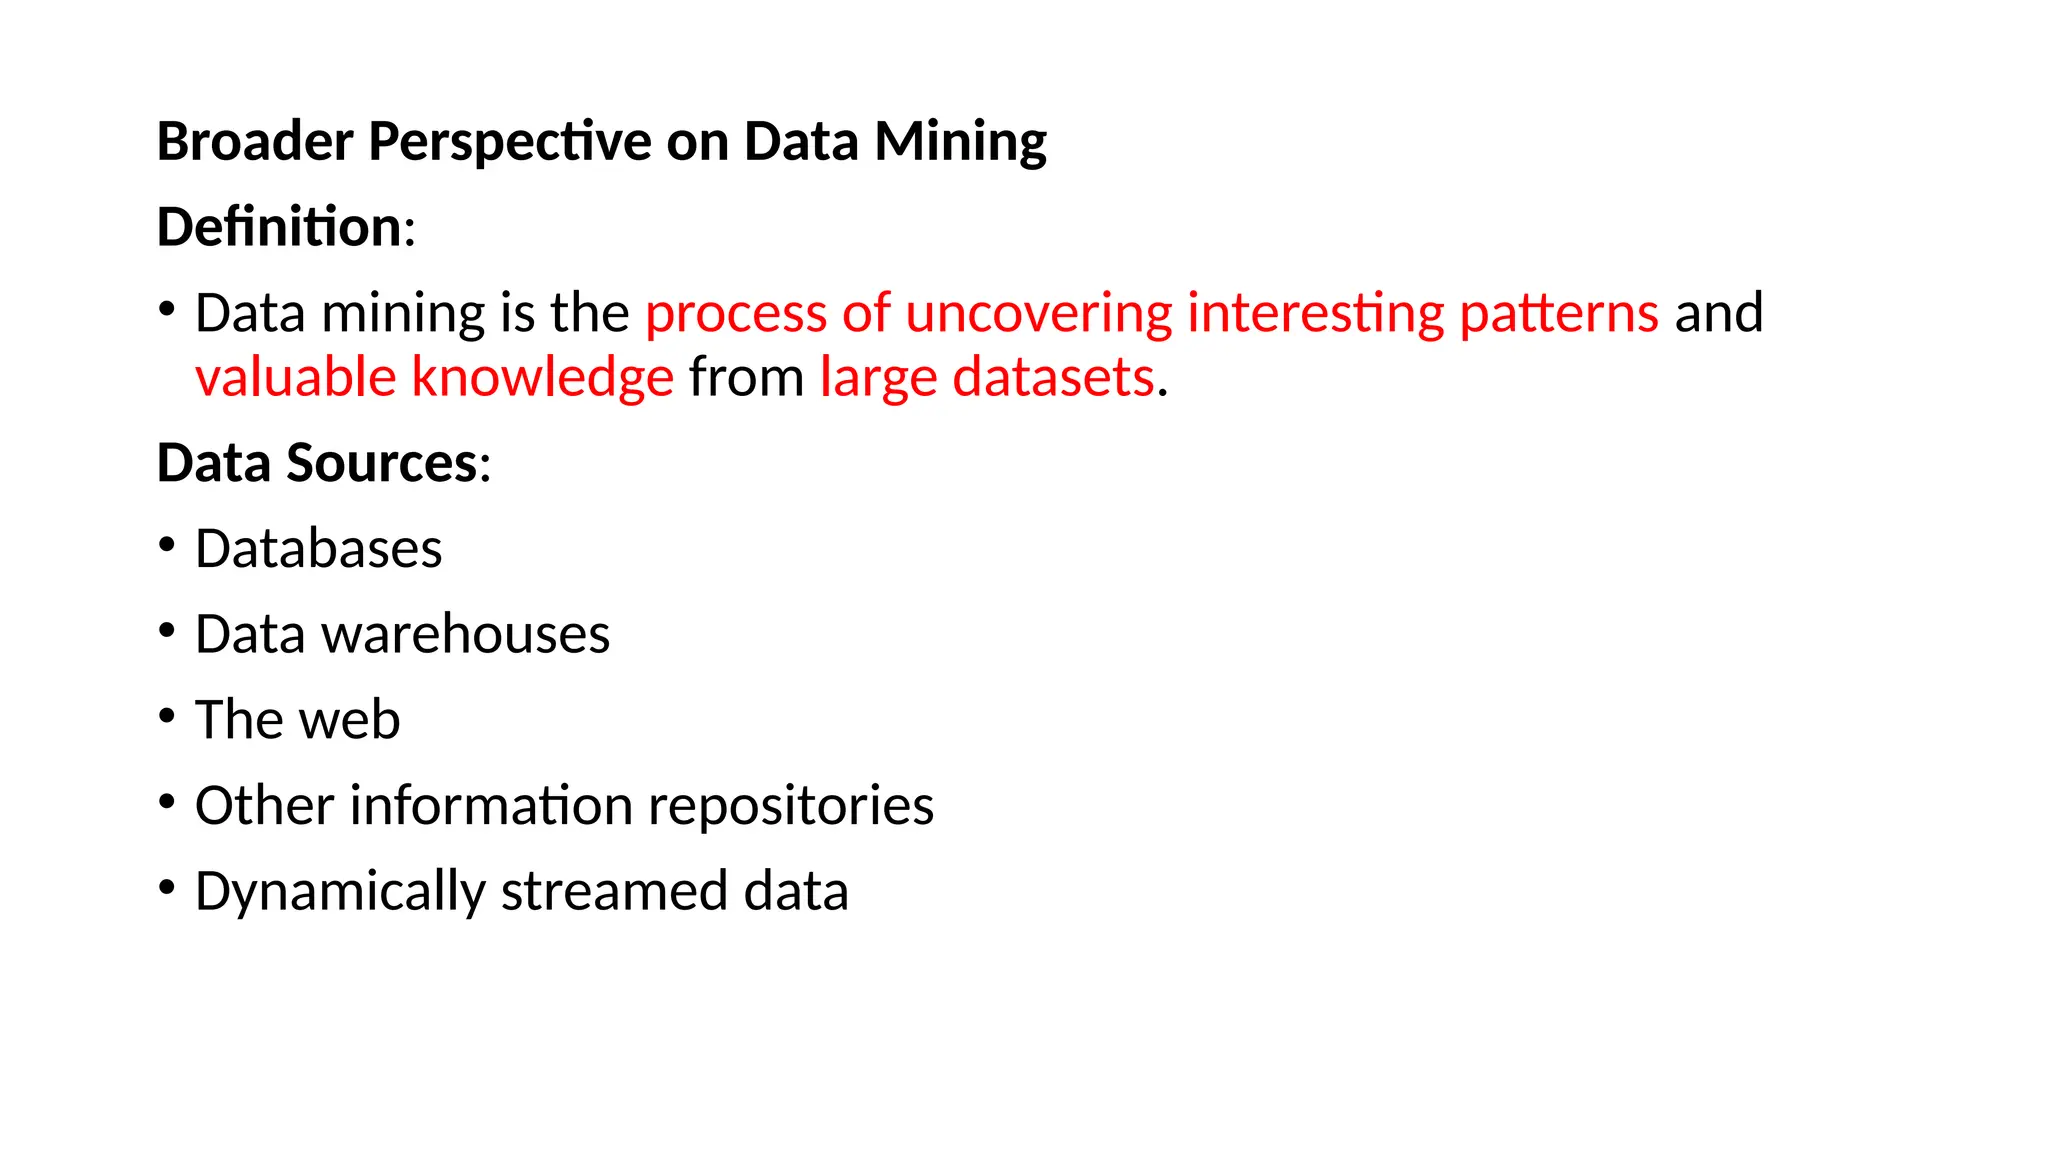
Broader Perspective onData Mining
Definition:
• Data mining is the process of uncovering interesting patterns and
valuable knowledge from large datasets.
Data Sources:
• Databases
• Data warehouses
• The web
• Other information repositories
• Dynamically streamed data
26.
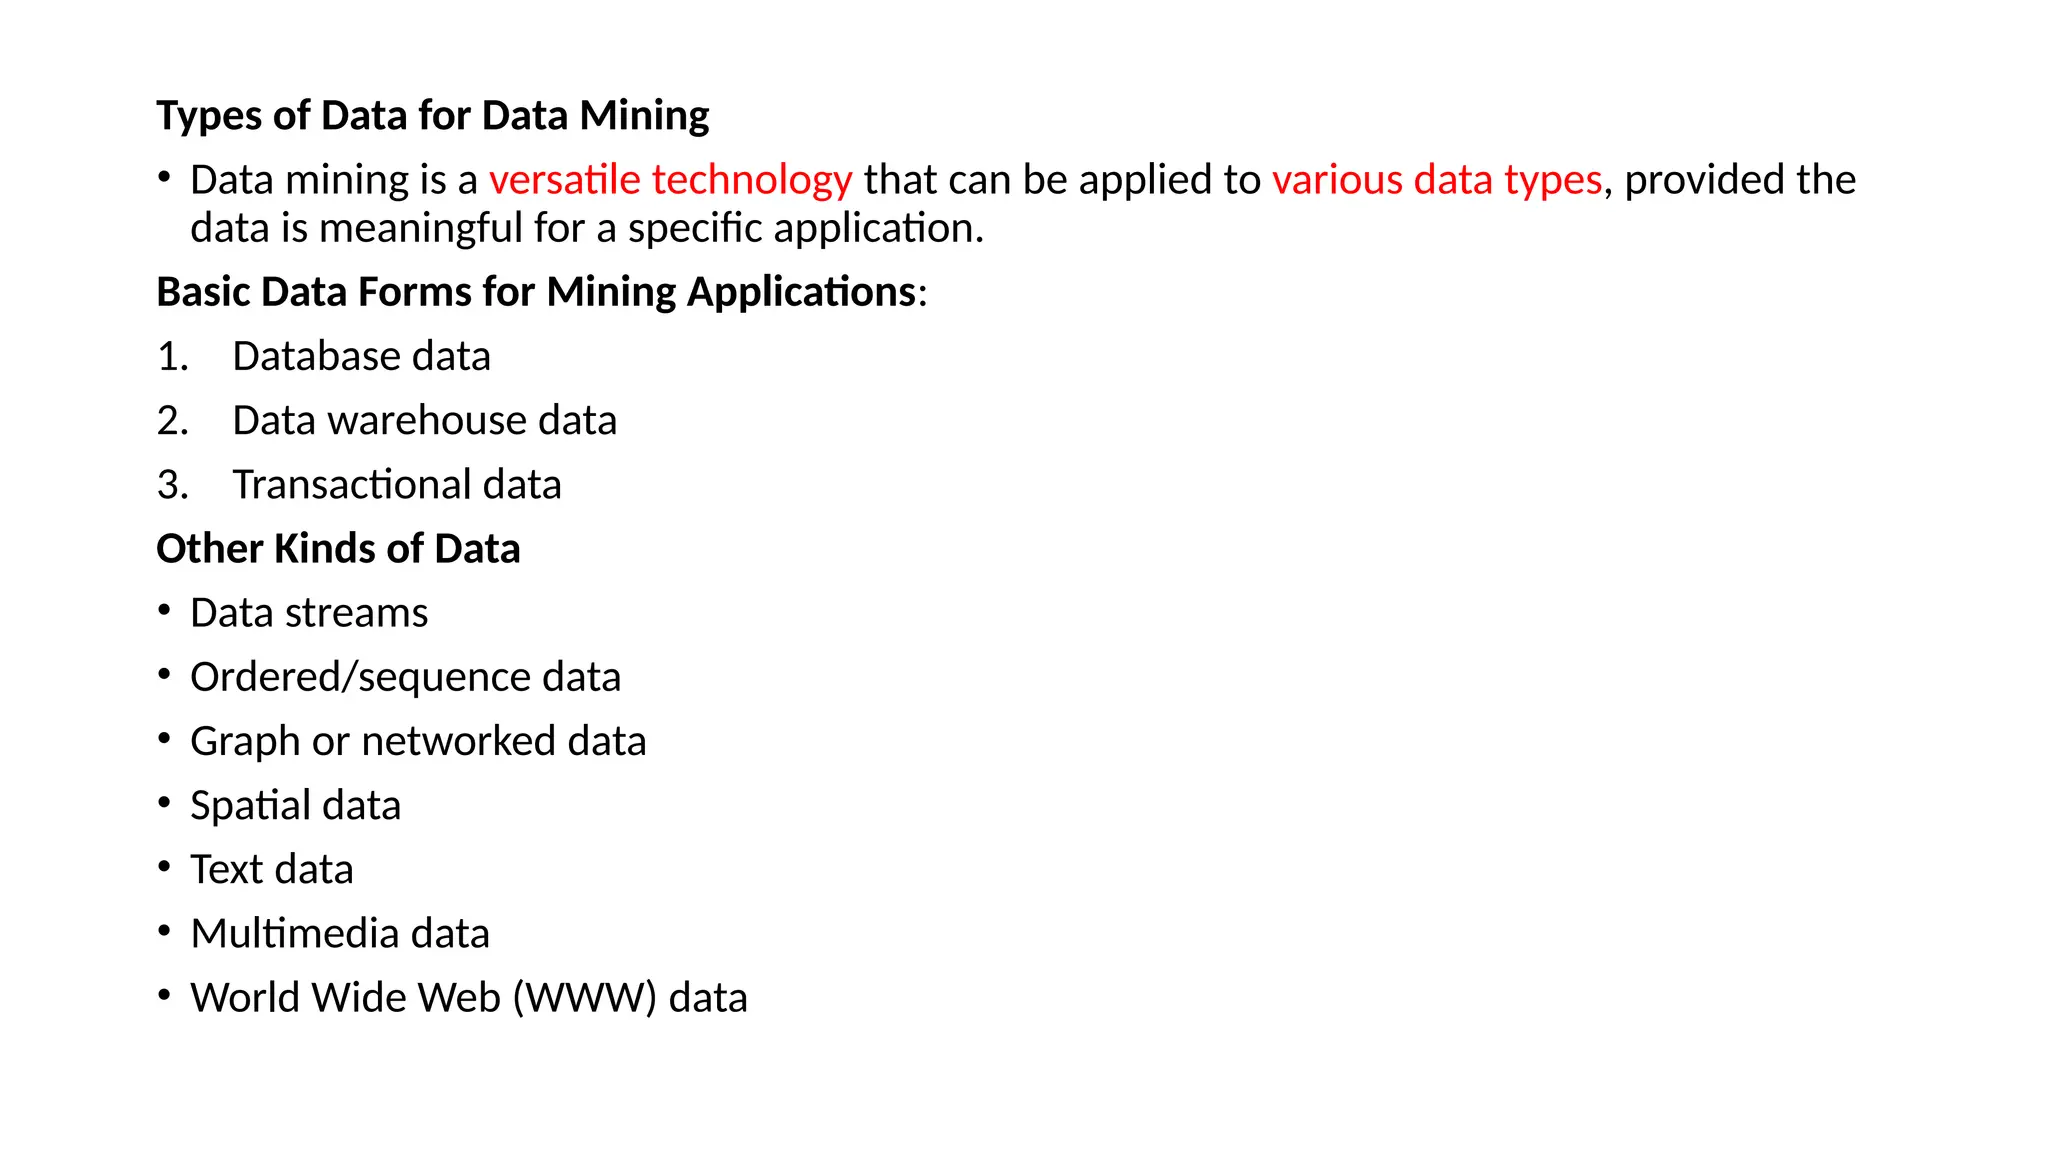
Types of Datafor Data Mining
• Data mining is a versatile technology that can be applied to various data types, provided the
data is meaningful for a specific application.
Basic Data Forms for Mining Applications:
1. Database data
2. Data warehouse data
3. Transactional data
Other Kinds of Data
• Data streams
• Ordered/sequence data
• Graph or networked data
• Spatial data
• Text data
• Multimedia data
• World Wide Web (WWW) data
27.
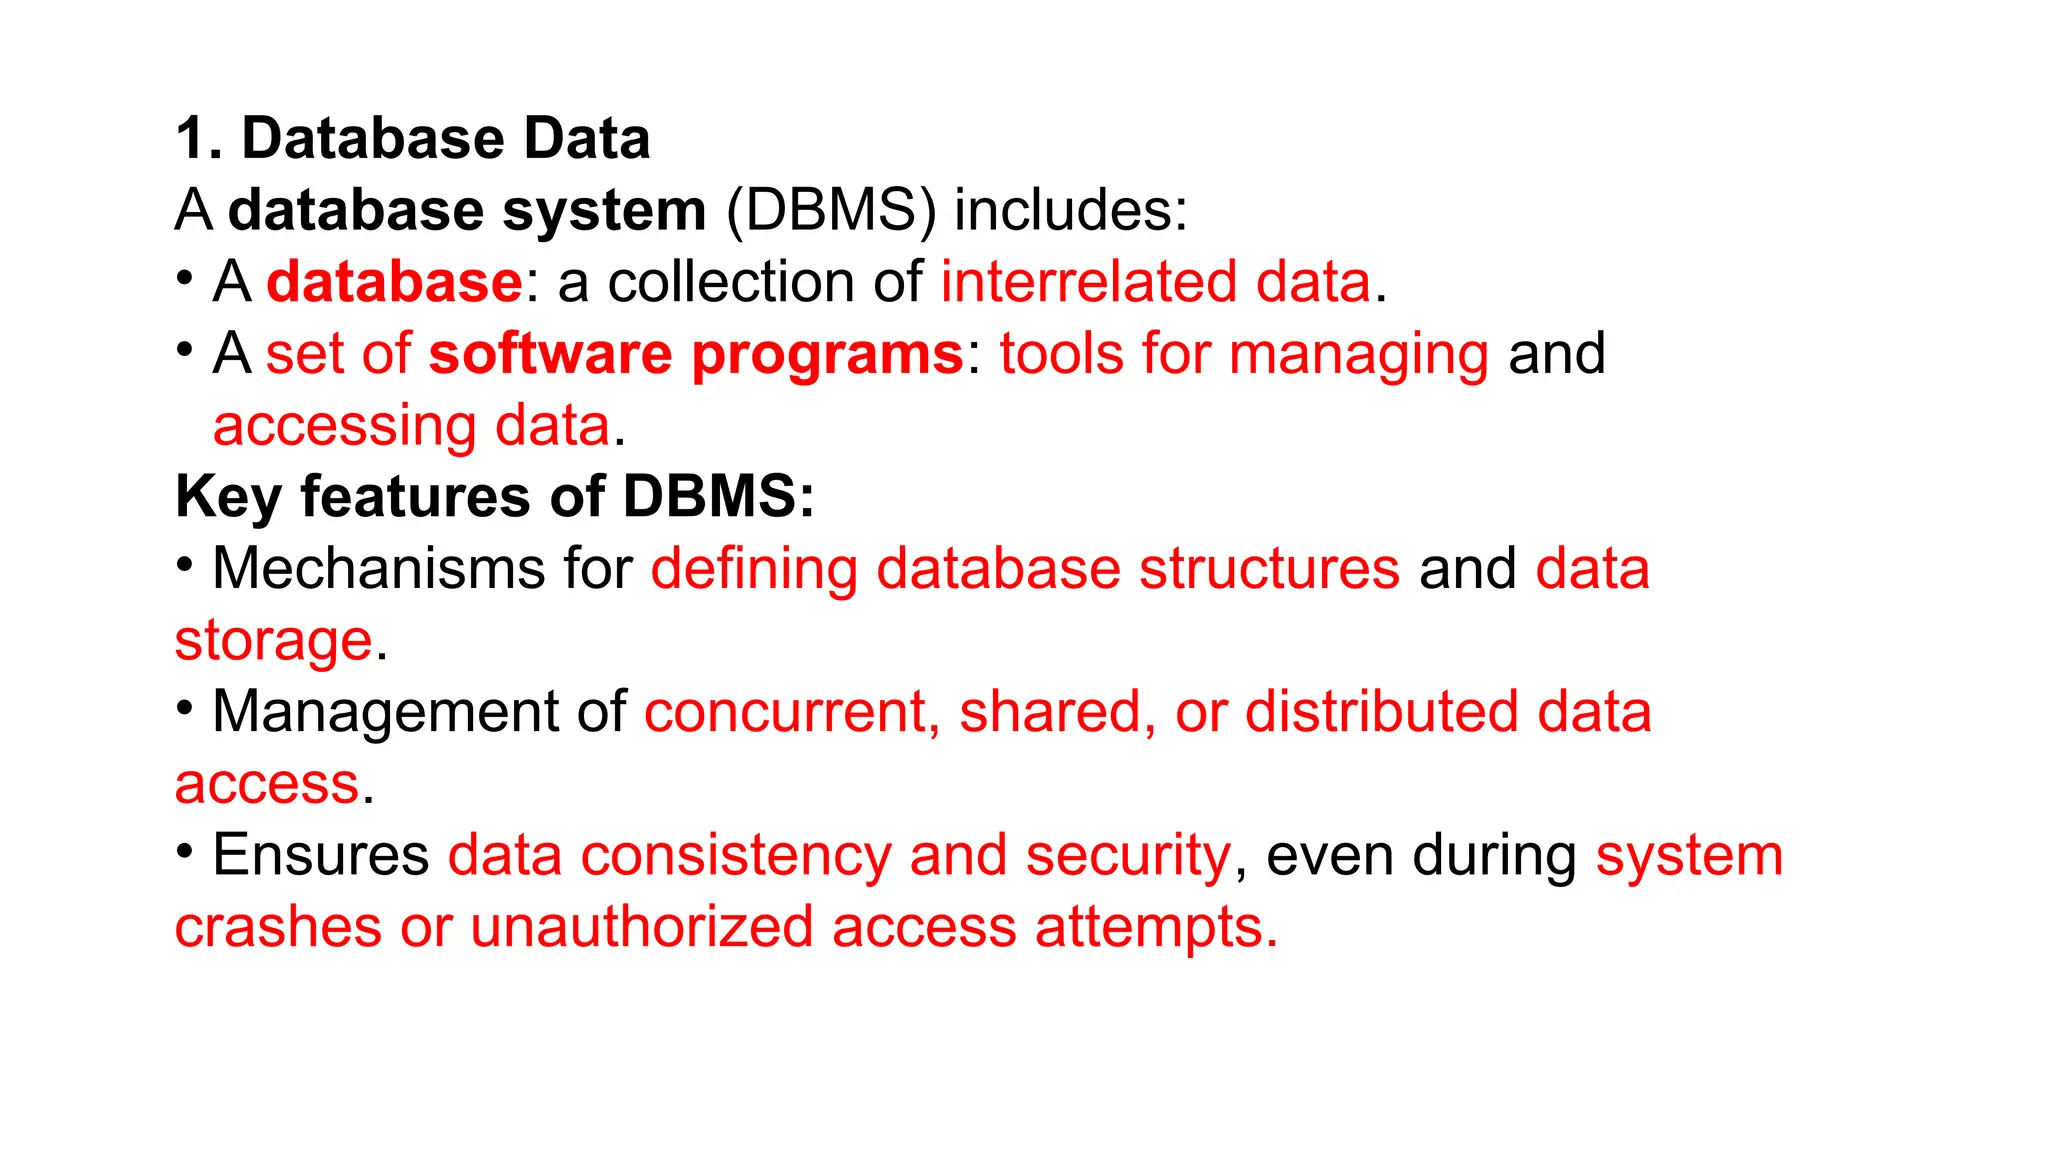
1. Database Data
Adatabase system (DBMS) includes:
• A database: a collection of interrelated data.
• A set of software programs: tools for managing and
accessing data.
Key features of DBMS:
• Mechanisms for defining database structures and data
storage.
• Management of concurrent, shared, or distributed data
access.
• Ensures data consistency and security, even during system
crashes or unauthorized access attempts.
28.
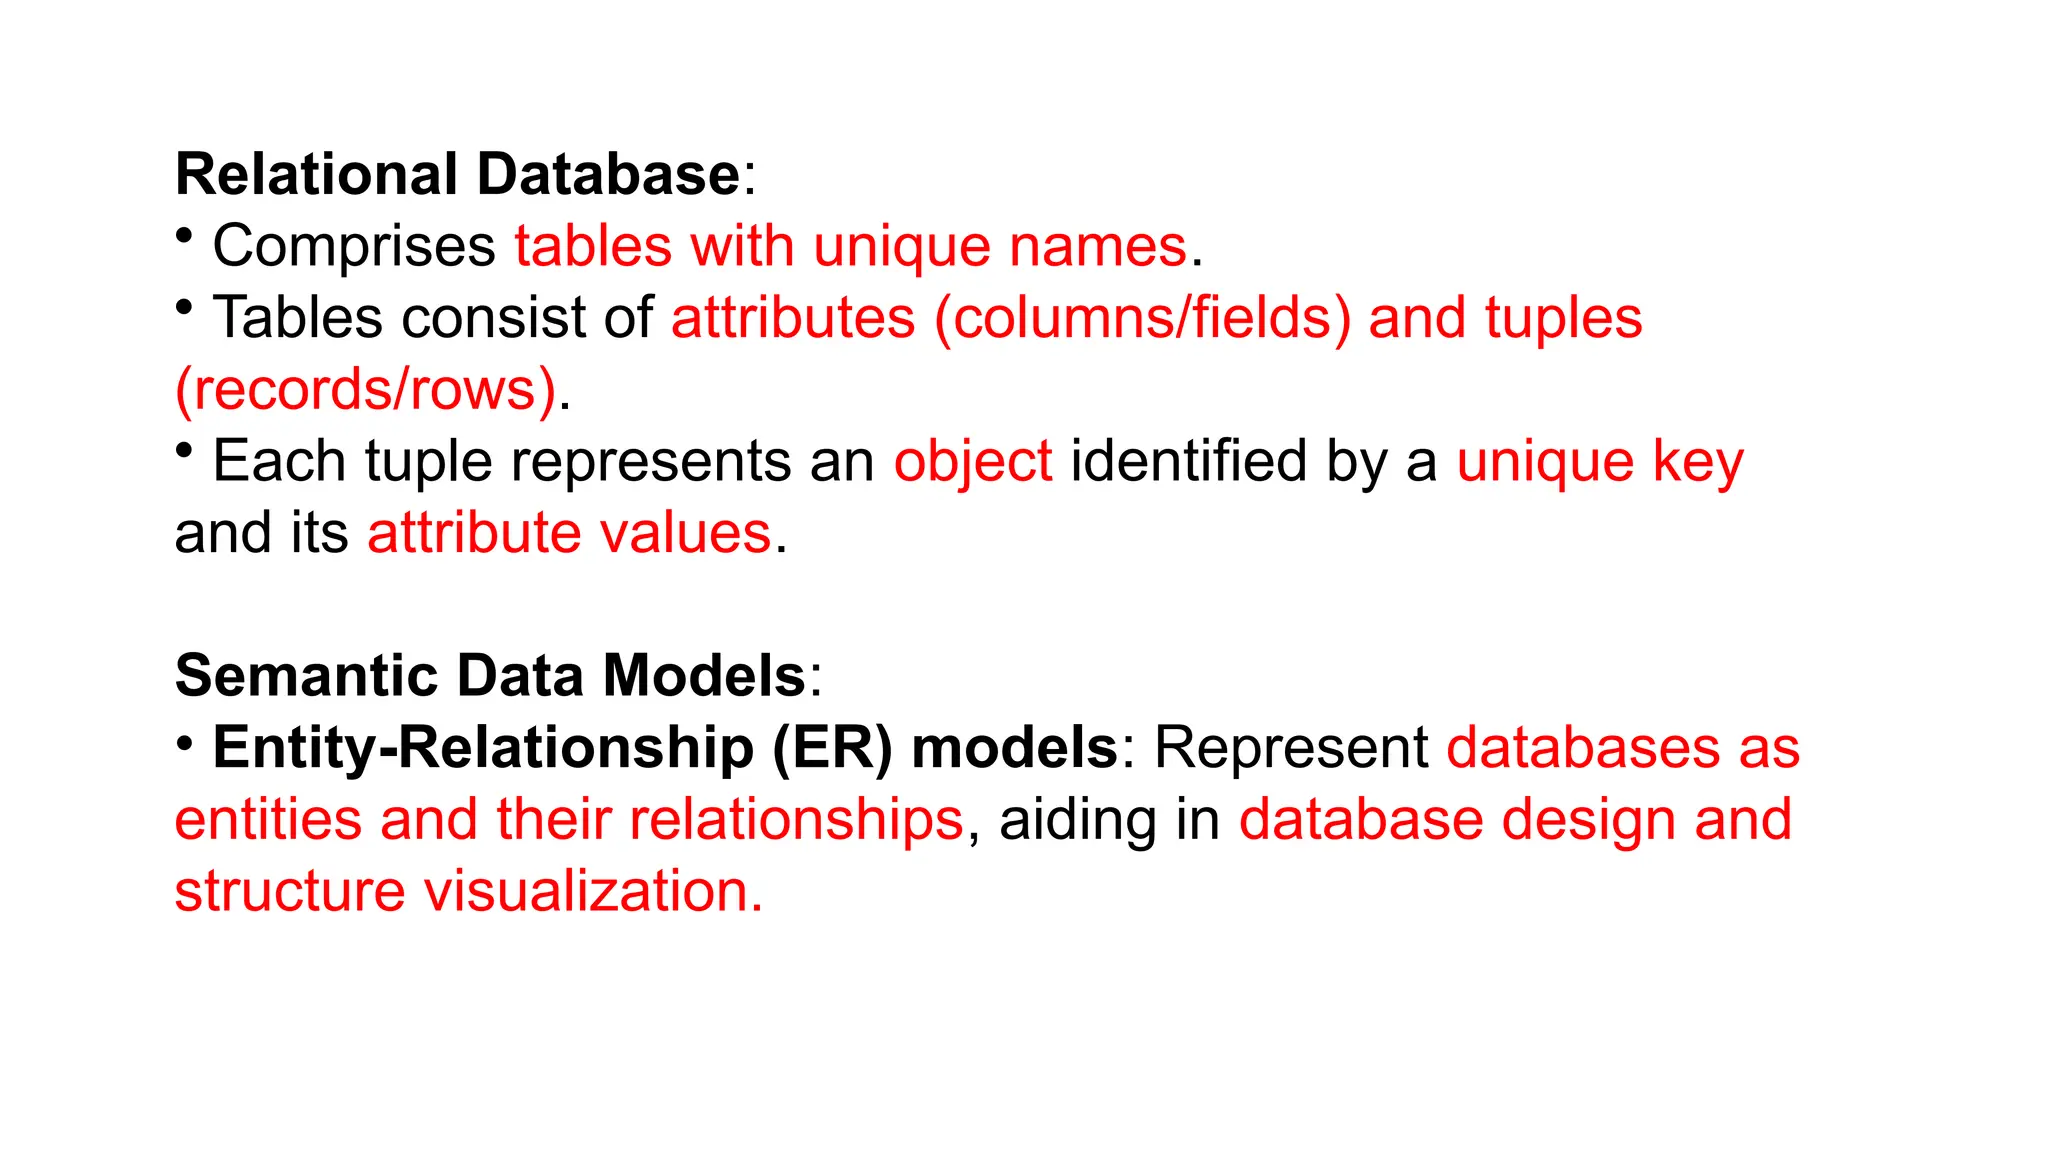
Relational Database:
• Comprisestables with unique names.
• Tables consist of attributes (columns/fields) and tuples
(records/rows).
• Each tuple represents an object identified by a unique key
and its attribute values.
Semantic Data Models:
• Entity-Relationship (ER) models: Represent databases as
entities and their relationships, aiding in database design and
structure visualization.
29.
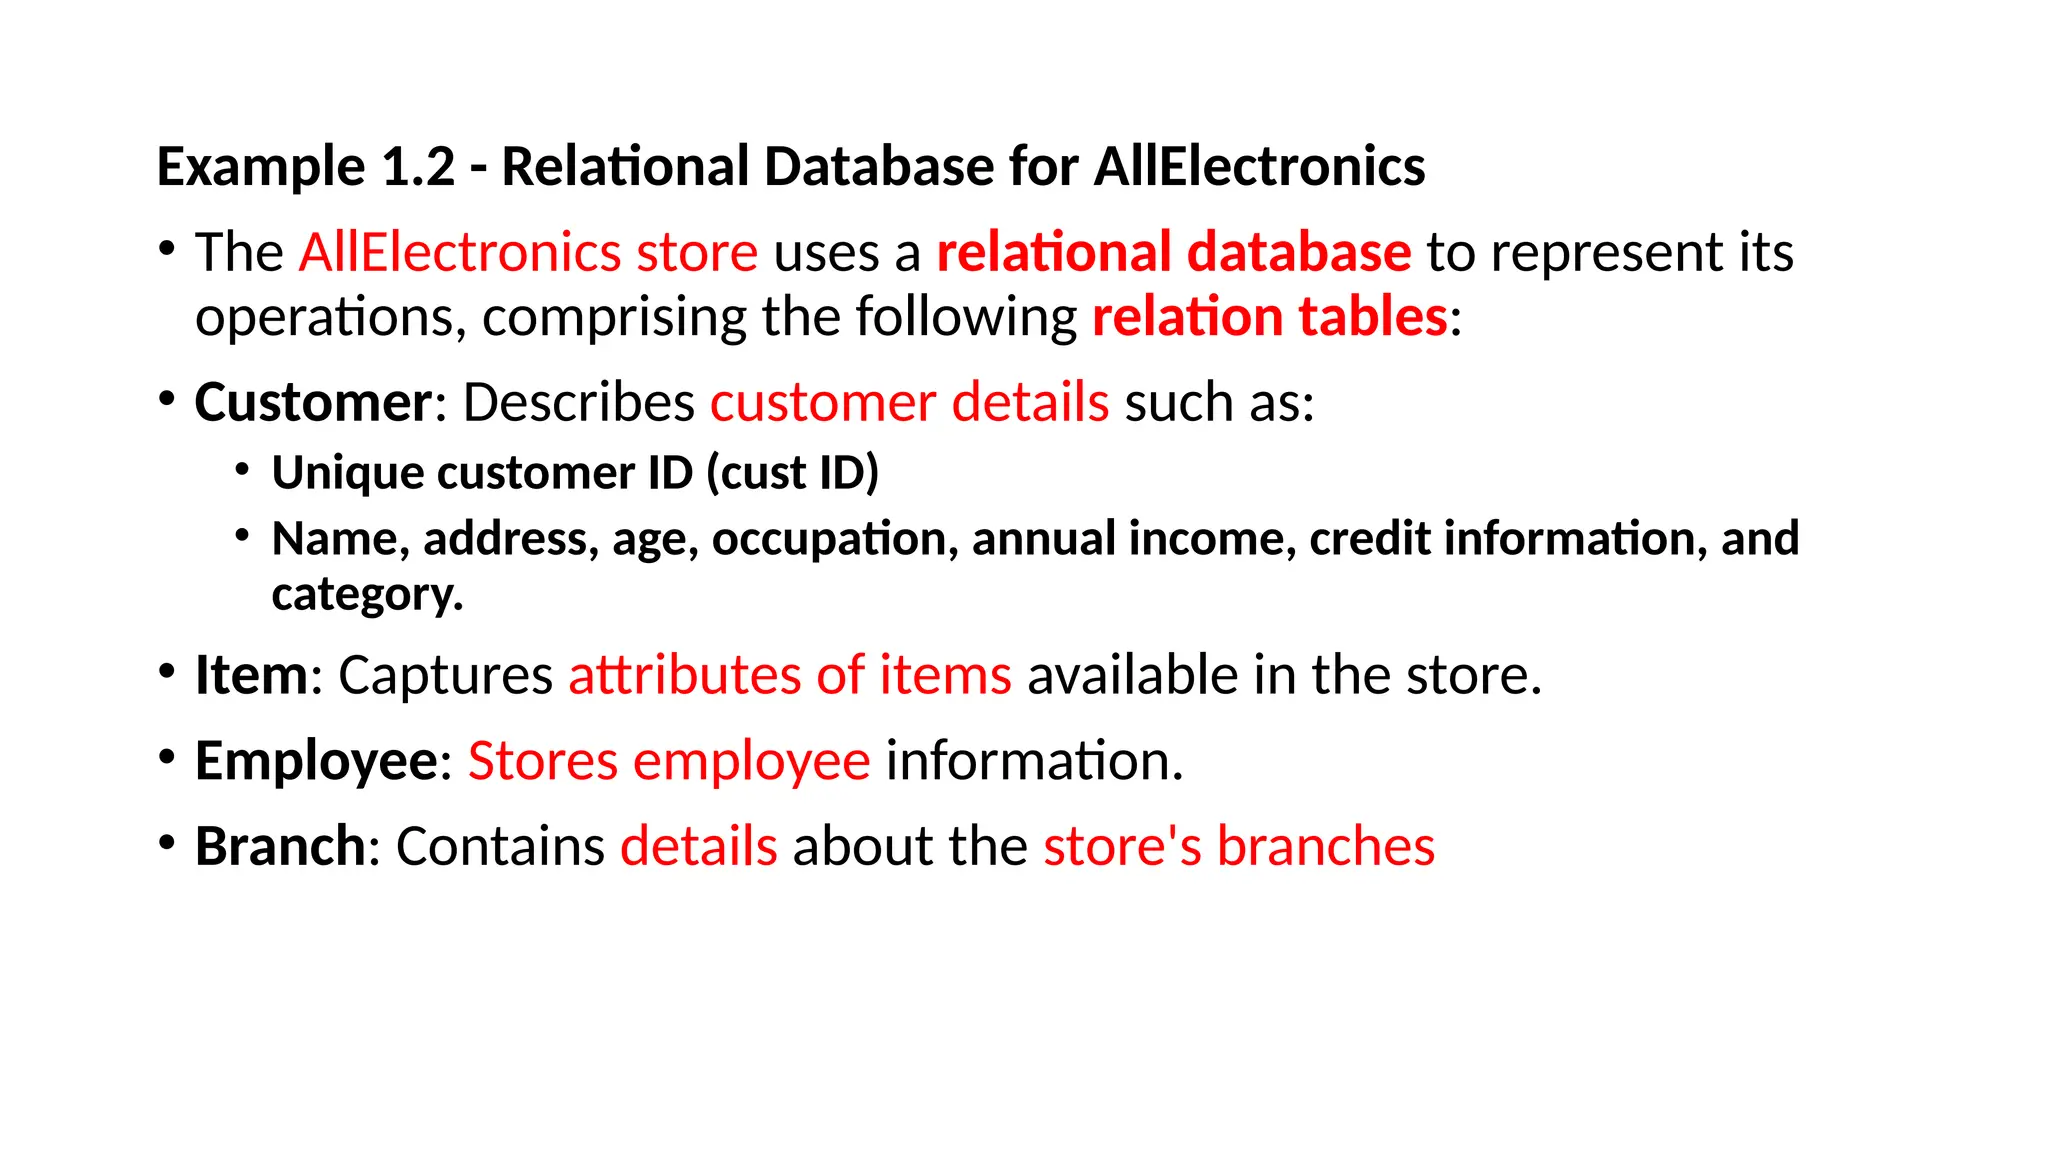
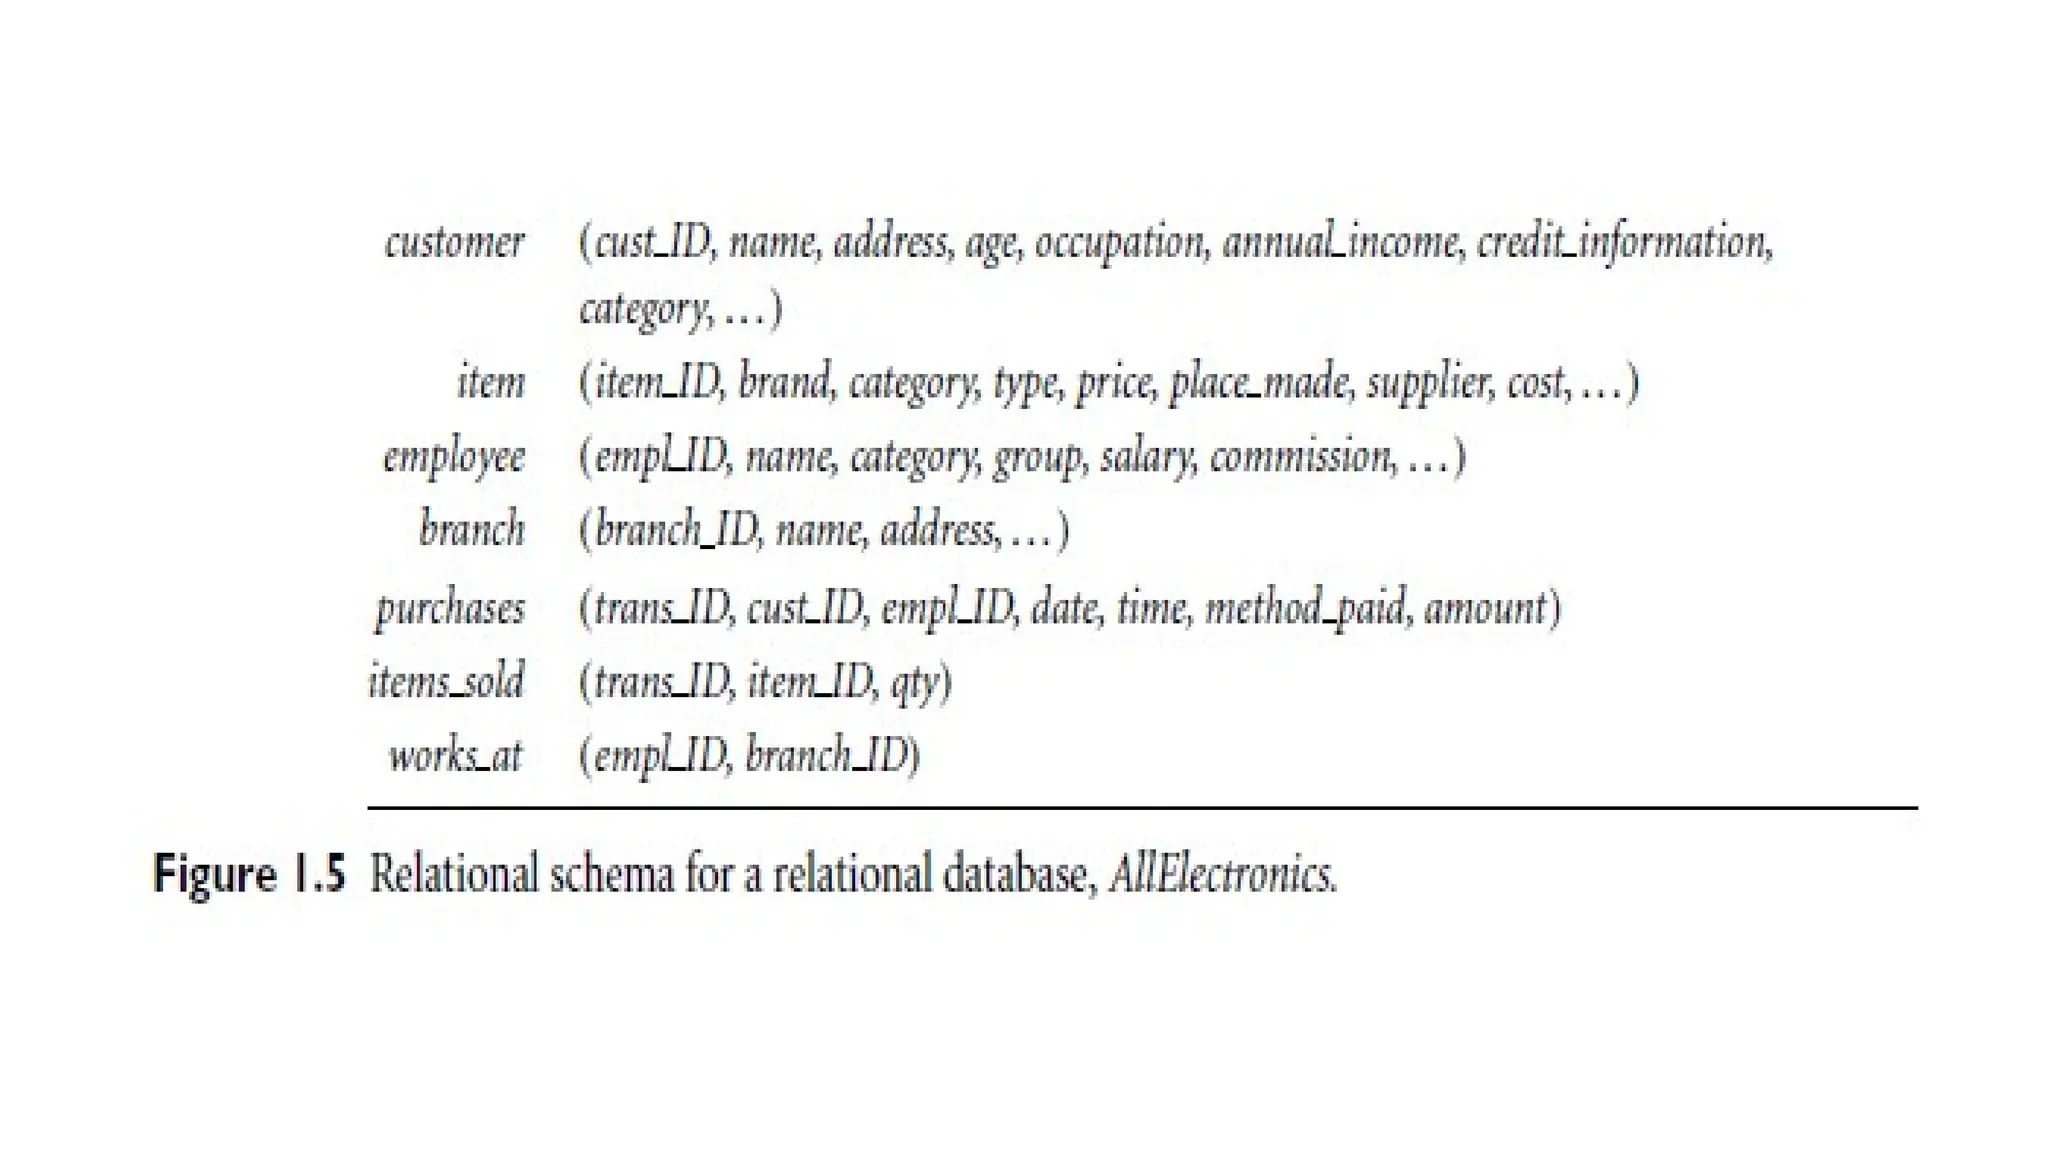
Example 1.2 -Relational Database for AllElectronics
• The AllElectronics store uses a relational database to represent its
operations, comprising the following relation tables:
• Customer: Describes customer details such as:
• Unique customer ID (cust ID)
• Name, address, age, occupation, annual income, credit information, and
category.
• Item: Captures attributes of items available in the store.
• Employee: Stores employee information.
• Branch: Contains details about the store's branches
30.
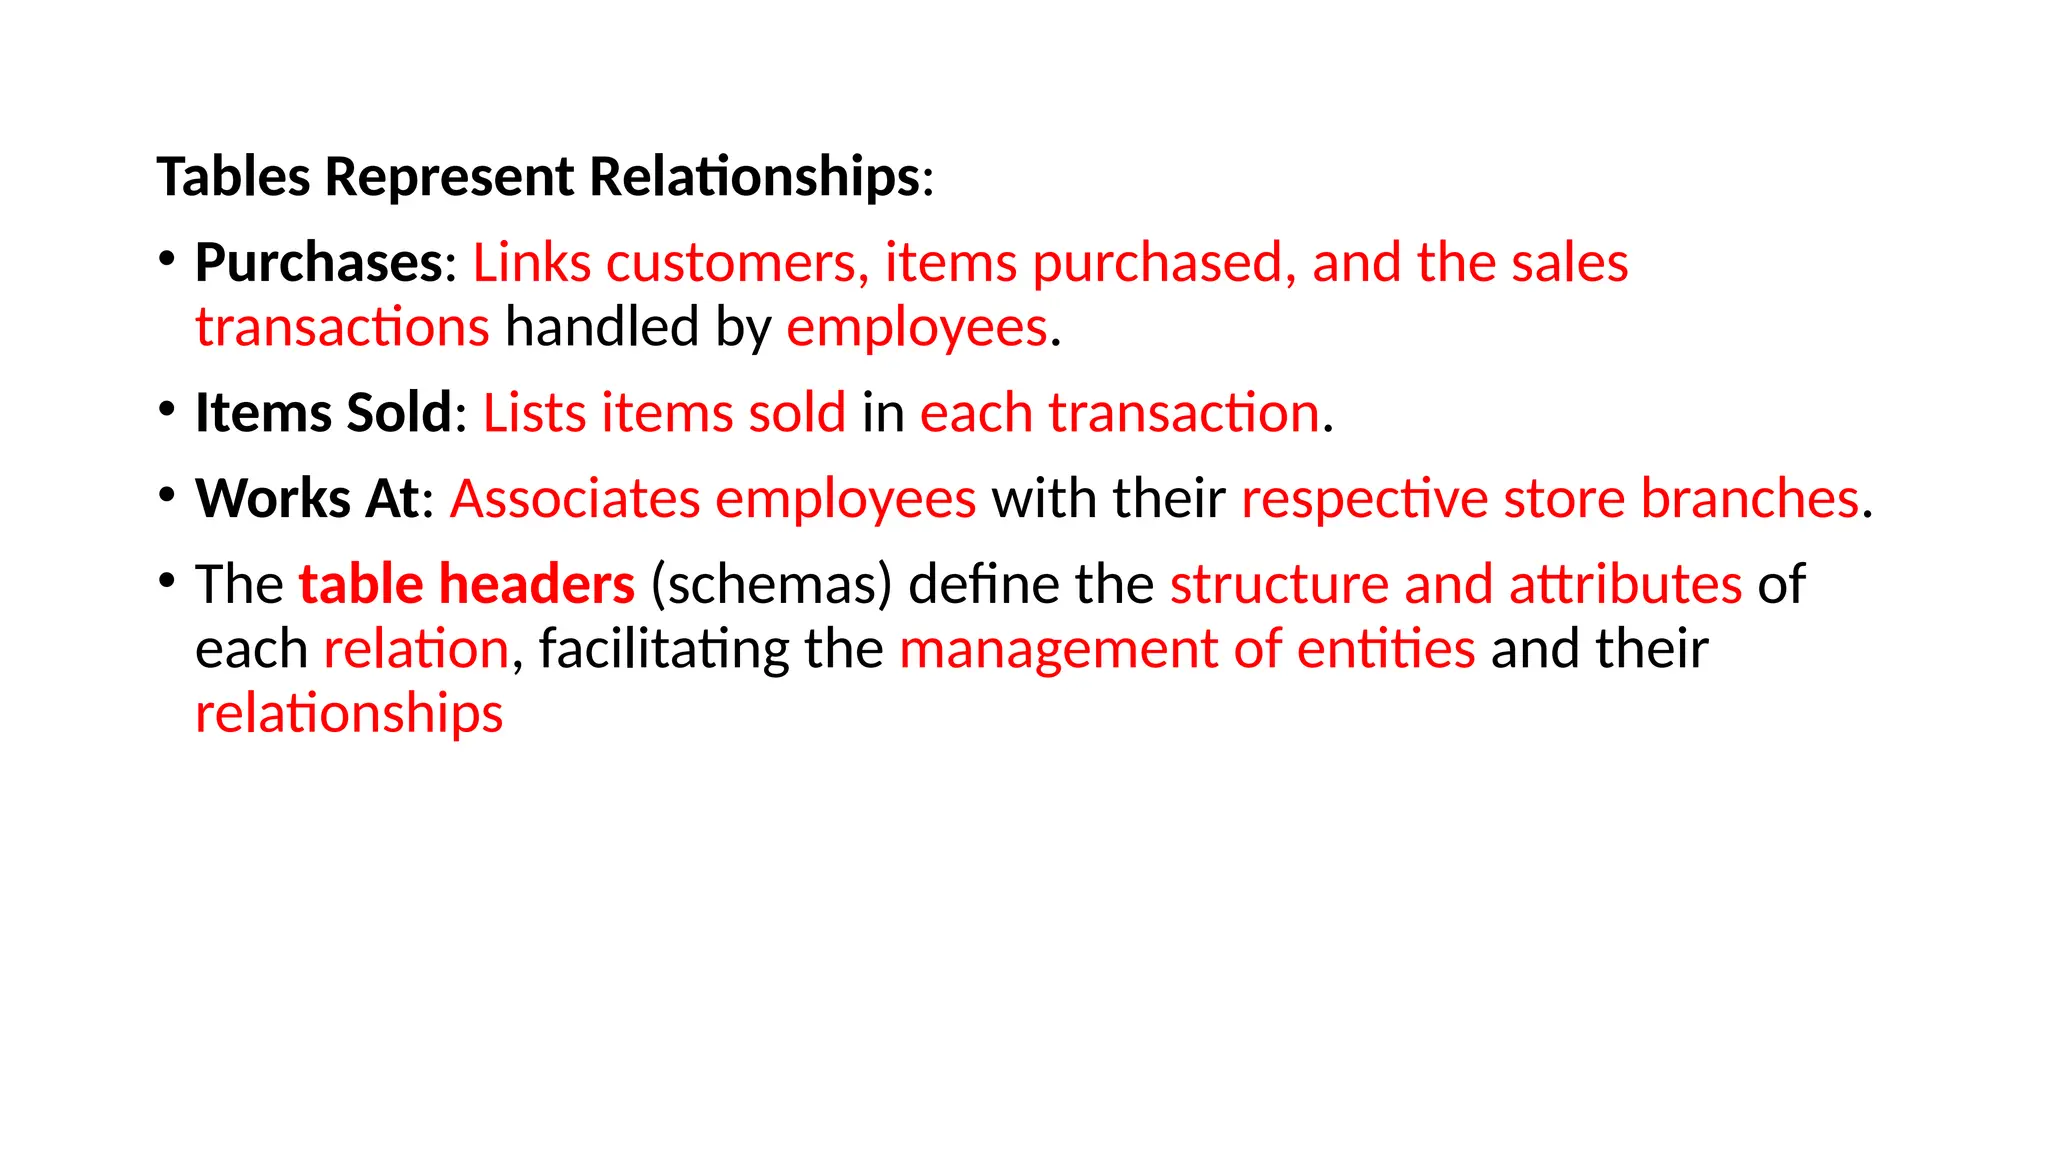
Tables Represent Relationships:
•Purchases: Links customers, items purchased, and the sales
transactions handled by employees.
• Items Sold: Lists items sold in each transaction.
• Works At: Associates employees with their respective store branches.
• The table headers (schemas) define the structure and attributes of
each relation, facilitating the management of entities and their
relationships
32.
Relational Data Accessand Mining
• Relational databases allow data access through queries written in
languages like SQL or via graphical interfaces.
• Queries are optimized and executed using relational operations such as
join, selection, and projection to retrieve specific data subsets.
• For example, queries can answer questions like:
“Show all items sold in the last quarter.”
“What were the total sales last month, grouped by branch?”
• Aggregate functions (e.g., sum, avg, count, max, min) support summary
analysis, enabling questions such as:
“How many transactions occurred in December?”
“Which salesperson had the highest sales?”
33.
• Data Miningextends query capabilities by identifying patterns,
trends, and anomalies in relational databases. Examples include:
• Credit risk prediction: Analyzing customer data to assess
creditworthiness based on income, age, and prior credit history.
• Anomaly detection: Identifying deviations in sales, such as the impact
of packaging changes or price increases.
• Relational databases, being widely used and information-rich, are a
primary data source for data mining studies, supporting both
standard queries and advanced pattern discovery
34.
2. Data WarehouseData
• A data warehouse is a centralized repository that collects data from
multiple sources, stores it under a unified schema, and typically
resides at a single site.
• It is designed to facilitate decision-making by integrating and
summarizing data.
• Construction involves steps like
- data cleaning
- integration
- transformation
- loading
- periodic refreshing
35.
• For example,at AllElectronics, where data is distributed across
branches worldwide, analyzing sales per item type per branch for a
specific period is challenging.
• A data warehouse simplifies such tasks by consolidating data,
providing:
• Subject-oriented organization: Data is organized around key subjects
like customers, items, suppliers, and activities.
• Historical perspective: Data is stored over specific periods (e.g., the
past 6-12 months) and typically summarized.
36.
• Multidimensional datastructure: Modeled as a data cube, each
dimension corresponds to attributes, and each cell stores aggregated
measures (e.g., count, sum, sales amount).
• This allows fast access and analysis of summarized data.
• A data warehouse enables comprehensive and efficient analysis,
supporting decision-making processes across large and complex
organizations.
38.
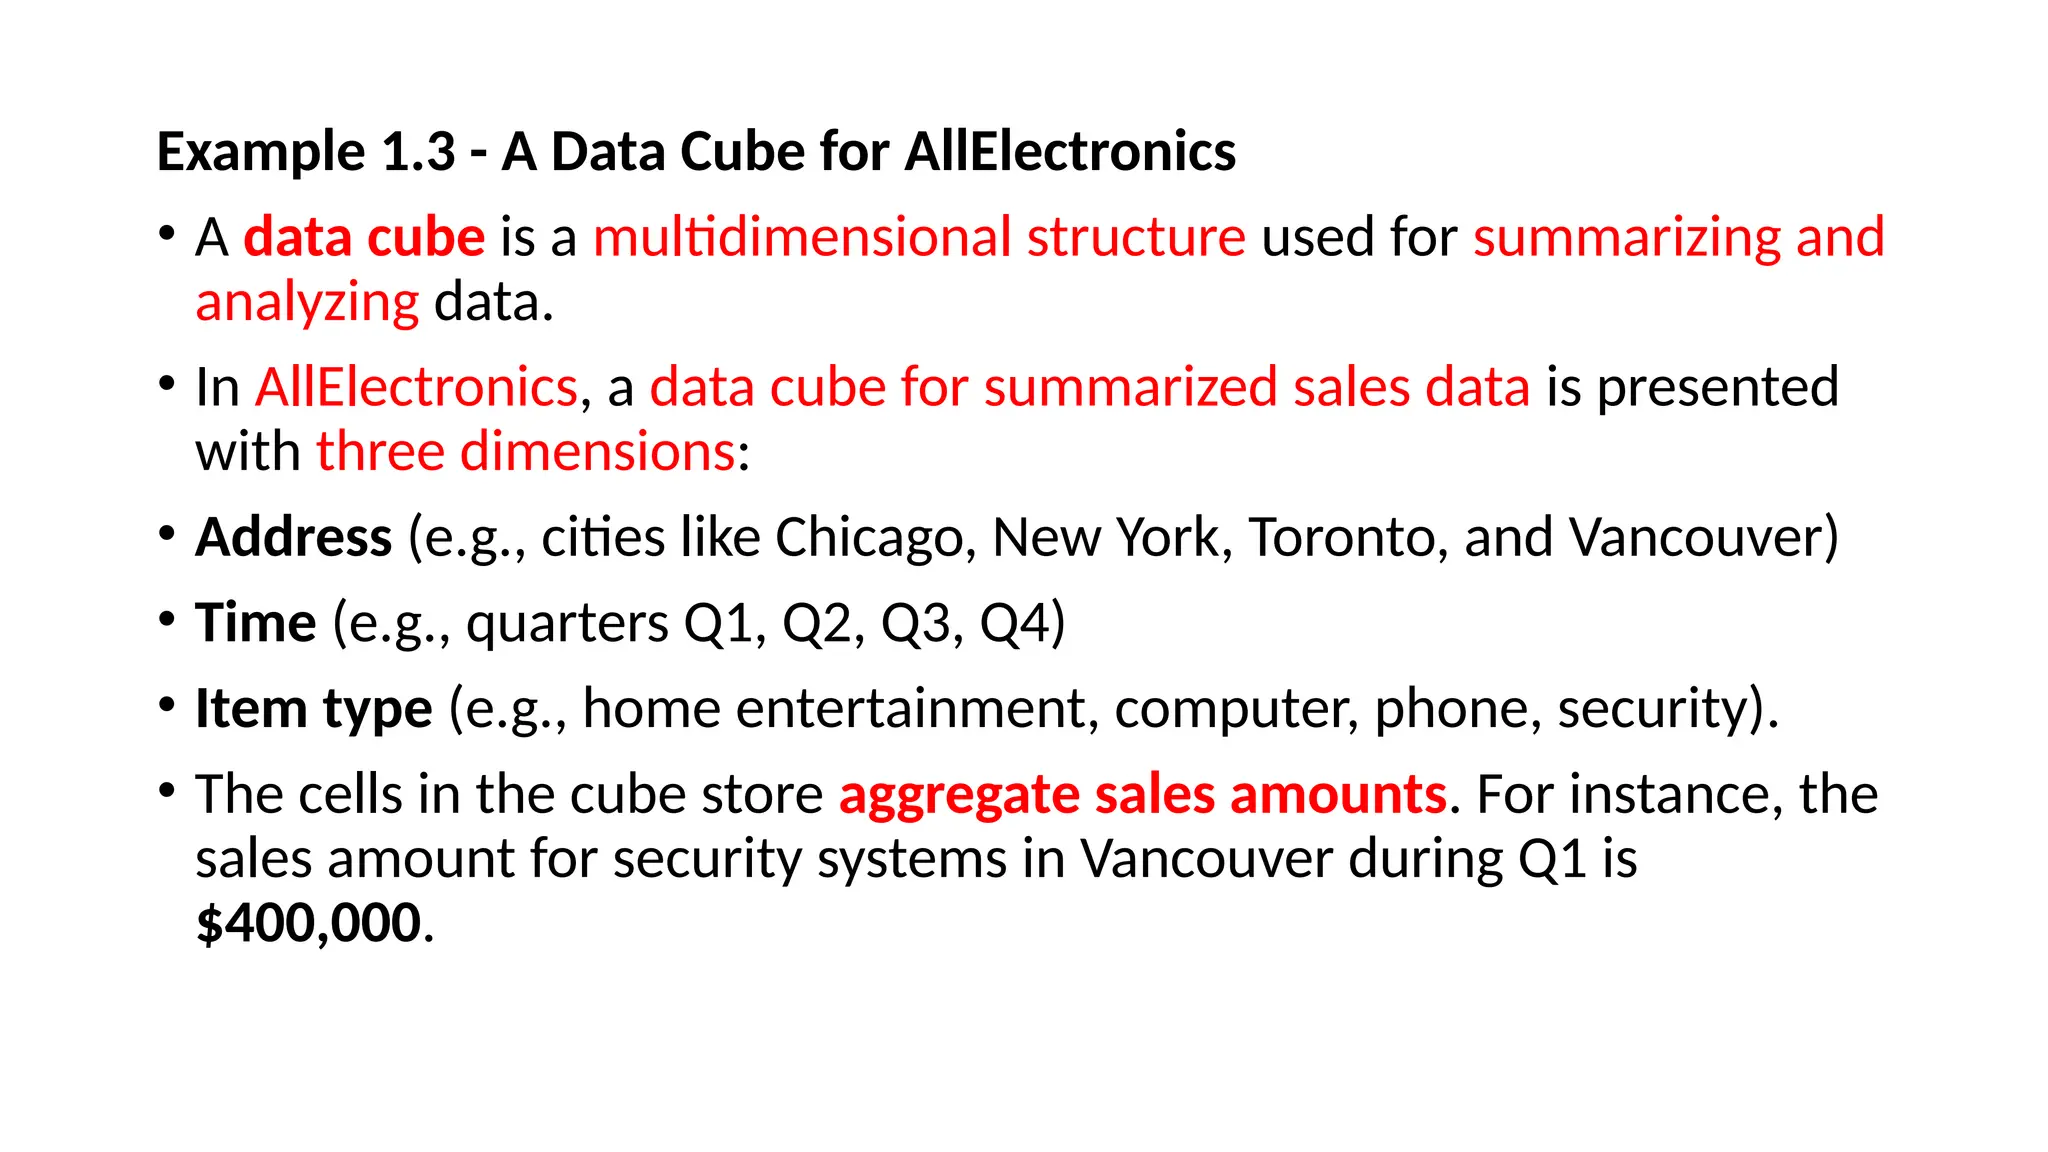
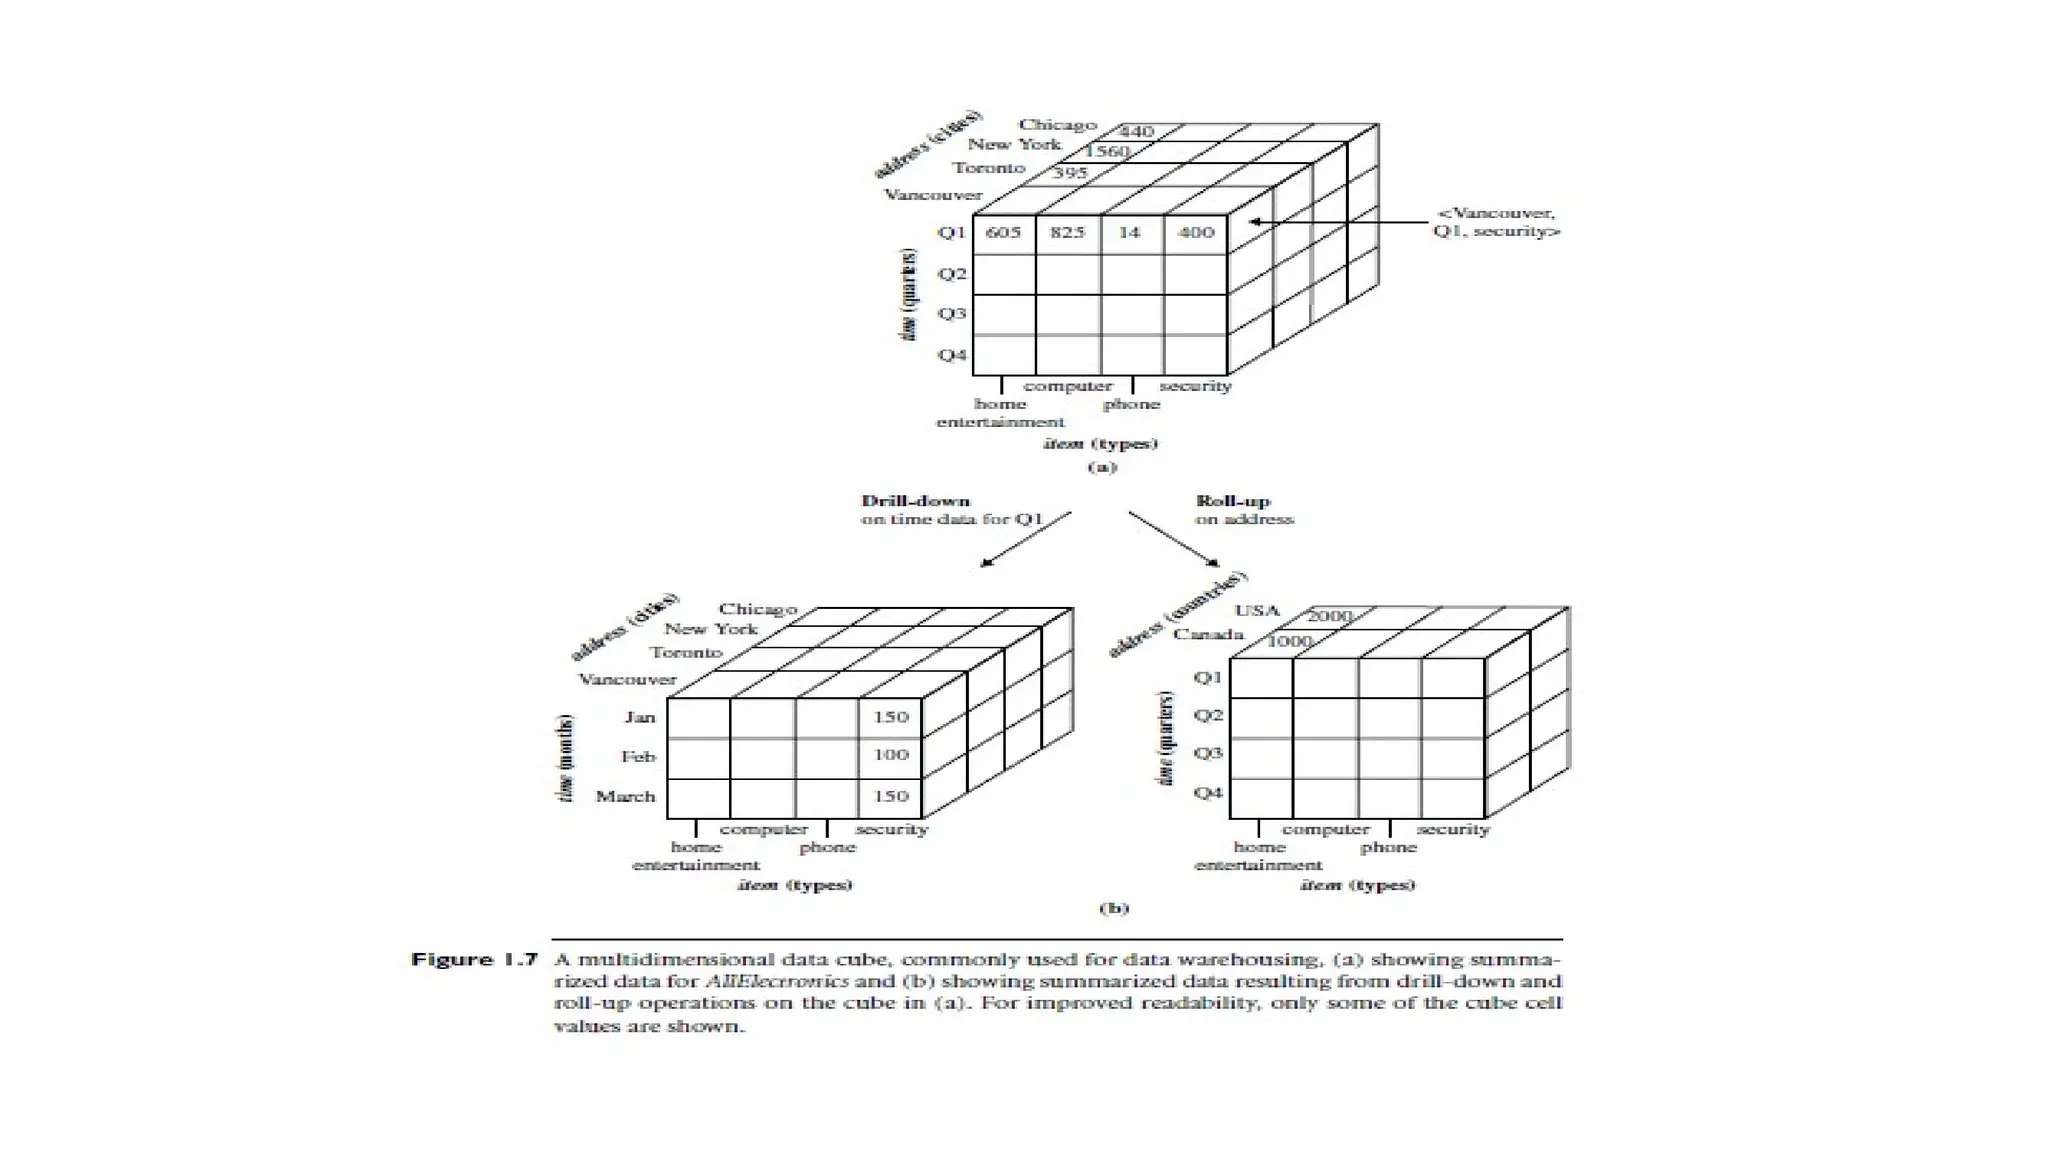
Example 1.3 -A Data Cube for AllElectronics
• A data cube is a multidimensional structure used for summarizing and
analyzing data.
• In AllElectronics, a data cube for summarized sales data is presented
with three dimensions:
• Address (e.g., cities like Chicago, New York, Toronto, and Vancouver)
• Time (e.g., quarters Q1, Q2, Q3, Q4)
• Item type (e.g., home entertainment, computer, phone, security).
• The cells in the cube store aggregate sales amounts. For instance, the
sales amount for security systems in Vancouver during Q1 is
$400,000.
39.
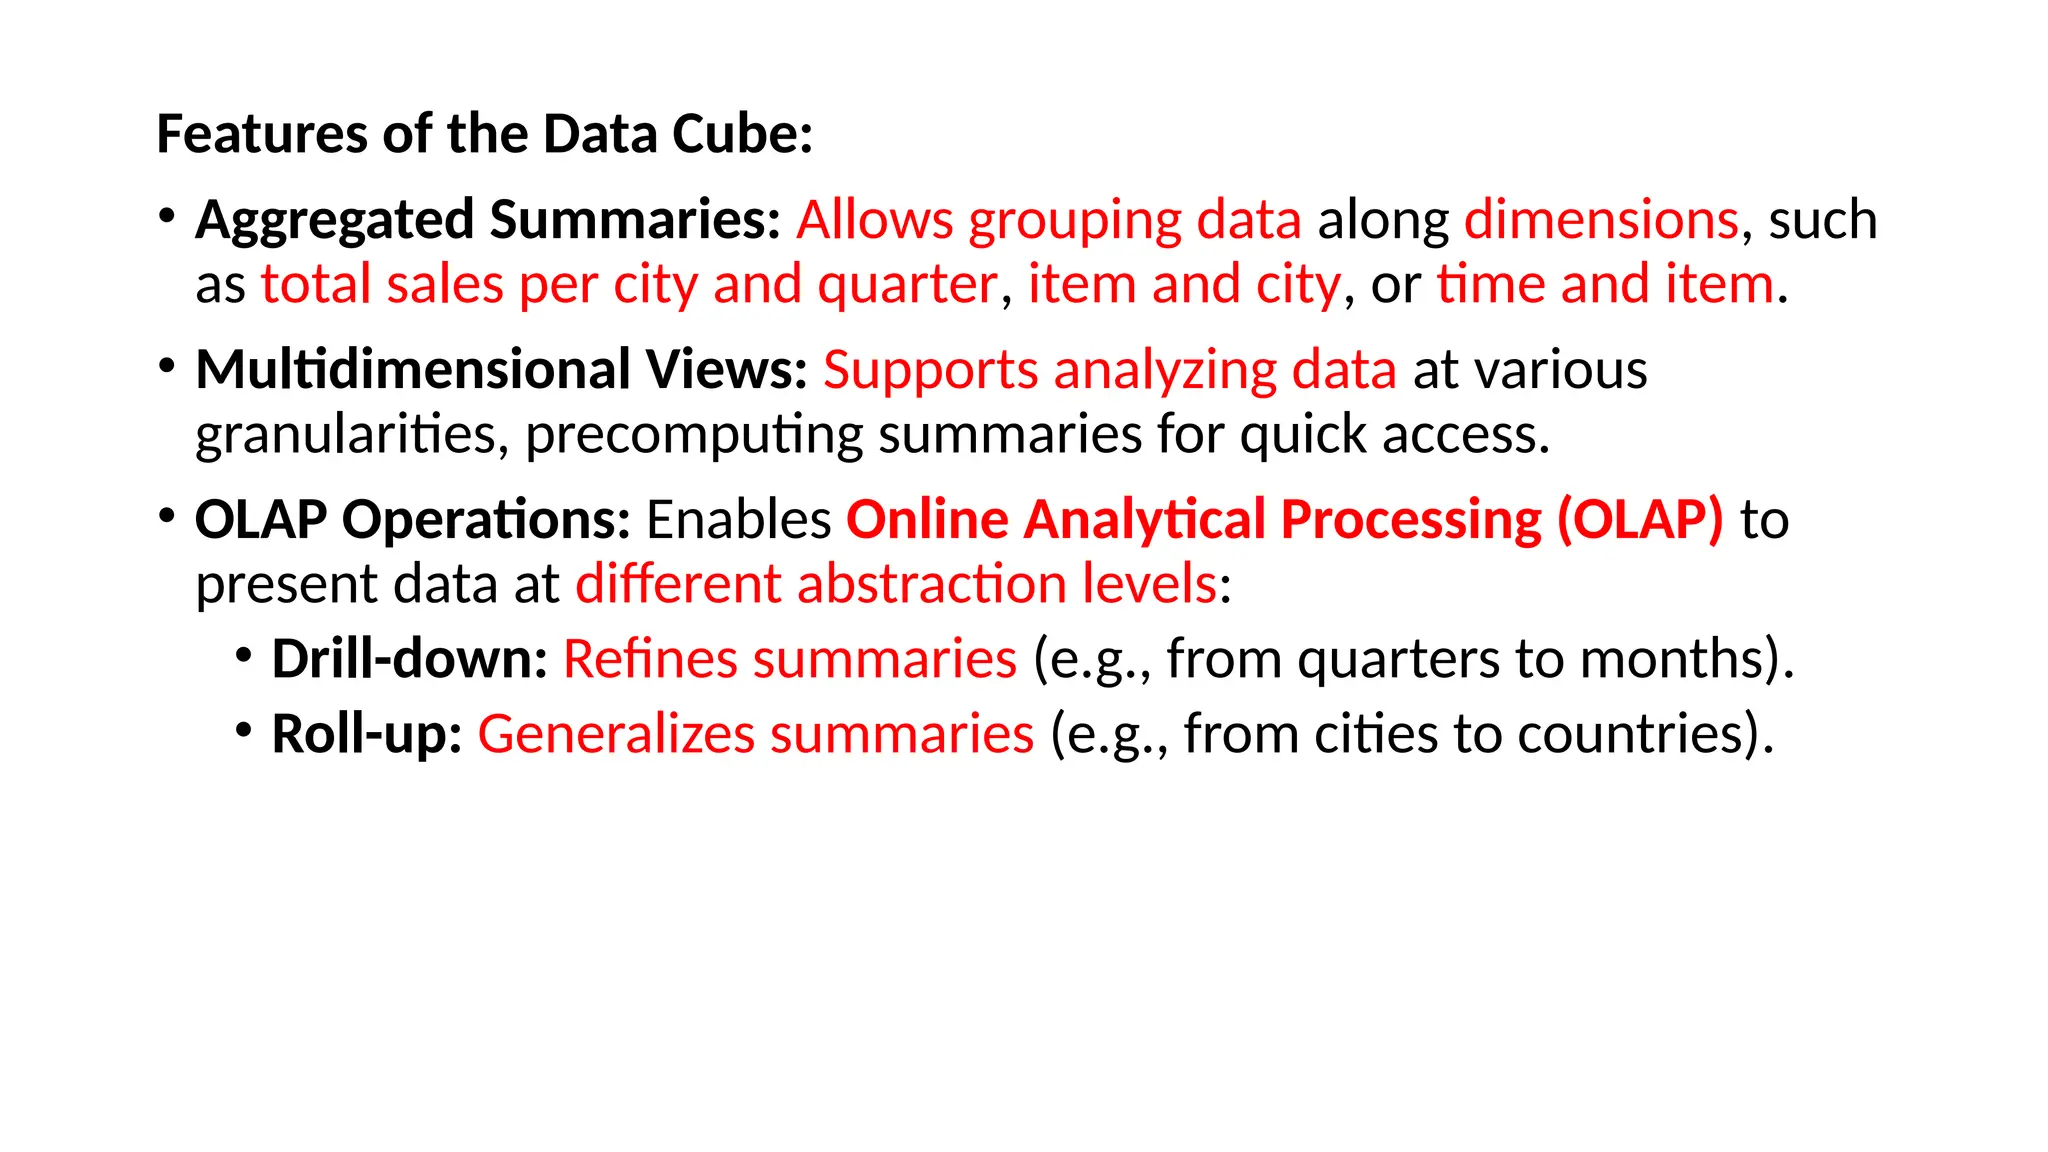
Features of theData Cube:
• Aggregated Summaries: Allows grouping data along dimensions, such
as total sales per city and quarter, item and city, or time and item.
• Multidimensional Views: Supports analyzing data at various
granularities, precomputing summaries for quick access.
• OLAP Operations: Enables Online Analytical Processing (OLAP) to
present data at different abstraction levels:
• Drill-down: Refines summaries (e.g., from quarters to months).
• Roll-up: Generalizes summaries (e.g., from cities to countries).
41.
Multidimensional Data Mining
•Multidimensional data mining (or exploratory multidimensional data
mining) integrates data mining with the multidimensional analysis
style of OLAP.
• It enables the exploration of data across multiple dimensions at
different levels of detail (granularity).
42.
Key Features:
• CombinesOLAP and Data Mining: Facilitates exploration and analysis
of data from multiple perspectives.
• Varying Granularity: Allows users to drill down or roll up dimensions,
enabling a deeper understanding of patterns and trends.
• Enhanced Pattern Discovery: Provides greater potential to uncover
interesting patterns and knowledge by examining various dimension
combinations.
43.
3. Transactional Data
•Transactional data captures individual transactions, such as
purchases, bookings, or online interactions. Each record typically
includes:
• A unique transaction ID (trans ID).
• A list of items involved in the transaction (e.g., purchased products).
Additional Details:
• Related Tables: Transactional databases may include supplementary
tables with details about items, salespersons, branches, or other
associated information.
• Transactional data is foundational for analyzing purchasing behavior,
identifying patterns, and generating insights across various domains
like retail, travel, and web usage.
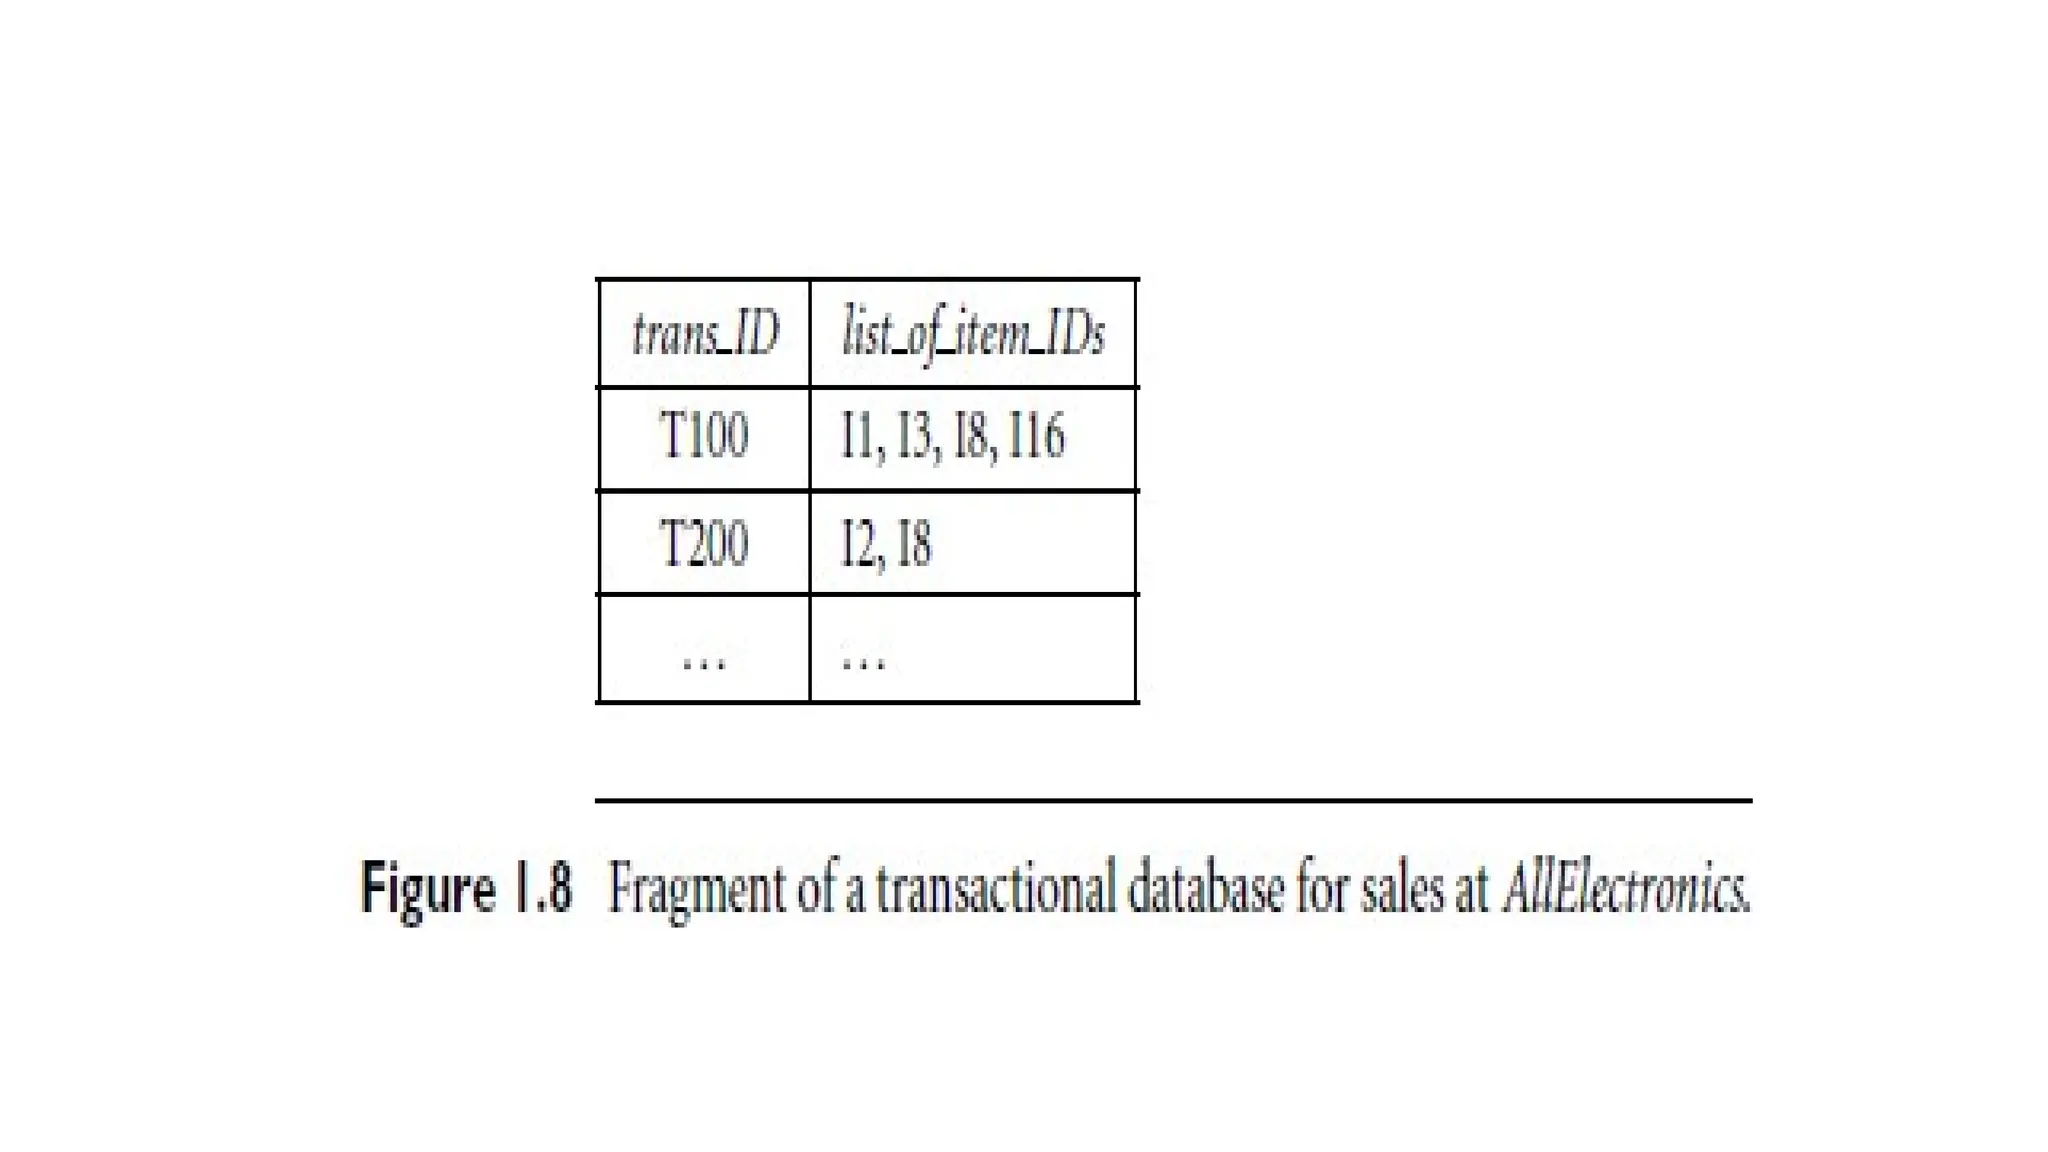
45.
• Transactional Database:AllElectronics stores transaction data in a
table format, with one record per transaction.
• The sales table contains a nested attribute (list of item IDs) that
relational databases typically do not support.
• This data is stored in a flat file or unfolded into a standard
relational format.
• Analytical Question: Analysts may explore which items are frequently
sold together to boost sales (e.g., market basket analysis).
46.
• Market BasketAnalysis:
• Identifies frequently sold itemsets, such as printers and
computers.
• Enables bundling or promotional strategies, like offering discounts
on printers to sell more computers.
• Limitation of Traditional Databases: Standard database systems
cannot perform market basket analysis.
• Role of Data Mining: Data mining techniques help identify frequent
itemsets and derive actionable business insights from transactional
data.
47.
• Other Kindsof Data
• Time-related/Sequence Data: Includes historical records, stock
exchange data, and biological sequences.
• Data Streams: Continuously transmitted data such as video
surveillance and sensor outputs.
• Spatial Data: Maps and geographic information.
• Engineering Design Data: Designs of buildings, system components,
and integrated circuits.
• Hypertext and Multimedia Data: Text, images, videos, and audio
content.
• Graph and Networked Data: Social networks and information
networks.
• Web Data: Vast, distributed information repository accessible via the
Internet.
48.
• Challenges inManaging Complex Data:
• Handling special data structures like sequences, trees, graphs, and networks.
• Managing specific semantics such as ordering, multimedia content, and
connectivity.
• Mining patterns with rich structures and semantic meanings.
• Knowledge Mining from Temporal Data:
• Detect trends in banking data for scheduling resources like bank tellers.
• Analyze stock exchange data for planning investment strategies (e.g., timing
stock purchases).
• Detect network intrusions in computer data streams using clustering or anomaly
detection.
• Knowledge Mining from Spatial Data:
• Discover patterns in metropolitan poverty rates based on proximity to highways.
• Identify spatial relationships and autocorrelation among spatial objects.
49.
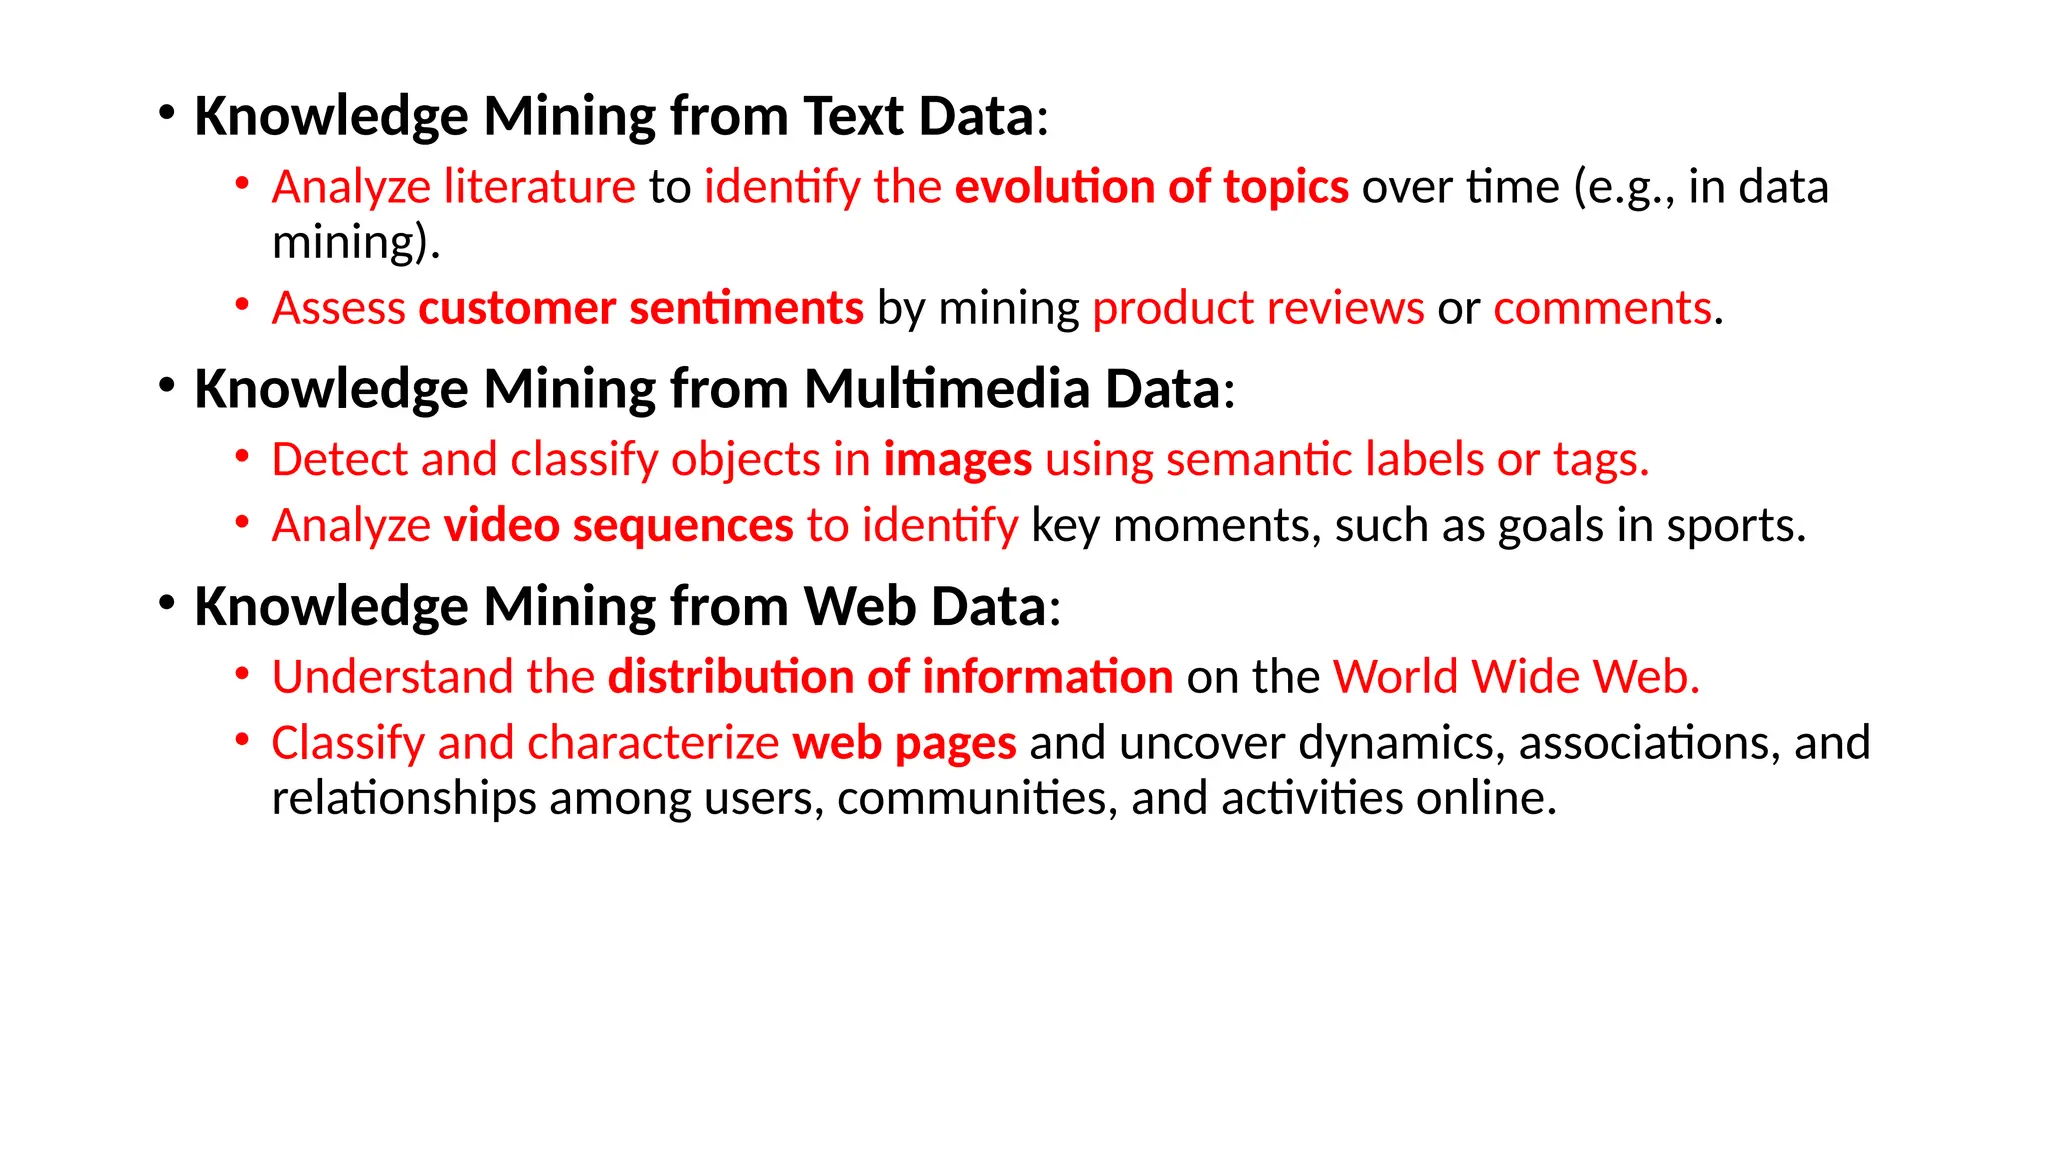
• Knowledge Miningfrom Text Data:
• Analyze literature to identify the evolution of topics over time (e.g., in data
mining).
• Assess customer sentiments by mining product reviews or comments.
• Knowledge Mining from Multimedia Data:
• Detect and classify objects in images using semantic labels or tags.
• Analyze video sequences to identify key moments, such as goals in sports.
• Knowledge Mining from Web Data:
• Understand the distribution of information on the World Wide Web.
• Classify and characterize web pages and uncover dynamics, associations, and
relationships among users, communities, and activities online.
50.
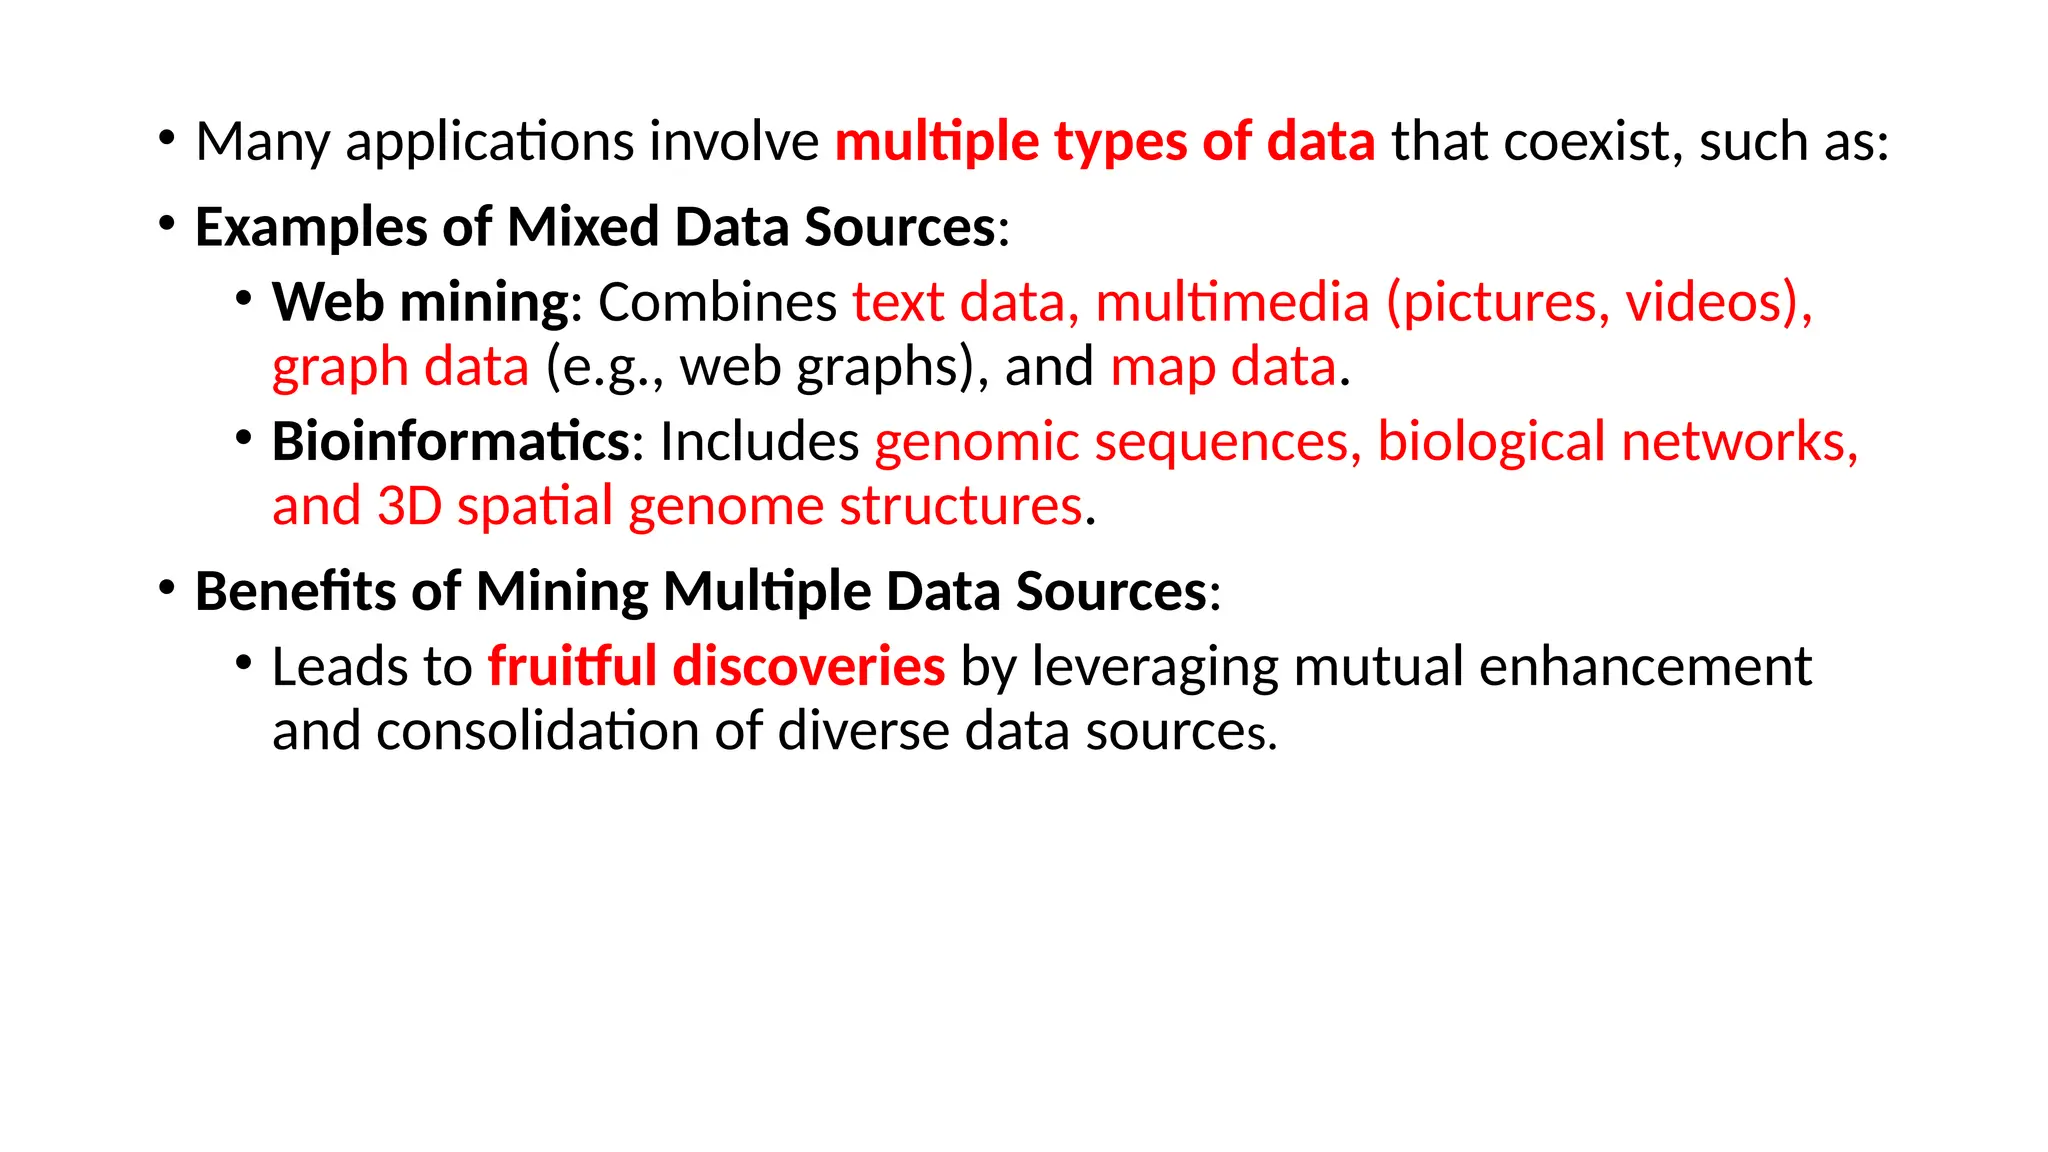
• Many applicationsinvolve multiple types of data that coexist, such as:
• Examples of Mixed Data Sources:
• Web mining: Combines text data, multimedia (pictures, videos),
graph data (e.g., web graphs), and map data.
• Bioinformatics: Includes genomic sequences, biological networks,
and 3D spatial genome structures.
• Benefits of Mining Multiple Data Sources:
• Leads to fruitful discoveries by leveraging mutual enhancement
and consolidation of diverse data sources.
51.
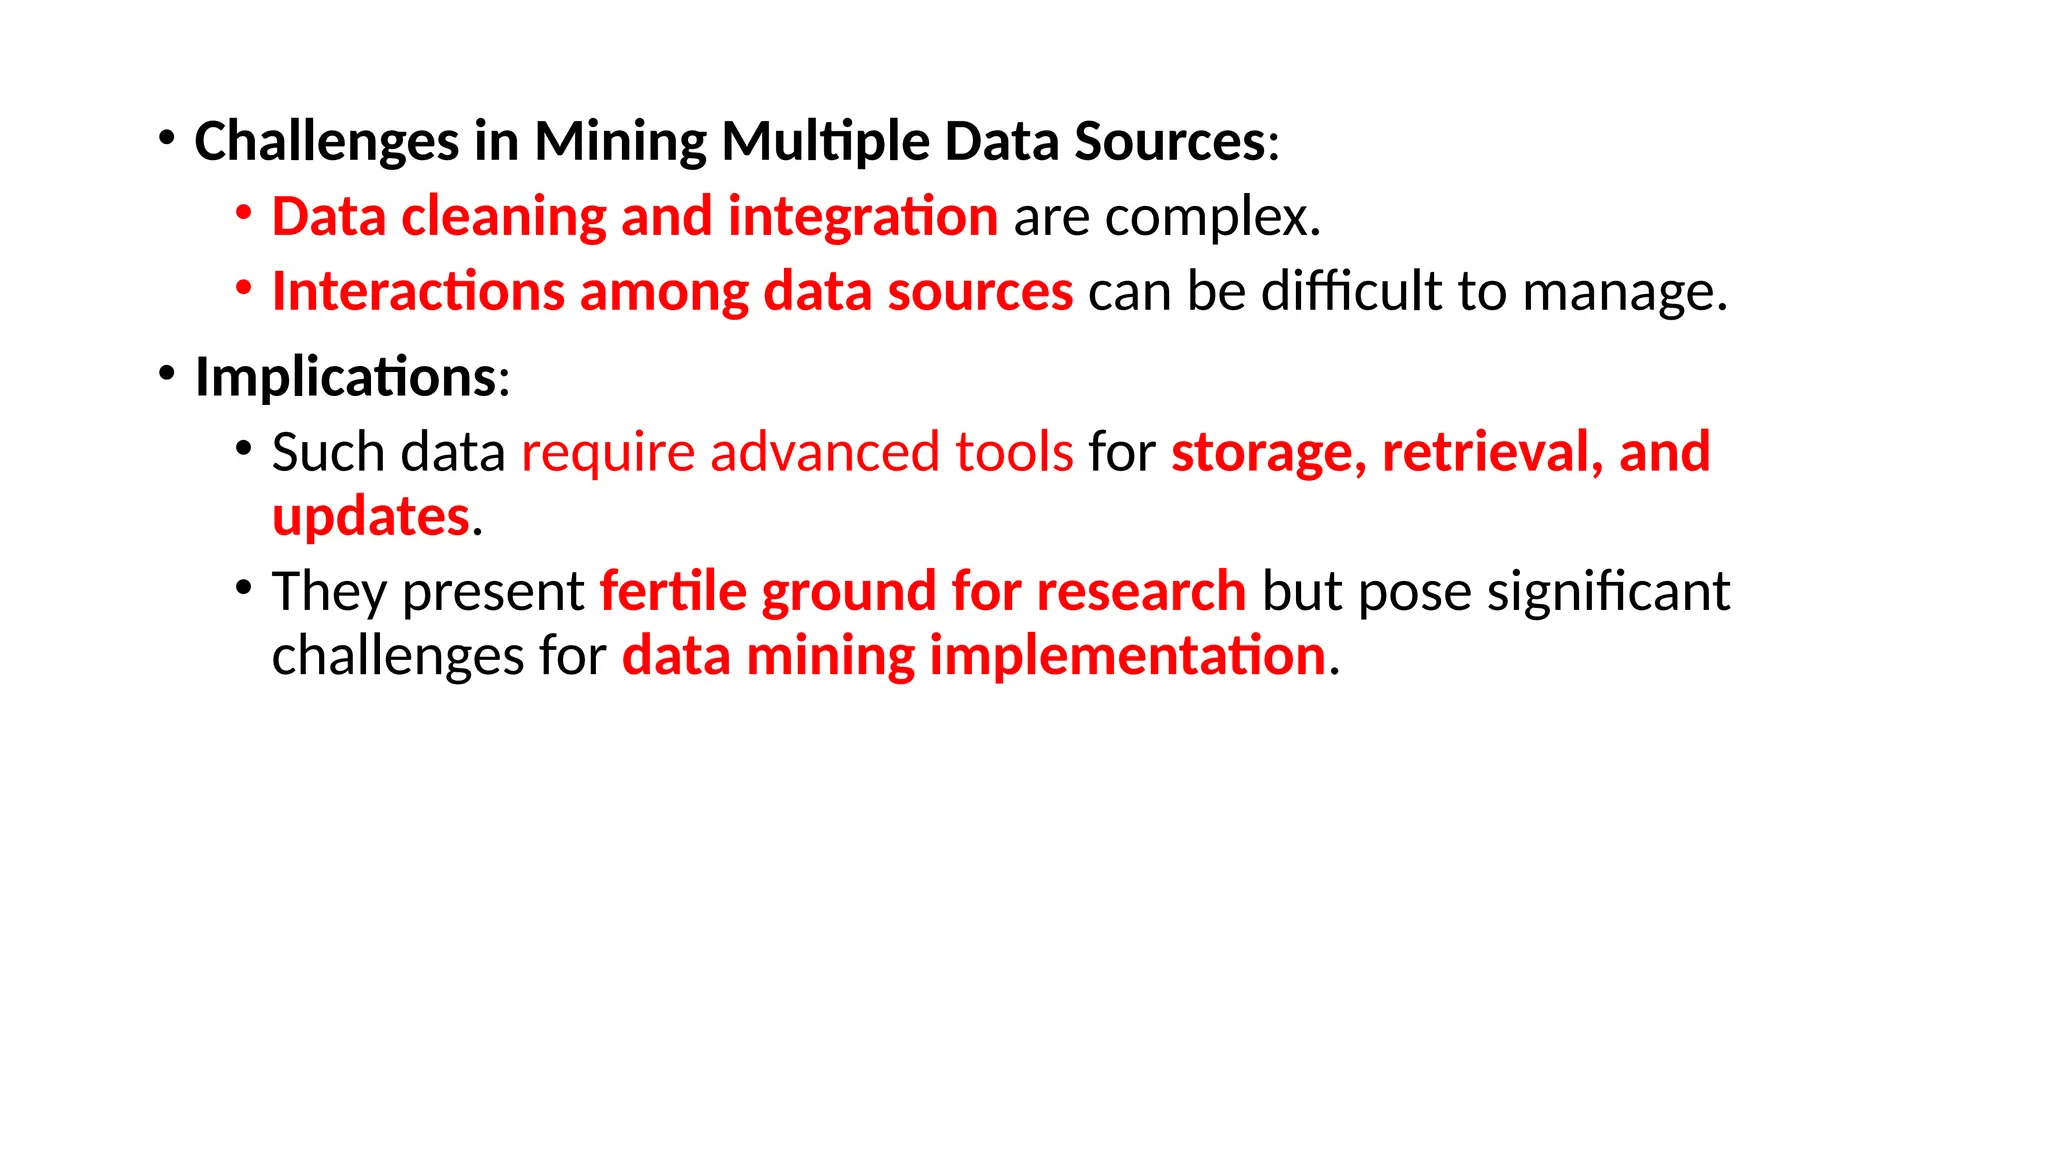
• Challenges inMining Multiple Data Sources:
• Data cleaning and integration are complex.
• Interactions among data sources can be difficult to manage.
• Implications:
• Such data require advanced tools for storage, retrieval, and
updates.
• They present fertile ground for research but pose significant
challenges for data mining implementation.
52.
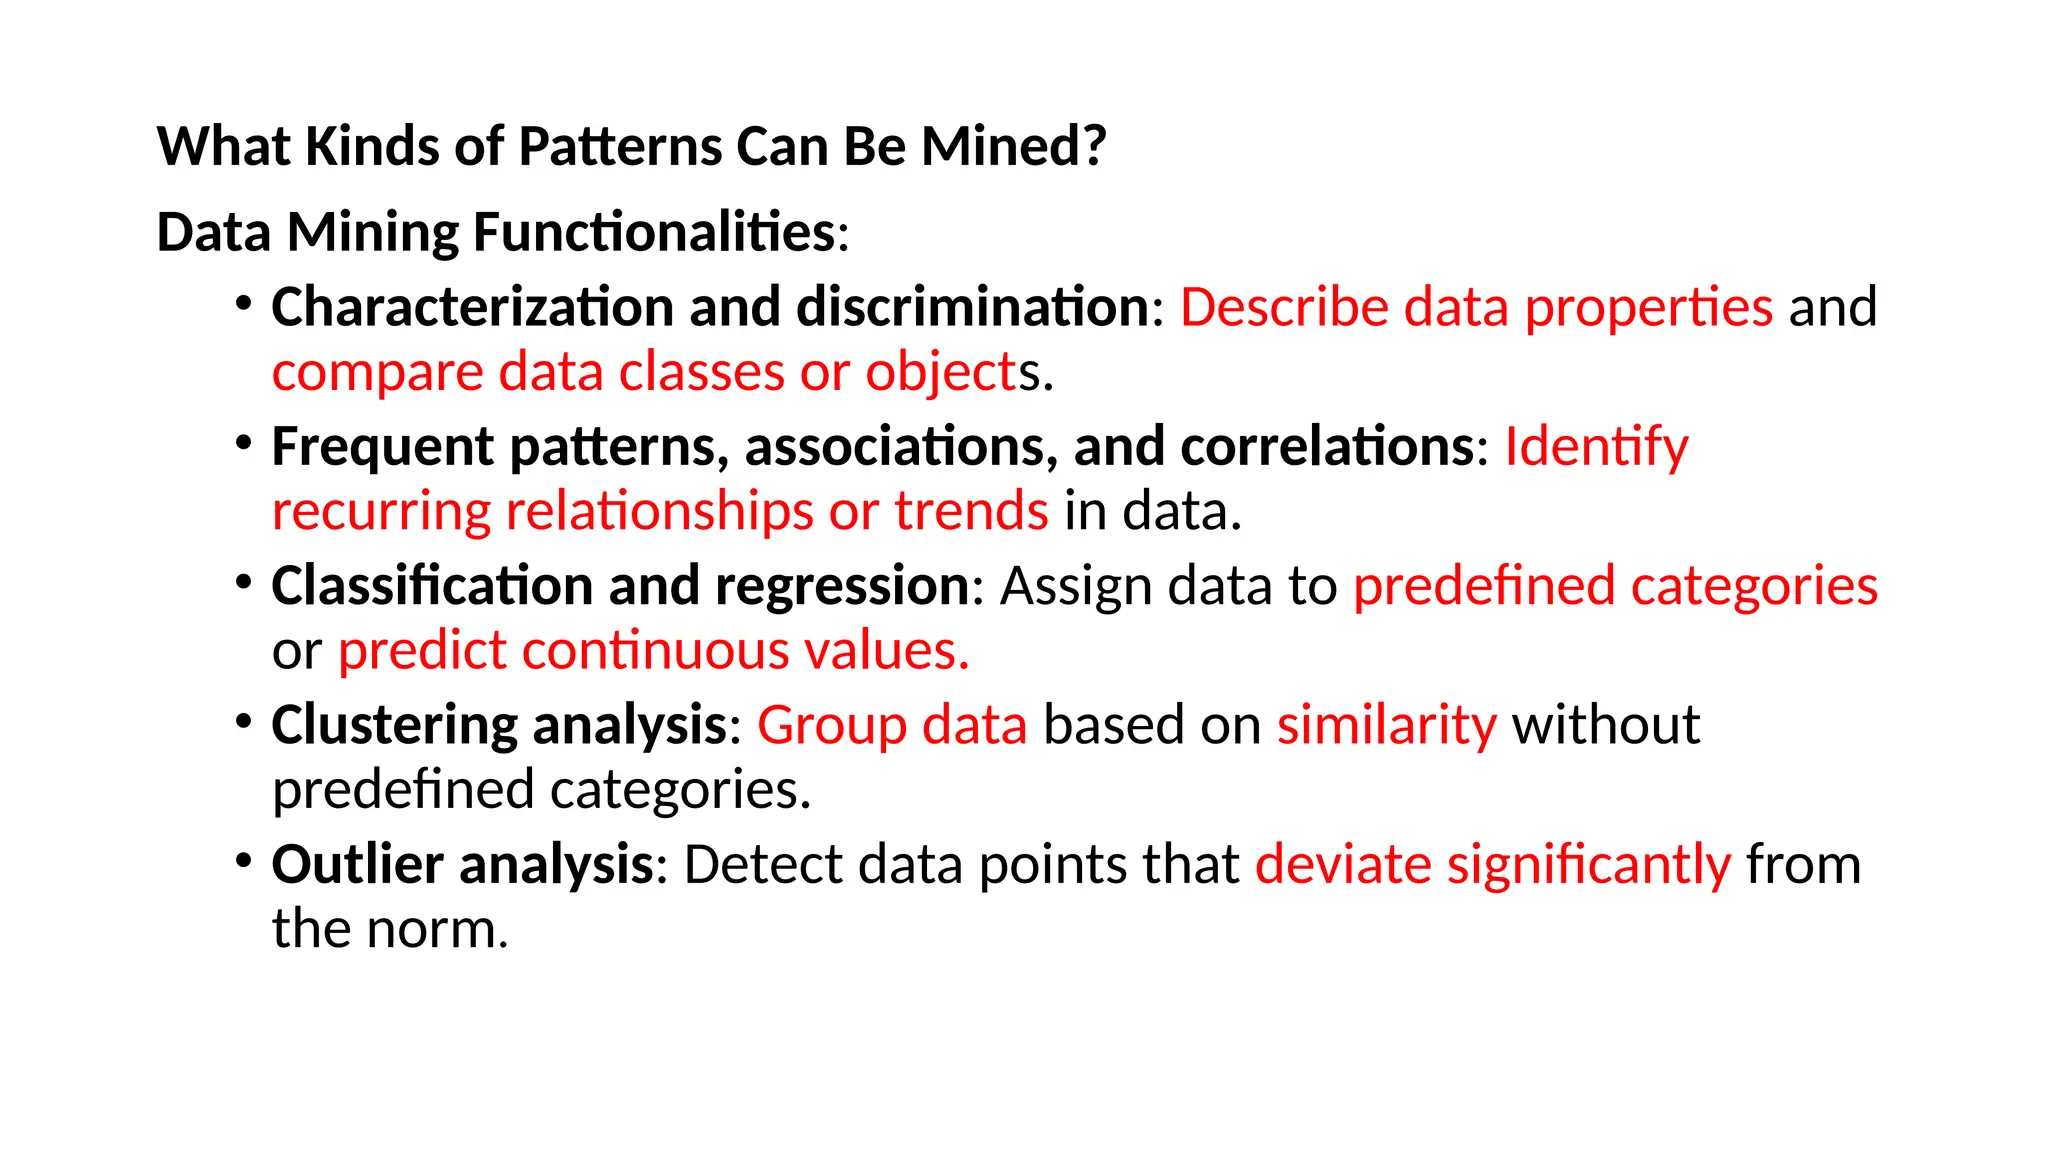
What Kinds ofPatterns Can Be Mined?
Data Mining Functionalities:
• Characterization and discrimination: Describe data properties and
compare data classes or objects.
• Frequent patterns, associations, and correlations: Identify
recurring relationships or trends in data.
• Classification and regression: Assign data to predefined categories
or predict continuous values.
• Clustering analysis: Group data based on similarity without
predefined categories.
• Outlier analysis: Detect data points that deviate significantly from
the norm.
53.
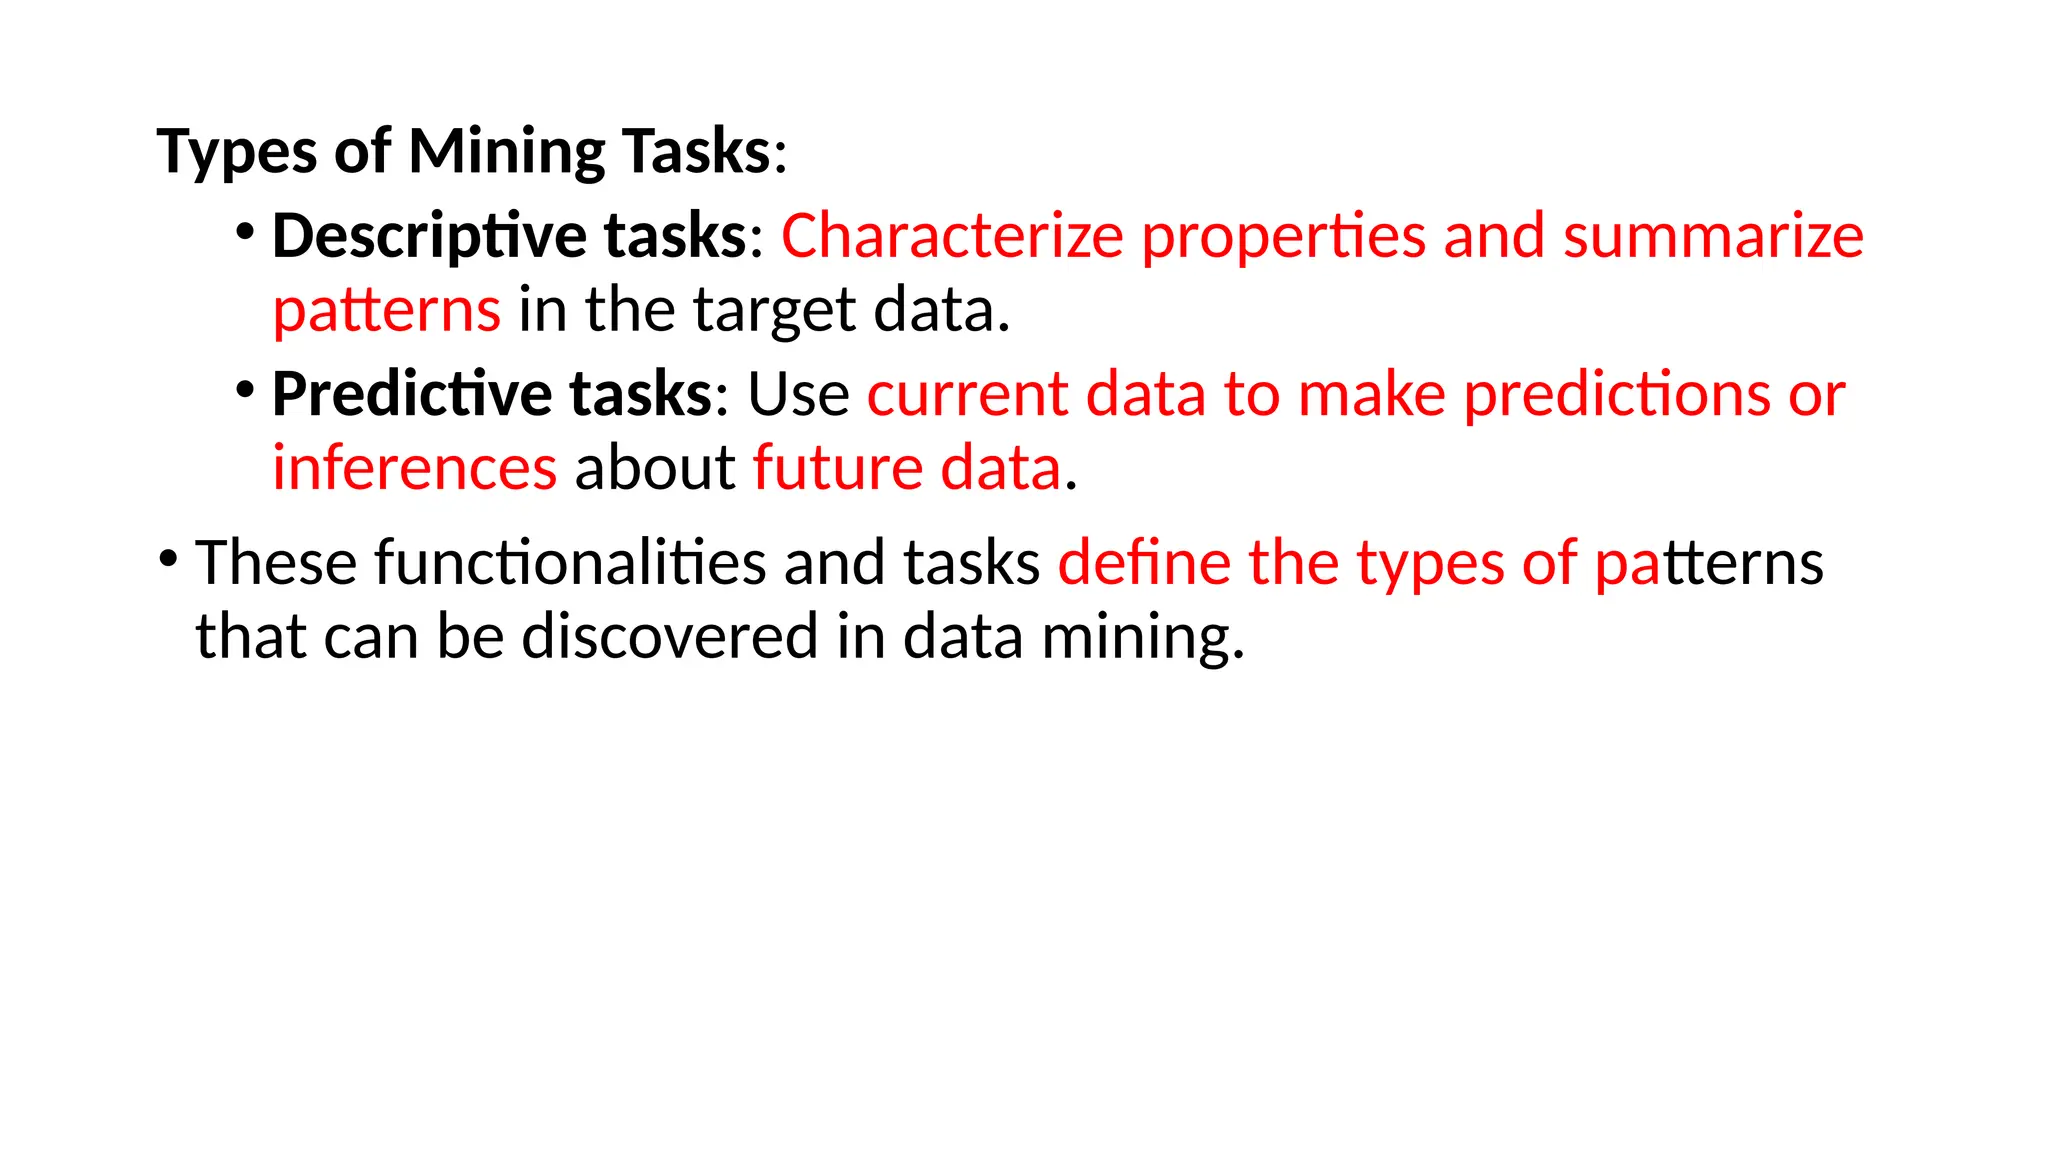
Types of MiningTasks:
• Descriptive tasks: Characterize properties and summarize
patterns in the target data.
• Predictive tasks: Use current data to make predictions or
inferences about future data.
• These functionalities and tasks define the types of patterns
that can be discovered in data mining.
54.
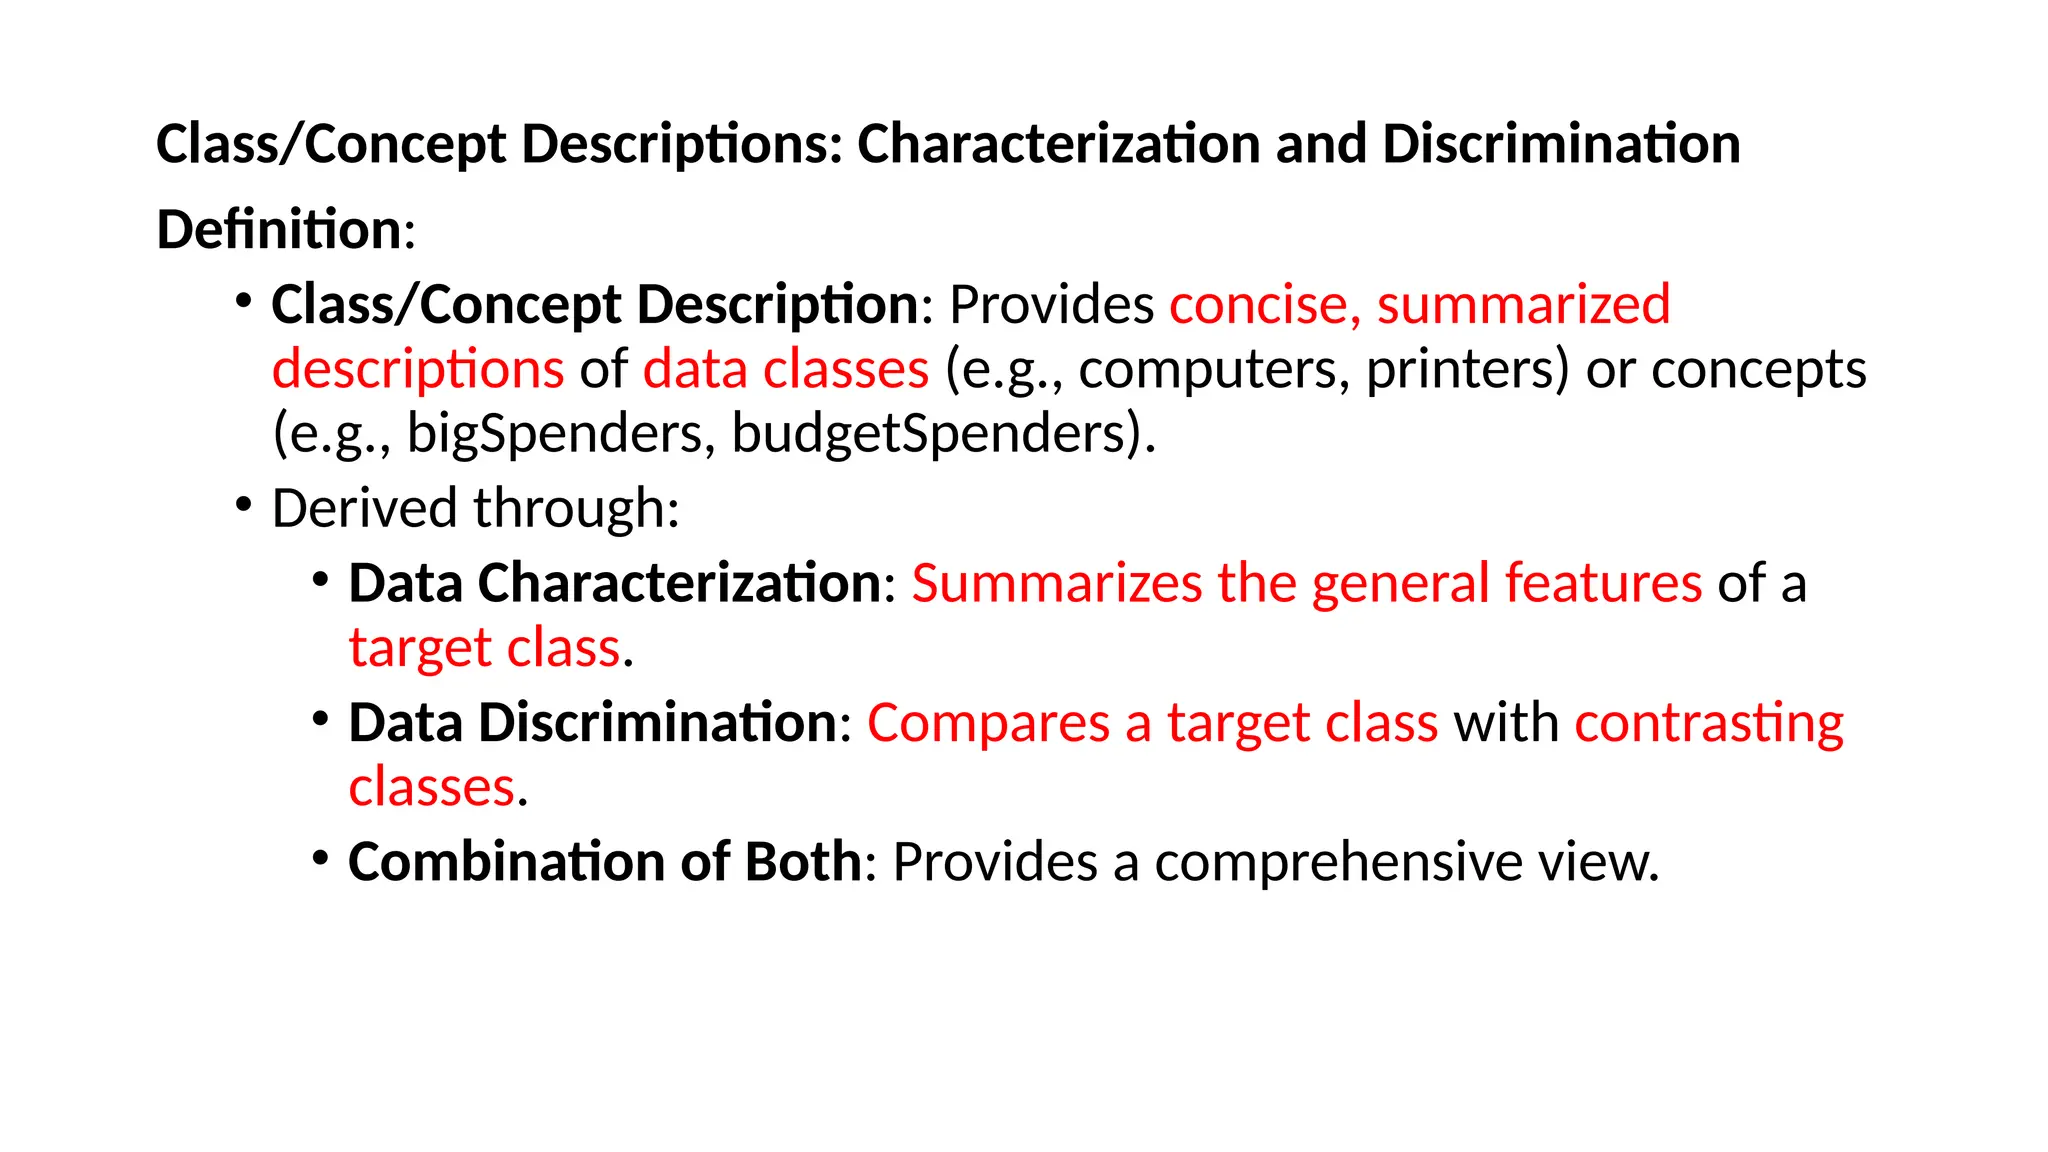
Class/Concept Descriptions: Characterizationand Discrimination
Definition:
• Class/Concept Description: Provides concise, summarized
descriptions of data classes (e.g., computers, printers) or concepts
(e.g., bigSpenders, budgetSpenders).
• Derived through:
• Data Characterization: Summarizes the general features of a
target class.
• Data Discrimination: Compares a target class with contrasting
classes.
• Combination of Both: Provides a comprehensive view.
55.
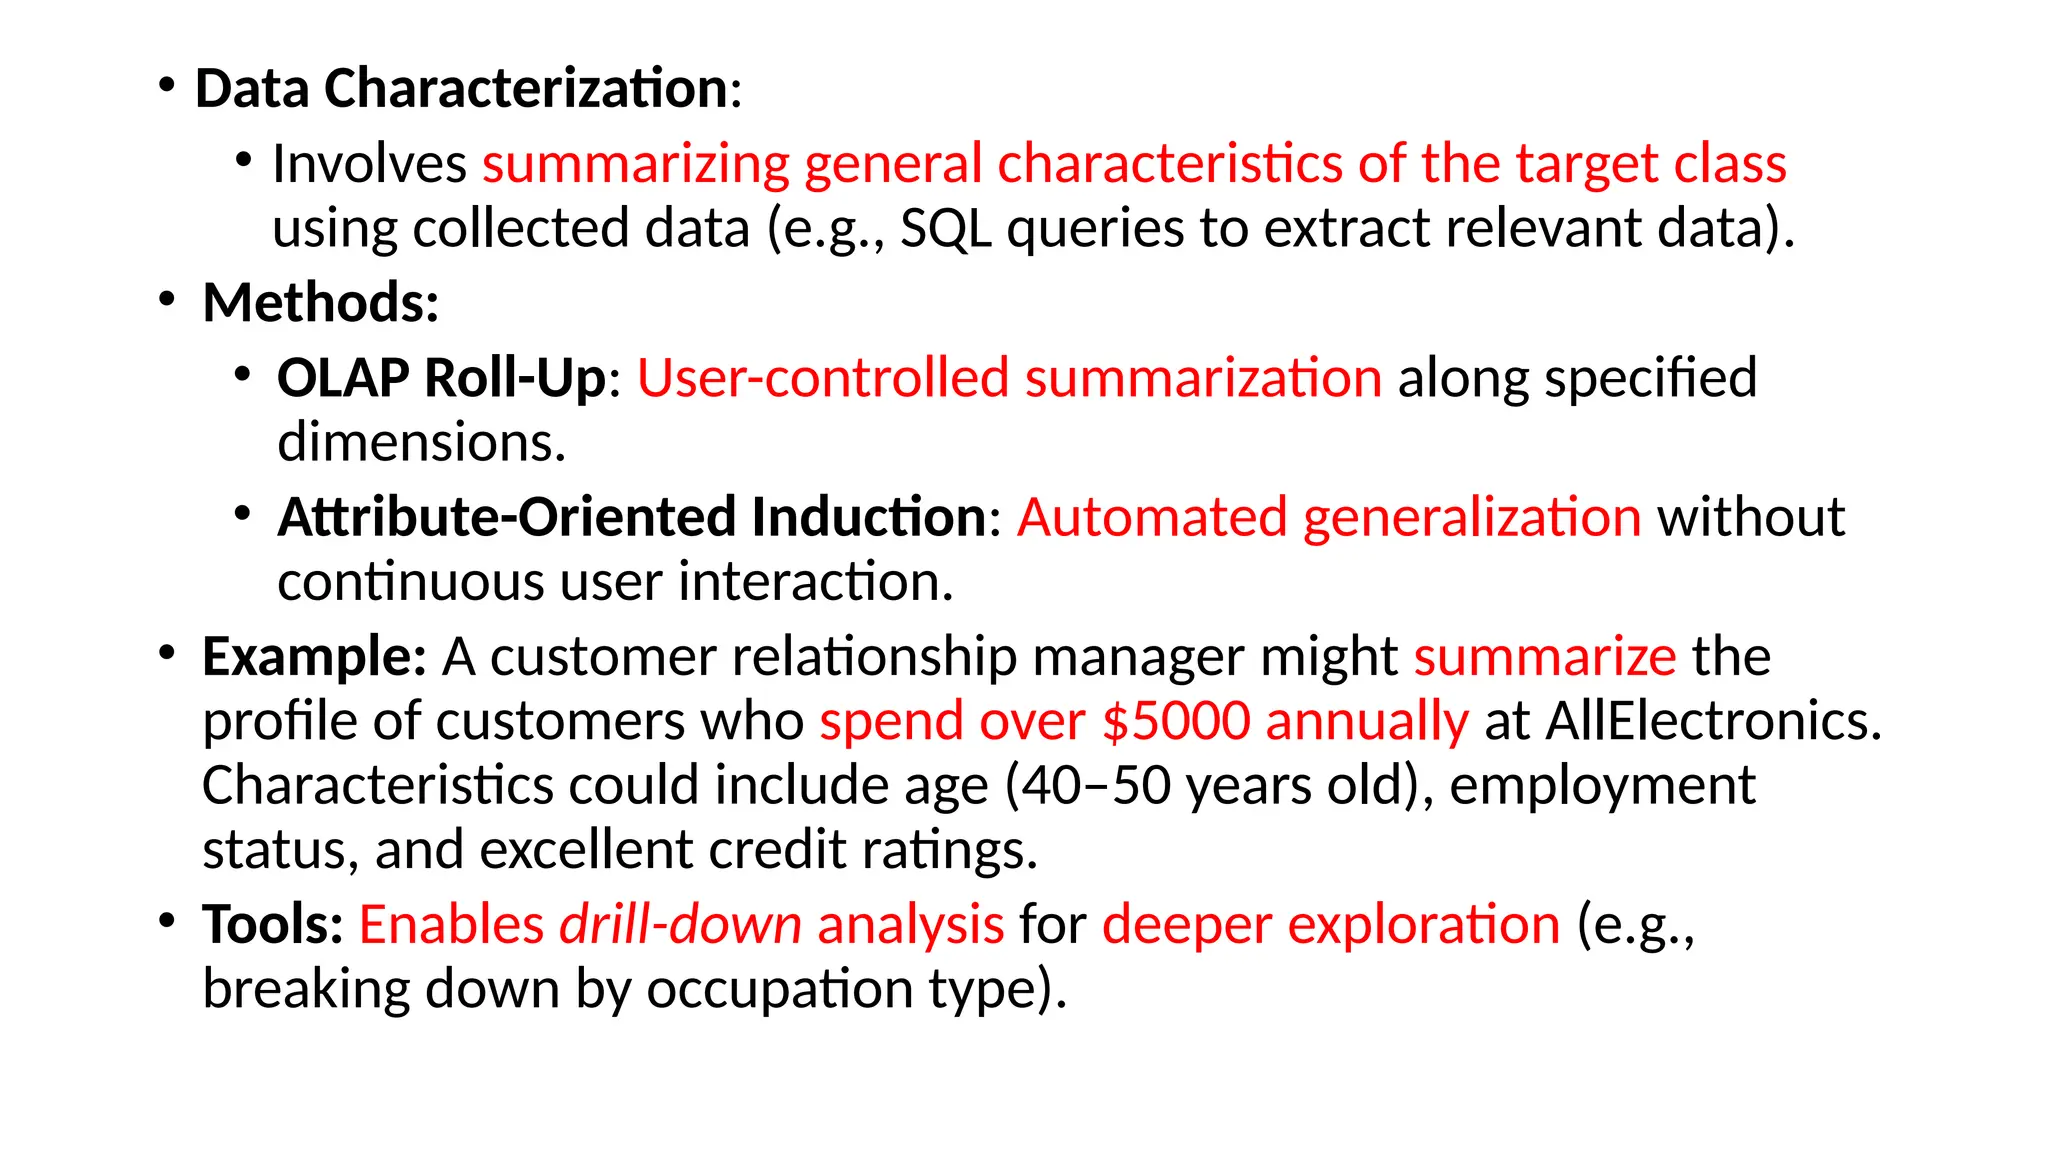
• Data Characterization:
•Involves summarizing general characteristics of the target class
using collected data (e.g., SQL queries to extract relevant data).
• Methods:
• OLAP Roll-Up: User-controlled summarization along specified
dimensions.
• Attribute-Oriented Induction: Automated generalization without
continuous user interaction.
• Example: A customer relationship manager might summarize the
profile of customers who spend over $5000 annually at AllElectronics.
Characteristics could include age (40–50 years old), employment
status, and excellent credit ratings.
• Tools: Enables drill-down analysis for deeper exploration (e.g.,
breaking down by occupation type).
56.
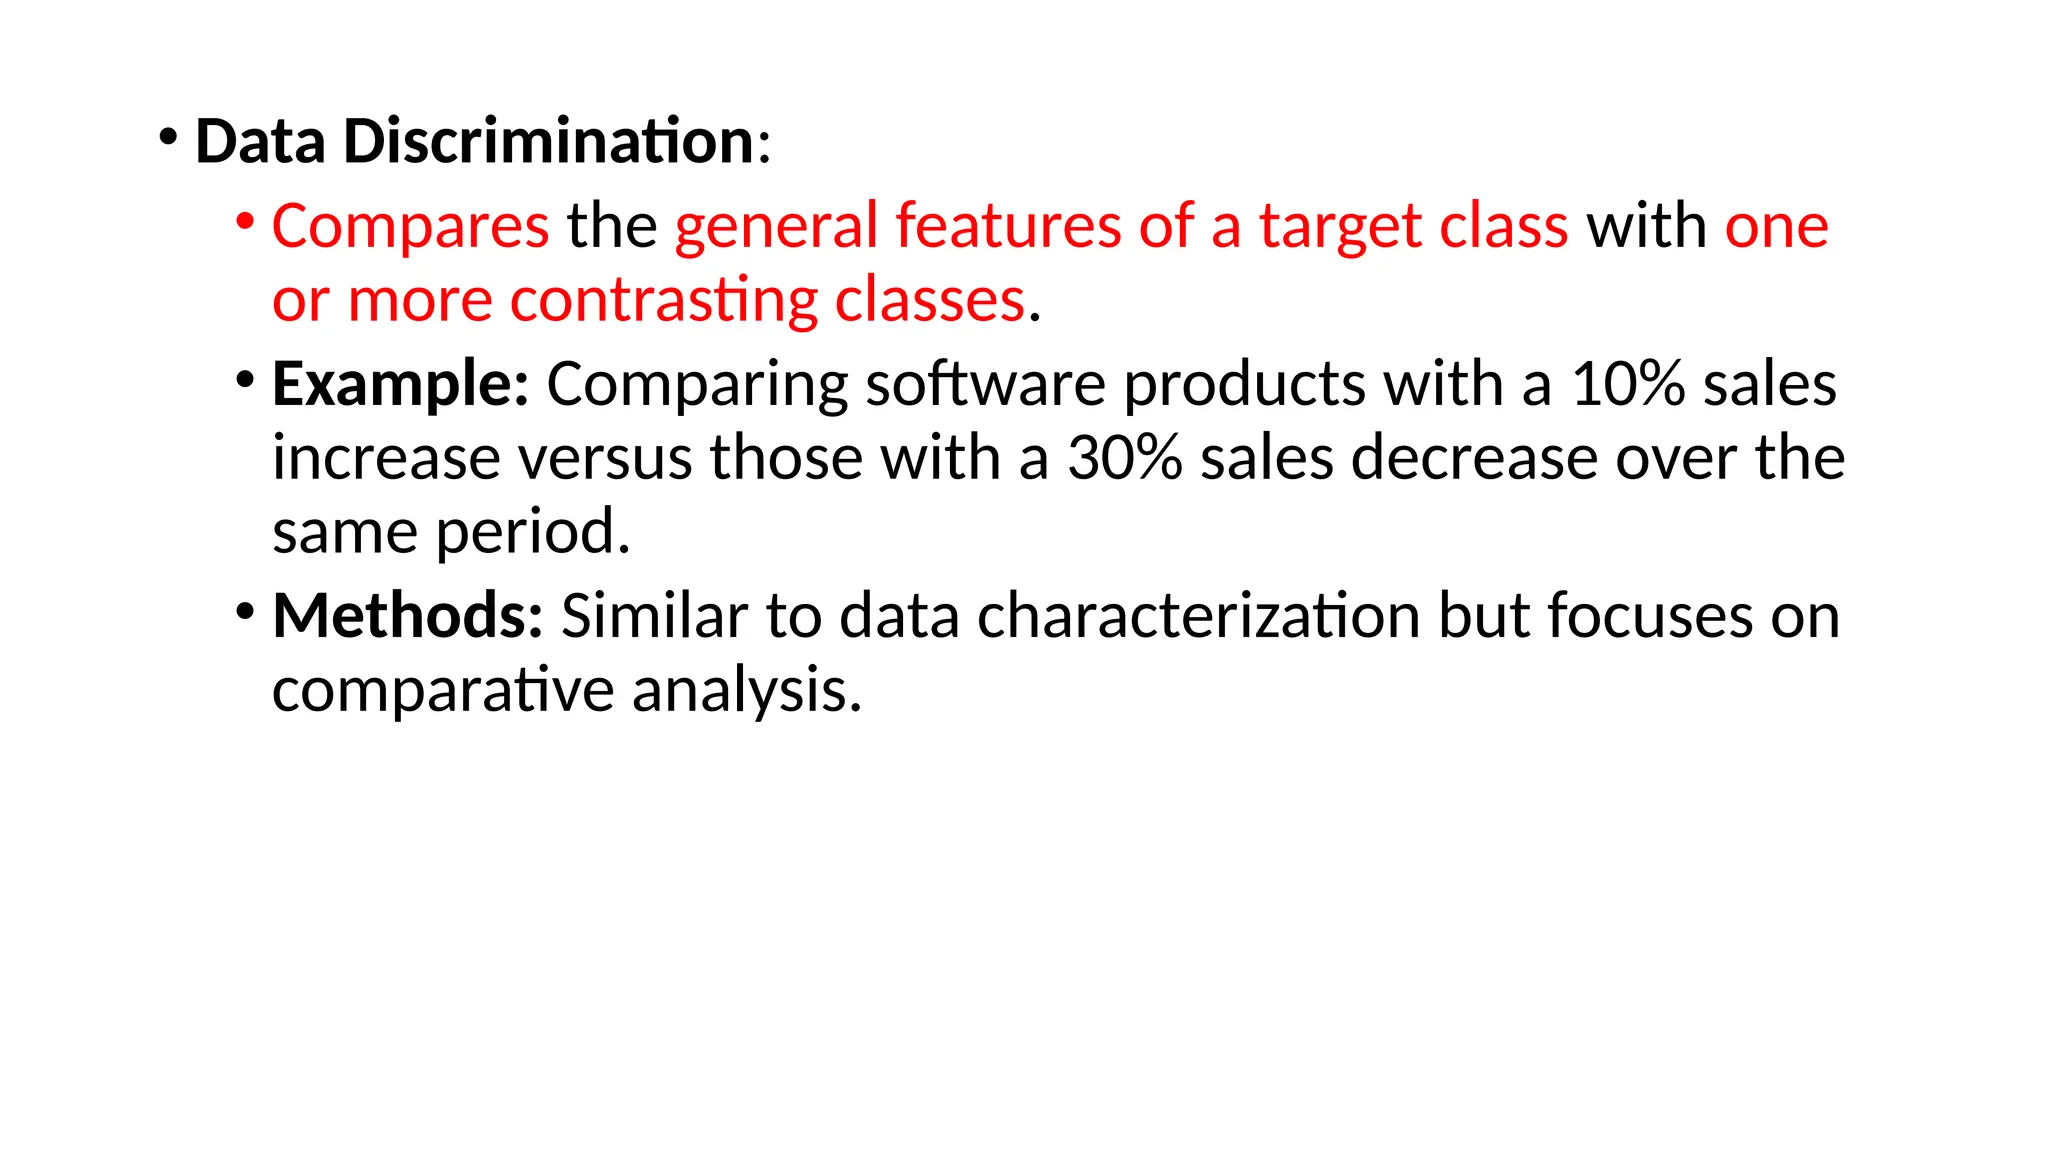
• Data Discrimination:
•Compares the general features of a target class with one
or more contrasting classes.
• Example: Comparing software products with a 10% sales
increase versus those with a 30% sales decrease over the
same period.
• Methods: Similar to data characterization but focuses on
comparative analysis.
57.
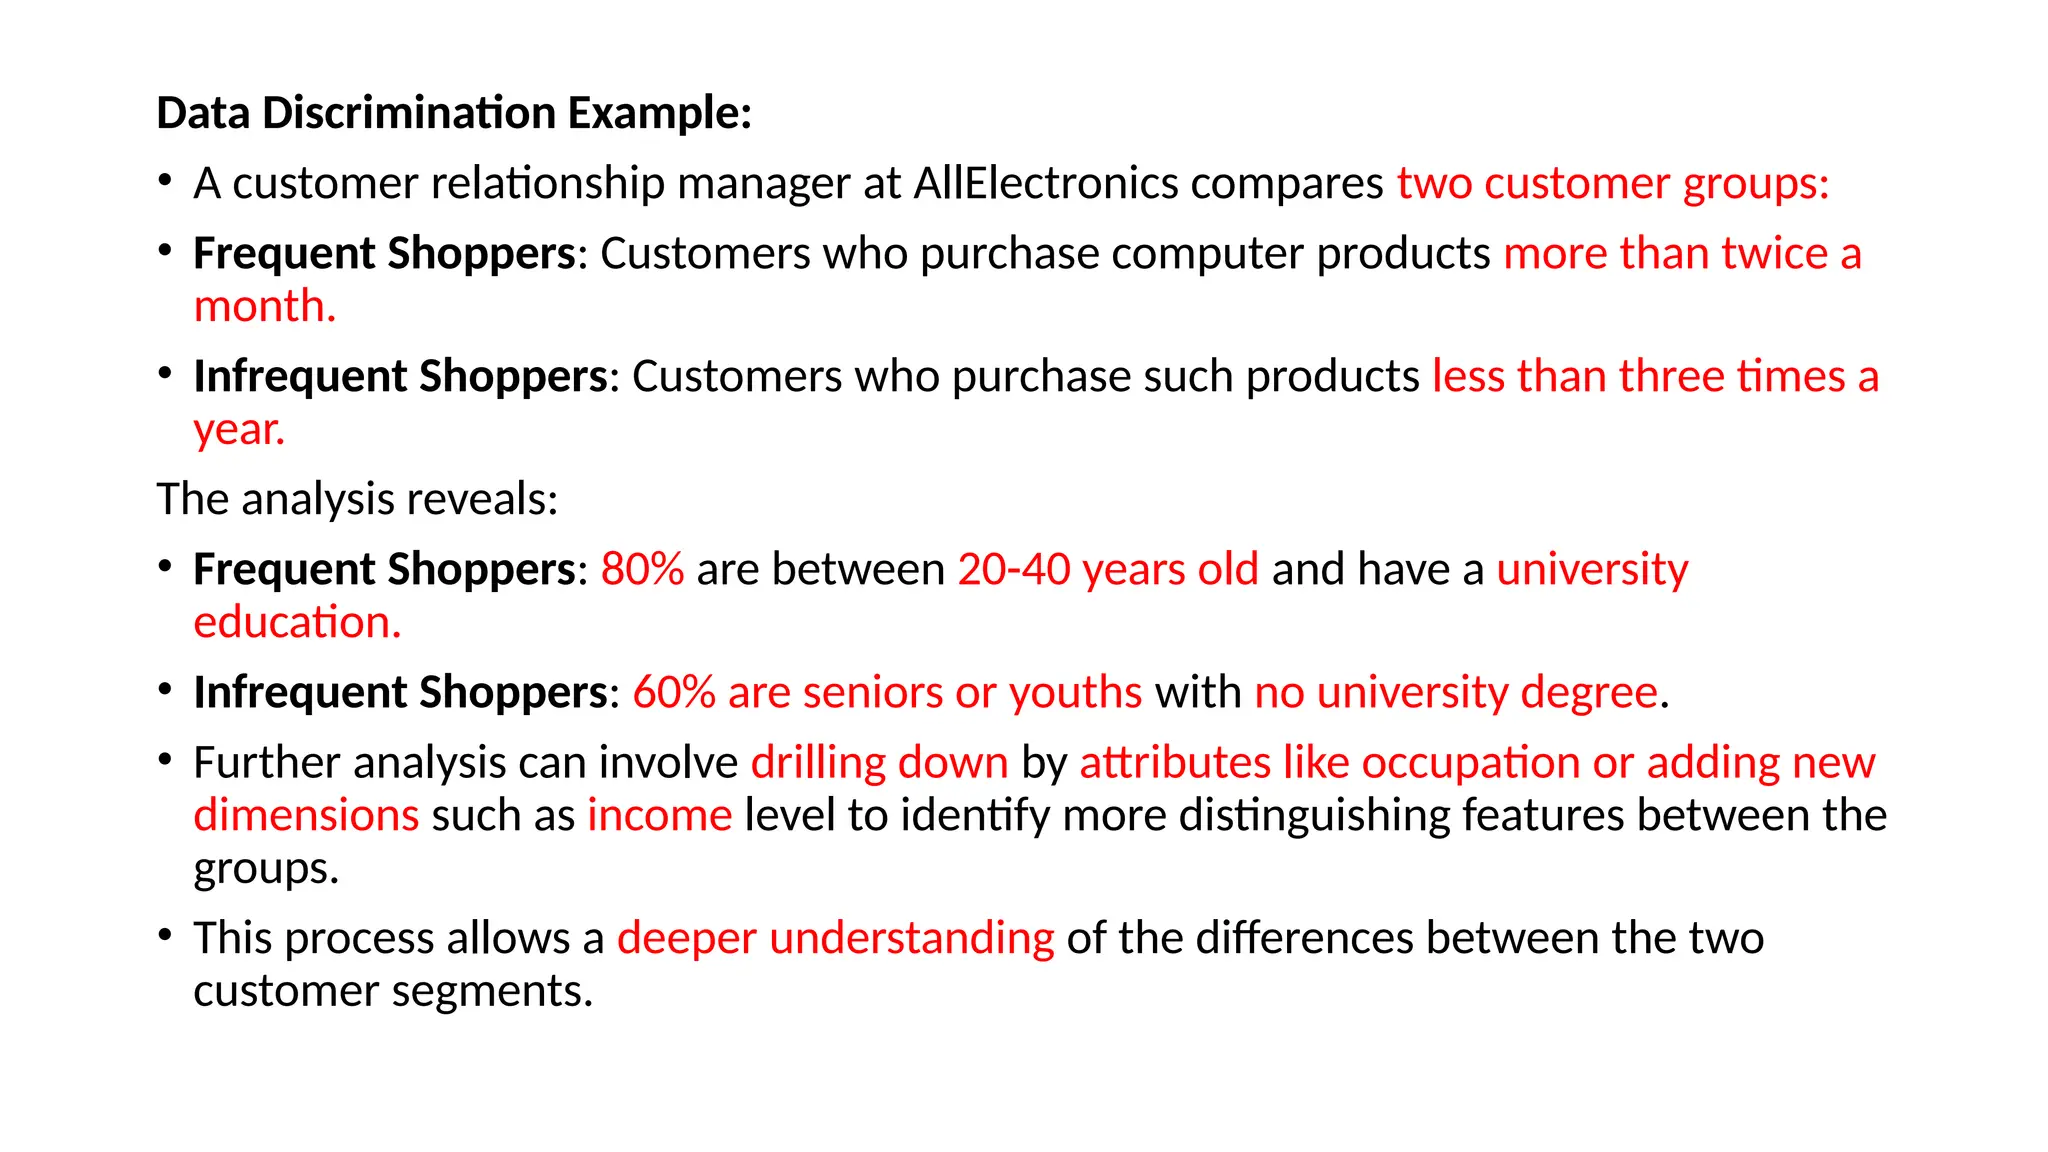
Data Discrimination Example:
•A customer relationship manager at AllElectronics compares two customer groups:
• Frequent Shoppers: Customers who purchase computer products more than twice a
month.
• Infrequent Shoppers: Customers who purchase such products less than three times a
year.
The analysis reveals:
• Frequent Shoppers: 80% are between 20-40 years old and have a university
education.
• Infrequent Shoppers: 60% are seniors or youths with no university degree.
• Further analysis can involve drilling down by attributes like occupation or adding new
dimensions such as income level to identify more distinguishing features between the
groups.
• This process allows a deeper understanding of the differences between the two
customer segments.
58.
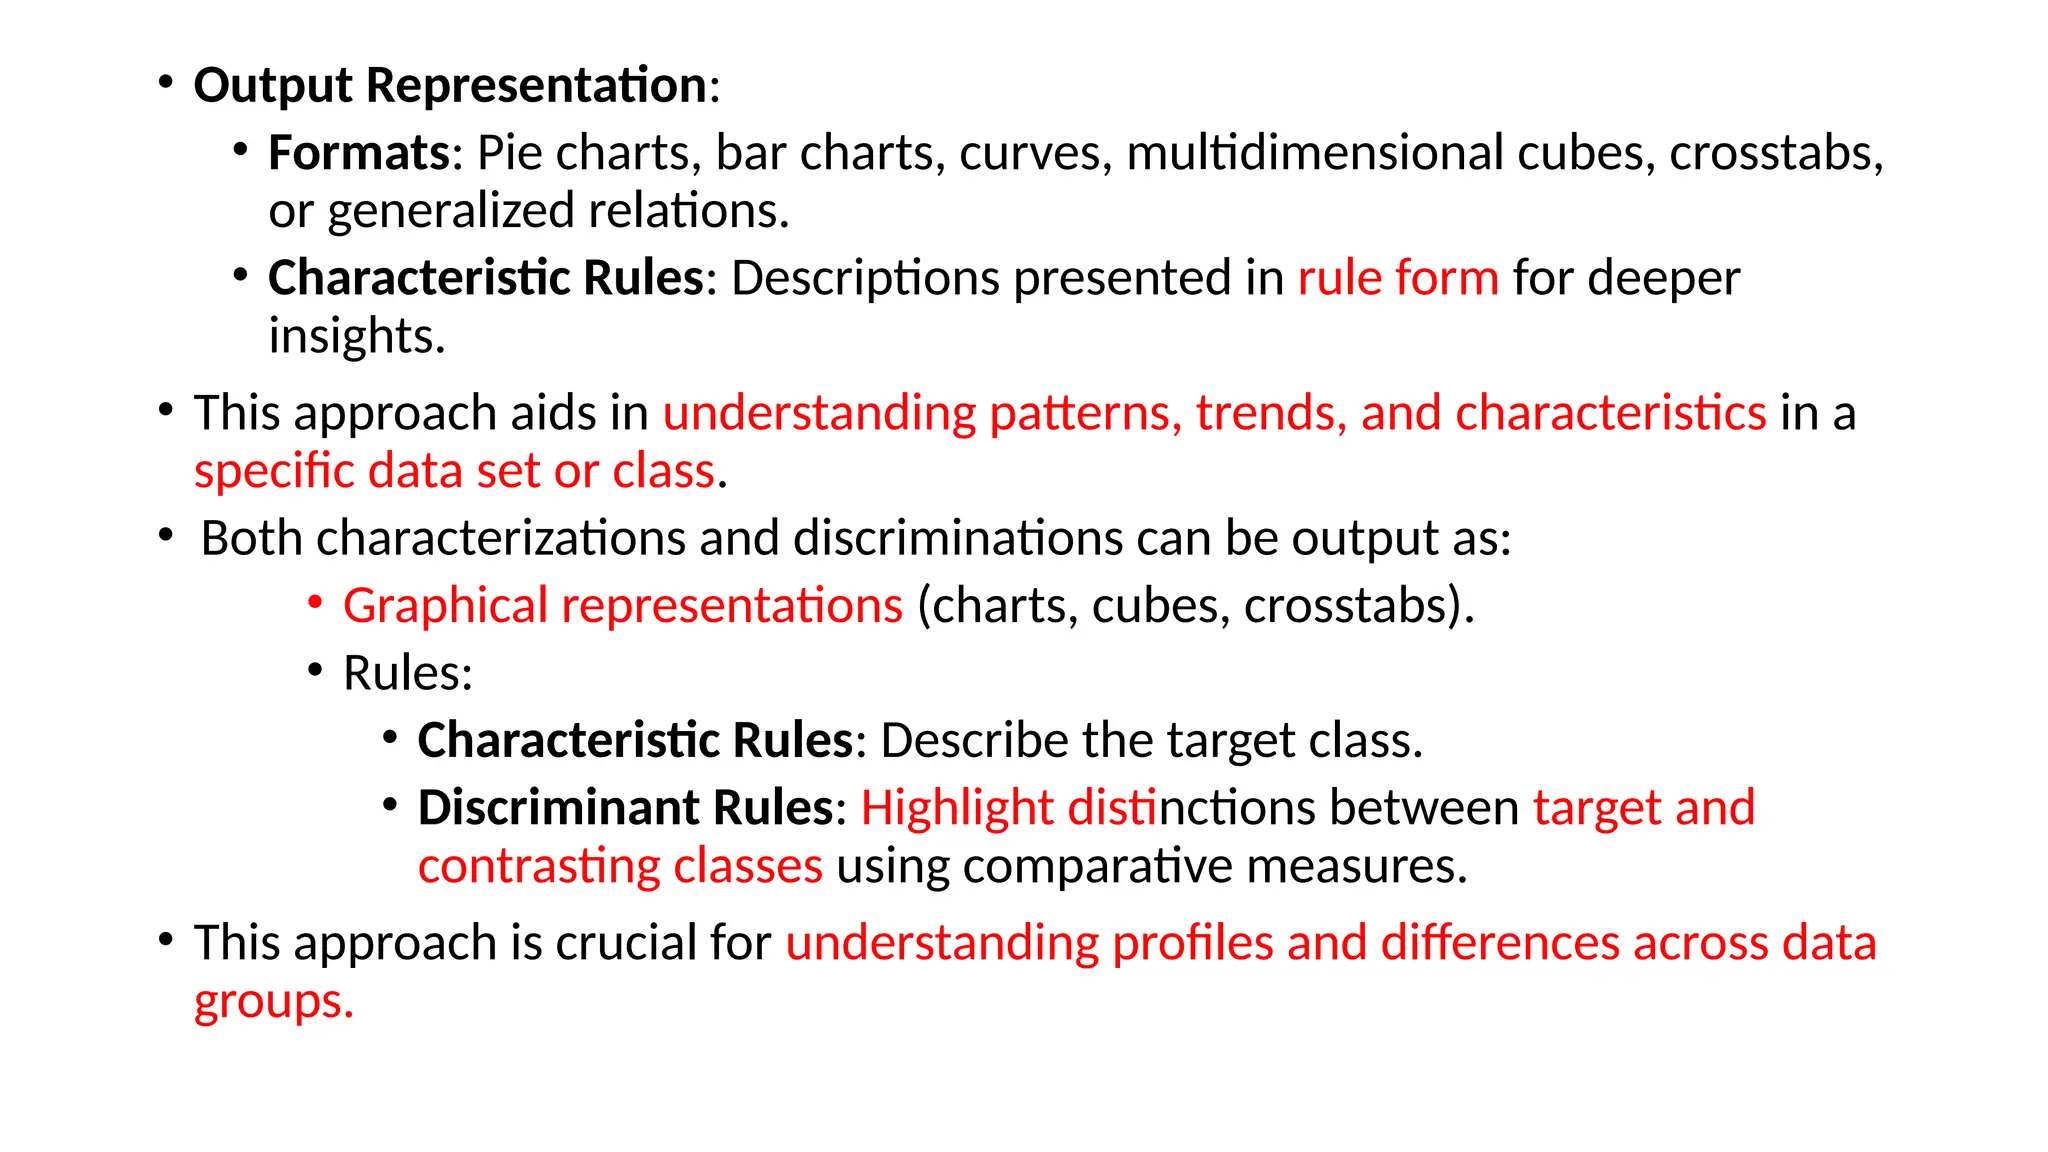
• Output Representation:
•Formats: Pie charts, bar charts, curves, multidimensional cubes, crosstabs,
or generalized relations.
• Characteristic Rules: Descriptions presented in rule form for deeper
insights.
• This approach aids in understanding patterns, trends, and characteristics in a
specific data set or class.
• Both characterizations and discriminations can be output as:
• Graphical representations (charts, cubes, crosstabs).
• Rules:
• Characteristic Rules: Describe the target class.
• Discriminant Rules: Highlight distinctions between target and
contrasting classes using comparative measures.
• This approach is crucial for understanding profiles and differences across data
groups.
59.
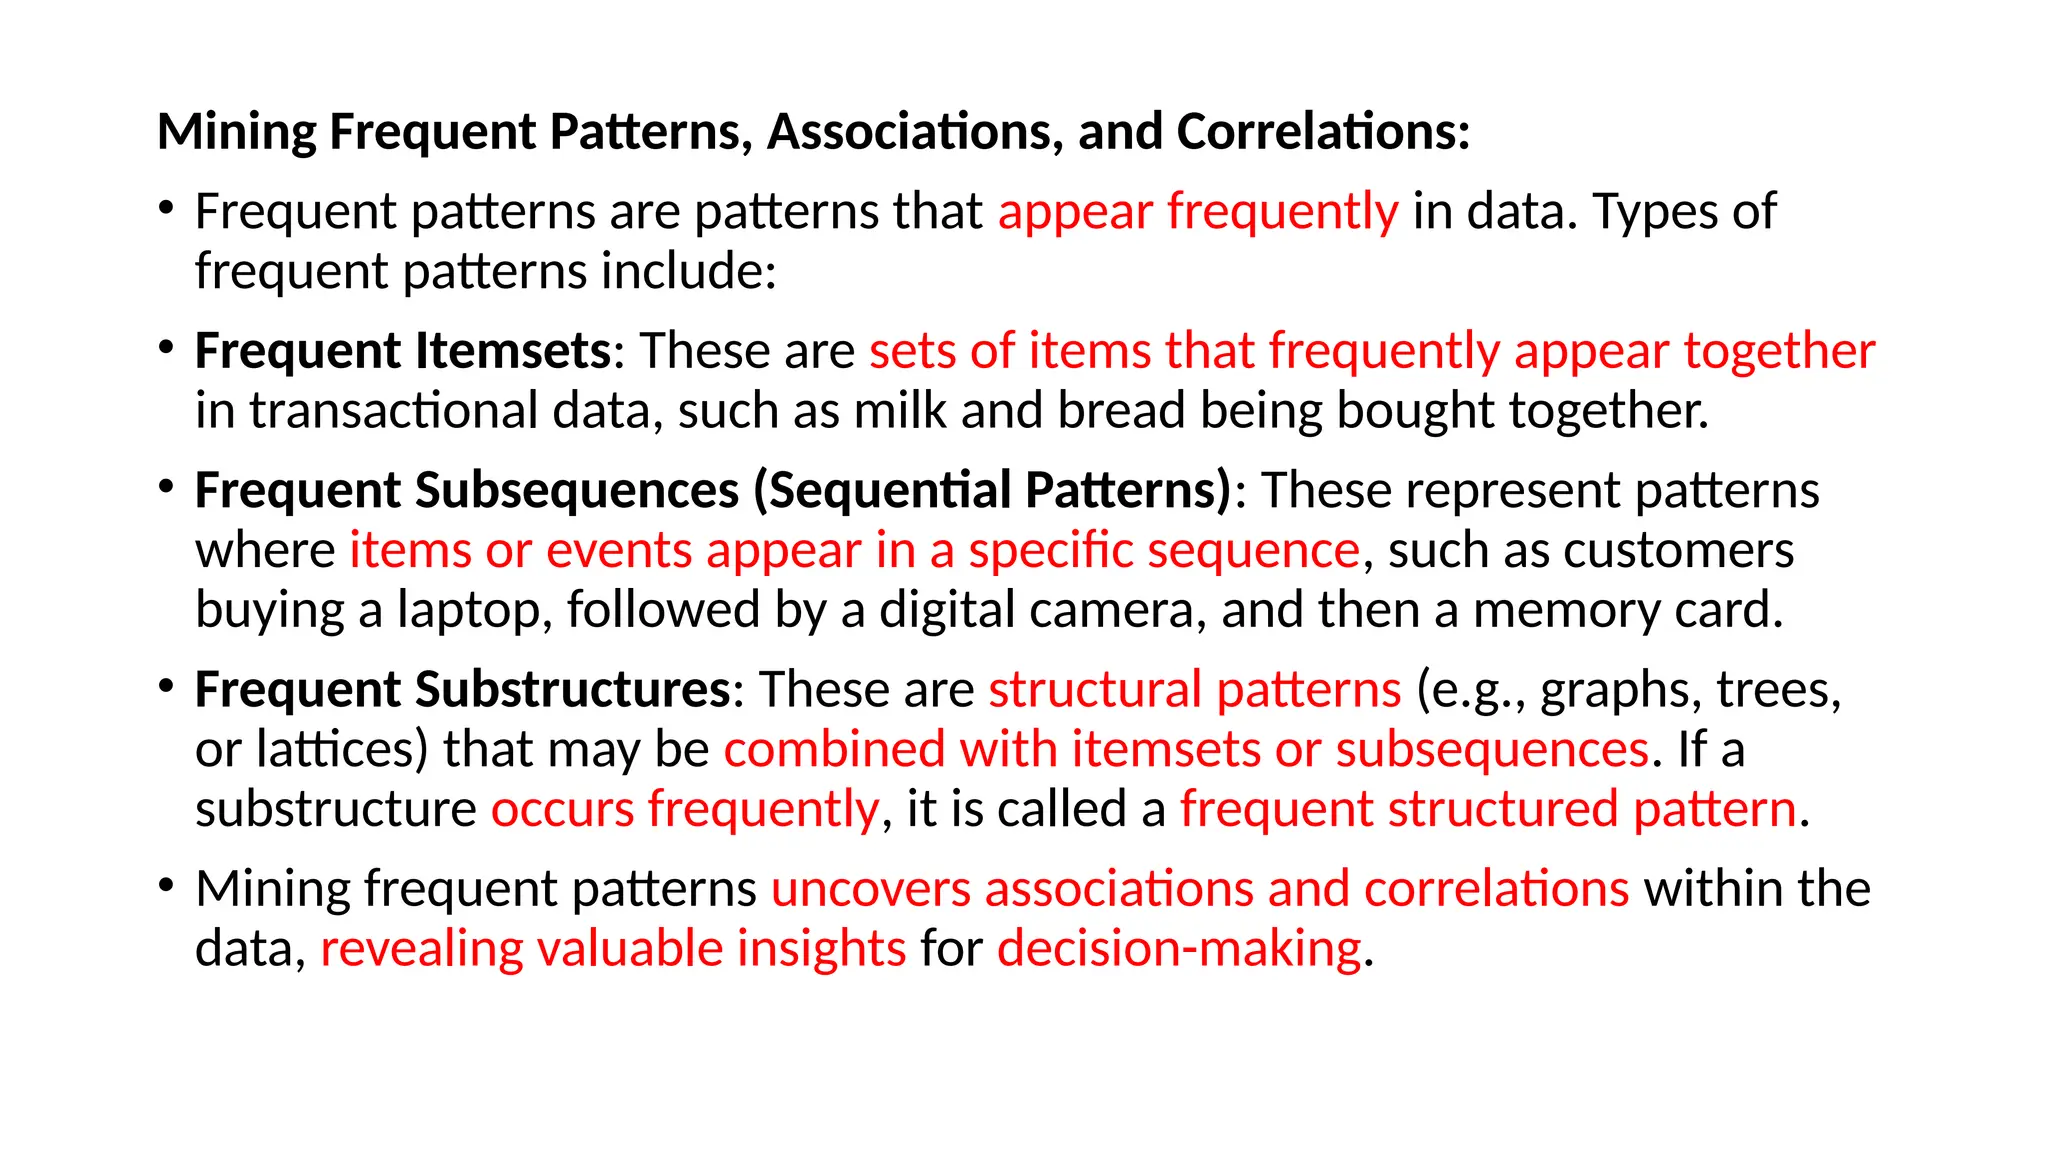
Mining Frequent Patterns,Associations, and Correlations:
• Frequent patterns are patterns that appear frequently in data. Types of
frequent patterns include:
• Frequent Itemsets: These are sets of items that frequently appear together
in transactional data, such as milk and bread being bought together.
• Frequent Subsequences (Sequential Patterns): These represent patterns
where items or events appear in a specific sequence, such as customers
buying a laptop, followed by a digital camera, and then a memory card.
• Frequent Substructures: These are structural patterns (e.g., graphs, trees,
or lattices) that may be combined with itemsets or subsequences. If a
substructure occurs frequently, it is called a frequent structured pattern.
• Mining frequent patterns uncovers associations and correlations within the
data, revealing valuable insights for decision-making.
60.
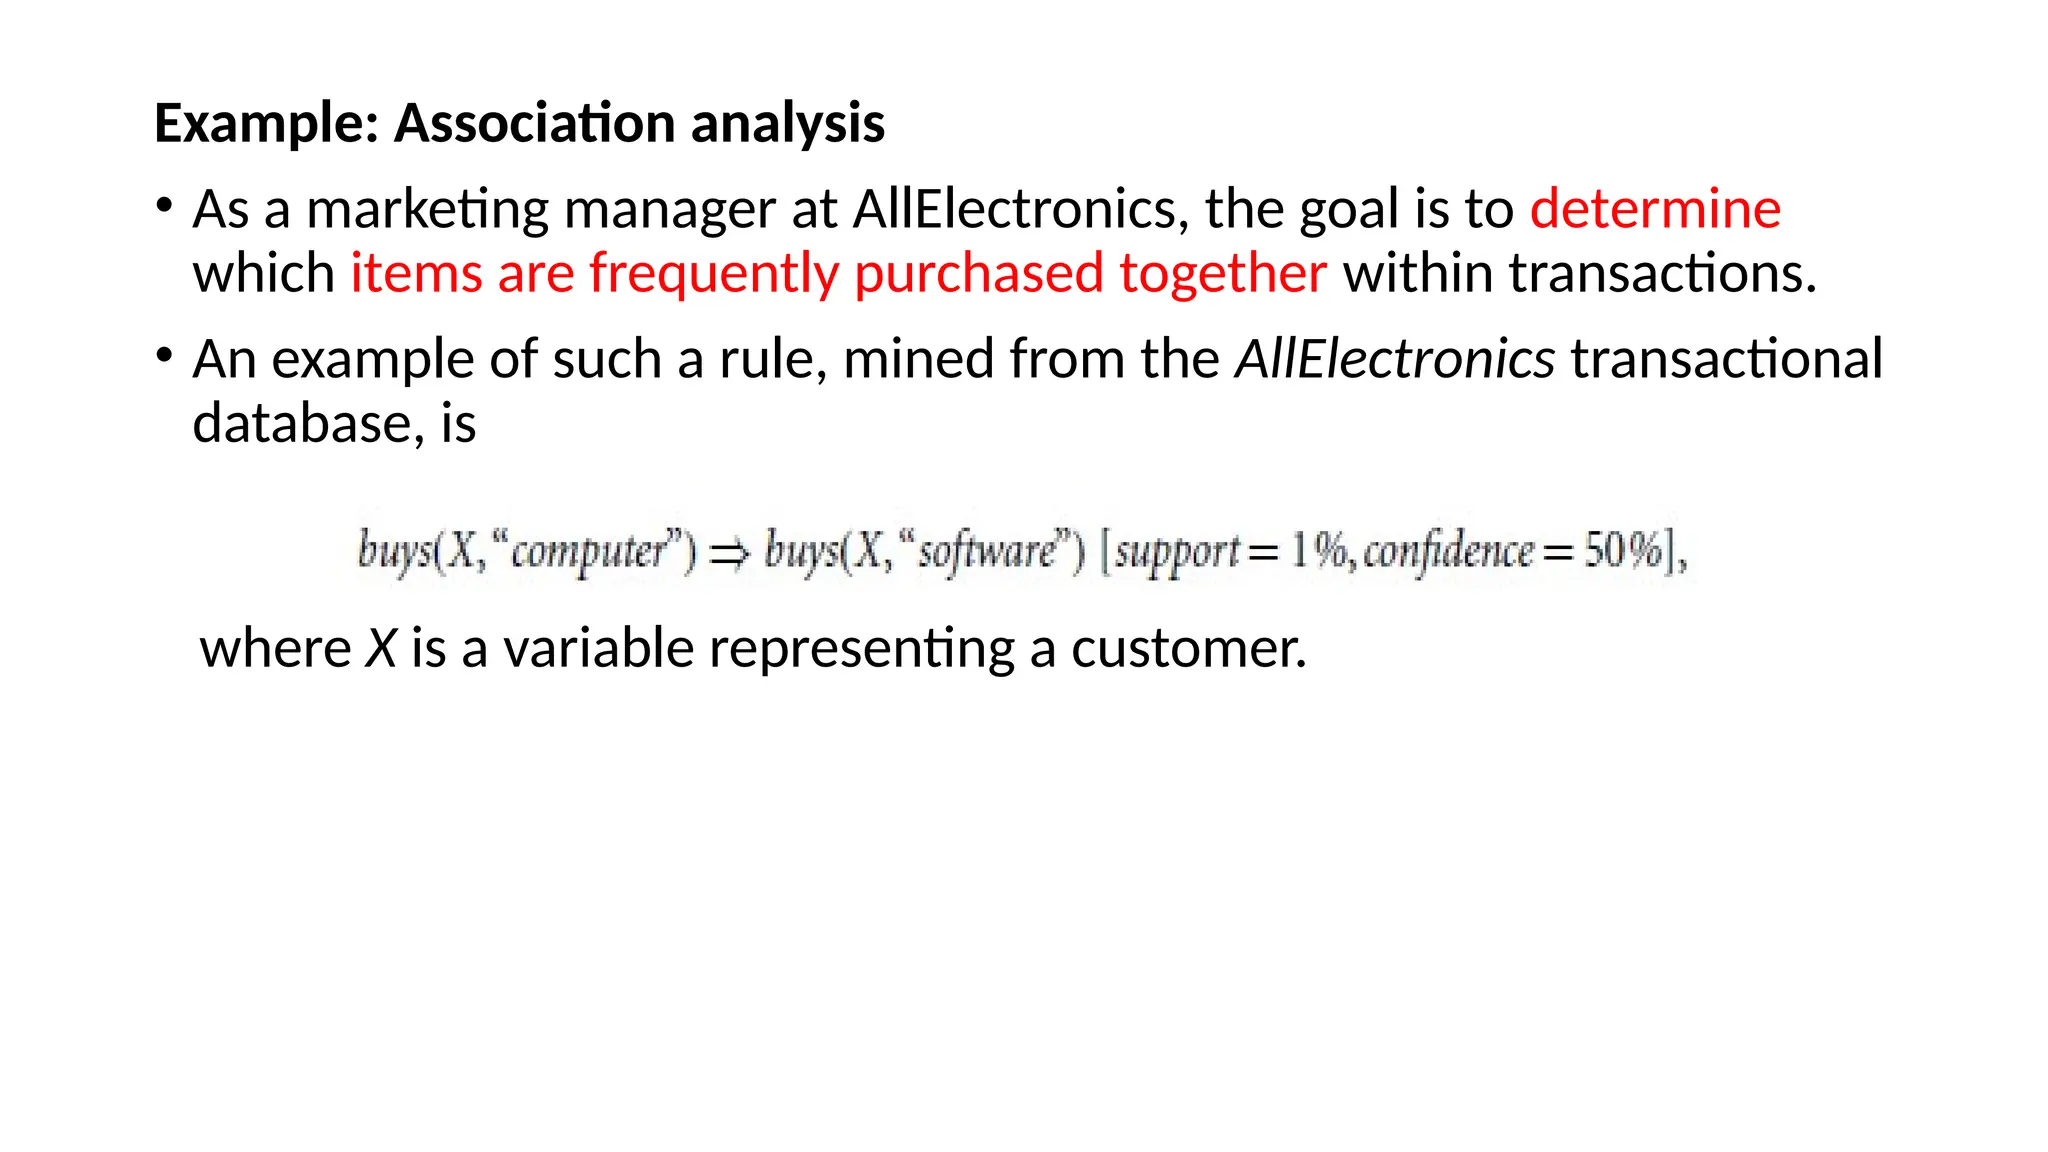
Example: Association analysis
•As a marketing manager at AllElectronics, the goal is to determine
which items are frequently purchased together within transactions.
• An example of such a rule, mined from the AllElectronics transactional
database, is
where X is a variable representing a customer.
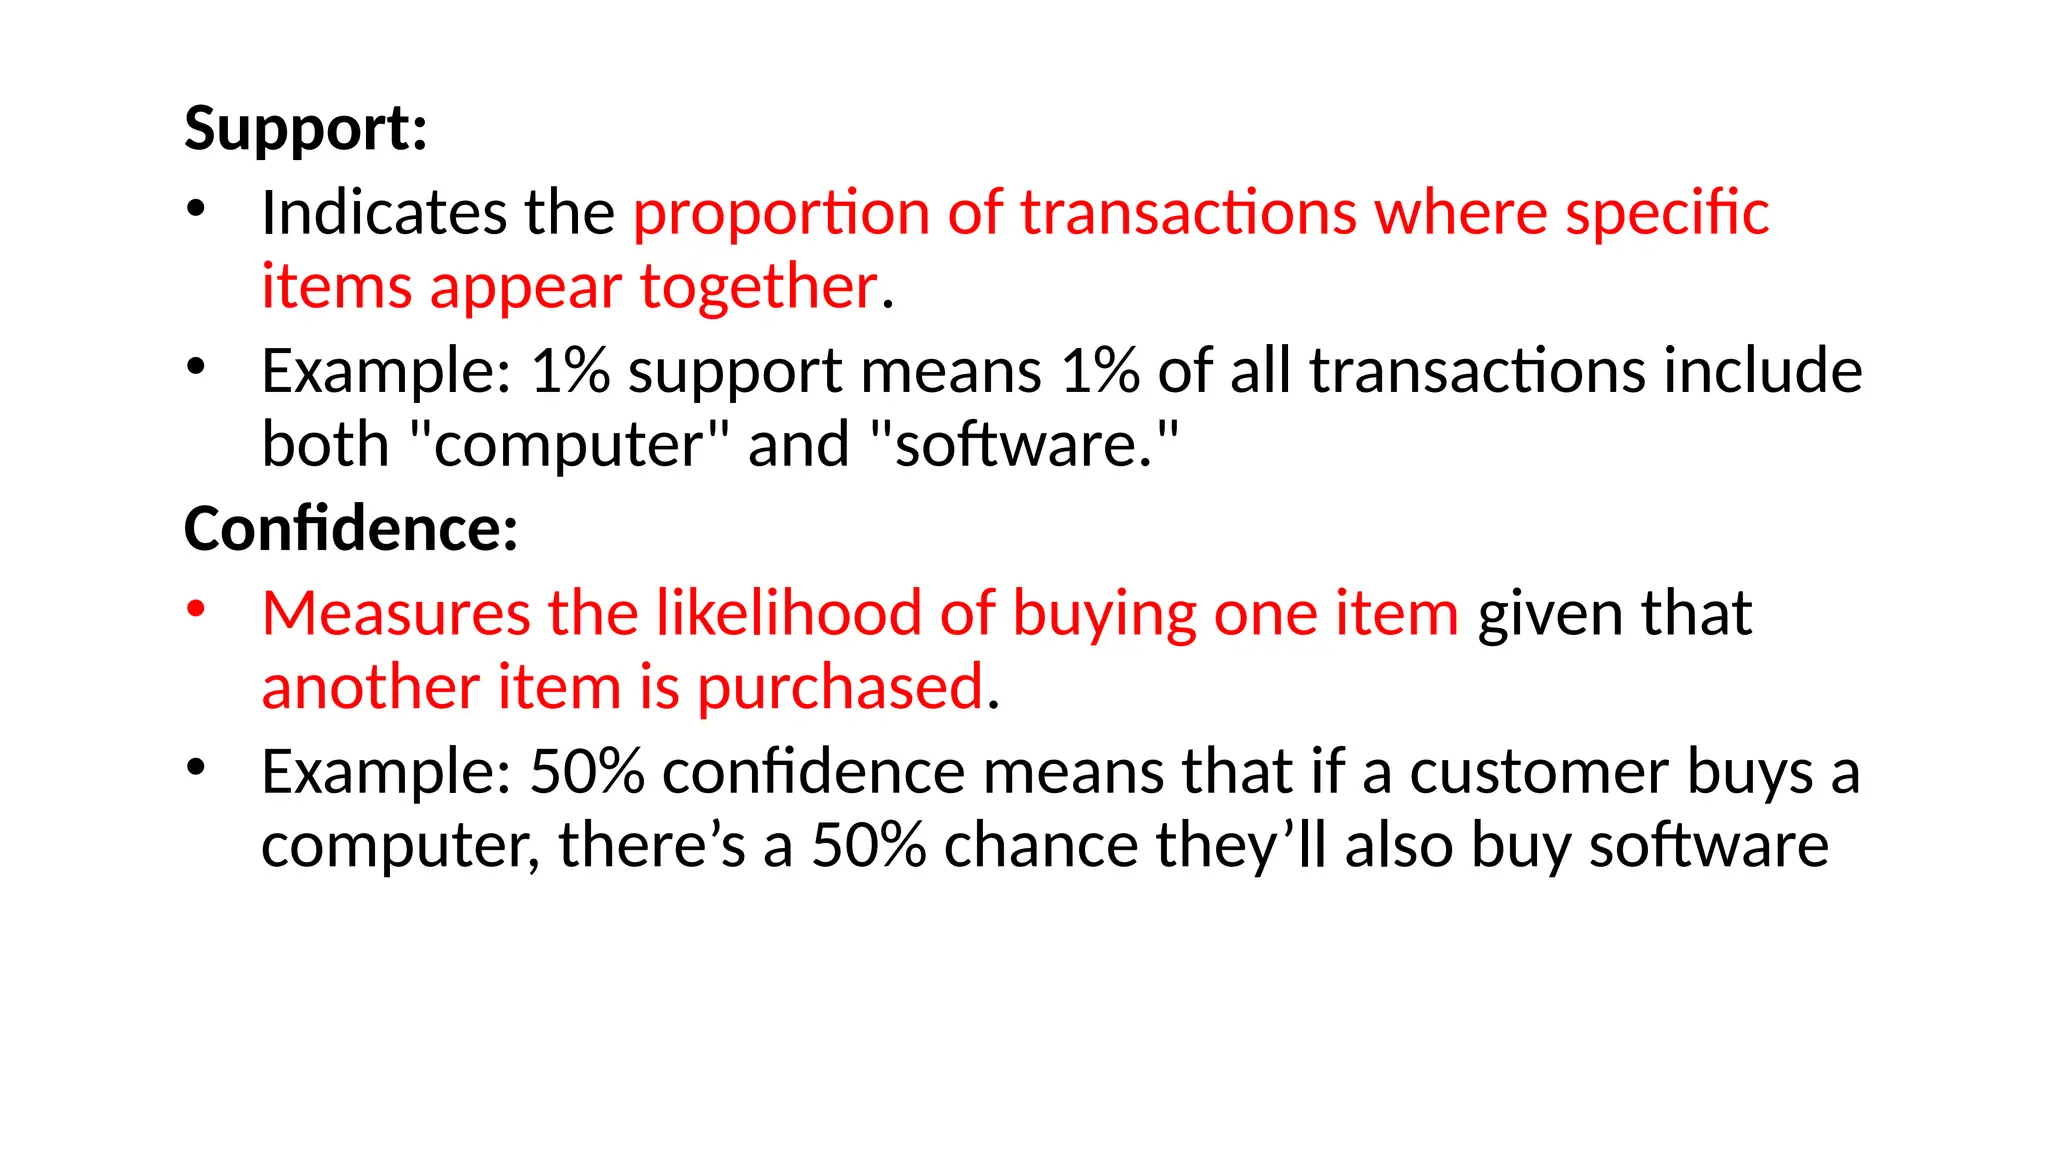
61.
Support:
• Indicates theproportion of transactions where specific
items appear together.
• Example: 1% support means 1% of all transactions include
both "computer" and "software."
Confidence:
• Measures the likelihood of buying one item given that
another item is purchased.
• Example: 50% confidence means that if a customer buys a
computer, there’s a 50% chance they’ll also buy software
62.
• Types ofAssociation Rules:
• Single-Dimensional Rules: Involve one attribute or predicate (e.g.,
"buys").
• Multidimensional Rules: Involve multiple attributes or dimensions
(e.g., age, income, and purchases).
• Example: "20-29 years old, $40,000-$49,000 income → buys
laptop [2%, 60%]."
• Thresholds for Interest:
• Rules are considered useful only if they meet minimum support
and minimum confidence thresholds.
63.
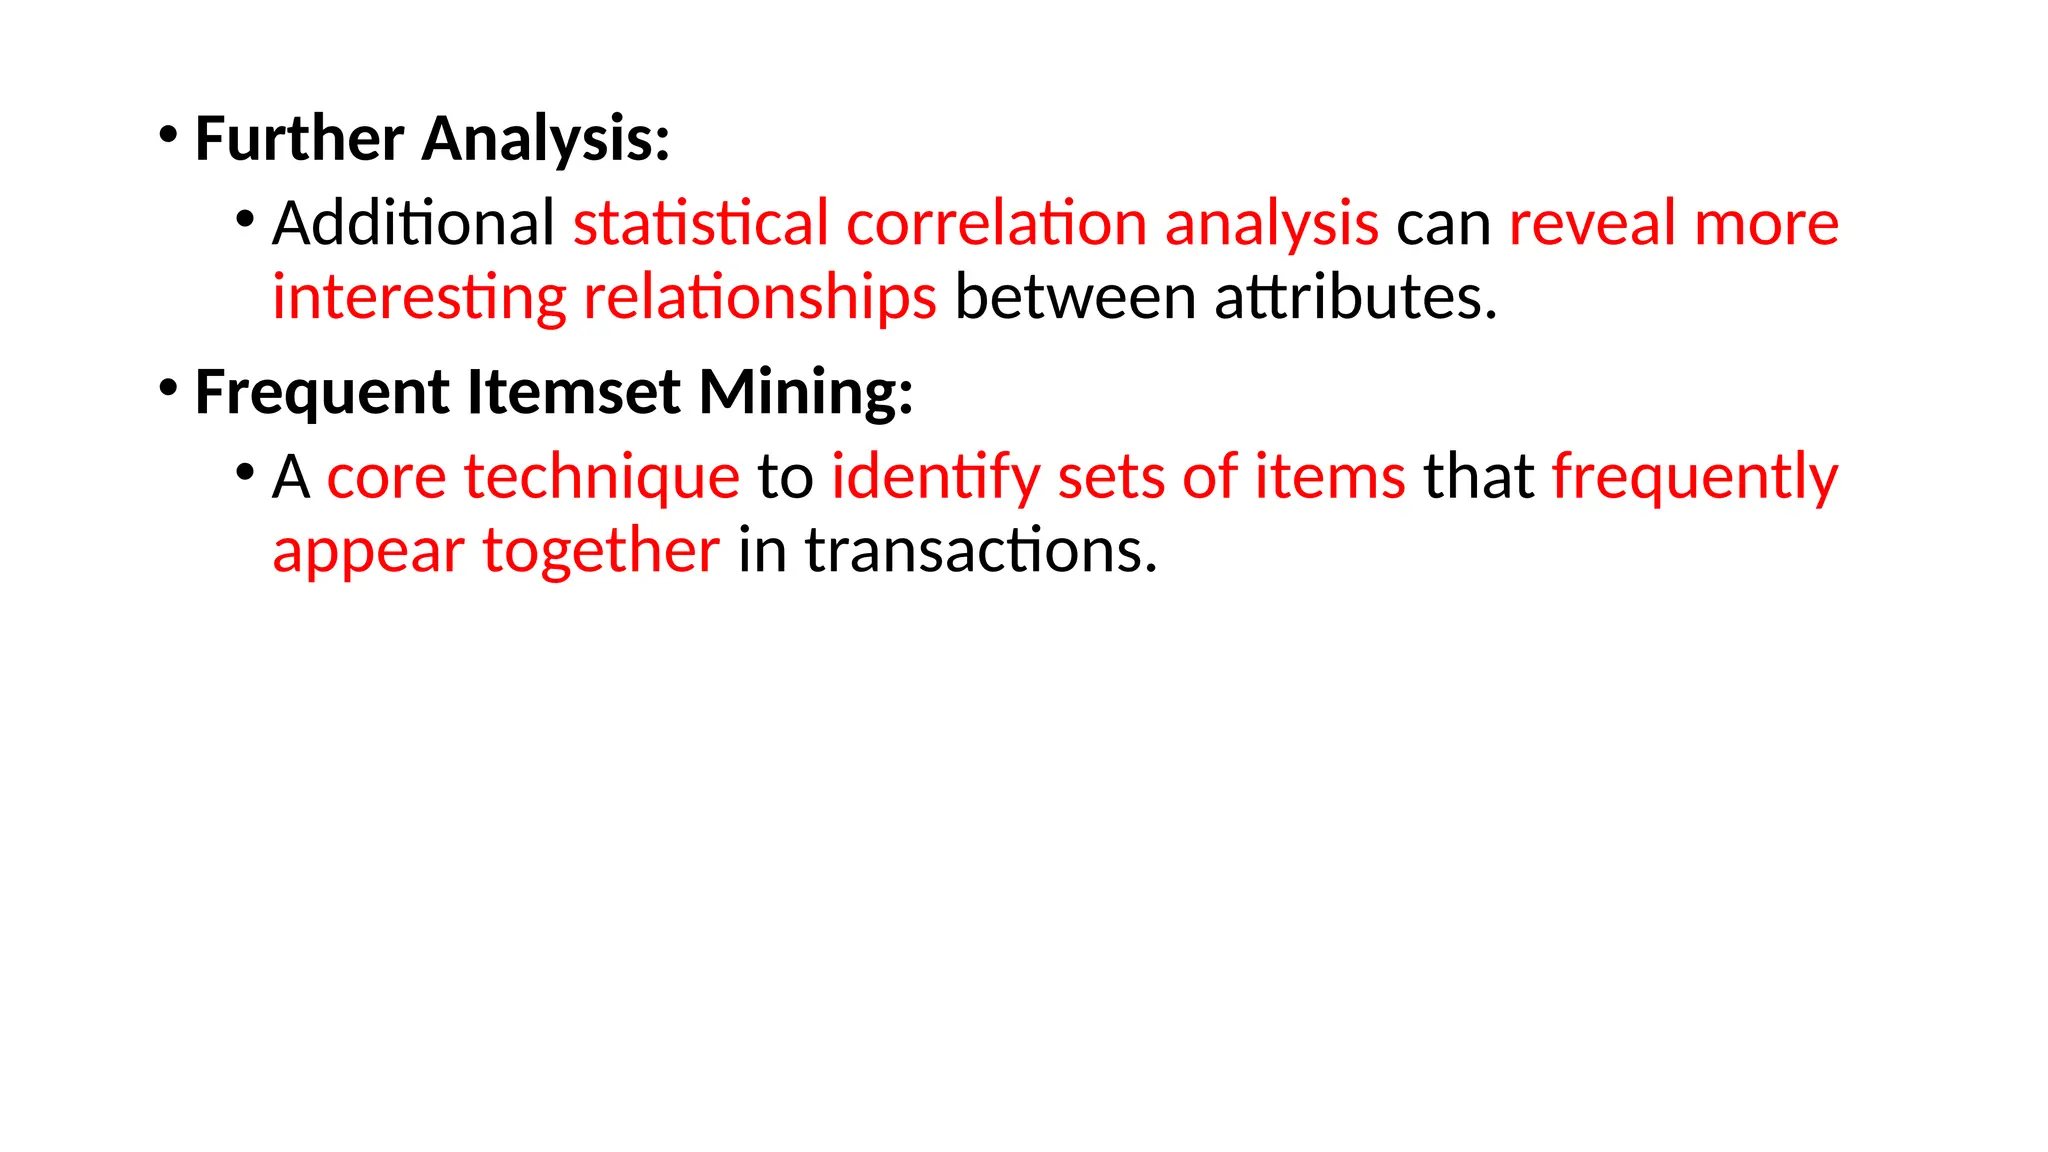
• Further Analysis:
•Additional statistical correlation analysis can reveal more
interesting relationships between attributes.
• Frequent Itemset Mining:
• A core technique to identify sets of items that frequently
appear together in transactions.
64.
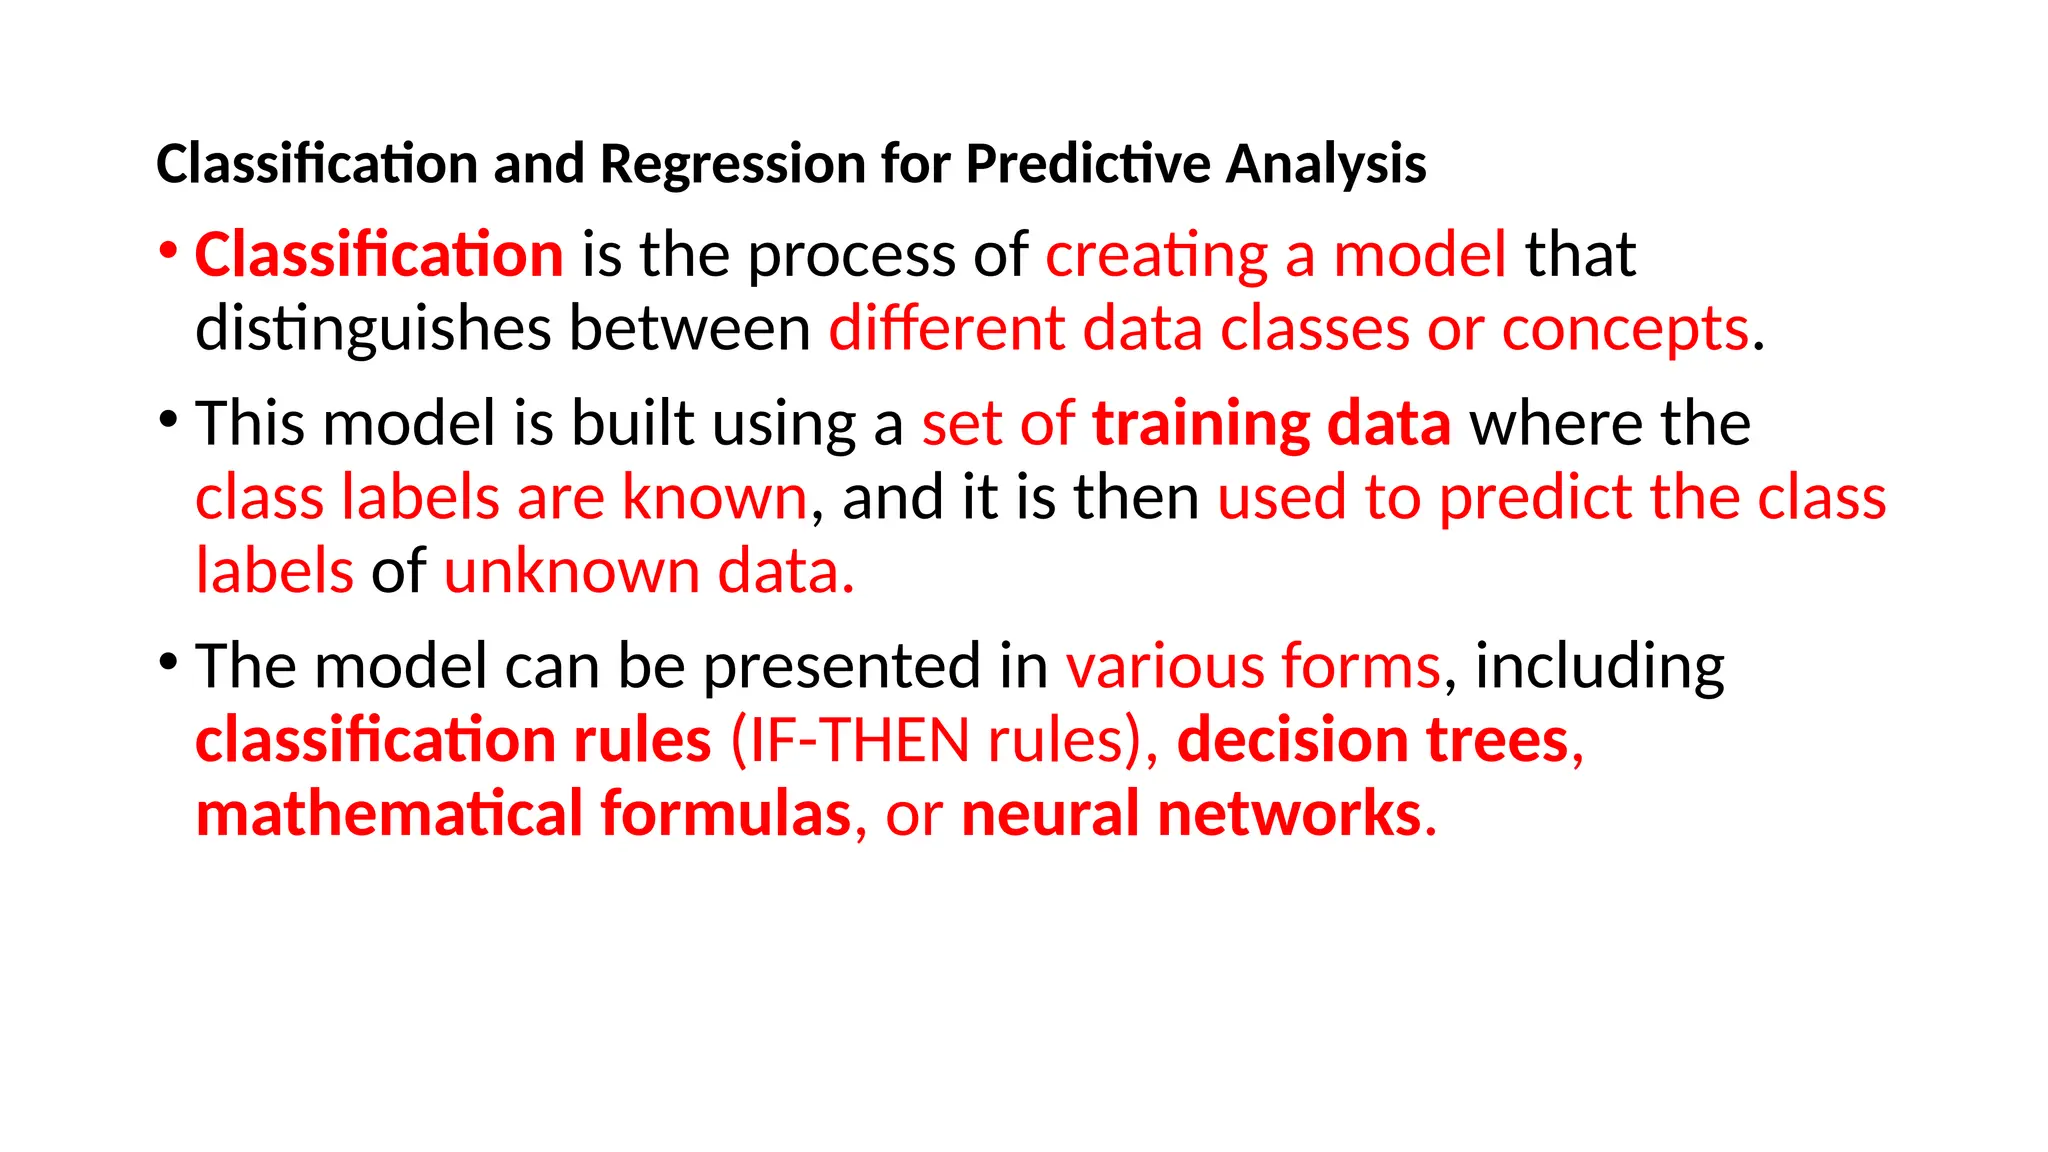
Classification and Regressionfor Predictive Analysis
• Classification is the process of creating a model that
distinguishes between different data classes or concepts.
• This model is built using a set of training data where the
class labels are known, and it is then used to predict the class
labels of unknown data.
• The model can be presented in various forms, including
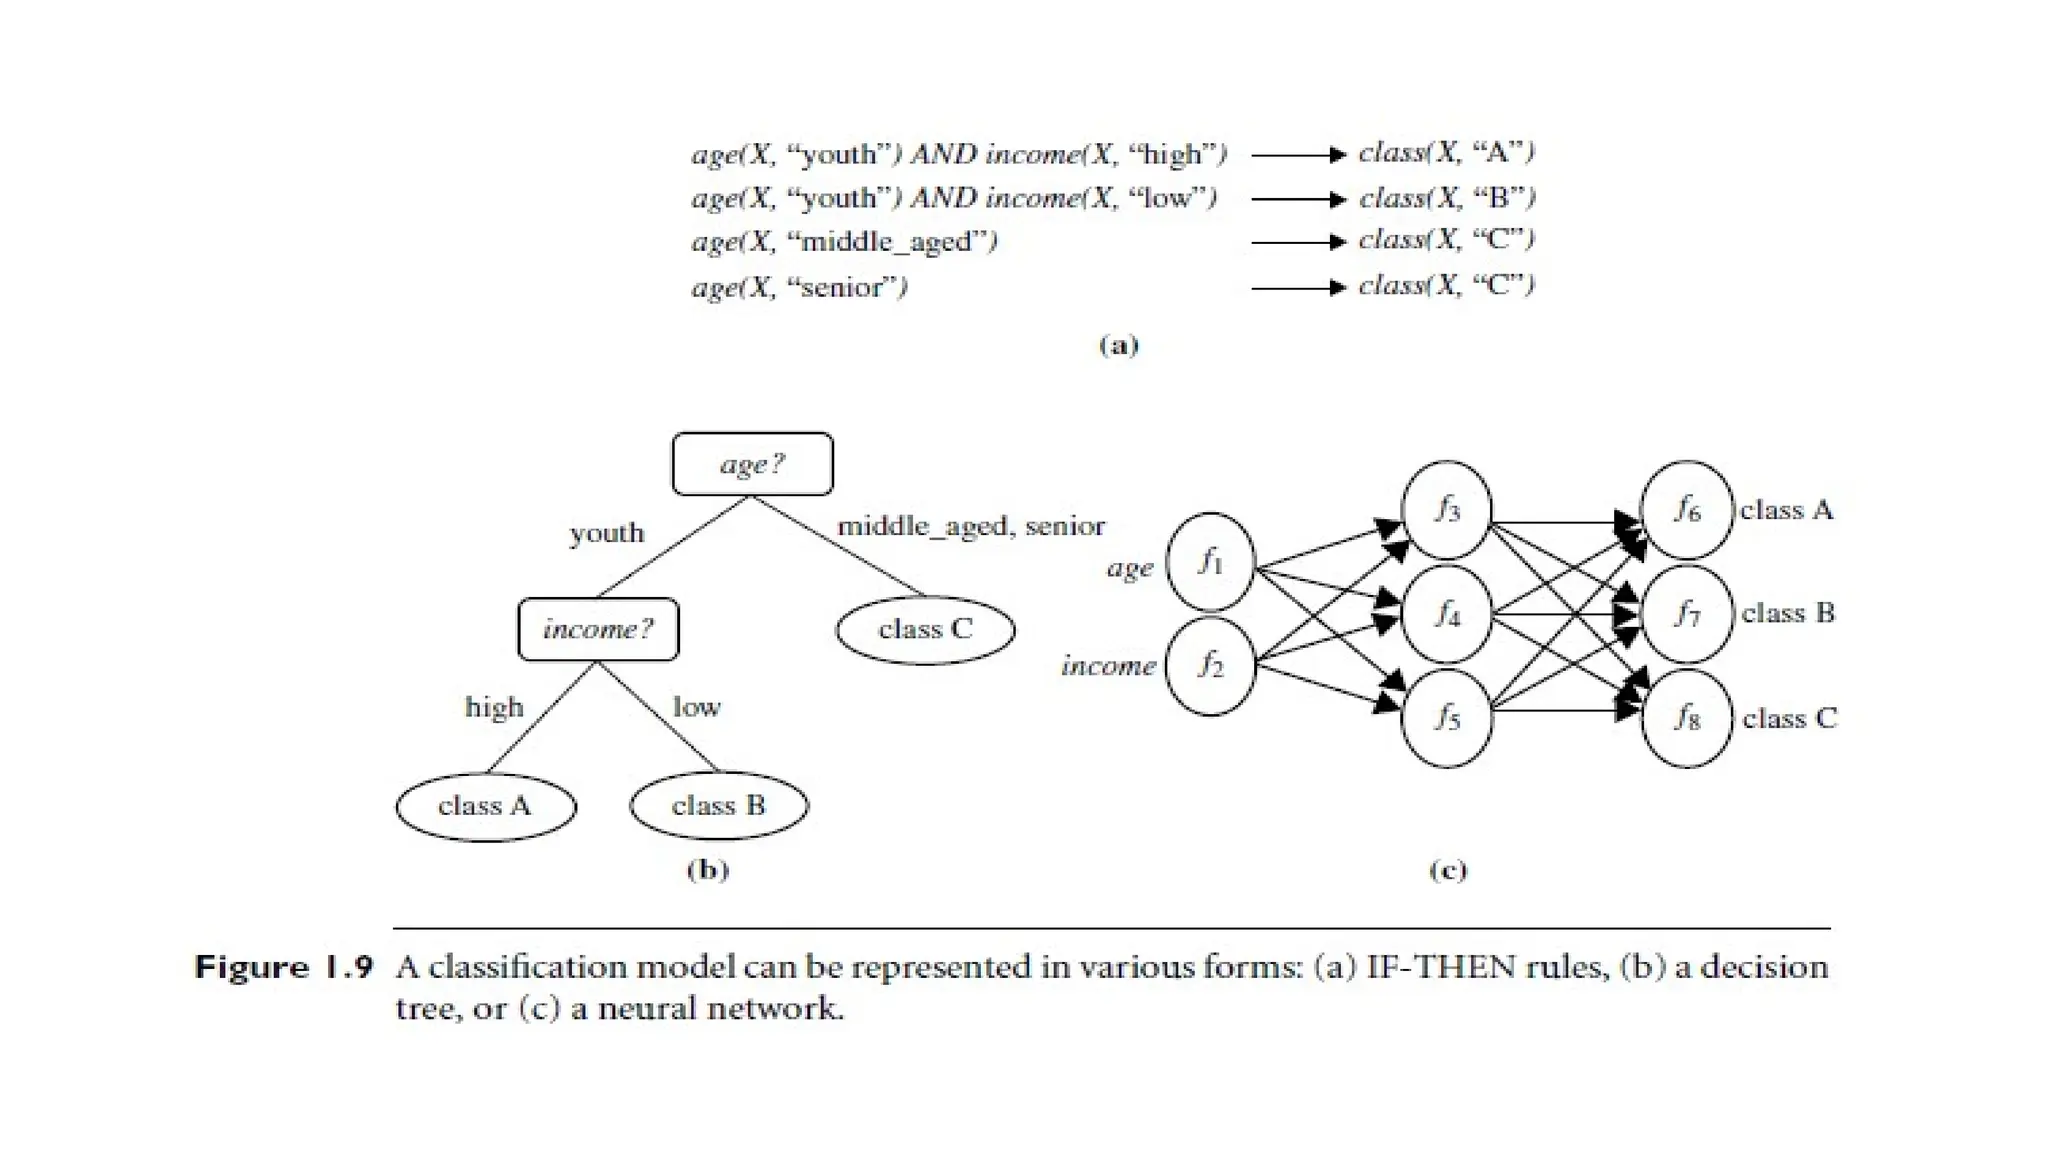
classification rules (IF-THEN rules), decision trees,
mathematical formulas, or neural networks.
65.
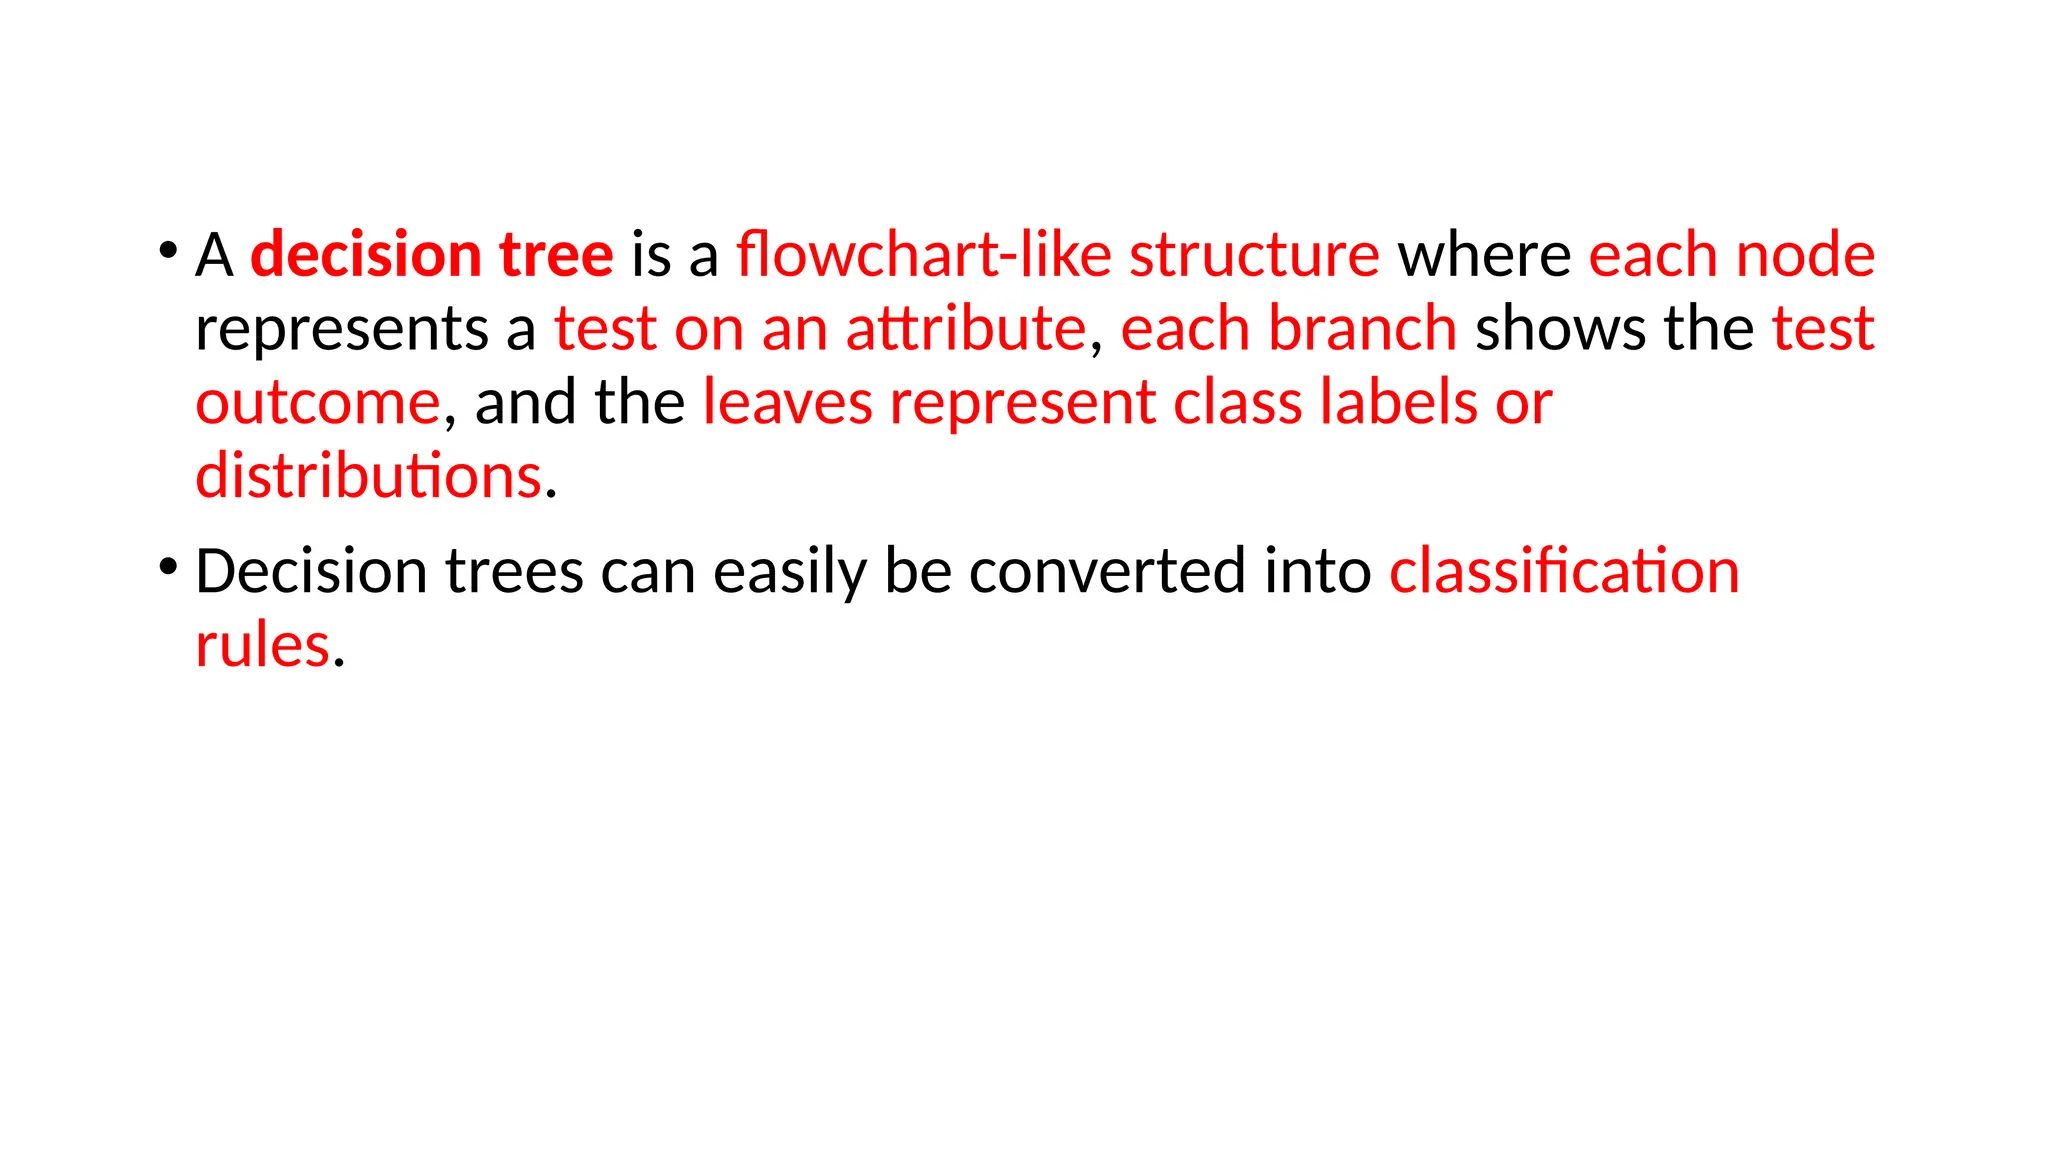
• A decisiontree is a flowchart-like structure where each node
represents a test on an attribute, each branch shows the test
outcome, and the leaves represent class labels or
distributions.
• Decision trees can easily be converted into classification
rules.
67.
• A neuralnetwork for classification consists of neuron-like units
connected by weighted connections.
• Other methods for constructing classification models include naive
Bayesian classification, support vector machines, and k-nearest-
neighbor classification.
• While classification is used to predict categorical labels (discrete and
unordered), regression is used for predicting continuous numerical
values.
• Regression is typically used for numeric prediction and identifying
distribution trends in data.
• Both classification and regression processes may be preceded by
relevance analysis, which identifies and selects relevant attributes for
the task, excluding irrelevant ones
68.
Cluster Analysis
• Definition:
•Clustering analyzes data without relying on class labels.
• It is used when class-labeled data is unavailable or to generate
class labels.
• Principle:
• Maximize intraclass similarity: Objects within the same cluster are
highly similar.
• Minimize interclass similarity: Objects from different clusters are
dissimilar.
69.
• Purpose:
• Clustersact as classes from which rules can be derived.
• Enables grouping of similar data objects into meaningful
categories.
• Applications:
• Generating class labels for unlabeled data.
• Facilitating taxonomy formation by organizing observations into
hierarchical classes.
• Key Benefit:
• Helps discover hidden patterns or structures in the data.
70.
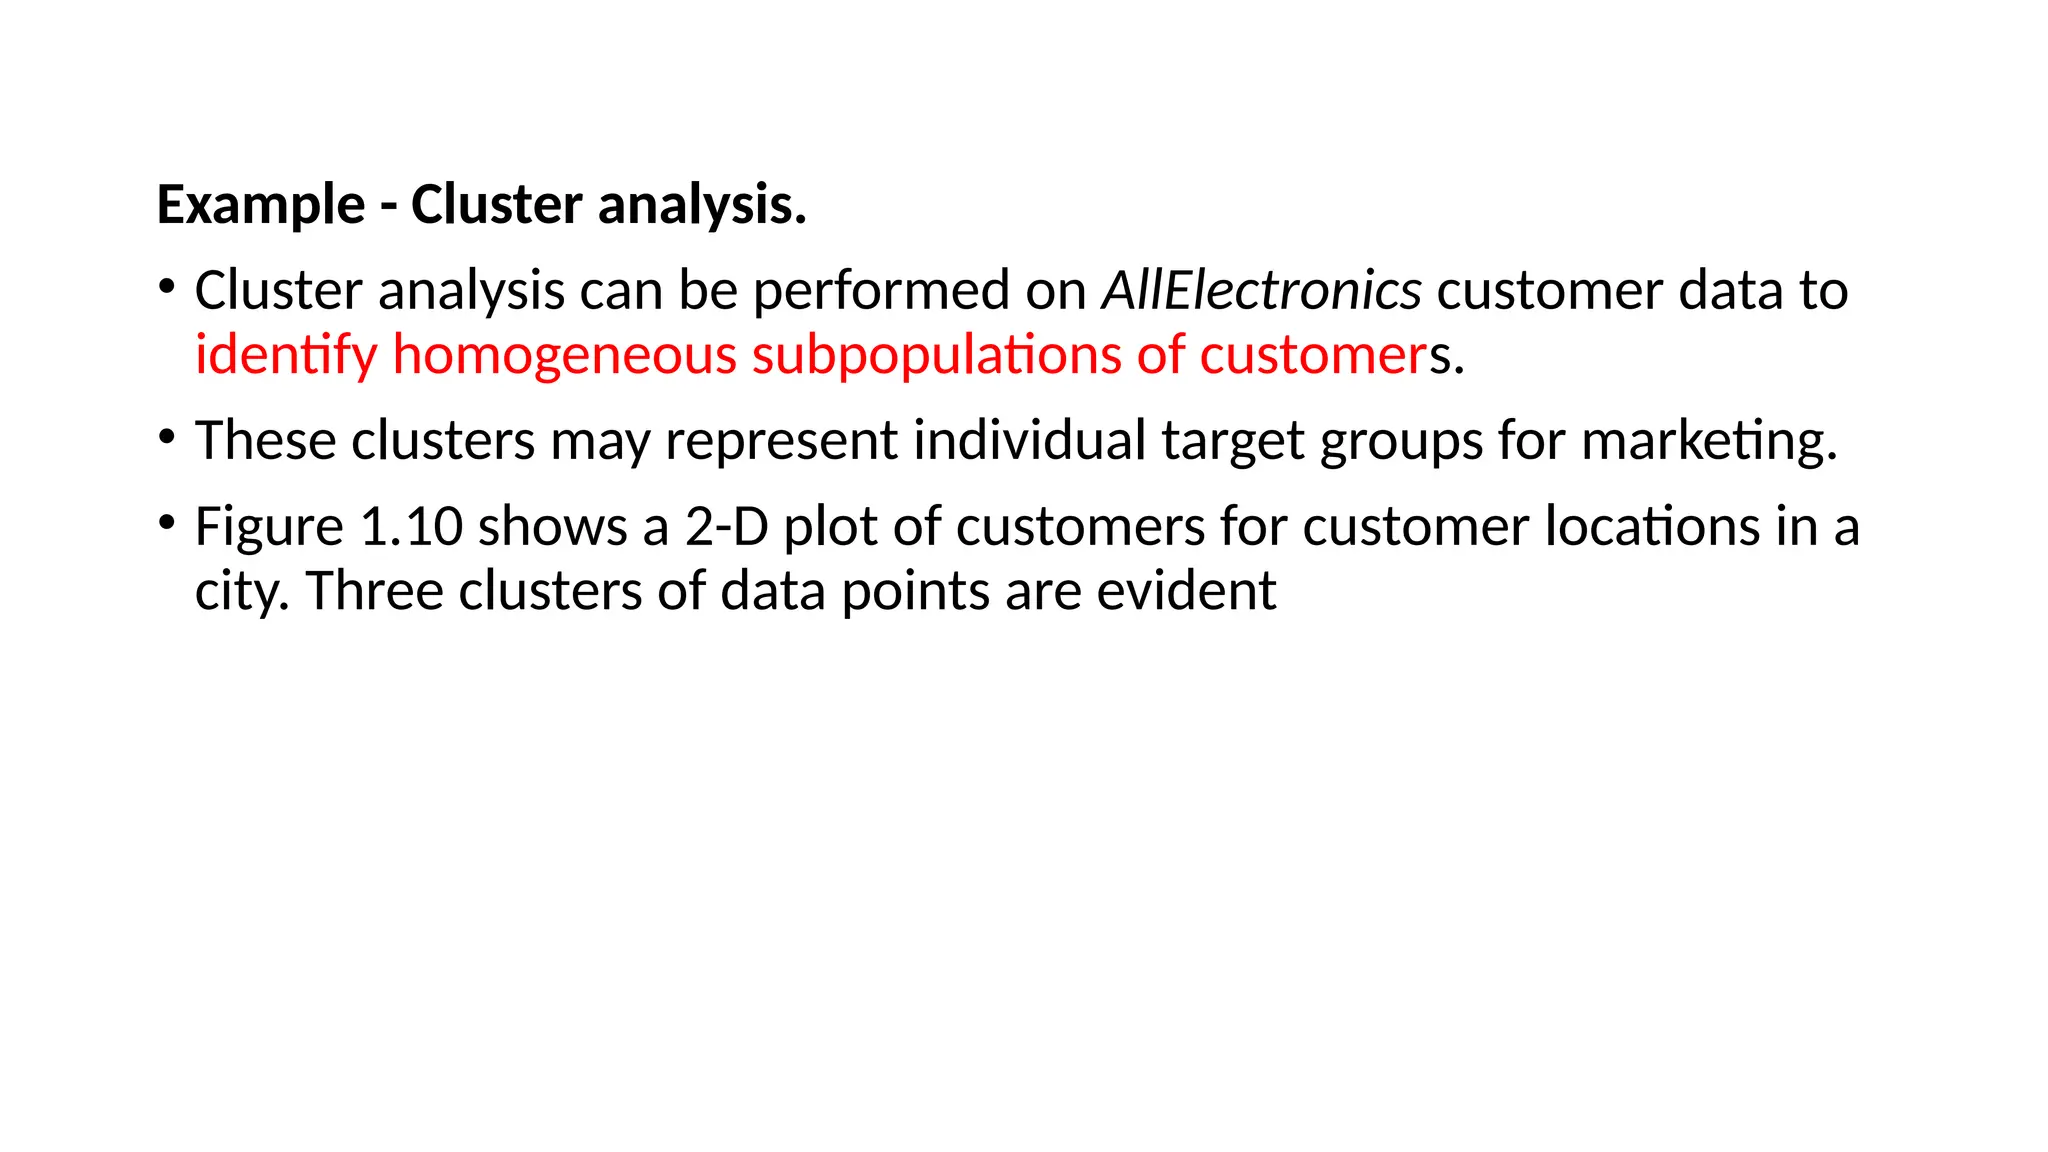
Example - Clusteranalysis.
• Cluster analysis can be performed on AllElectronics customer data to
identify homogeneous subpopulations of customers.
• These clusters may represent individual target groups for marketing.
• Figure 1.10 shows a 2-D plot of customers for customer locations in a
city. Three clusters of data points are evident
72.
Outlier Analysis:
• Definition:
•Outliers are data objects that do not conform to the
general behavior or model of the data.
• Significance:
• Often considered noise or exceptions by data mining
methods.
• In certain applications (e.g., fraud detection), outliers can
be more interesting than regular patterns.
73.
• Methods forDetection:
• Statistical Tests: Assume a data distribution or probability model
to identify outliers.
• Distance Measures: Identify objects that are far from any cluster.
• Density-Based Methods: Detect outliers within a local region even
if they appear normal globally.
• Purpose:
• To analyze and uncover rare or anomalous events that may hold
significant value.
74.
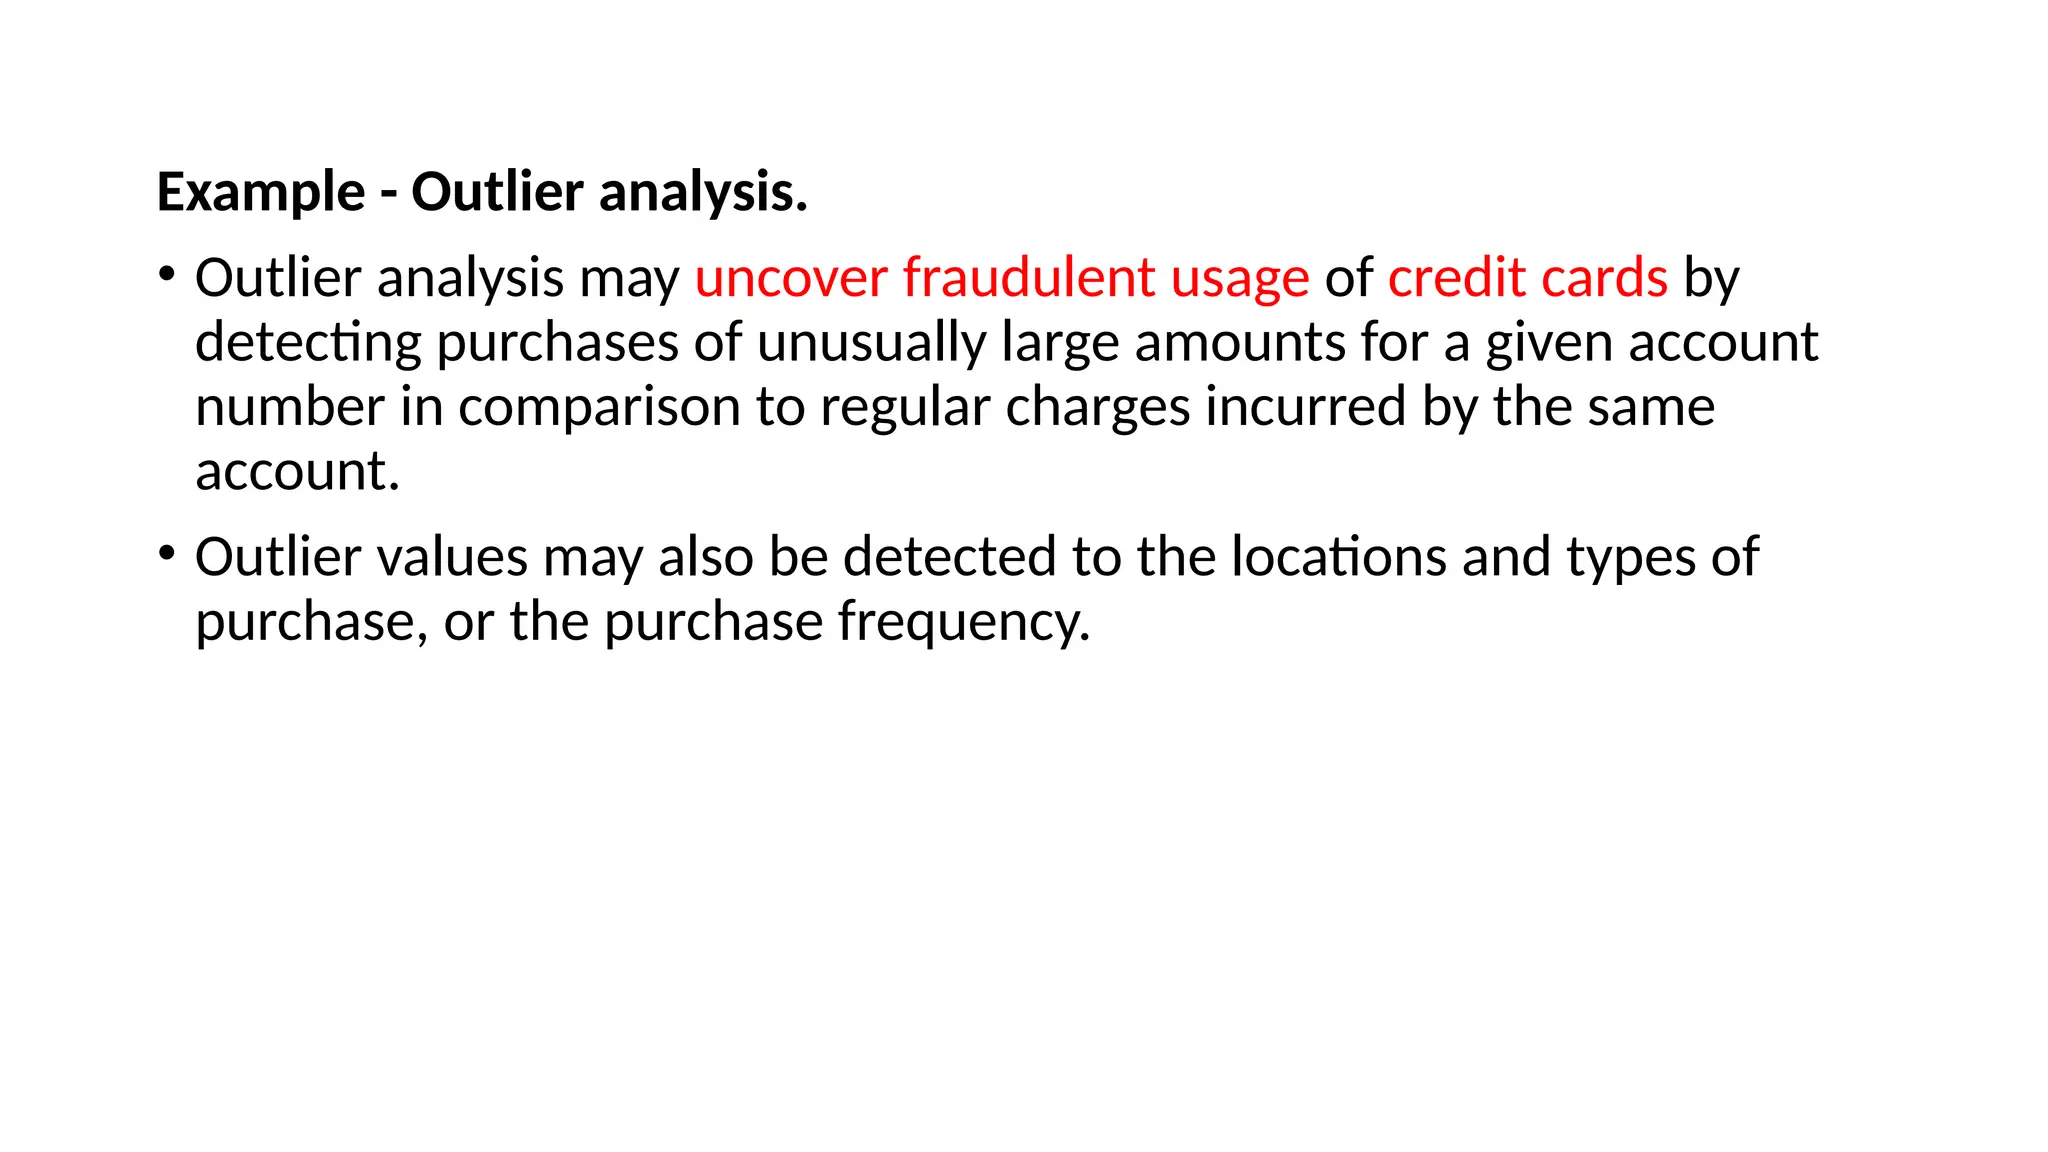
Example - Outlieranalysis.
• Outlier analysis may uncover fraudulent usage of credit cards by
detecting purchases of unusually large amounts for a given account
number in comparison to regular charges incurred by the same
account.
• Outlier values may also be detected to the locations and types of
purchase, or the purchase frequency.
75.
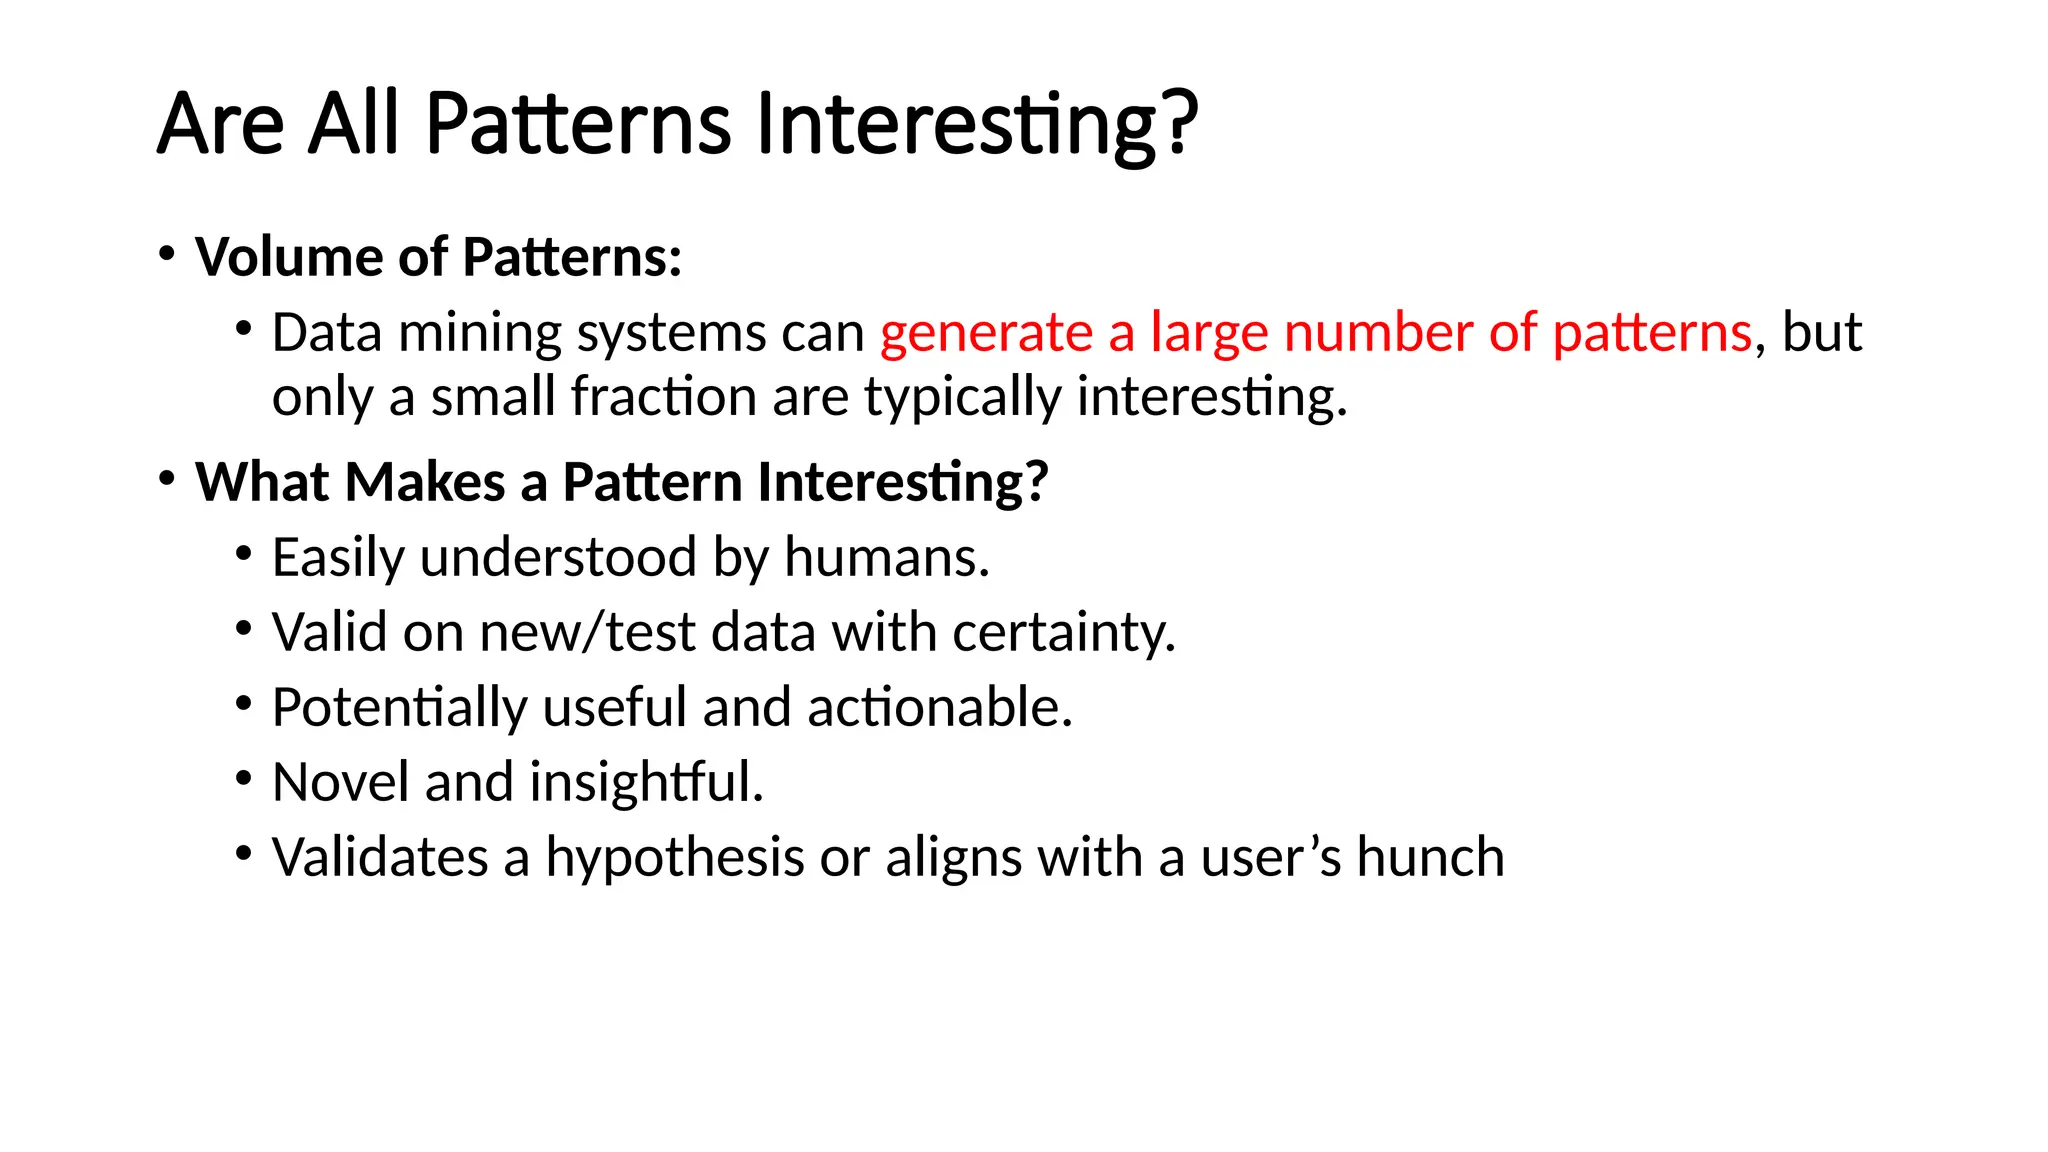
Are All PatternsInteresting?
• Volume of Patterns:
• Data mining systems can generate a large number of patterns, but
only a small fraction are typically interesting.
• What Makes a Pattern Interesting?
• Easily understood by humans.
• Valid on new/test data with certainty.
• Potentially useful and actionable.
• Novel and insightful.
• Validates a hypothesis or aligns with a user’s hunch
76.
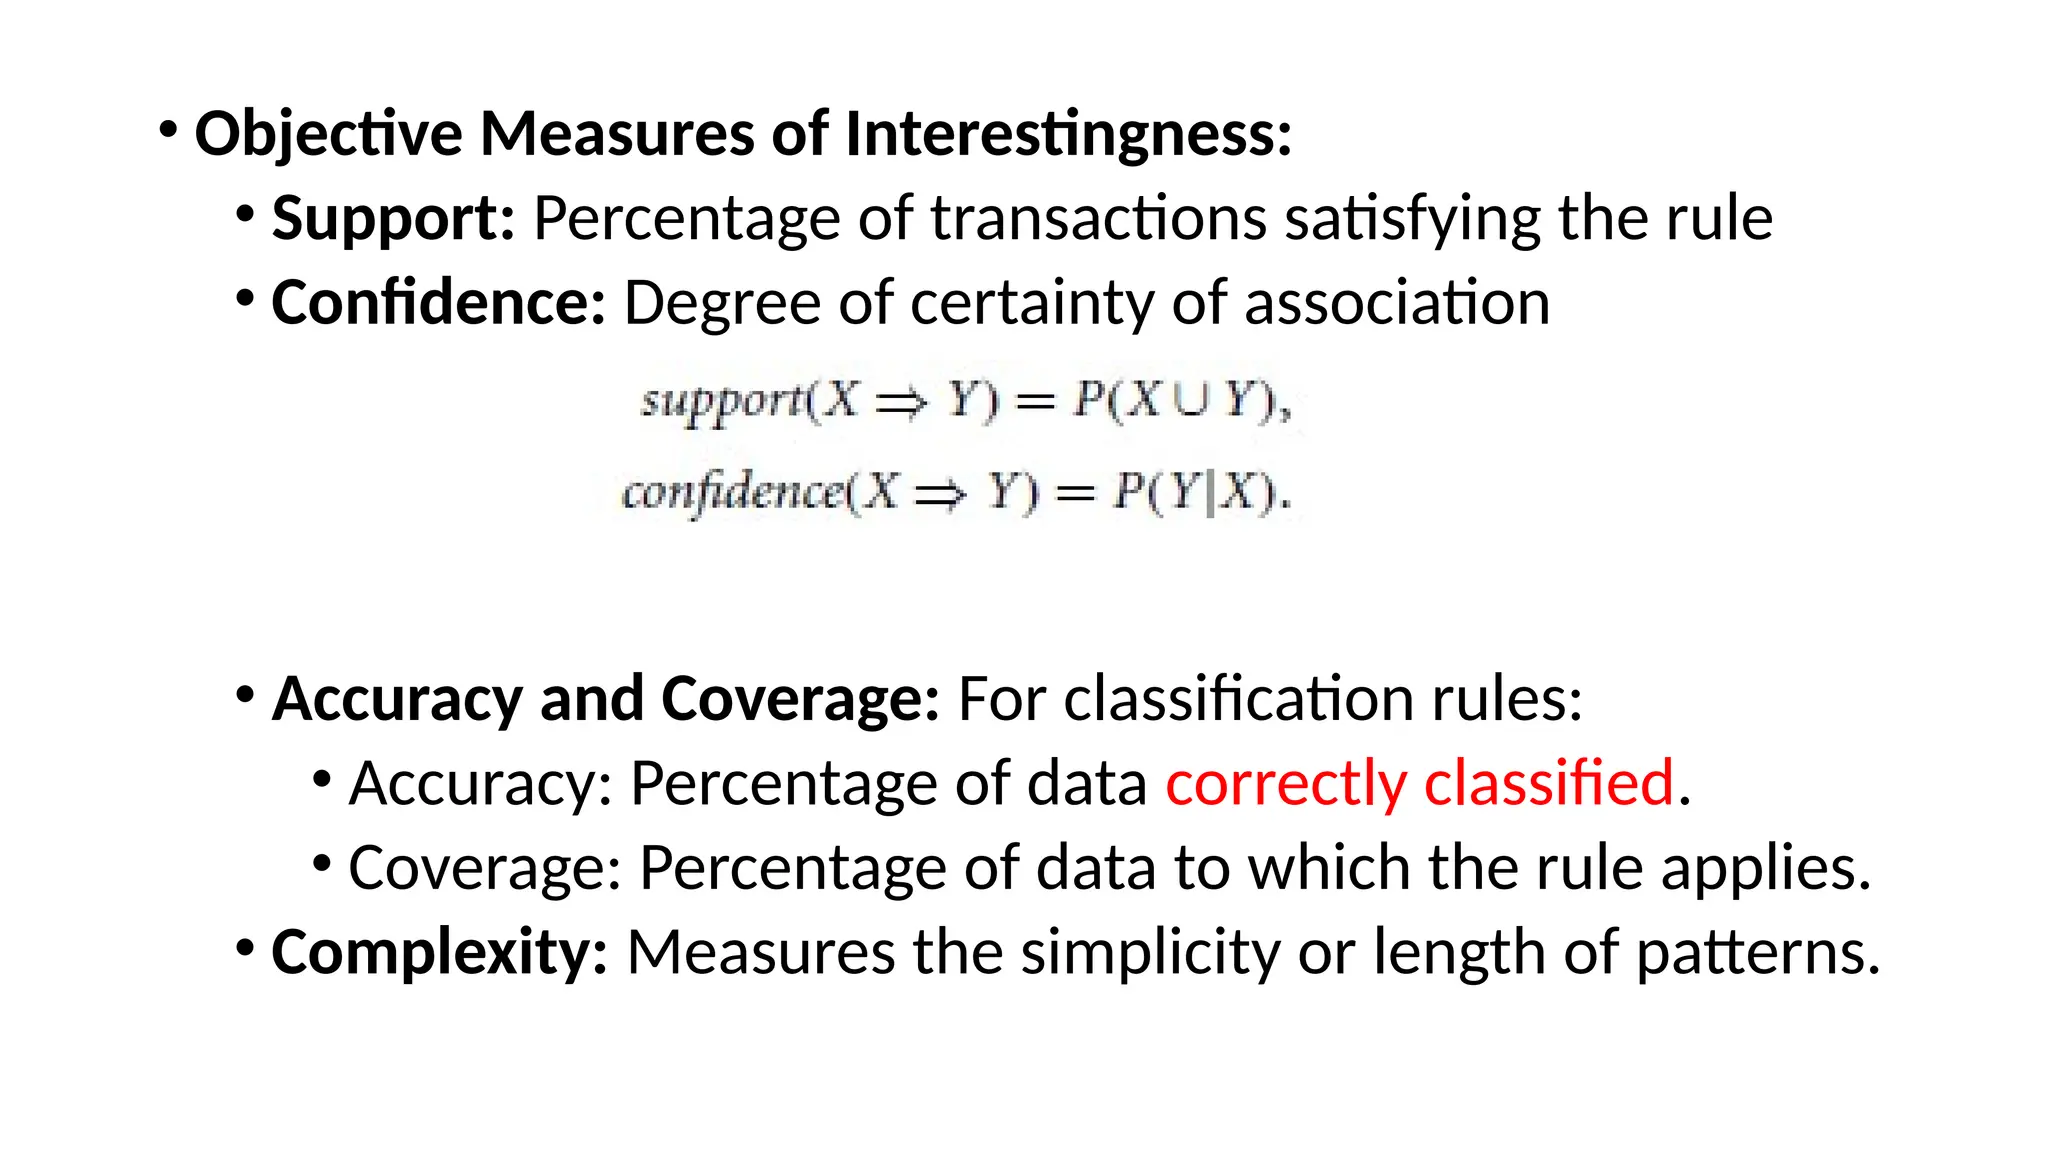
• Objective Measuresof Interestingness:
• Support: Percentage of transactions satisfying the rule
• Confidence: Degree of certainty of association
• Accuracy and Coverage: For classification rules:
• Accuracy: Percentage of data correctly classified.
• Coverage: Percentage of data to which the rule applies.
• Complexity: Measures the simplicity or length of patterns.
77.
• Thresholds inObjective Measures:
• Patterns below thresholds (e.g., confidence < 50%) may reflect
noise or exceptions and are often considered uninteresting.
• Subjective Measures of Interestingness:
• Based on user-specific needs and beliefs.
• Unexpected patterns: Contradict user beliefs or provide actionable
insights.
• Actionable patterns: Offer strategic information for decision-
making (e.g., patterns predicting earthquakes).
• Expected patterns: Confirm hypotheses or user expectations.
78.
• Challenges inGenerating Interesting Patterns:
• Completeness: Generating all interesting patterns is unrealistic;
constraints and interestingness measures can guide the search.
• Optimization: Generating only interesting patterns remains a
challenge but is desirable for efficiency.
• Role of Interestingness Measures:
• Post-mining Use: Rank and filter discovered patterns based on
interestingness.
• Guidance in Discovery: Constrain and improve the mining process by
pruning irrelevant pattern spaces
79.
• Constraint-Based Mining:
•User-provided constraints and interestingness measures focus the
search and improve algorithm efficiency.
• Applications:
• Interestingness measures are integrated across different mining
tasks, including association rule mining, clustering, and pattern
discovery.
• Future Directions:
• Optimization of mining systems to generate only interesting
patterns remains an ongoing challenge.
80.
Which Technologies AreUsed?
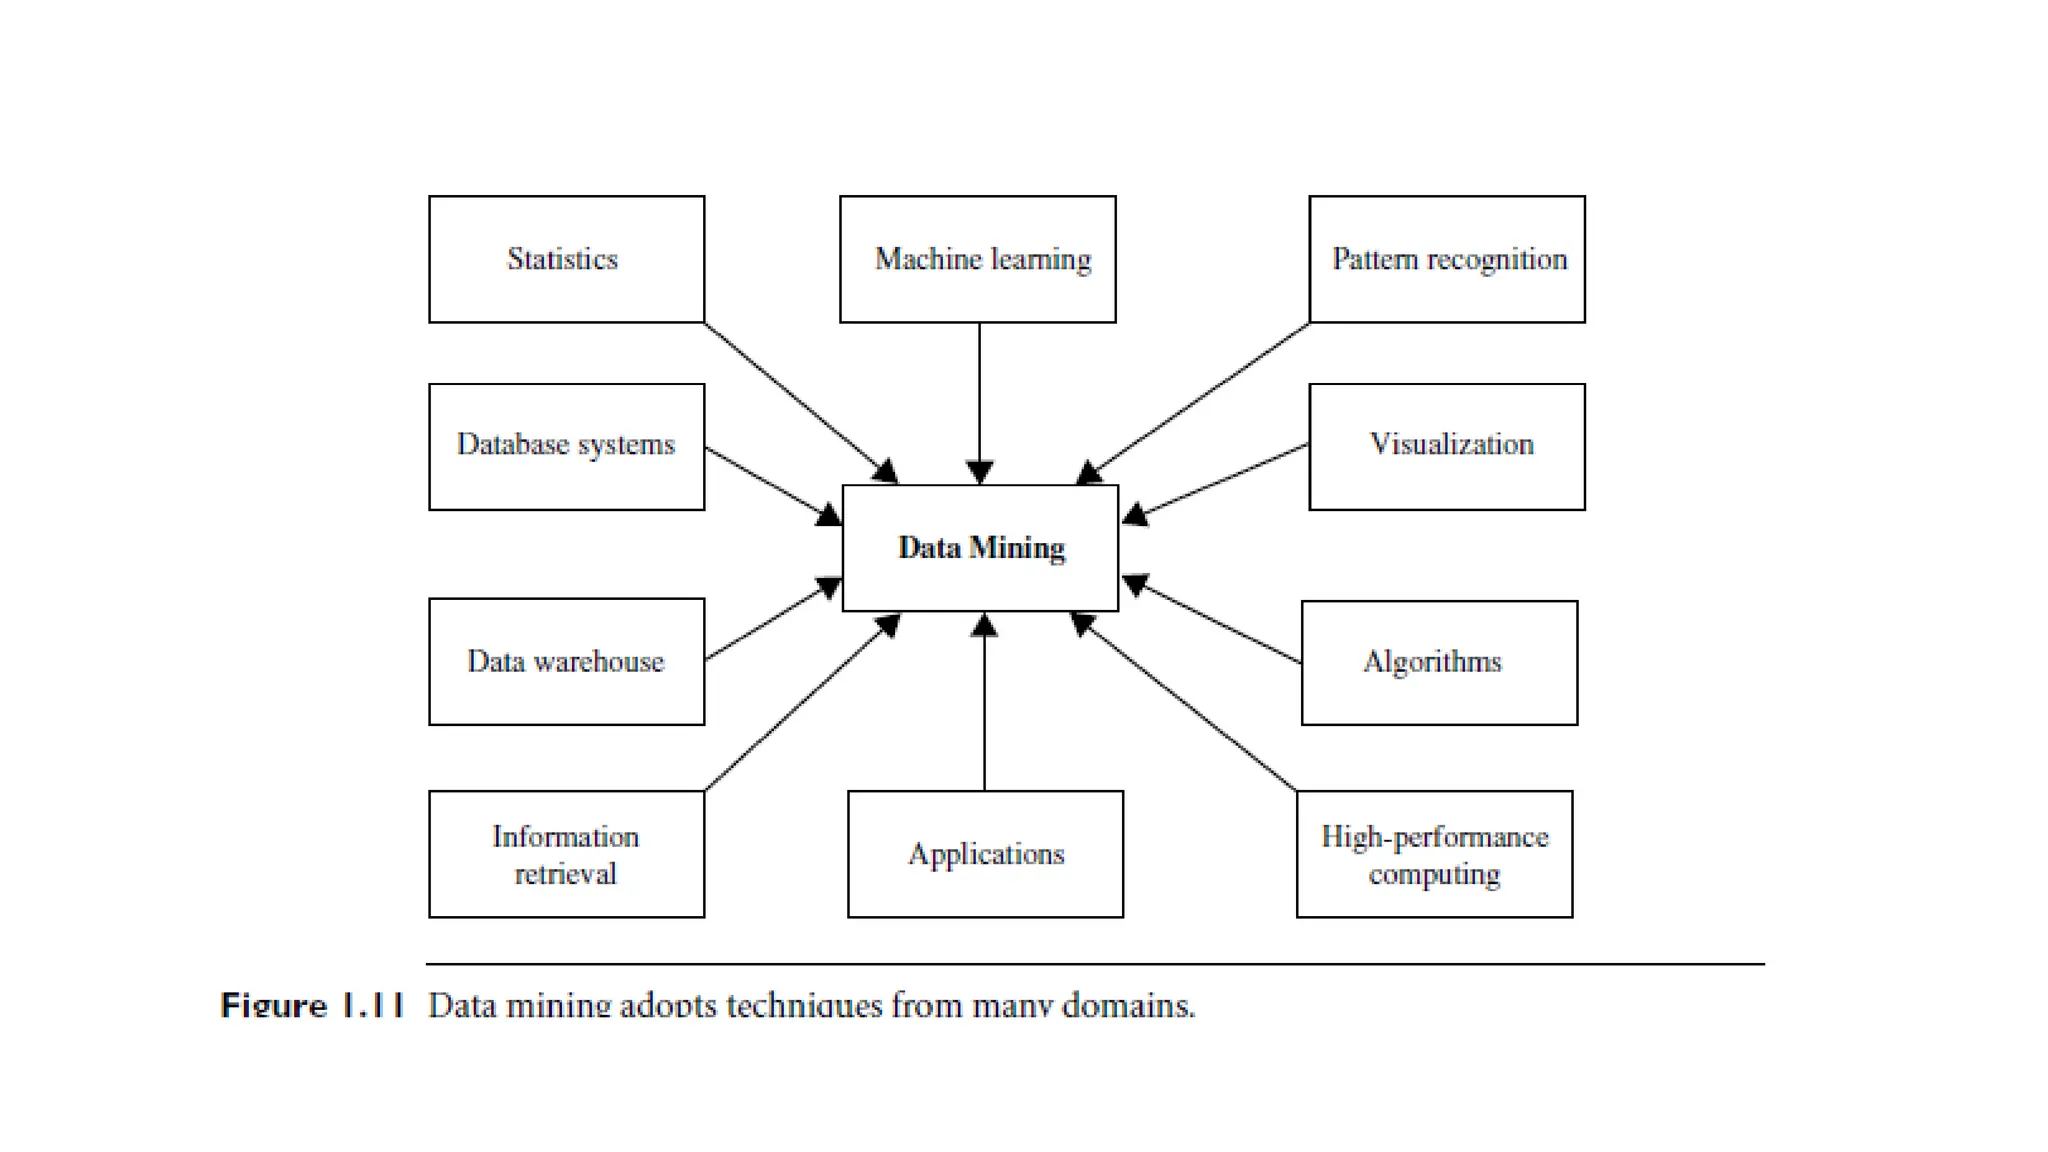
Interdisciplinary Nature of Data Mining:
• Data mining incorporates techniques from multiple disciplines,
including statistics, machine learning, pattern recognition, databases,
information retrieval, visualization, algorithms, and high-performance
computing.
Connection Between Data Mining and Statistics:
• Statistics deals with collecting, analyzing, interpreting, and presenting
data, making it inherently connected to data mining
82.
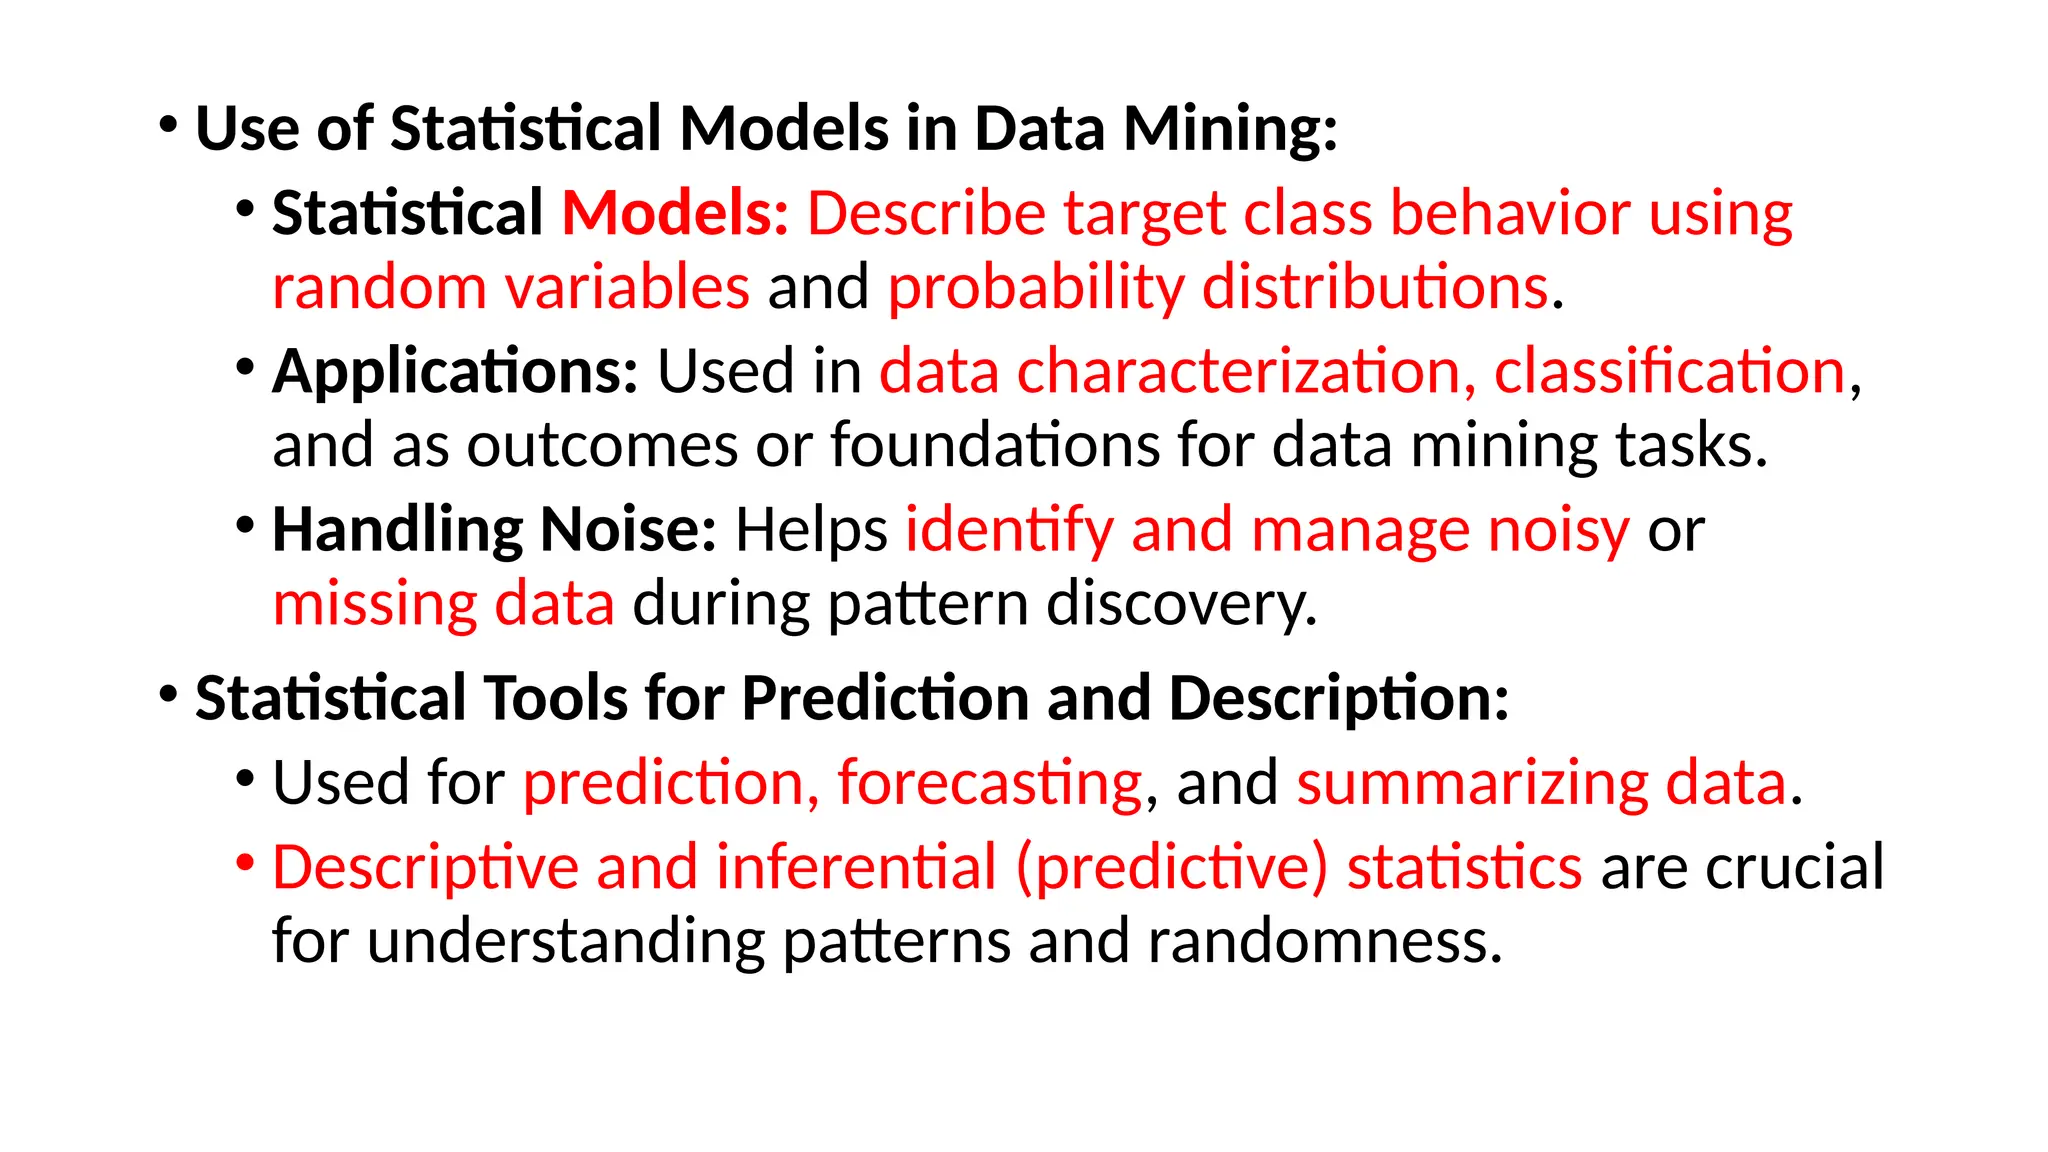
• Use ofStatistical Models in Data Mining:
• Statistical Models: Describe target class behavior using
random variables and probability distributions.
• Applications: Used in data characterization, classification,
and as outcomes or foundations for data mining tasks.
• Handling Noise: Helps identify and manage noisy or
missing data during pattern discovery.
• Statistical Tools for Prediction and Description:
• Used for prediction, forecasting, and summarizing data.
• Descriptive and inferential (predictive) statistics are crucial
for understanding patterns and randomness.
83.
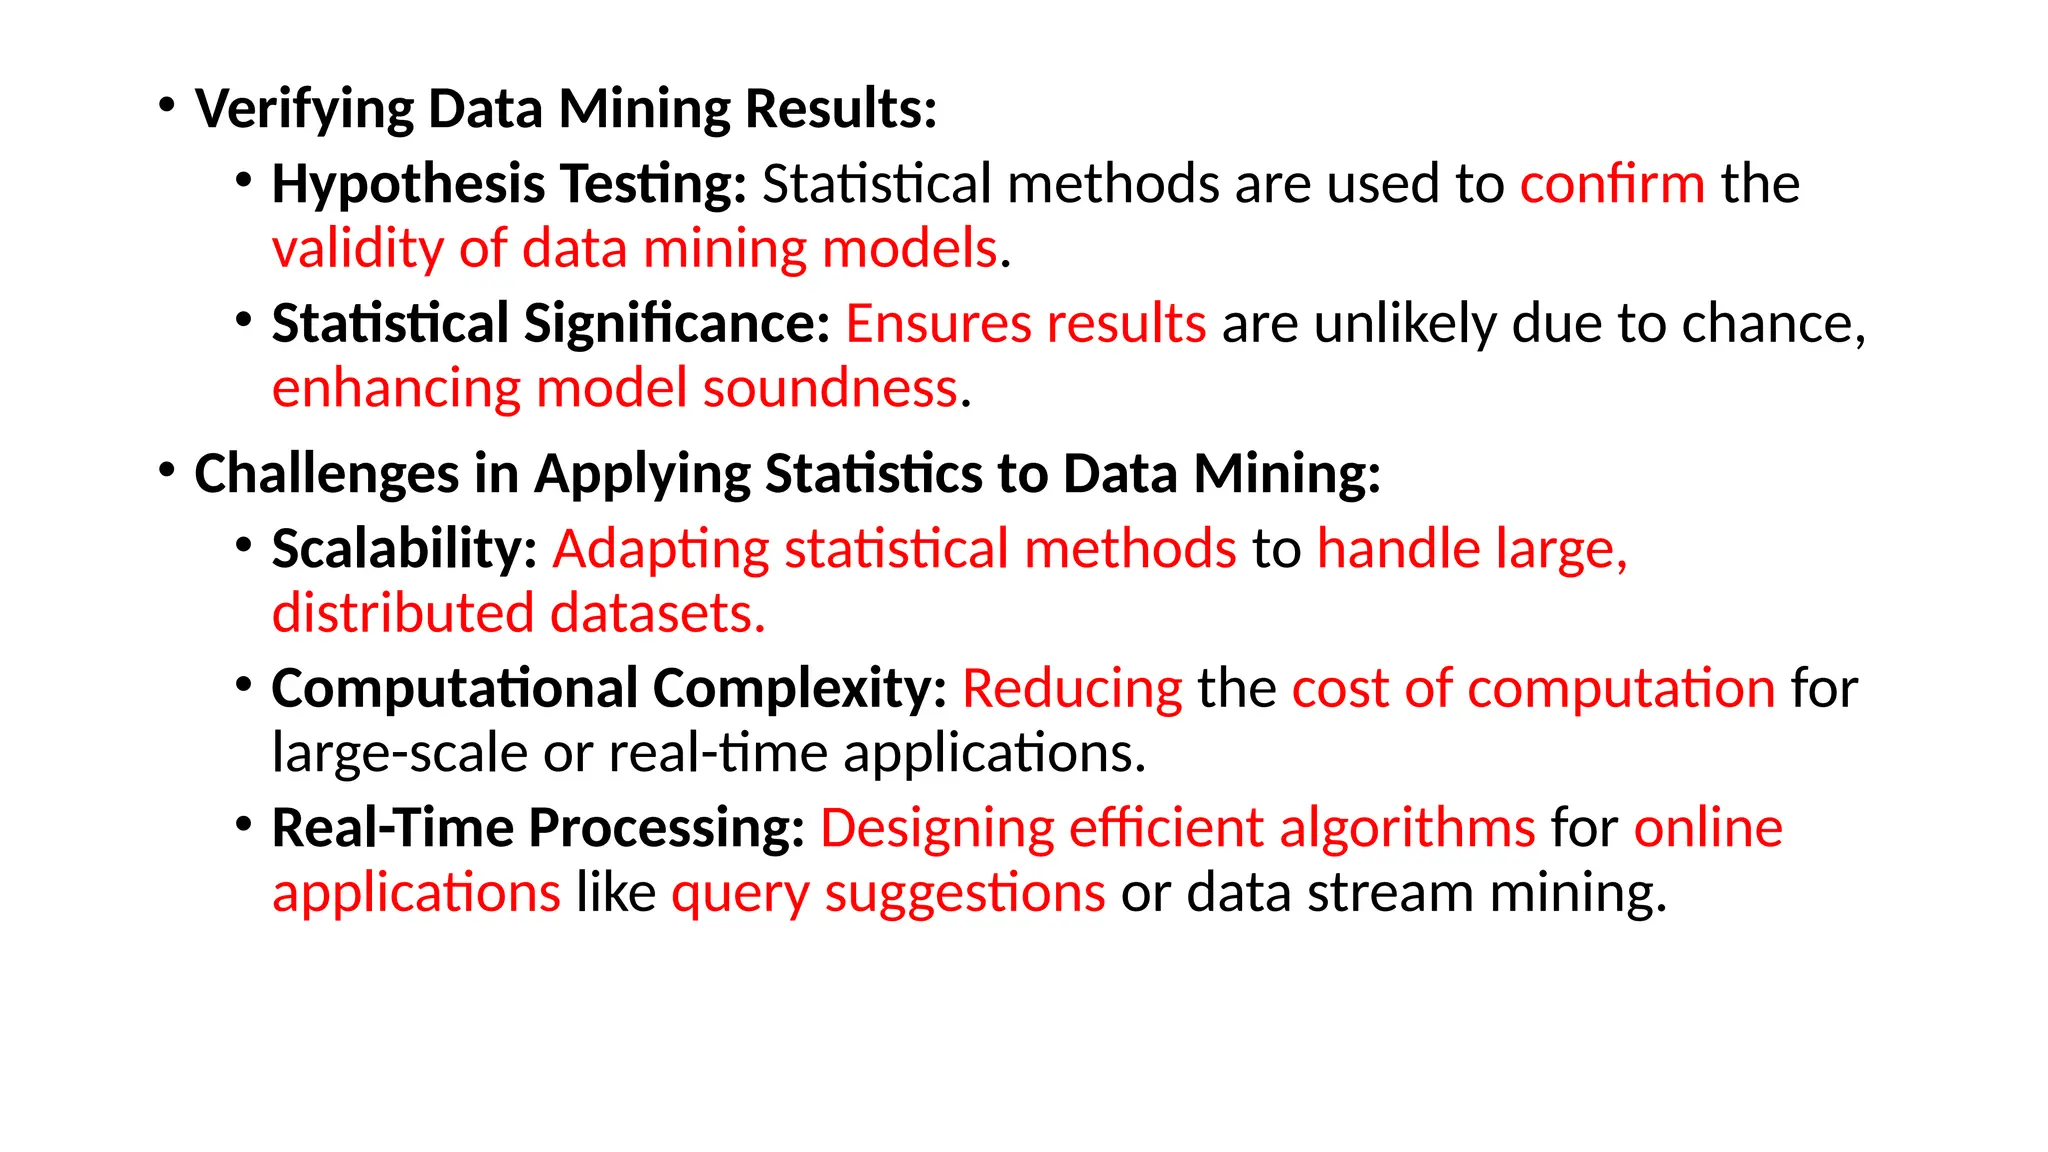
• Verifying DataMining Results:
• Hypothesis Testing: Statistical methods are used to confirm the
validity of data mining models.
• Statistical Significance: Ensures results are unlikely due to chance,
enhancing model soundness.
• Challenges in Applying Statistics to Data Mining:
• Scalability: Adapting statistical methods to handle large,
distributed datasets.
• Computational Complexity: Reducing the cost of computation for
large-scale or real-time applications.
• Real-Time Processing: Designing efficient algorithms for online
applications like query suggestions or data stream mining.
84.
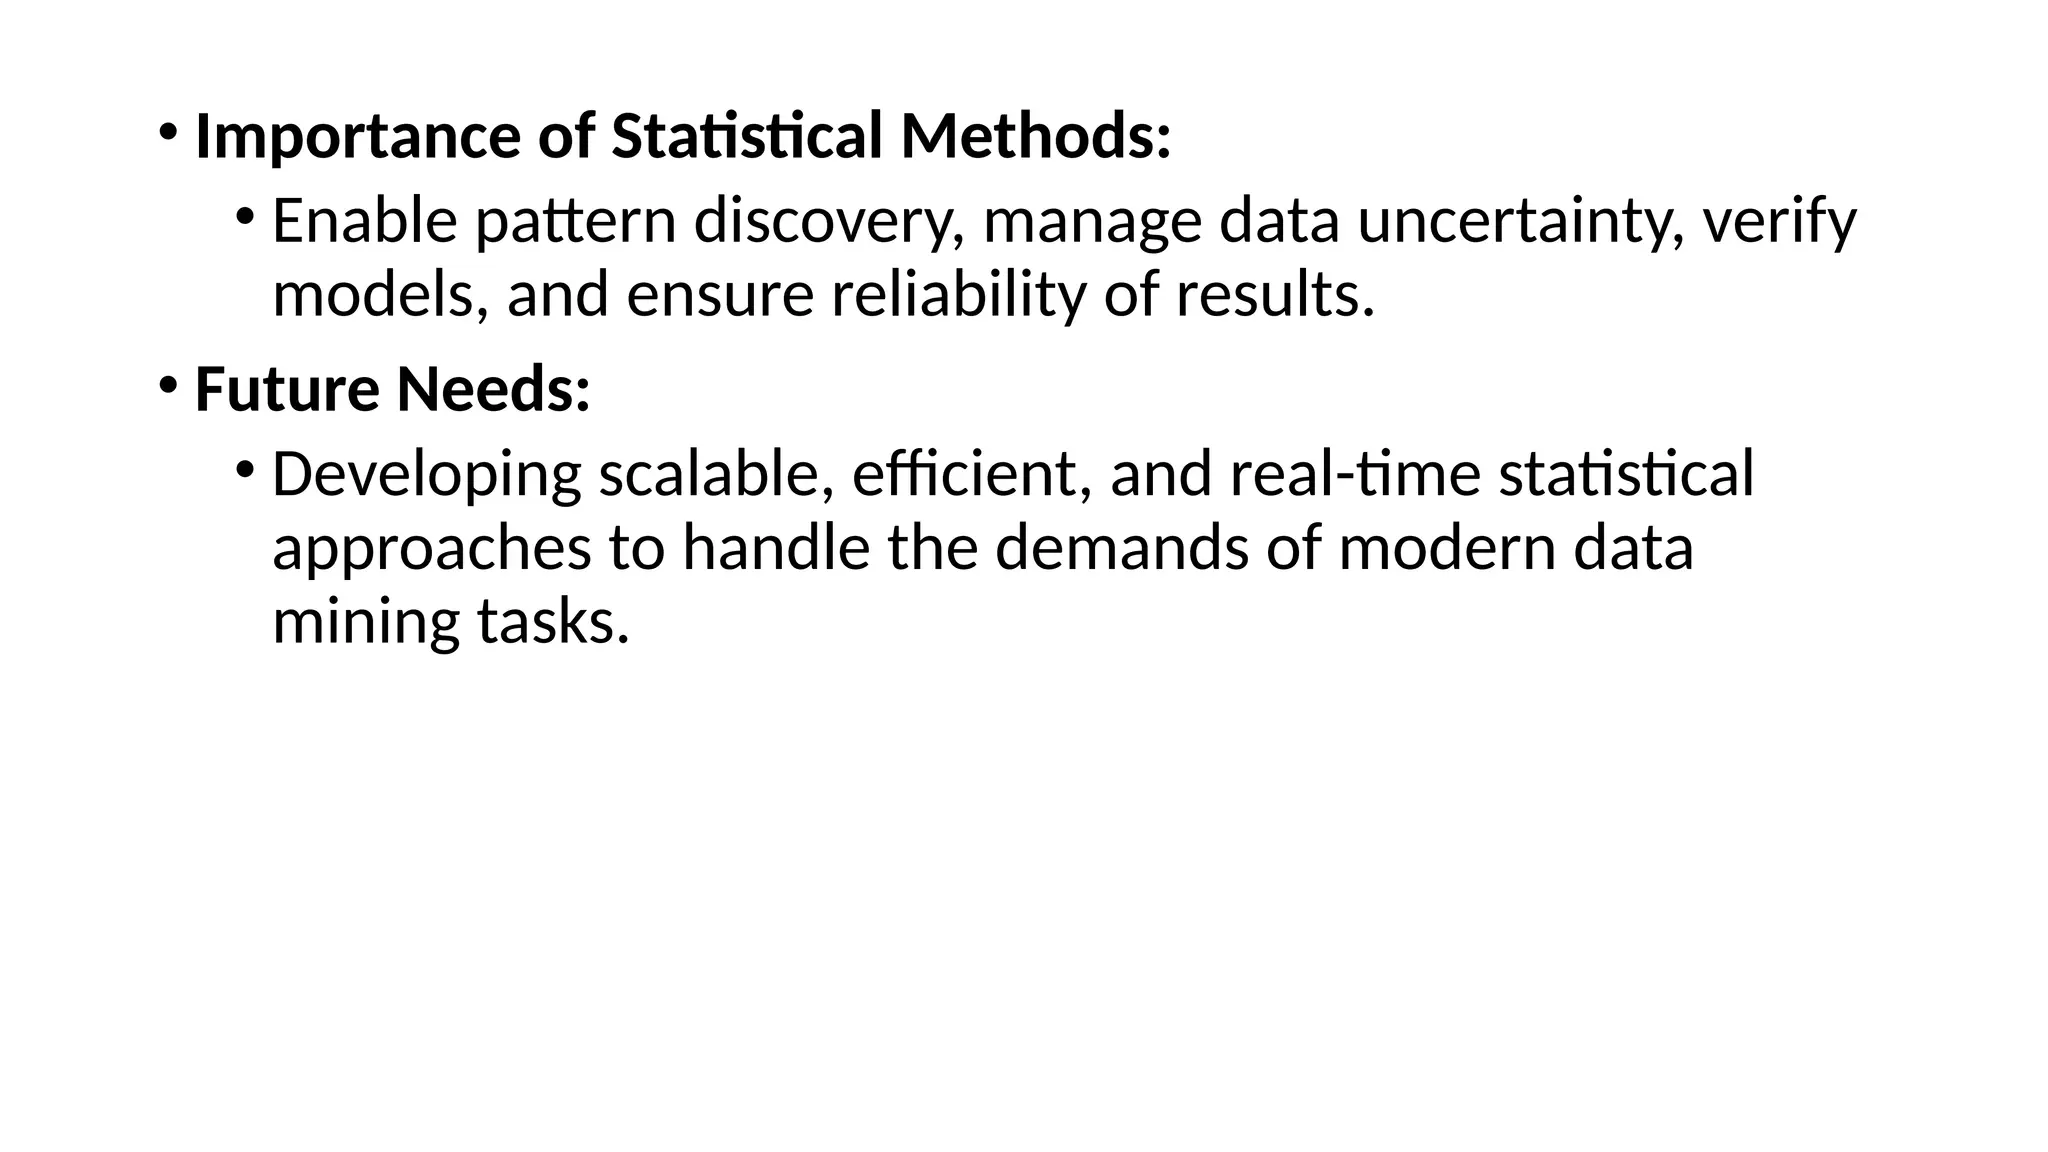
• Importance ofStatistical Methods:
• Enable pattern discovery, manage data uncertainty, verify
models, and ensure reliability of results.
• Future Needs:
• Developing scalable, efficient, and real-time statistical
approaches to handle the demands of modern data
mining tasks.
85.
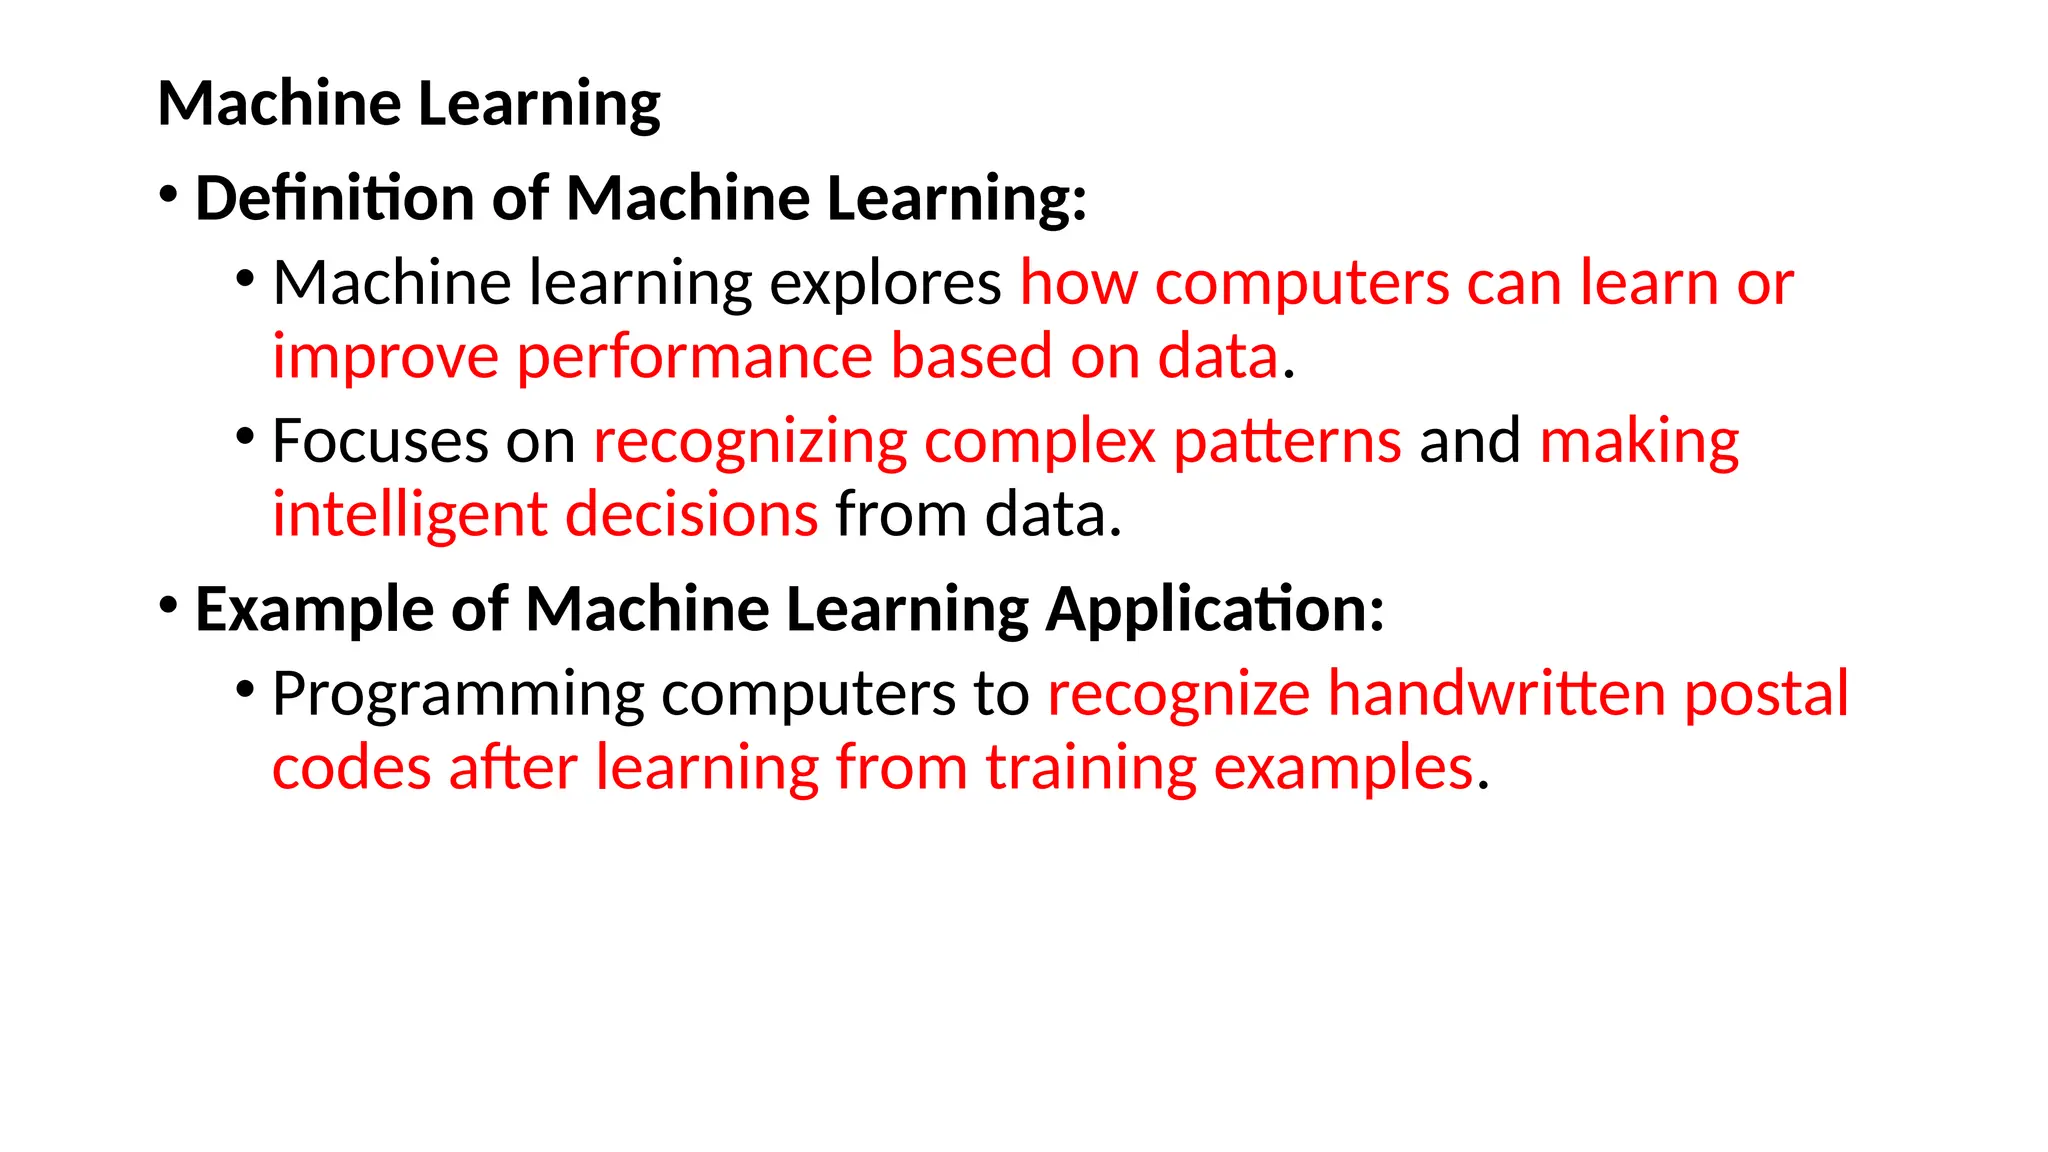
Machine Learning
• Definitionof Machine Learning:
• Machine learning explores how computers can learn or
improve performance based on data.
• Focuses on recognizing complex patterns and making
intelligent decisions from data.
• Example of Machine Learning Application:
• Programming computers to recognize handwritten postal
codes after learning from training examples.
86.
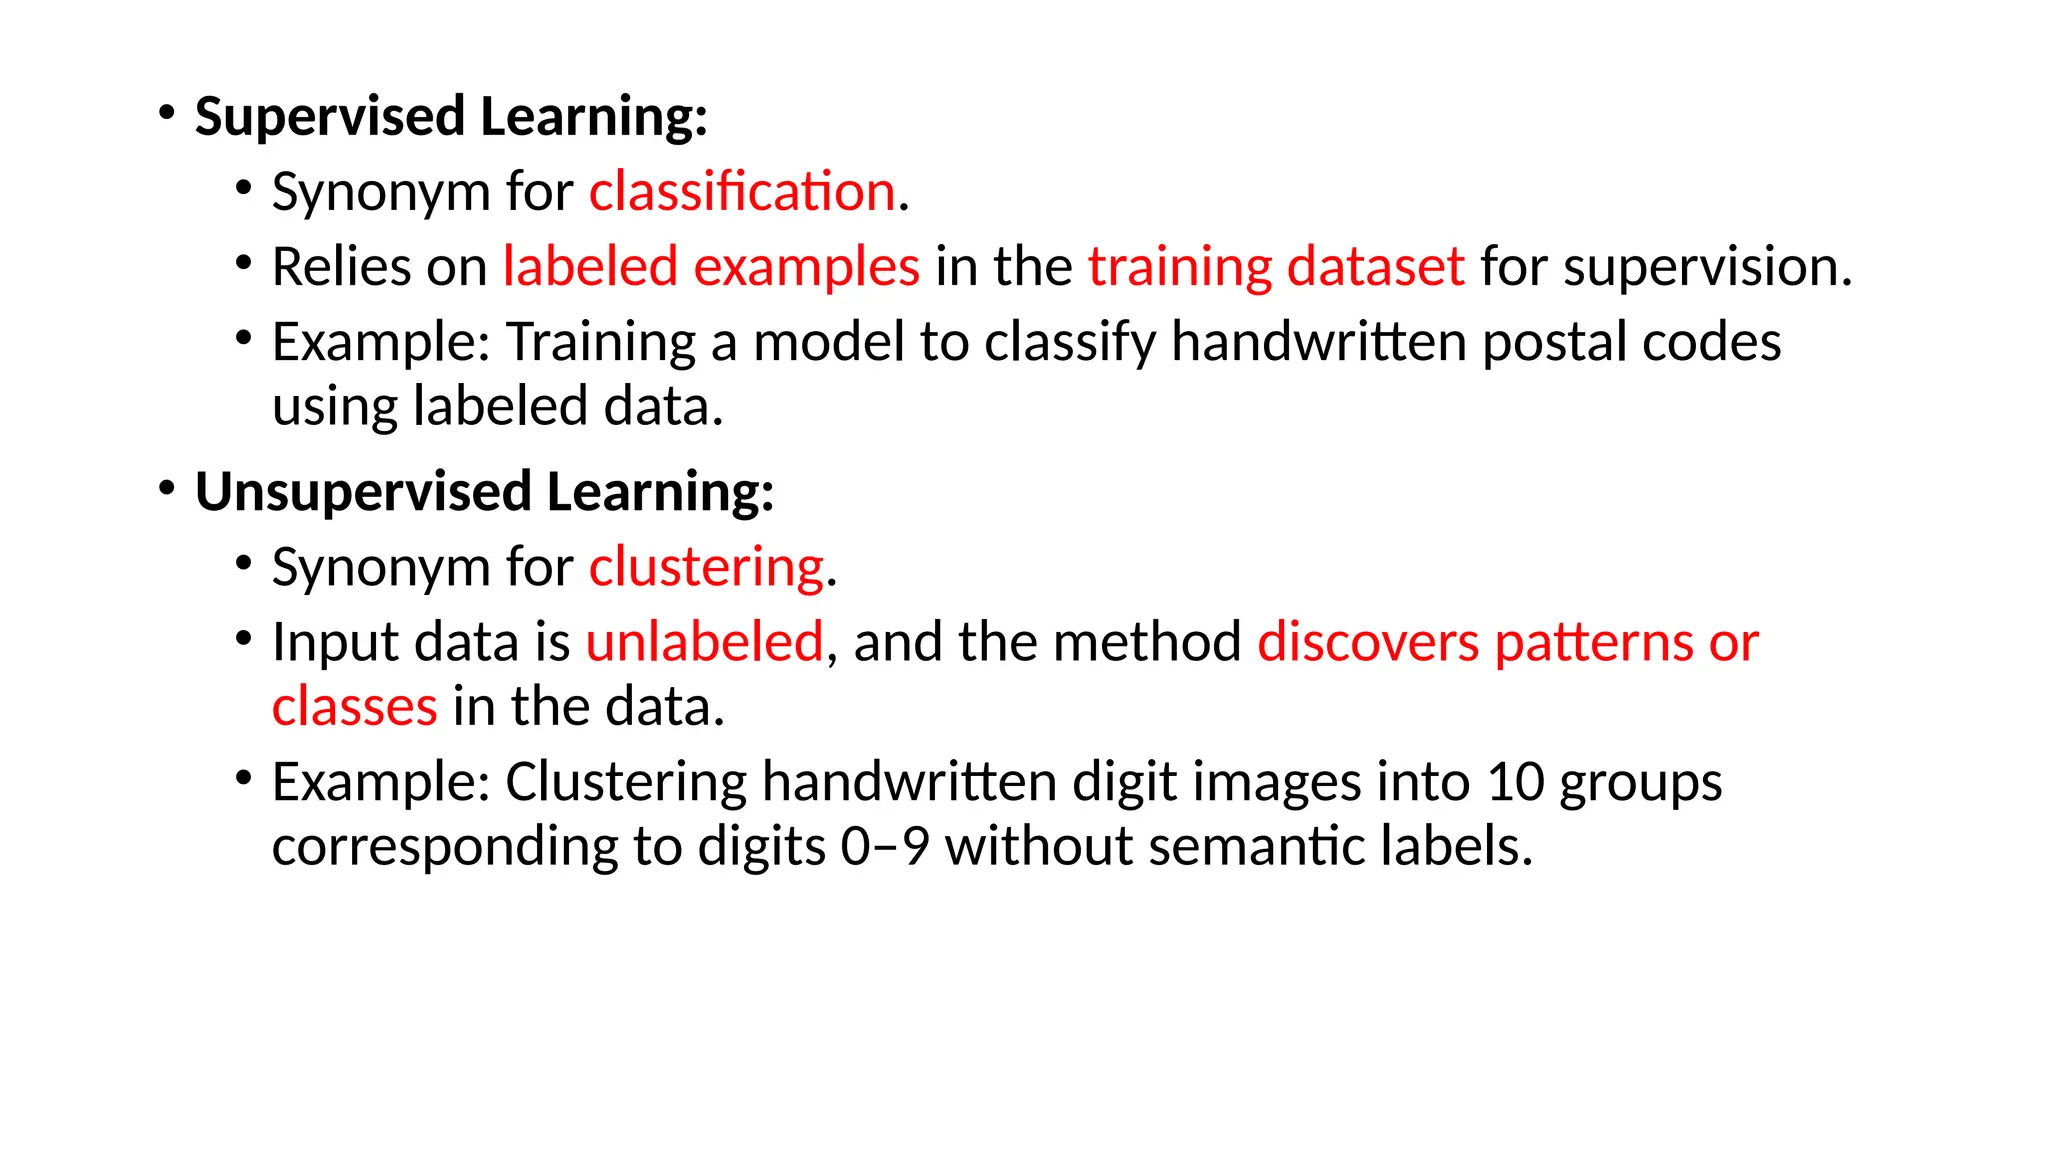
• Supervised Learning:
•Synonym for classification.
• Relies on labeled examples in the training dataset for supervision.
• Example: Training a model to classify handwritten postal codes
using labeled data.
• Unsupervised Learning:
• Synonym for clustering.
• Input data is unlabeled, and the method discovers patterns or
classes in the data.
• Example: Clustering handwritten digit images into 10 groups
corresponding to digits 0–9 without semantic labels.
87.
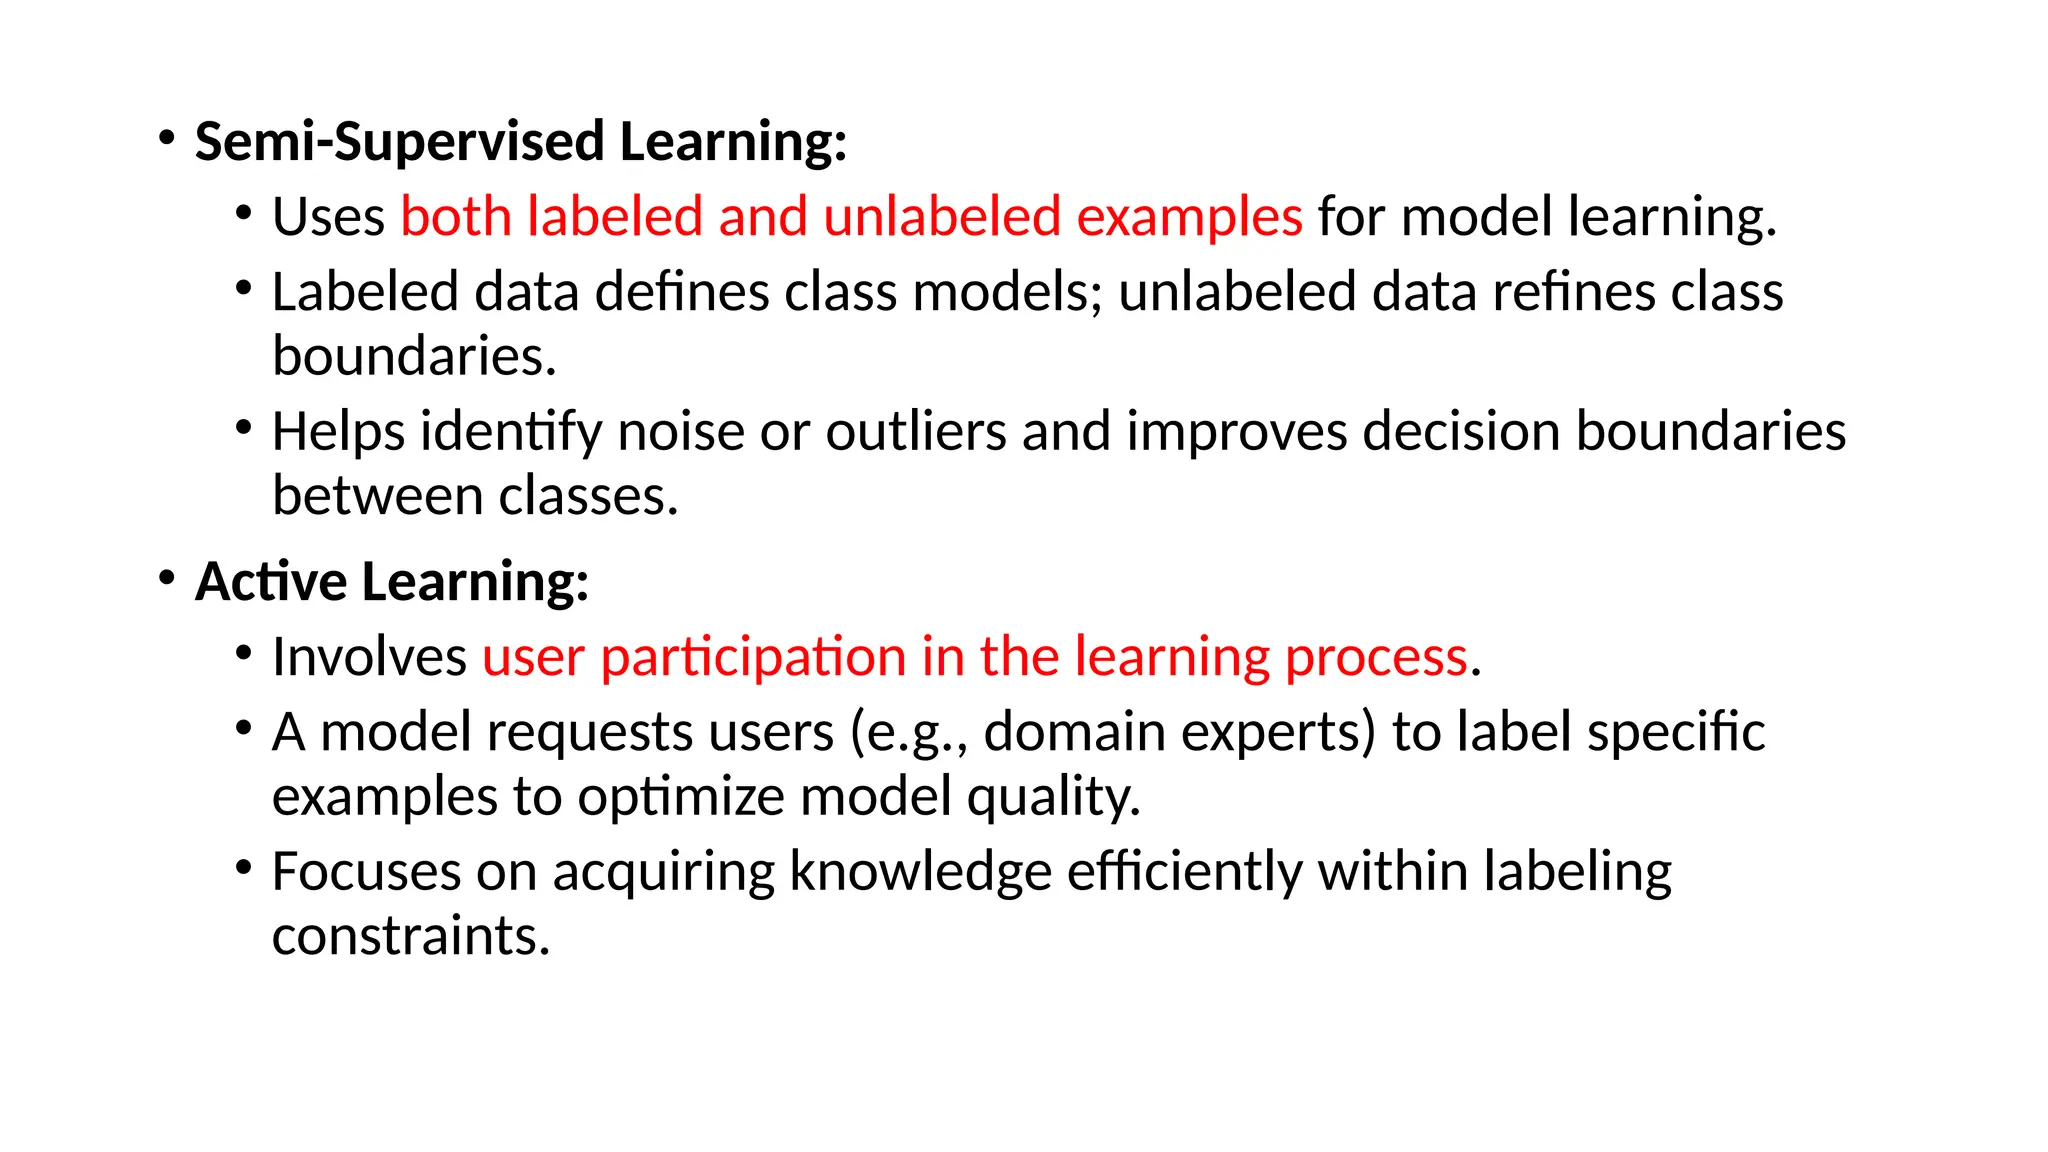
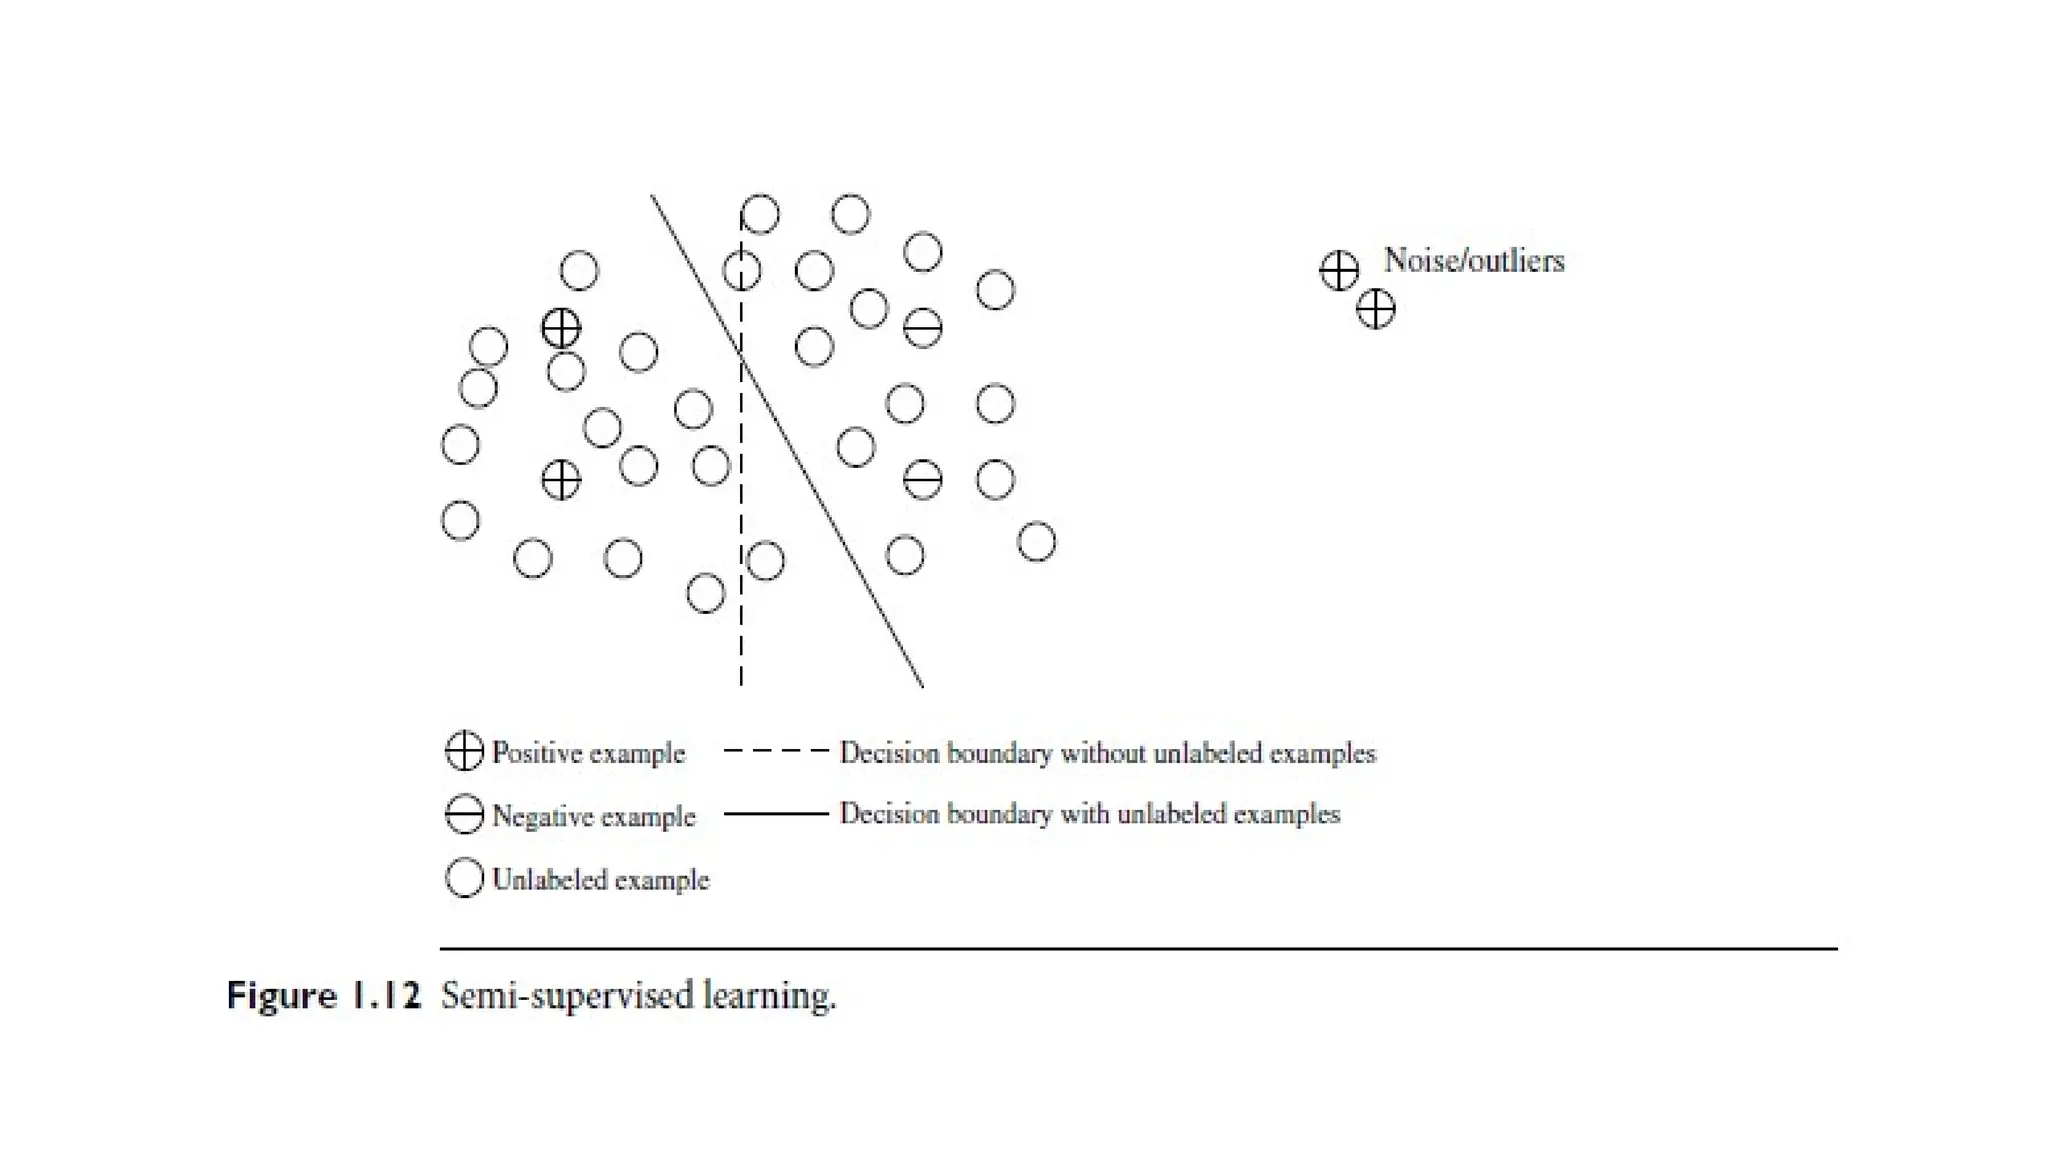
• Semi-Supervised Learning:
•Uses both labeled and unlabeled examples for model learning.
• Labeled data defines class models; unlabeled data refines class
boundaries.
• Helps identify noise or outliers and improves decision boundaries
between classes.
• Active Learning:
• Involves user participation in the learning process.
• A model requests users (e.g., domain experts) to label specific
examples to optimize model quality.
• Focuses on acquiring knowledge efficiently within labeling
constraints.
89.
Database Systems andData Warehouses
• Focus of Database Systems Research:
• Development of principles for data models, query languages,
query processing, optimization, data storage, indexing, and access
methods.
• Emphasis on high scalability for processing large, structured
datasets.
• Relevance to Data Mining:
• Data mining benefits from scalable database technologies to
handle large datasets and real-time, fast-streaming data efficiently.
• Extends the capabilities of database systems to meet sophisticated
data analysis needs.
90.
• Integration ofData Analysis:
• Modern database systems incorporate data warehousing and data
mining facilities for systematic data analysis.
• Data Warehouses:
• Integrate data from multiple sources and timeframes.
• Consolidate data in multidimensional spaces through materialized
data cubes.
• Data Cube Model:
• Facilitates Online Analytical Processing (OLAP) in multidimensional
databases.
• Enhances multidimensional data mining capabilities.
91.
Information Retrieval (IR)
•Definition:
• IR is the science of searching for documents or information in
documents, which can include text or multimedia, residing on the
Web or other sources.
• Key Differences from Database Systems:
• Data under search in IR is typically unstructured.
• Queries in IR are usually keyword-based rather than complex
structured queries like SQL.
92.
• Probabilistic Modelsin IR:
• Documents are treated as "bags of words" (multisets of words).
• A document’s language model is a probability density function
generating the words in the document.
• Similarity between documents is measured using the similarity of
their language models.
• Topic Models:
• A topic is modeled as a probability distribution over the
vocabulary.
• Documents can involve one or more topics and are modeled as
mixtures of topic distributions.
93.
• Integration withData Mining:
• Combining IR models with data mining techniques helps identify
major topics in a collection of documents.
• For each document, it identifies the dominant topics involved.
• Growing Importance:
• Large-scale text and multimedia data are accumulating due to the
Web, digital libraries, governments, and healthcare systems.
• The need for effective search and analysis has led to the increasing
significance of text mining and multimedia data mining,
integrated with IR methods.
94.
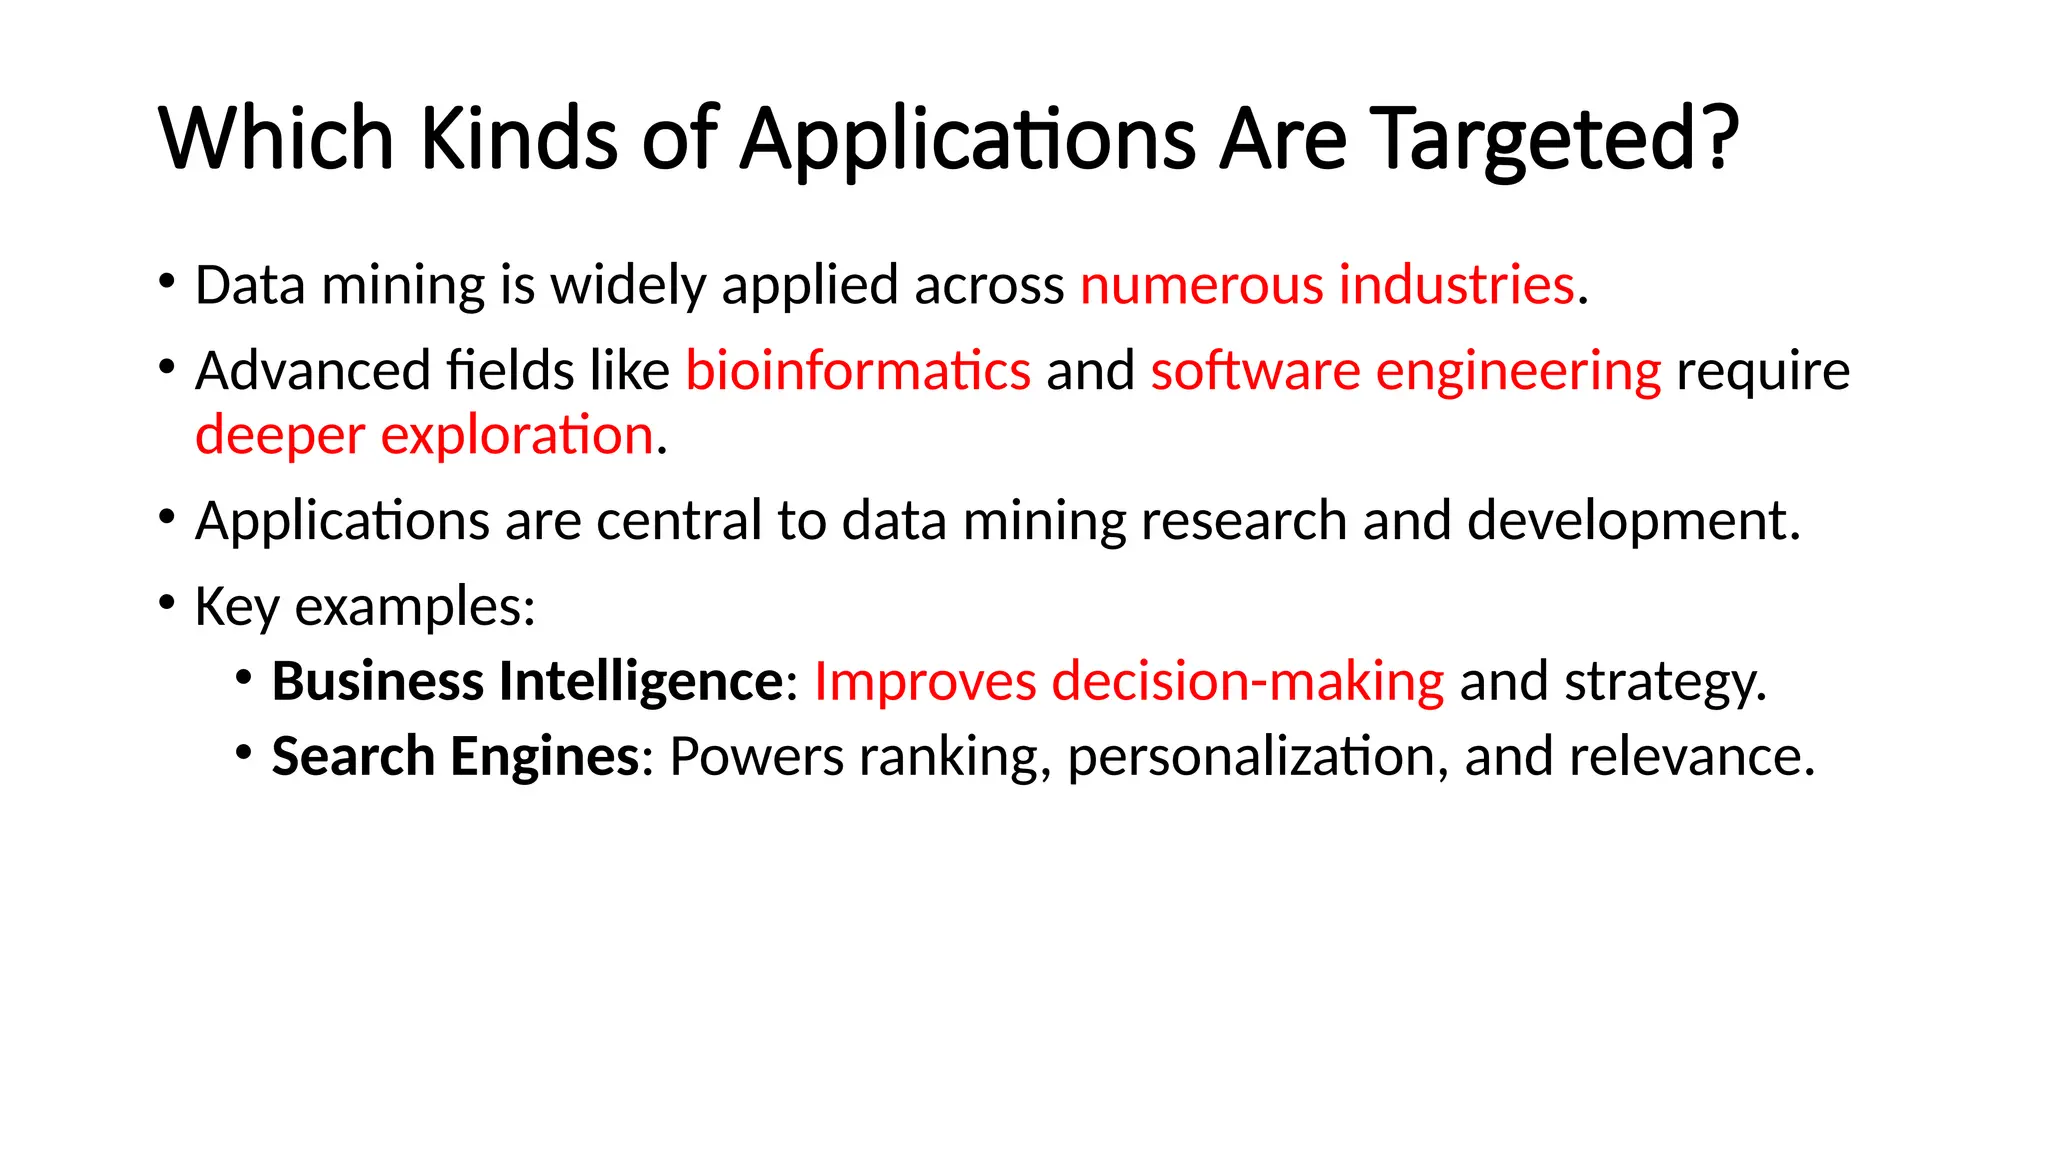
Which Kinds ofApplications Are Targeted?
• Data mining is widely applied across numerous industries.
• Advanced fields like bioinformatics and software engineering require
deeper exploration.
• Applications are central to data mining research and development.
• Key examples:
• Business Intelligence: Improves decision-making and strategy.
• Search Engines: Powers ranking, personalization, and relevance.
95.
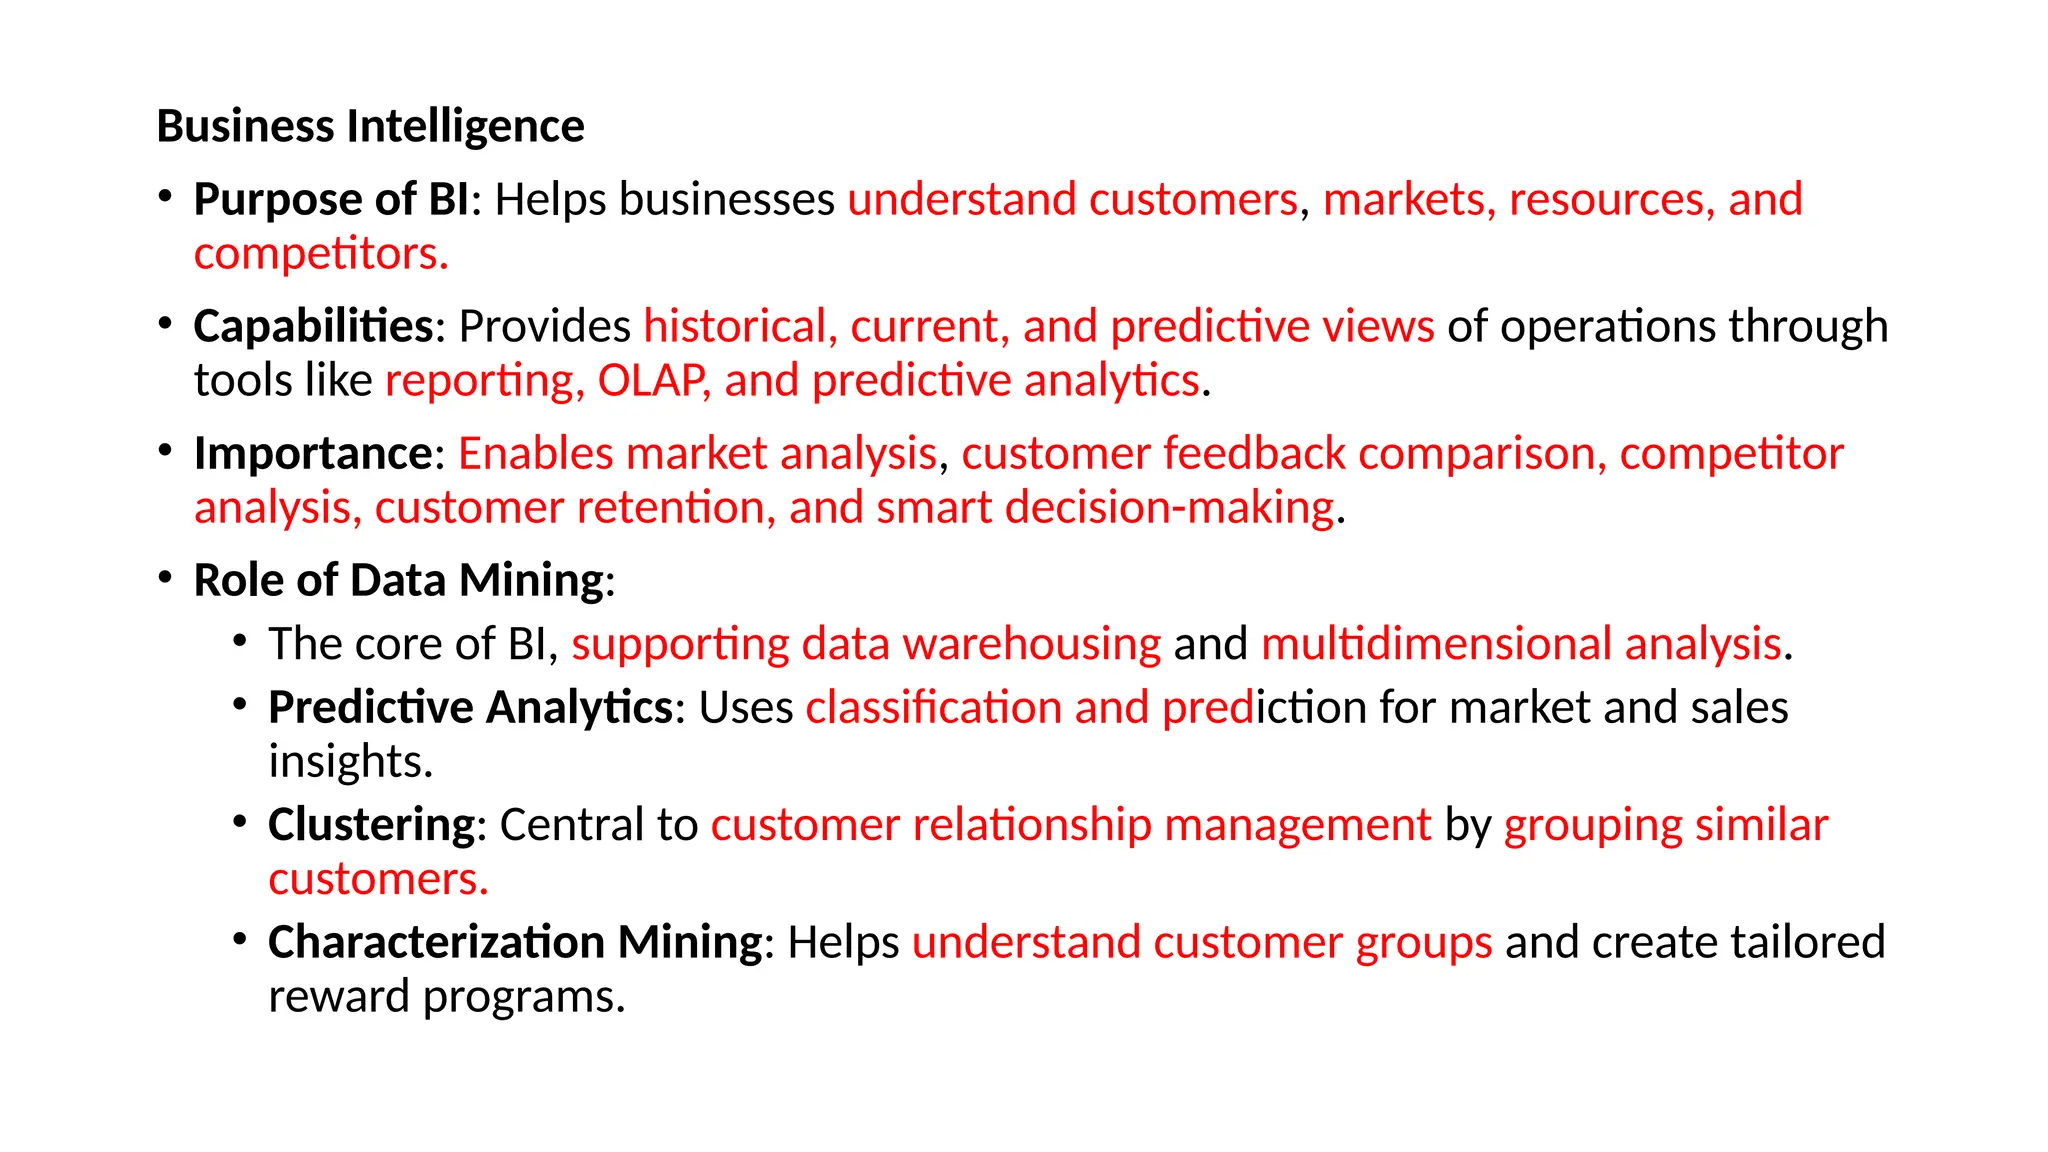
Business Intelligence
• Purposeof BI: Helps businesses understand customers, markets, resources, and
competitors.
• Capabilities: Provides historical, current, and predictive views of operations through
tools like reporting, OLAP, and predictive analytics.
• Importance: Enables market analysis, customer feedback comparison, competitor
analysis, customer retention, and smart decision-making.
• Role of Data Mining:
• The core of BI, supporting data warehousing and multidimensional analysis.
• Predictive Analytics: Uses classification and prediction for market and sales
insights.
• Clustering: Central to customer relationship management by grouping similar
customers.
• Characterization Mining: Helps understand customer groups and create tailored
reward programs.
96.
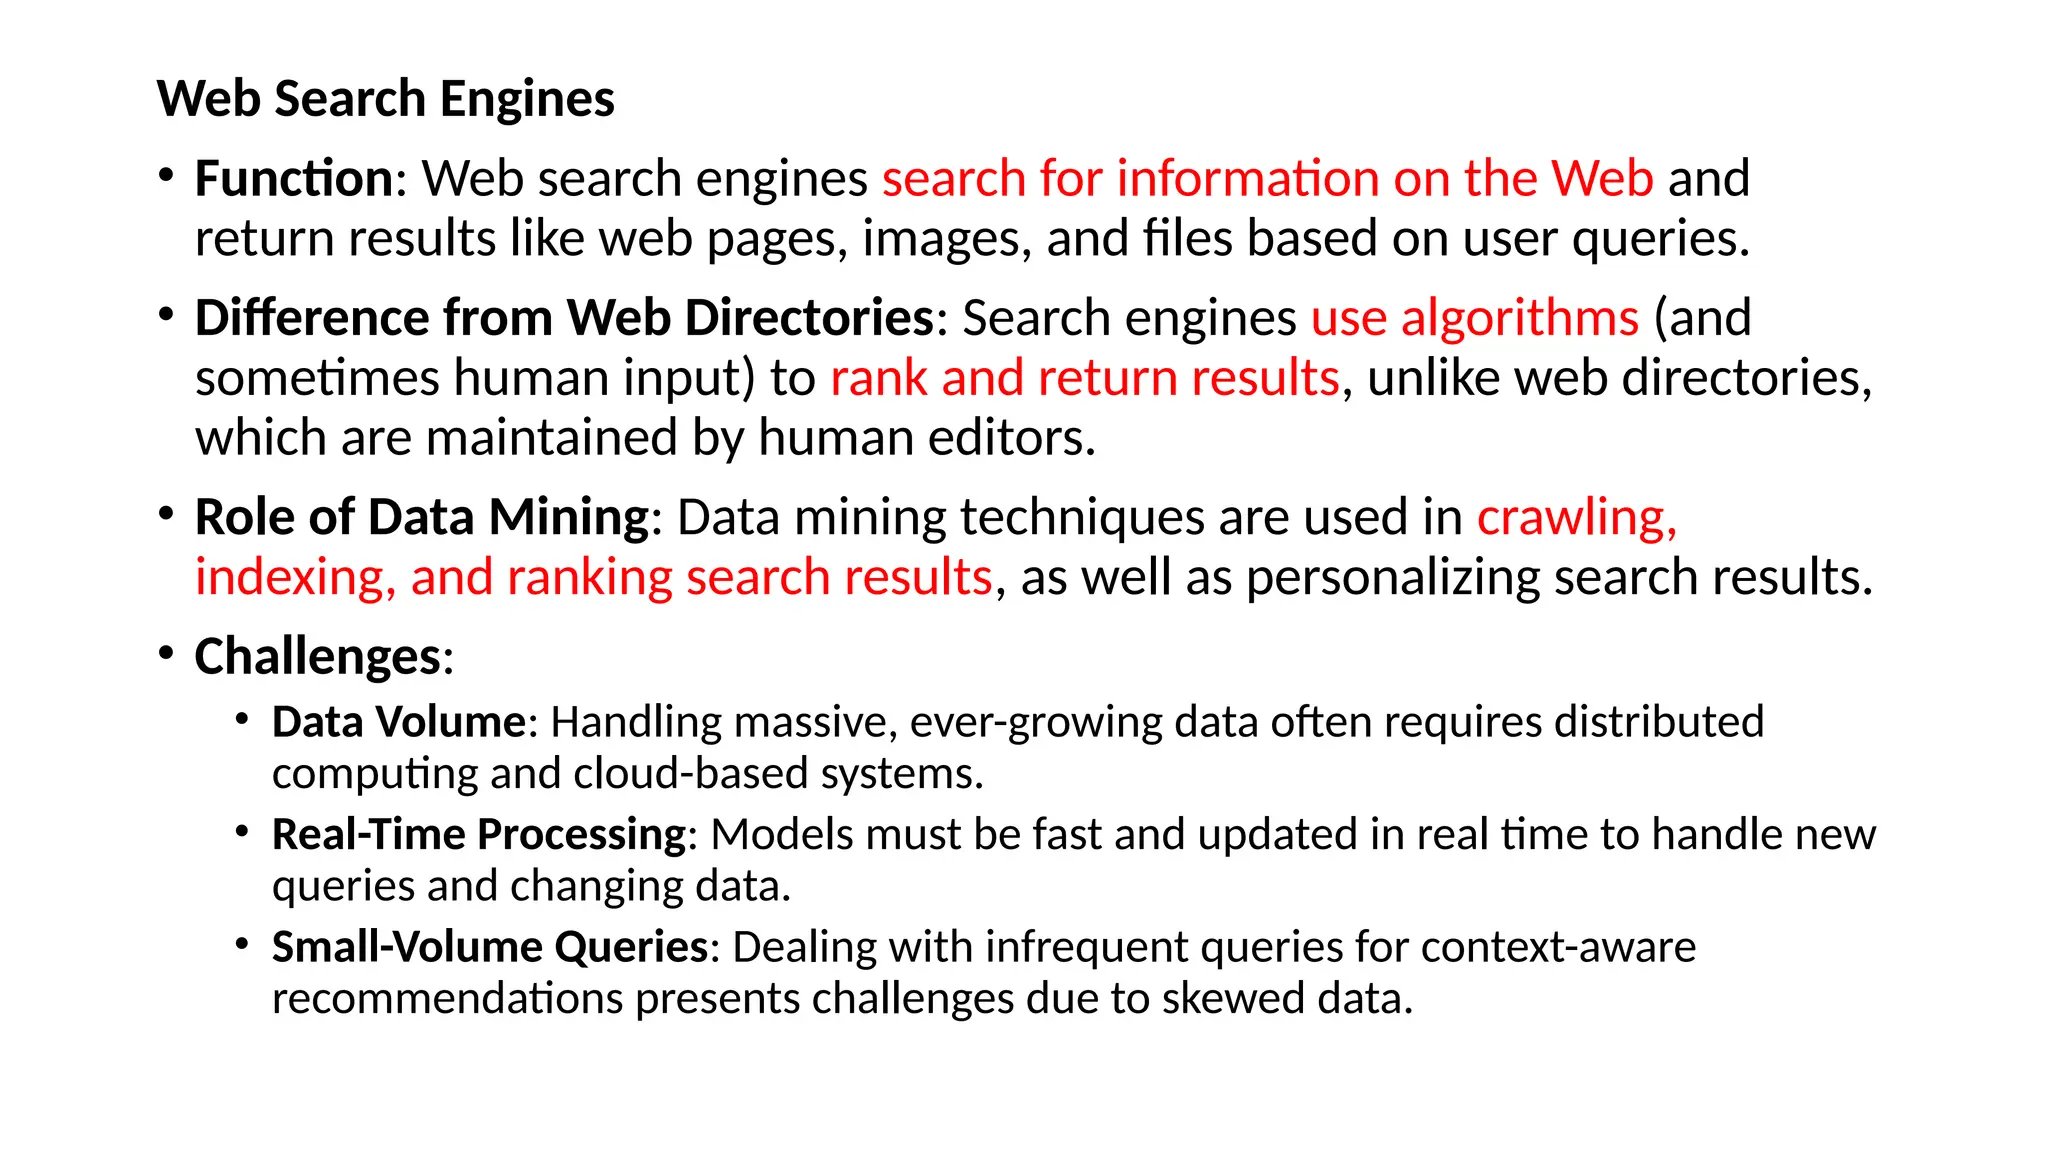
Web Search Engines
•Function: Web search engines search for information on the Web and
return results like web pages, images, and files based on user queries.
• Difference from Web Directories: Search engines use algorithms (and
sometimes human input) to rank and return results, unlike web directories,
which are maintained by human editors.
• Role of Data Mining: Data mining techniques are used in crawling,
indexing, and ranking search results, as well as personalizing search results.
• Challenges:
• Data Volume: Handling massive, ever-growing data often requires distributed
computing and cloud-based systems.
• Real-Time Processing: Models must be fast and updated in real time to handle new
queries and changing data.
• Small-Volume Queries: Dealing with infrequent queries for context-aware
recommendations presents challenges due to skewed data.
97.
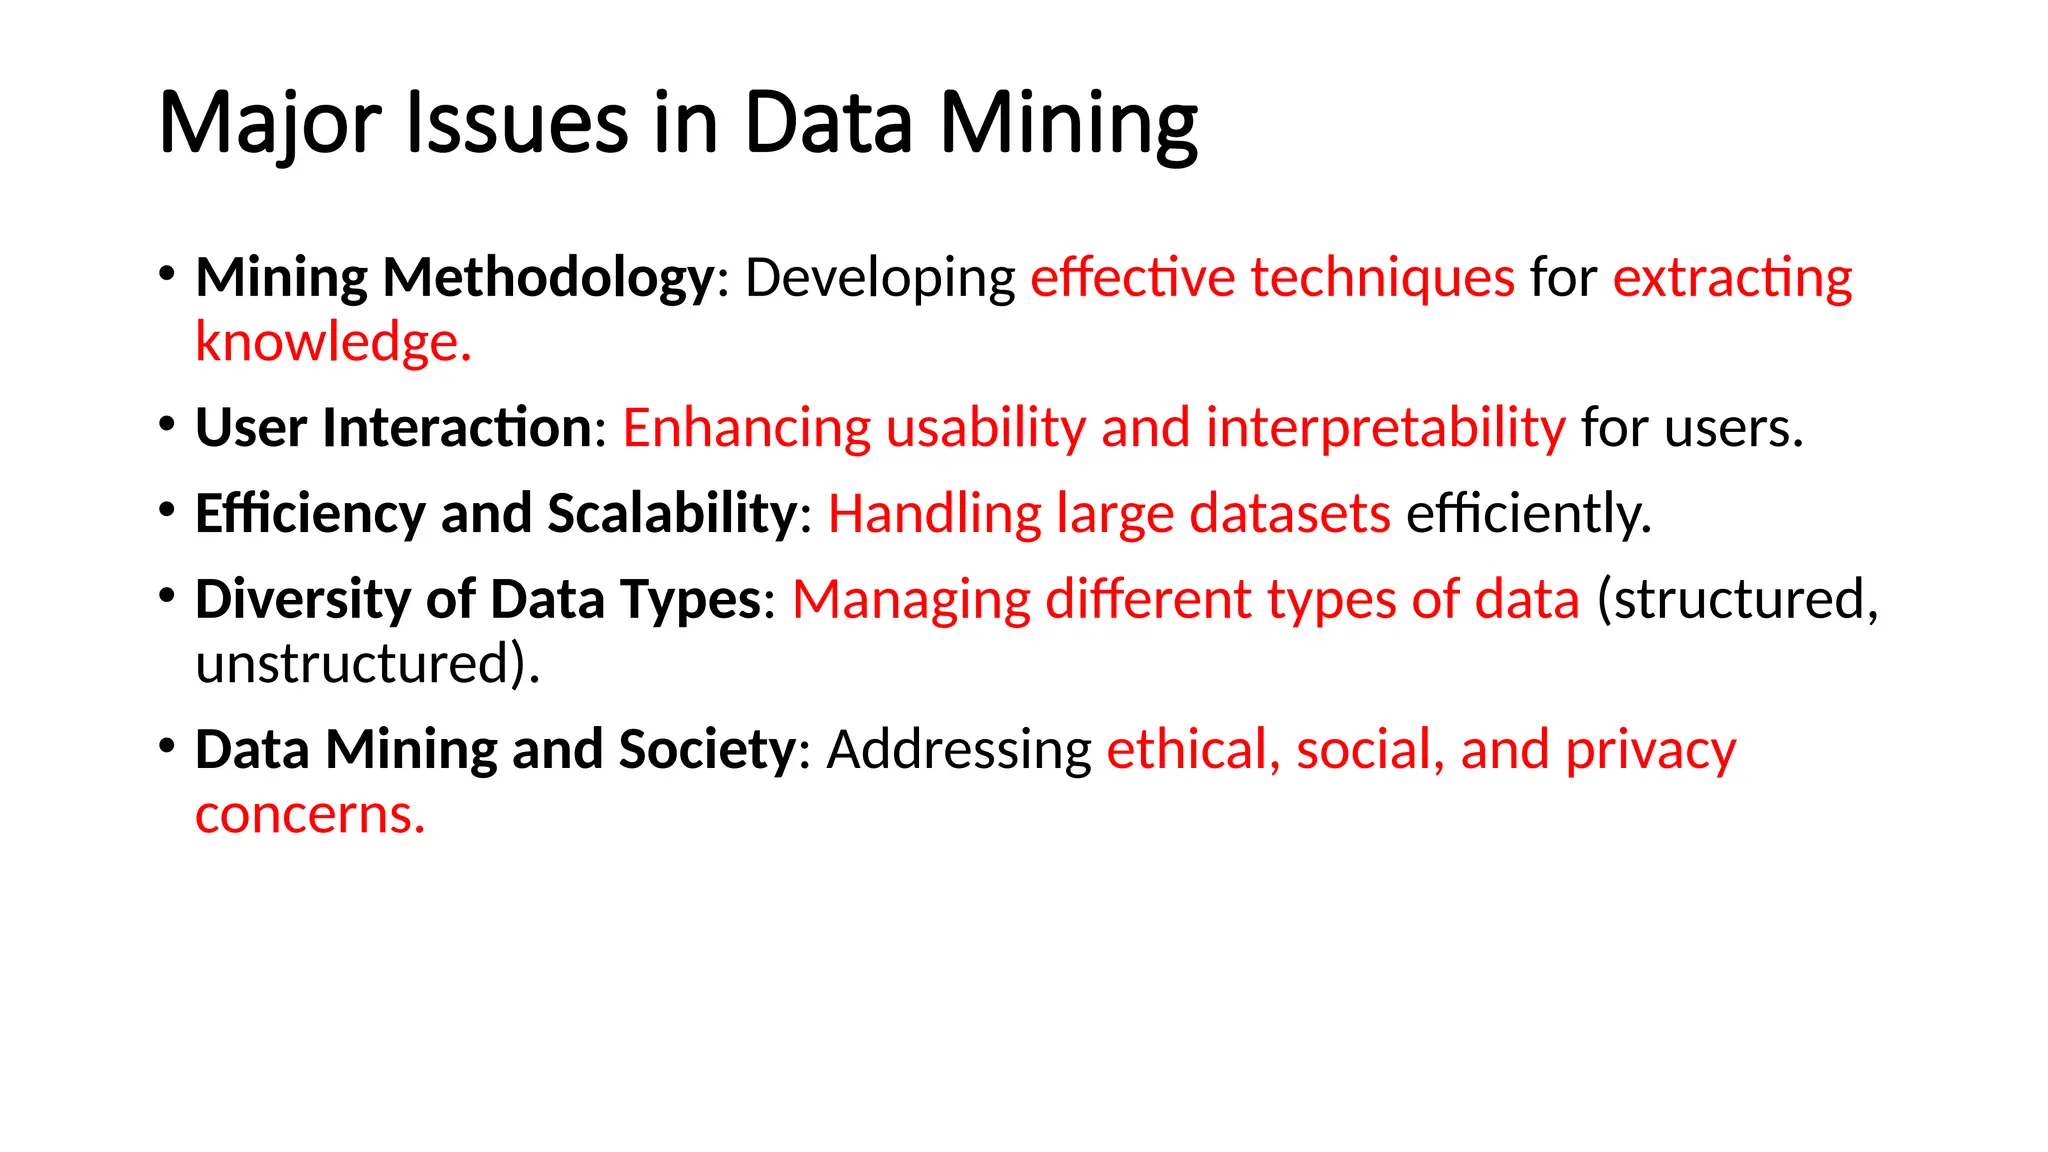
Major Issues inData Mining
• Mining Methodology: Developing effective techniques for extracting
knowledge.
• User Interaction: Enhancing usability and interpretability for users.
• Efficiency and Scalability: Handling large datasets efficiently.
• Diversity of Data Types: Managing different types of data (structured,
unstructured).
• Data Mining and Society: Addressing ethical, social, and privacy
concerns.
98.
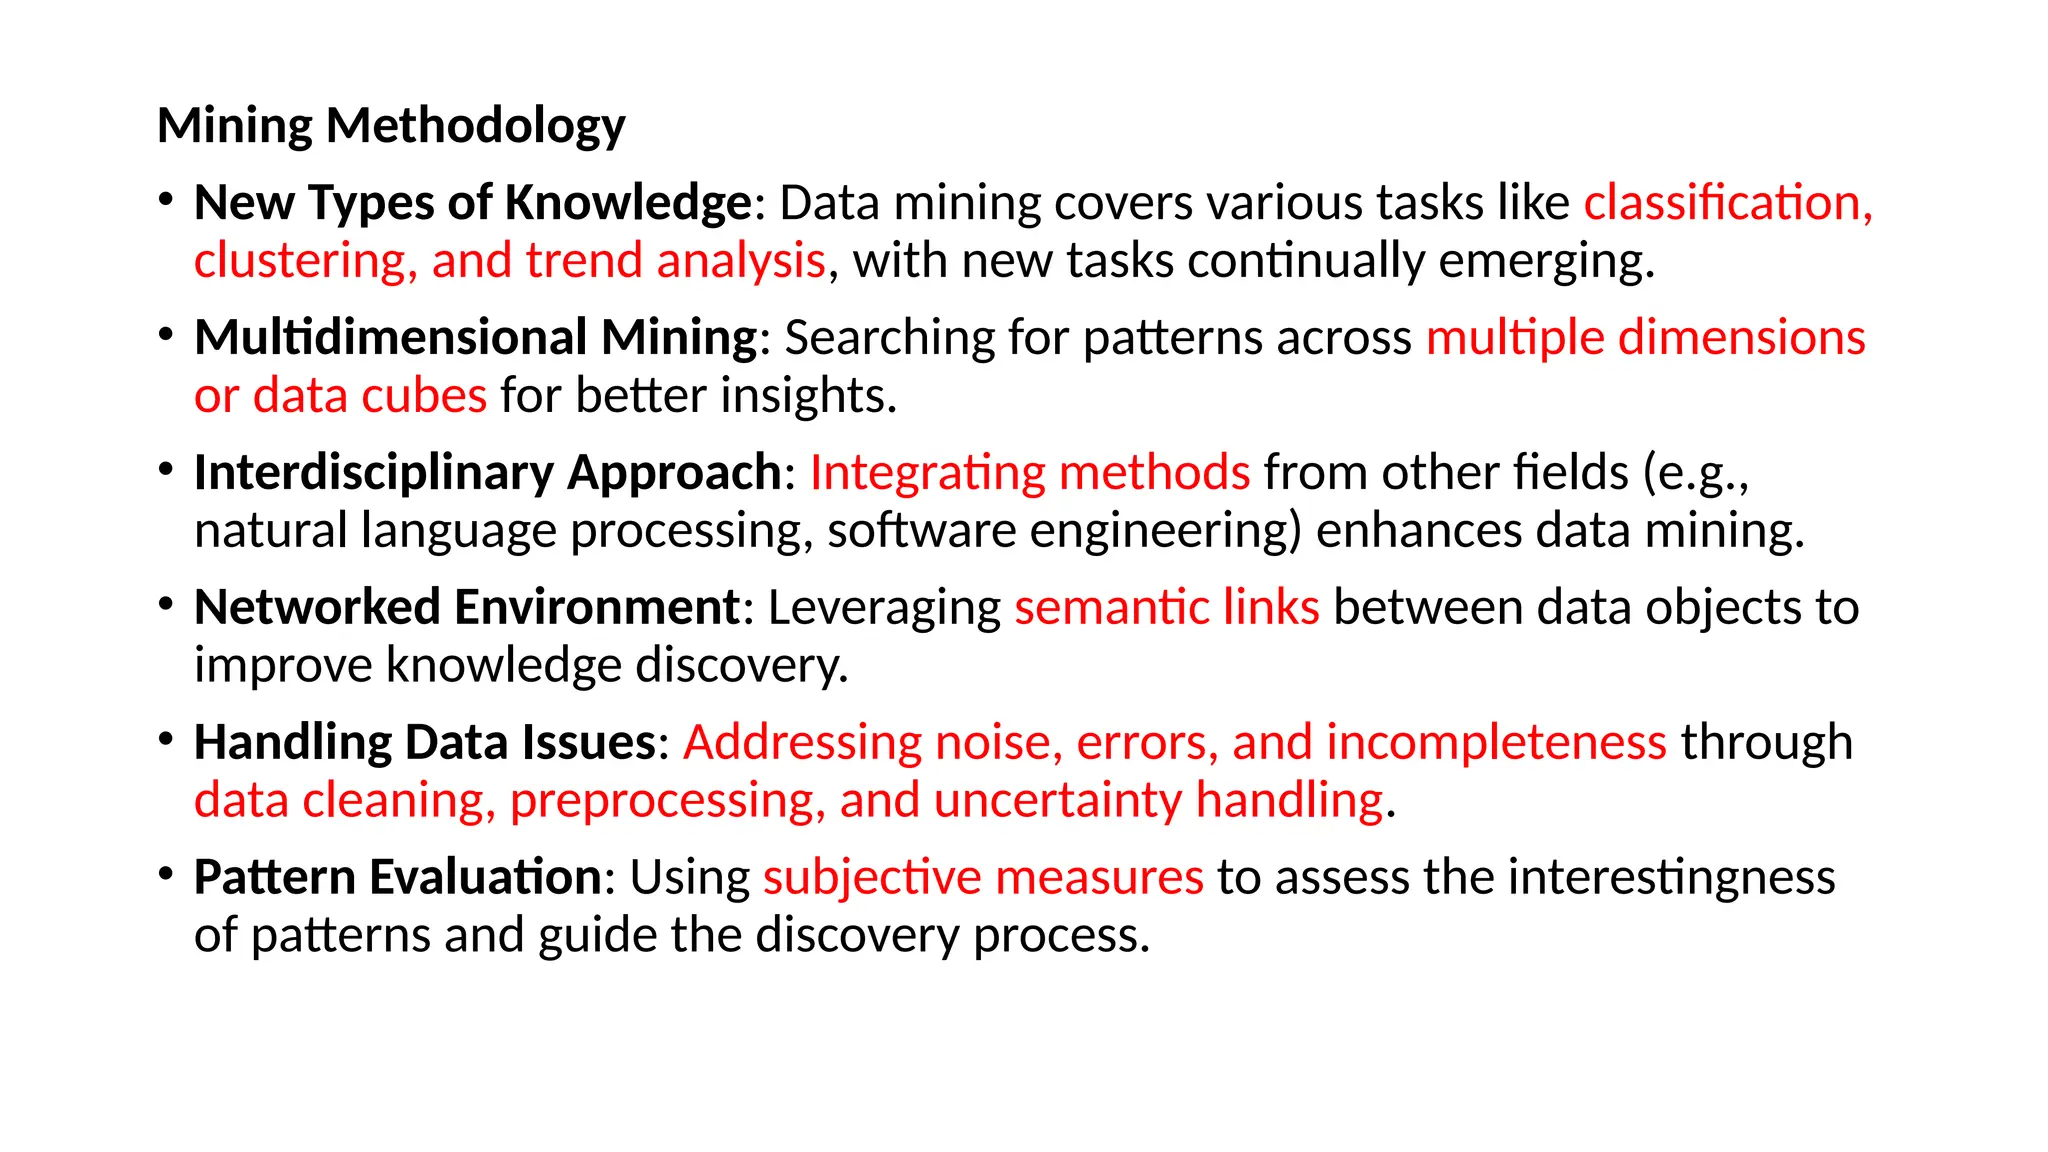
Mining Methodology
• NewTypes of Knowledge: Data mining covers various tasks like classification,
clustering, and trend analysis, with new tasks continually emerging.
• Multidimensional Mining: Searching for patterns across multiple dimensions
or data cubes for better insights.
• Interdisciplinary Approach: Integrating methods from other fields (e.g.,
natural language processing, software engineering) enhances data mining.
• Networked Environment: Leveraging semantic links between data objects to
improve knowledge discovery.
• Handling Data Issues: Addressing noise, errors, and incompleteness through
data cleaning, preprocessing, and uncertainty handling.
• Pattern Evaluation: Using subjective measures to assess the interestingness
of patterns and guide the discovery process.
99.
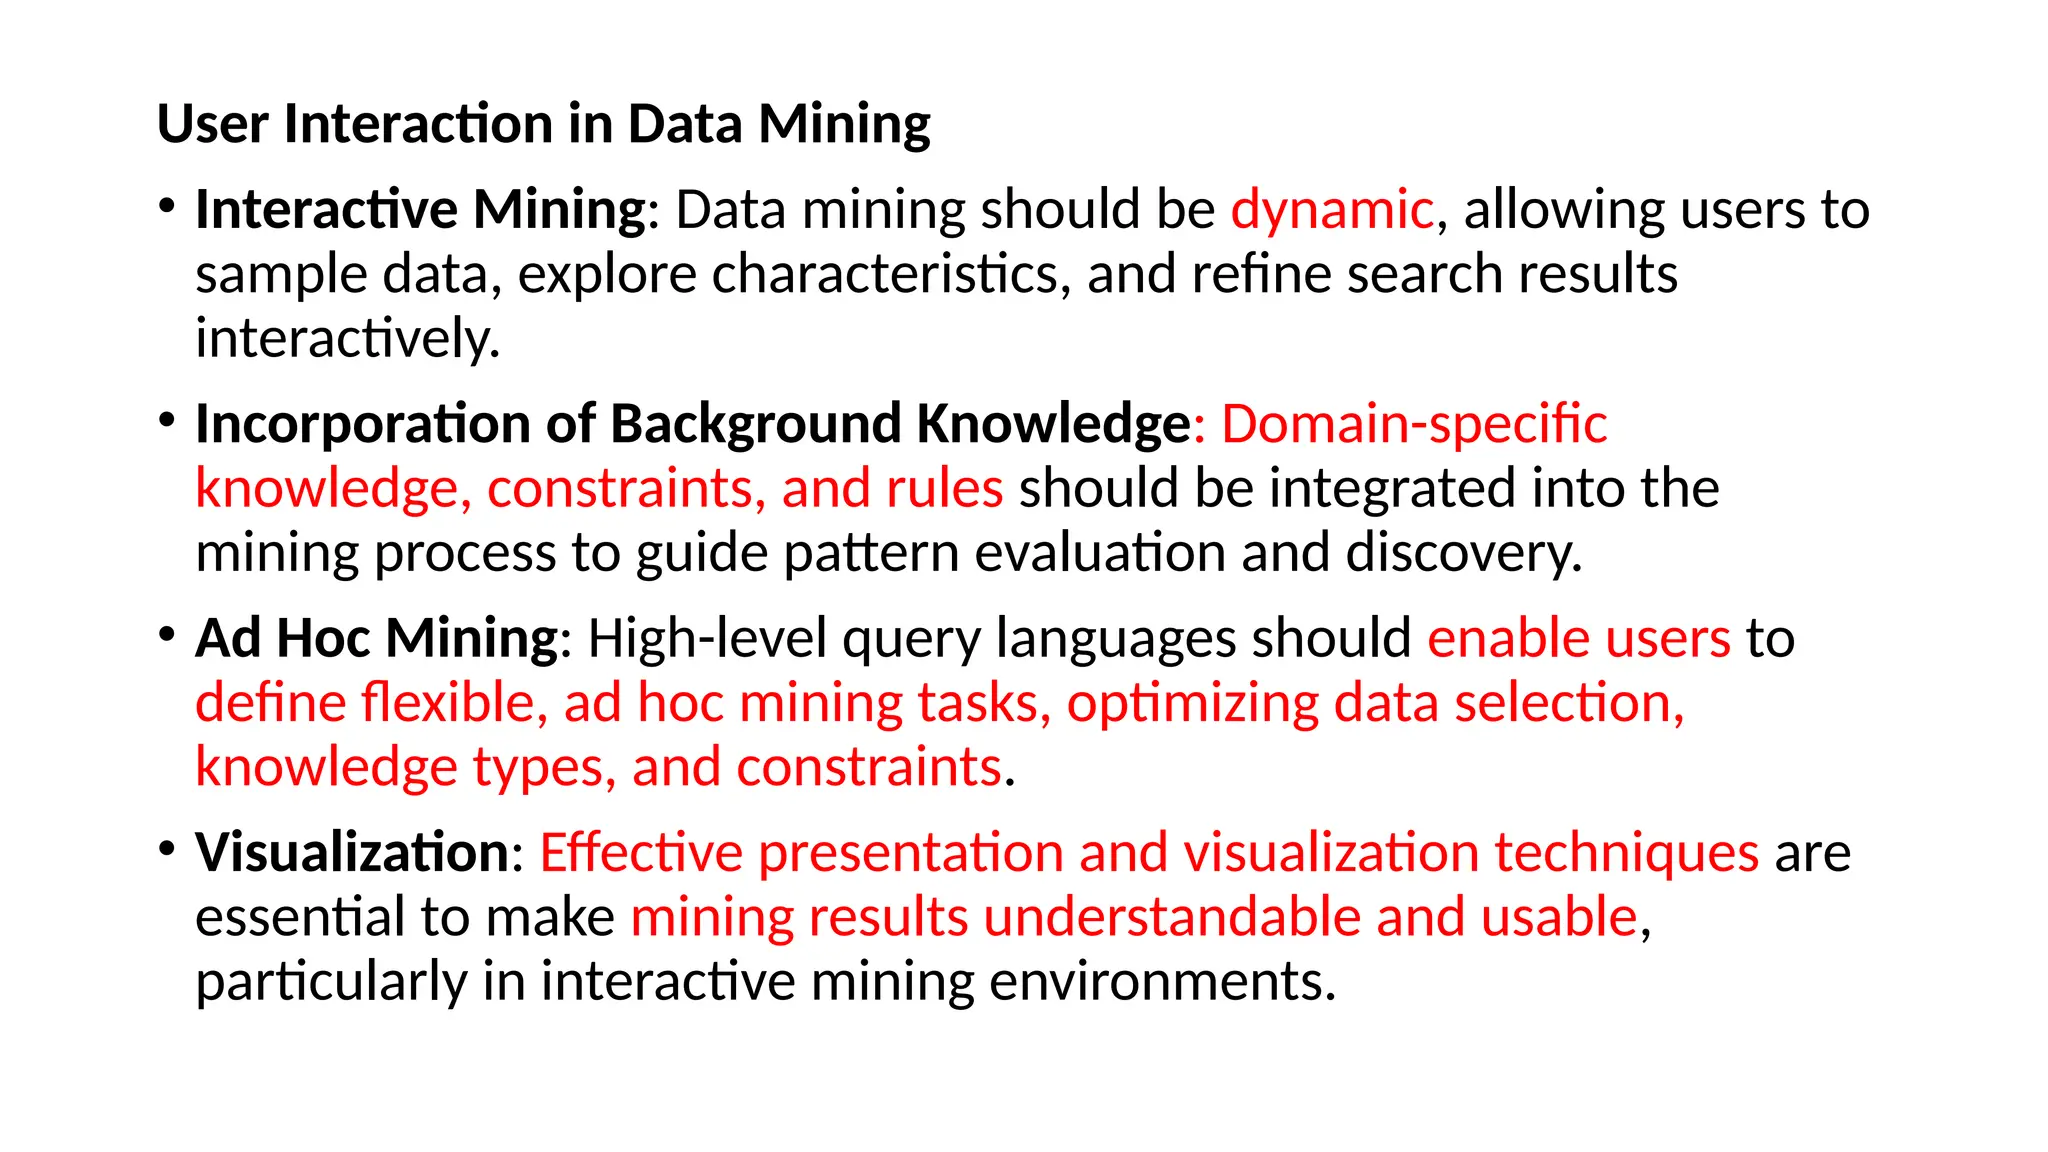
User Interaction inData Mining
• Interactive Mining: Data mining should be dynamic, allowing users to
sample data, explore characteristics, and refine search results
interactively.
• Incorporation of Background Knowledge: Domain-specific
knowledge, constraints, and rules should be integrated into the
mining process to guide pattern evaluation and discovery.
• Ad Hoc Mining: High-level query languages should enable users to
define flexible, ad hoc mining tasks, optimizing data selection,
knowledge types, and constraints.
• Visualization: Effective presentation and visualization techniques are
essential to make mining results understandable and usable,
particularly in interactive mining environments.
100.
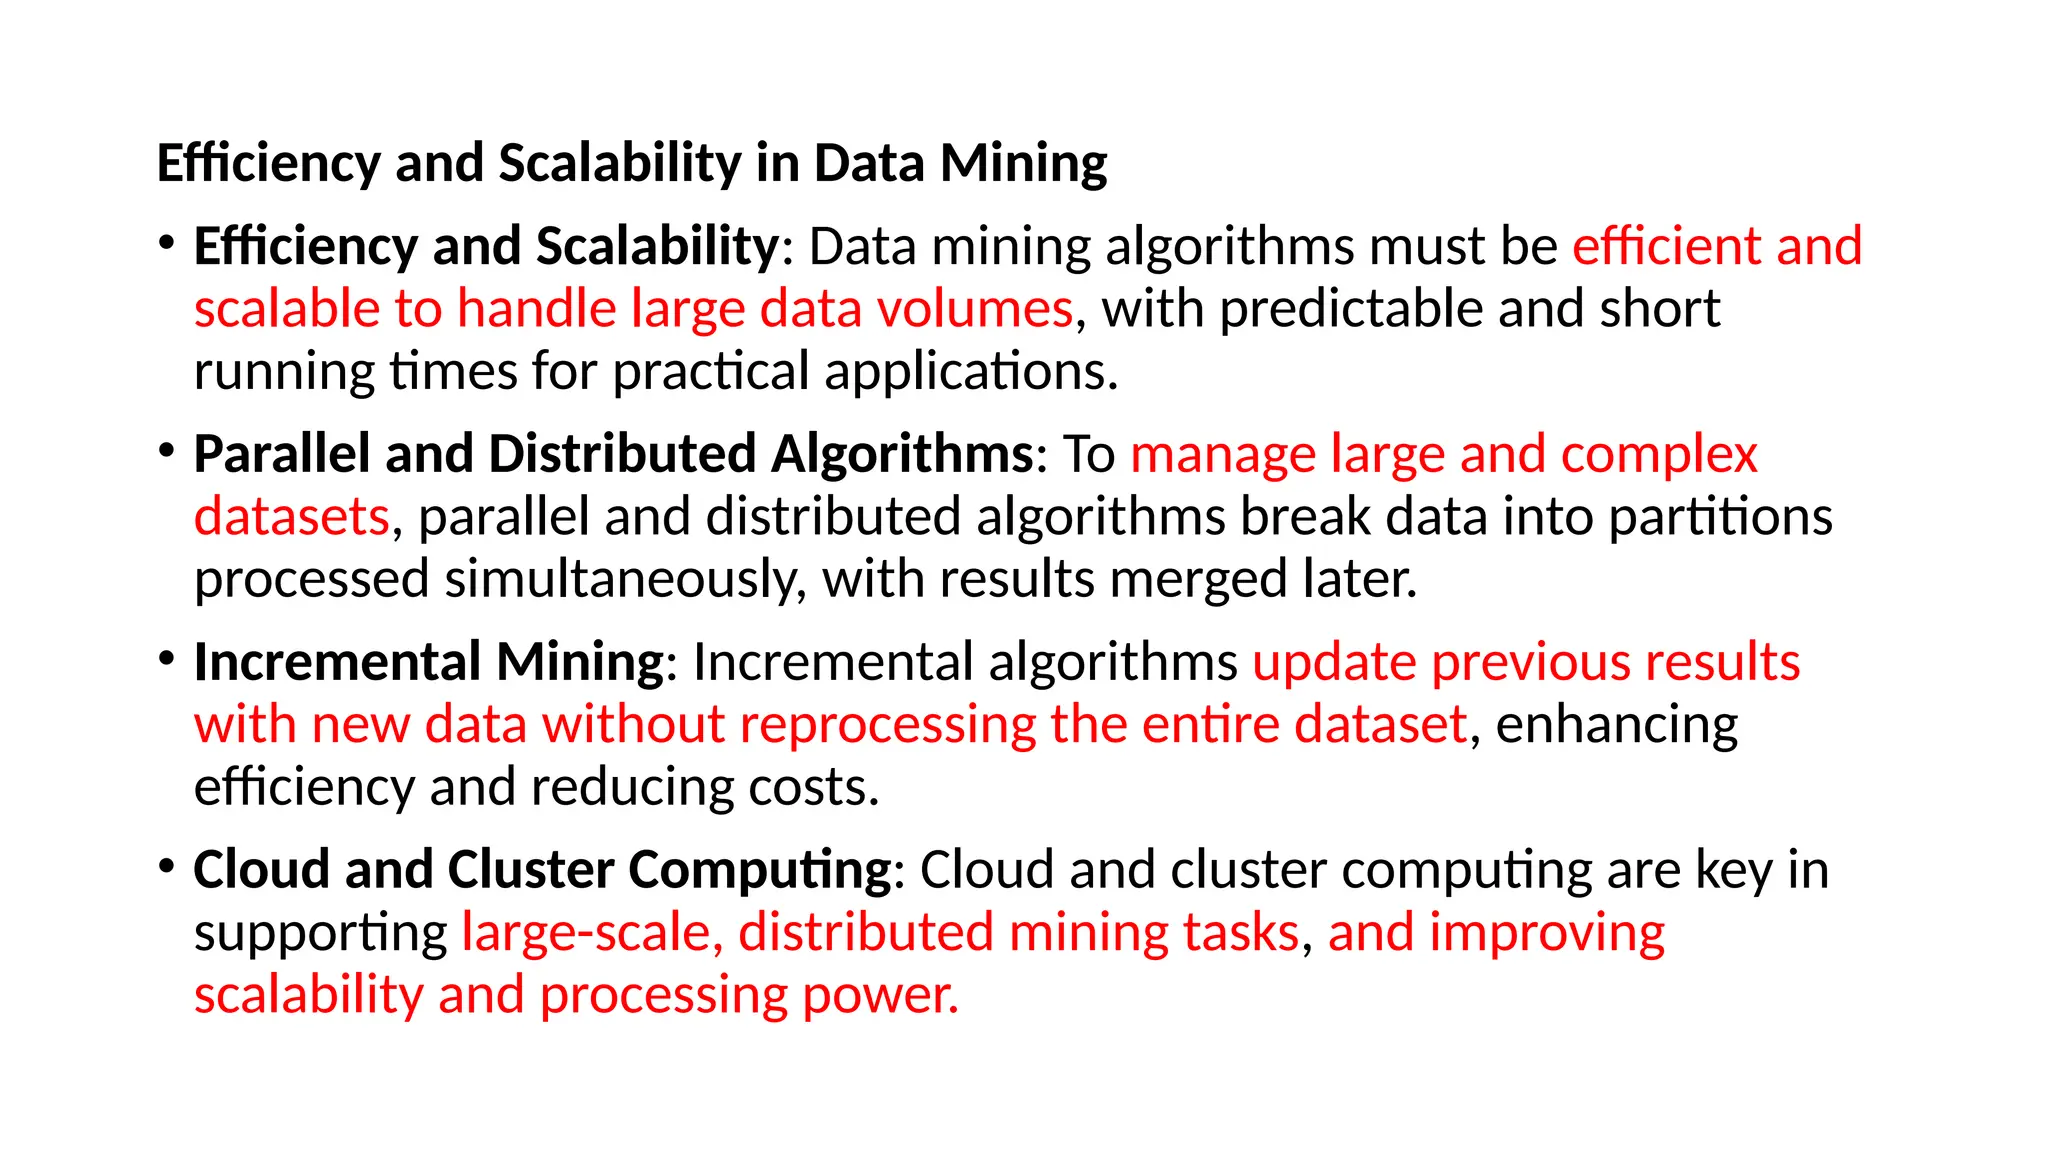
Efficiency and Scalabilityin Data Mining
• Efficiency and Scalability: Data mining algorithms must be efficient and
scalable to handle large data volumes, with predictable and short
running times for practical applications.
• Parallel and Distributed Algorithms: To manage large and complex
datasets, parallel and distributed algorithms break data into partitions
processed simultaneously, with results merged later.
• Incremental Mining: Incremental algorithms update previous results
with new data without reprocessing the entire dataset, enhancing
efficiency and reducing costs.
• Cloud and Cluster Computing: Cloud and cluster computing are key in
supporting large-scale, distributed mining tasks, and improving
scalability and processing power.
101.
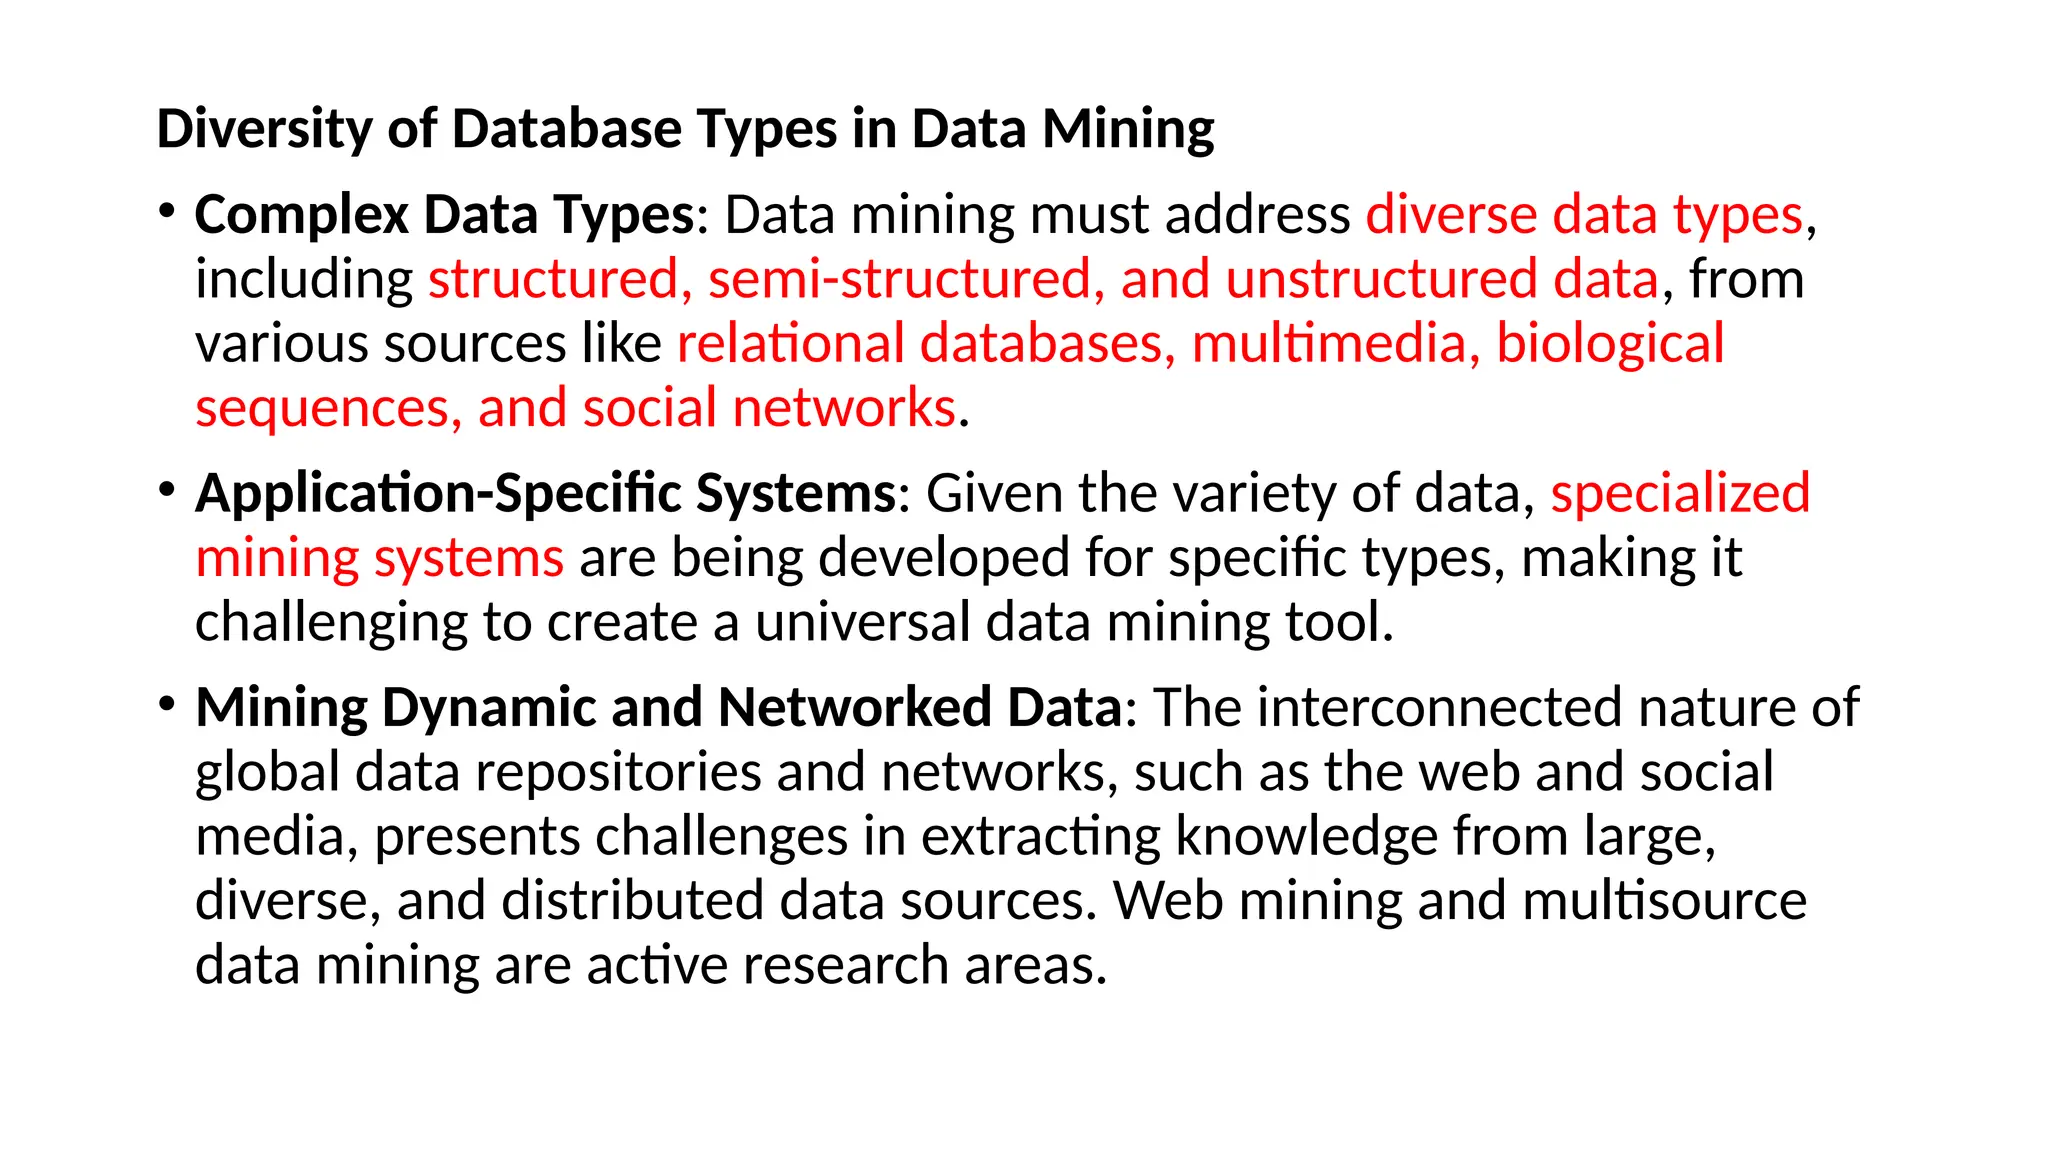
Diversity of DatabaseTypes in Data Mining
• Complex Data Types: Data mining must address diverse data types,
including structured, semi-structured, and unstructured data, from
various sources like relational databases, multimedia, biological
sequences, and social networks.
• Application-Specific Systems: Given the variety of data, specialized
mining systems are being developed for specific types, making it
challenging to create a universal data mining tool.
• Mining Dynamic and Networked Data: The interconnected nature of
global data repositories and networks, such as the web and social
media, presents challenges in extracting knowledge from large,
diverse, and distributed data sources. Web mining and multisource
data mining are active research areas.
102.
Data Mining andSociety
• Social Impacts: Data mining affects society by influencing scientific,
business, and security advancements. However, concerns about
privacy violations and misuse of personal data need attention.
• Privacy-Preserving Data Mining: Data mining can be used to benefit
society but may risk disclosing private information. Efforts are ongoing
to protect privacy while still enabling valuable data insights.
• Invisible Data Mining: Many systems incorporate data mining
functions without users' knowledge, enhancing user experience in
ways like personalized recommendations, even if users are unaware
of the data analysis being performed.
![• Types of Association Rules:
• Single-Dimensional Rules: Involve one attribute or predicate (e.g.,
"buys").
• Multidimensional Rules: Involve multiple attributes or dimensions
(e.g., age, income, and purchases).
• Example: "20-29 years old, $40,000-$49,000 income → buys
laptop [2%, 60%]."
• Thresholds for Interest:
• Rules are considered useful only if they meet minimum support
and minimum confidence thresholds.](https://image.slidesharecdn.com/unit-1-1-250223150813-2047e8fd/75/Aggahsbsbsbsbsbsbsbsbsbwbshhwhwhwgwhwhwh-62-2048.jpg)


![[DSC Europe 25] Debmalya Biswas - Agentification: the art of transforming man...](https://cdn.slidesharecdn.com/ss_thumbnails/r5azlggvtqiaiiusrqdr-4-251212103249-5a12c89b-thumbnail.jpg?width=640&height=640&fit=bounds)
![[DSC Europe 25] Jovan Bogicevic - Legacy to AI-Driven Defense: Transforming D...](https://cdn.slidesharecdn.com/ss_thumbnails/rsarluadt563hntyfc8q-3-251211083849-3e7bc4c0-thumbnail.jpg?width=640&height=640&fit=bounds)


![[DSC Europe 25] Behzad Hosseini - AI Agents in the Wild: Deploying Models tha...](https://cdn.slidesharecdn.com/ss_thumbnails/3qtejajvsjqrzwfept2c-10-251212103250-7f2b1068-thumbnail.jpg?width=640&height=640&fit=bounds)


![[DSC Europe 25] Katherine Forrest - AI NOW: Understanding the Velocity of Cha...](https://cdn.slidesharecdn.com/ss_thumbnails/wvvbruqfrci0sfq9xwgb-4-251212104007-e5ad1987-thumbnail.jpg?width=640&height=640&fit=bounds)
![[DSC Europe 25] Hans Kleinsman - The Compliance Gearbox: How Tax Tech Mediate...](https://cdn.slidesharecdn.com/ss_thumbnails/dxdytie1toel0hr90bjs-2-251212103250-174fdbe7-thumbnail.jpg?width=640&height=640&fit=bounds)