1. Reconstructing thermocline depth in the south Atlantic subtropical gyre during the Pliocene-Pleistocene
Kathryn G. Kynett; Petra S. Dekens
Department of Geosciences, San Francisco State University, kgkynett@gmail.com
• No long-term SST trend.
• Mean SSTs for the Pliocene (3-4 Ma) and late Pleistocene (0-0.8 Ma) are 21.6±0.9 and
21.4±0.7, respectively, and are not significantly different (based on Tukey-Kramer HSD
test for mean comparison).
Mg/CaSST(°C)
Age (Ma)
G. Sacculifer Mg/Ca SST
18
20
22
24
26
28
0 1 2 3 4
SST (°C)
(Wojcieszek et al., in progress)
Methods
• 10-30 shells of G. tumida and G. crassaformis were picked from the 250-355 μm
fraction.
• G. tumida is only present in the section of the core representing 0 to 1.45 Ma.
• G. crassaformis not present in the top of the core, but is present from 0.23 Ma
onward.
• 10-30 shells were gently crushed between two glass plates to open the
chambers.
• 25-55 μg of sample were seperated into one aliquot for δ18
O analysis. When
remaining mass was >250 μg, sample was seperated into two aliquots for future
Mg/Ca analysis.
• Shells were cleaned using methanol and sonicated for 10 seconds.
• Samples were analyzed on a Finnigan Kiel IV attached to a Finnigan MAT 253
with a long-term precision of ± 0.08%, based on the NIST Standard Reference
Materials NBS 18, NBS 19 and an in-house standard Carrera Marble at the UCSC
Stable Isotope Laboratory.
• δ18
O values are reported relative to the Vienna PeeDeeBelemnite (VPDB)
• Generate a G. crassaformis and G. tumida Mg/Ca records to separate the temperature
and salinity signal in the δ18
O data and create separate records of temperature and
salinity over the past 4 Ma.
• Continue δ18
O analysis of G. saccuifer and G. crassaformis to increase the resolution of
the record.
Future Work
Acknowledgements
We thank D.H. Andreasen for access to the Kiel Carbonate Device at the UCSC Stable Isotope Laboratory, J.P. Kennett and A.C. Ravelo for
consultation on foraminifera tests, J. Gettler and J. Miles for picking foraminifera, the National Science Foundation, James C. Kelley, the ARCS
Foundation and Pestrong Fund for financial support.
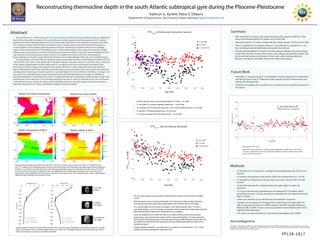
• All three species show a trend toward lighter δ18
O from ~1 to 0 Ma.
• G. sacculifer δ18
O remains relatively stable from ~ 4 to 0.5 Ma.
• G. crassaformis δ18
O values increase from ~4 to 2 Ma, and decrease from ~2 to 0 Ma.
• G. tumida δ18
O values decrease from ~0.5 to 0 Ma.
• δ18
O values overlap in all three species from ~ 0.5 to 0 Ma.
• The ice volume signal was removed by subtracting the benthic Lisieki and Raymo (2004)
record.
• All three species show a trend toward lighter δ18
O values from 4 My to today, indicating
increasing temperature and/or decreasing salinity from the early Pliocene to today.
• A G. sacculfer Mg/Ca record shows no change in SST, which indicates the δ18
O trend is
recording changes in δ18
O of seawater and implies a freshening of the surface water from the
Pliocene through the Pleistocene (Wojcieszek et al., in progress).
• Given the stability of SST at ODP site 1264, it is unlikely that early Pliocene subsurface
temperatures were warmer than today, and the trend toward lighter δ18
O values therefore
likely records a freshening of the subsurface water from the early Pliocene to today. This will
be confirmed in the future of this project by the use of Mg/Ca paleothermometry on the
subsurface species.
• A larger gradient between G. sacculifer and G. crassaformis is observed from ~3 to 1.5 Ma,
implying increased stratification during this time.
PP13A-1817
SummaryAbstract
• After removing ice volume, both surface and subsurface species at ODP site 1264
show a trend toward lighter δ18
O values over the last 4 Ma.
• Subsurface species δ18
O values overlap with the surface species δ18
O from 0 to 0.5 Ma.
• There is a significant δ18
O gradient between G. sacculifer and G. crassaformis 1.5 to 3
Ma, indicating increased stratification during this time interval.
• The trend toward lighter δ18
O values in all three species indicates decreasing salinity
at ODP Site 1264 over the last 4 Ma in both at the surface and subsurface waters. This
trend may have be due to a decrease in inter-ocean water exchange between
between the Atlantic and Indian Ocean from 4 Ma to the present.
The early Pliocene (3–5 million years ago) is the most recent time in Earth’s history when global climate was significantly
warmer than today, while atmospheric CO2 concentration was similar to today. Sea surface temperature (SST) in eastern
equatorial and coastal upwelling regions were 2-9°C warmer than today, while western equatorial warm pools had similar
SSTs compared to today in both the Pacific and Atlantic Ocean, causing reduced zonal and meridional SST gradients. A
current hypothesis is that a deeper global thermocline during the early Pliocene resulted in warmer SST at upwelling
regions, which caused climate-warming feedbacks such as increased atmospheric water vapor and a reduction of highly
reflective stratus clouds. Previous records of early Pliocene thermocline conditions come from tropical upwelling areas that
may have been influenced by tectonic events. Evidence of a shoaling thermocline at ODP Site 1264 through the
Pliocene-Pleistocene transition would indicate that the thermocline shoaled globally rather than just in upwelling regions.
This study presents a δ18
O record for the subsurface species Globorotalia crassiformis and Globorotalia tumida at ODP site
1264 (28.53°S; 2.85°E, 2505 m water depth). The δ18
O gradient between subsurface species G. crassiformis and G. tumida and
surface species Globigerinoides sacculifer (Wojcieszek et al., in progress) at this site record changes in the depth of the
thermocline as well as changes in local salinity and ice volume. With the ice volume signal removed (using Lisieki and
Raymo, 2004 benthic record), both subsurface and surface species record a decrease in δ18
O over the past 4 my, indicating
warming and/or freshening over that time period. A G. sacculifer Mg/Ca SST record at ODP site 1264 shows no change in SST
over the last 4 my, indicating surface water freshening over the past 4 Ma (Wojcieszek et al., in progress). Although no
subsurface temperature record exists at this time, it is unlikely that subsurface temperatures would have been cooler in the
early Pliocene, and the decrease in δ18
O more likely represents a decrease in salinity of subsurface waters from the Pliocene
to the Pleistocene. Future work in this project will include Mg/Ca analysis of subsurface species to determine changes in
subsurface temperature and salinity, and therefore changes in thermocline depth.
G. sacculifer
(0-50m)
G. tumida
(125-250m)
G. crassaformis
(125-250m)
Salinity (PSU)
34.2 35.835.435.034.6
0
200
400
600
800
1000
1200
1400
1600
1800
2000
G. Sacculifer (0-50m)
G. tumida (125-250m)
G. crassaformis (500-800 m)
5 252015100
200
0
400
600
800
1000
1200
1400
1600
1800
2000
Temperature (°C)
G. Sacculifer (0-50)
G. tumida (125-250m)
G. crassaformis (500-800 m)
Depth(m)
Depth(m)
Vertical profiles of temperature and salinity at ODP Site 1264 with vertical bars indicating the depth habitat ranges of G. sacculifer
(red), G. tumida (blue) and G. crassaformis (black) (Farmer et al., 2007). The δ18
O gradient between surface and subsurface species
will record changes in temperature and salinity with depth.
Temperature and salinity maps at ODP site 1264 (28.5°S, 2.8°E) in the modern ocean (Levitus et al., 1994). SST at ODP Site 1264
(20. 2°C) is colder than the subtropical gyre but warmer than Indian Ocean and the Benguela Upwelling region. Water temperature
at 800m (2°C) is similar to the subtropical gyre and the Benguela Upwelling region, but colder than the Indian Ocean. SSS at ODP
Site 1264 (35.8°C) is lower than the subtropical gyre, but slightly higher than the Benguela Upwelling region and similar to the
Indian Ocean. Salinity at 800m (34.4 PSU) is lower compared to the northern region of the subtropical gyre, similar to the Benguela
Upwelling region and higher than the Indian Ocean.
24.0 PSU
28.0 PSU
32.0 PSU
36.0 PSU
40.0 PSU
60°S
0°
30°N
60°W 60°E
30°S
30°W 0° 30°E
ODP Site 1264
30°N
60°S
60°W 60°E
30°S
0°
30°W 0° 30°E
ODP Site 1264
30N
25°C
20°C
15°C
10°C
5°C
0°C
30°C
Modern Sea Surface Temperature
Modern Temperature at 800 m
ODP Site 1264
30°N
60°S
60°W 60°E
30°S
0°
30°W 0° 30°E
12°C
10°C
8°C
4°C
6°C
2°C
0°C
-2°C
ODP Site 1264
Modern Sea Surface Salinity
Modern Salinity at 800 m
30°N
60°S
60°W
30°S
0°
30°E30°W 0° 60°E
32.4 PSU
33.2 PSU
34.0 PSU
34.8 PSU
35.6 PSU
ODP Site 1264
δ18Ocalcite
of Surface and Subsurface Species
Age (Ma)
δ18Ocalcite
(‰PDB)
2.5
2.0
1.5
1.0
0.5
0
-0.5
-1.0
0 0.5 1.0 1.5 2.0 2.5 3.0 3.5 4.0
G. sacculifer
G. tumida
G. crassaformis
G. tumida
G. sacculifer
G. crassaformis
-0.5
-1.5
-2.5
-3.5
-4.5
-5.5
Age (Ma)
0 0.5 1.0 1.5 2.0 2.5 3.0 3.5 4.0
δ18Ocalcite
(‰PDB) δ18Ocalcite
with Ice Volume Removed