Download to read offline

![Liquidity ratios tell us the story of an organization’s short‐term financial viability – its ability to
meet short‐term liabilities with short‐term assets. For example, can the organization pay it’s bills
using cash on hand for the short term? If not, can it access cash quickly enough to pay its bills for
the short term? Is it leveraged appropriately? Is it using debt‐financing to move forward or relying
on it to sustain operations?
Form 990, Page 11, Part X
Liquidity ratios are quickly and easily computed from the Form 990’s balance sheet, including the
working capital ratio, quick ratio, cash ratio, and operation cash‐flow ratio.
Working Capital Ratio = Current Assets / Current Liabilities
Quick Ratio = [Current Assets – (Inventories + Prepayments)] / Current Liabilities
Cash Ratio = Cash and Marketable Securities / Current Liabilities
Operation Cash Flow Ratio = Operating Cash Flow / Total Debts
Angie Fidler, CPA, CGMA | Bader Martin, PS 13](https://image.slidesharecdn.com/vglbl0ot1sgx6phvof7r-signature-6c1a995e1b208d35e7bfd52e3c7182ffe4e0d08a125930dd835b59d90cdef953-poli-141119183058-conversion-gate01/85/After-the-Overhead-Myth-13-320.jpg)

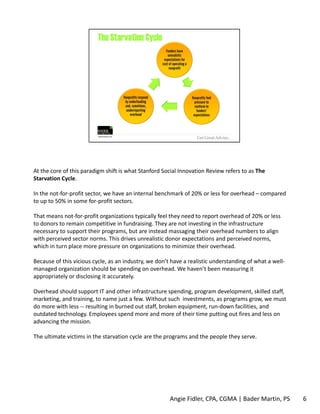
The document addresses the 'overhead myth' in the non-profit sector, arguing against the belief that minimal overhead is essential for attracting donations. It highlights how this mindset leads to underinvestment in crucial infrastructure, negatively impacting program effectiveness and organizational sustainability. The author calls for a reevaluation of how overhead is perceived and measured, advocating for improved communication with donors and the adoption of more comprehensive performance metrics.


