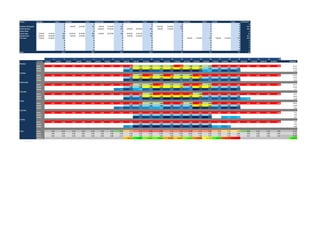
The document shows the weekly work hours for various employees over a 7 day period. It includes a roster of scheduled hours for each day and tracks the actual work hours completed along with the amount of time wasted each day. It calculates totals for the week for work hours, roster hours, and wasted time. It also provides percentages of wasted time for each day.
This document contains a table of numerical data with 10 columns and 30 rows. The columns include measurements of distance labeled D and L across different samples. The table appears to record multiple sets of distance measurements but does not include units or provide metadata to clarify what is being measured.
The document contains a table of numerical values with three columns: a constant value of 0.41 in the first column, values from 0.1 to 17 in the second column increasing by 0.1 each row, and corresponding values from 0 to 7 in the third column increasing by 0.1-0.2 each row. This outlines a direct proportional relationship between the second and third columns as the values increase consistently together from the top to bottom of the table.
The document contains a series of measurements in feet and inches that appear to describe the dimensions of building plans or a room layout as it is repeatedly labeled as being produced by an Autodesk educational product.
The document contains a series of numbers arranged in rows and columns representing a diagram. It appears to be displaying the results of an analysis using ETABS software on a structural model. The numbers show the distribution and values of resultant moment M22 (in kN-m/m) on a plan view of Story 30 at elevation Z=5.9m under the load combinations of ultimate dead, dead and live loads.
This document contains a table listing 6 reports with details on the timeline for each report including number of days from entry to design, design to QA, and QA to deployment. It also includes a bar chart showing the number of days from entry to design for each of the 6 reports, ranging from 3 to 31 days.
The document describes how to calculate full time equivalents (FTEs) needed for staffing based on roster patterns. It explains that the number of shifts required per year is divided by the number of available work days per staff member per year to determine the number of FTEs needed. For a sample 32-bed unit requiring 1,094 shifts per year, the calculation determines 4.86 FTE care coordinators are required when accounting for annual and sick leave. The document also provides an example of comparing the FTEs of individual staff on a roster to the total FTEs required.
The document discusses staff scheduling problems and solutions. It describes different types of staff scheduling problems including shift scheduling, days-on scheduling, and tour scheduling. It also discusses modeling approaches, constraints, objectives, and solution techniques for staff scheduling problems including integer linear programming and heuristics. Finally, it provides an example of a staff scheduling problem at the USPS and its formulation in Lingo.
Optimise-GB provides you with an Excel template for you to forecast and manage your cash flow effectively. All you need to do is enter the income and costs for each day as a forecast and then over type them with the actual numbers as they materialise. This will then update your cash flow for you to manage your finance. Many thanks Simon Misiewicz
This document contains information about a fuzzy logic system to evaluate candidates in a Miss Universe competition. It includes:
1. Details of the fuzzy logic system, including linguistic variables for beauty, aptitude, and outfit quality, along with their membership functions and values.
2. A table showing the 343 rules combining memberships across the 3 linguistic variables to determine overall quality ratings of "biasa", "bagus", or "luar biasa".
3. The document appears to be part of a larger report on applying fuzzy logic to model and evaluate candidates in a beauty pageant.
The document appears to contain numerical data across various categories including numbers, money amounts, dates, times, and simple mathematical equations. It is difficult to discern an overall purpose or meaning since the document lacks context and contains random assortments of numbers.
This document contains tables showing average monthly precipitation data from two weather stations in the Huaura river basin in Peru between 1967-2010. The first table displays data from the Alcantarilla station, showing monthly precipitation averages ranging from 0.10mm to 5.53mm per year. The second table shows data from the Andahuasi station, with monthly averages ranging from 0mm to 58.20mm and higher overall annual averages than the first station. Both tables lack some monthly data points.
The document contains a list of dates spanning from 21-8-2017 to 26-9-2017. Within this period there are multiple construction tasks listed along with their start and end dates. The tasks include activities like bricklaying, wall construction, onekin panel installation, cleaning and measurement works. Floor 13 and 14 construction lasted 75 and 70 days respectively during this time frame.
The document discusses different types of metadata visualization including visual metadata, textual metadata, and combinations of visual and textual metadata. It notes that visual metadata representation should provide sufficient detail while avoiding deception, and that textual metadata used to identify entities should include the most important information elements in a sensible order.
The document appears to be data with 50 rows and 15 columns of numeric values, possibly representing test or survey results. Each row seems to contain scores or responses for an individual across various topics or questions. The document provides raw data but no additional context on what the values represent or what they are measuring.
This document discusses the ratings growth and success of MundoFox Phoenix television station. It shows that from April 2014 to January 2015, MundoFox Phoenix experienced an average 149% increase in ratings among persons aged 18-49 from 7-8PM, making it the fastest growing station in Phoenix. This growth is attributed to the station's amazing and engaging content like original dramas and series, its integration of local content, and being a media partner through local activations and custom on-air content.
En esta sesión se hará un breve repaso histórico a los desarrollos en el campo de la inteligencia artificial, para después poder pasar a discutir el estado actual del campo, los nuevos desarrollos tanto en el entorno académico como el empresarial, y las líneas de investigación abiertas más interesantes.Repasaremos los papers más interesantes publicados este año en los campos de imagen artificial, procesado de texto y audio y aprendizaje por refuerzo, hablaremos del paso de las redes neuronales convolucionales a capsNets, y de como se están empleando estos nuevos desarrollos en clientes y empresas específicas.
The document demonstrates that two polynomials P(w,x,y,z) and Q(w,x,y,z) are equivalent. It simplifies P(w,x,y,z) using laws of algebra to get P(w,x,y,z) = x + z' + y, which is equal to Q(w,x,y,z). Therefore, P and Q are equivalent polynomials. It provides a truth table to further support their equivalence.
The document determines if two polynomials P(w,x,y,z) and Q(w,x,y,z) are equivalent. It simplifies P(w,x,y,z) using laws of algebra and determines that P(w,x,y,z) equals Q(w,x,y,z), so the two polynomials are equivalent. A truth table is also provided to verify the equivalence.
This document appears to contain the results of a written test taken by 46 participants. It lists each participant's number, their scores on individual test questions ranging from 0-1, their total scores, and their corresponding percentile ranks. The questions tested various cognitive areas, and total scores ranged from 10 to 18 out of a possible 20 points.
This document appears to contain data from a test or study with 50 participants. It includes each participant's identification number, their scores on different sections of the test, total test scores, and rankings. The data is presented in a table format with columns for identification numbers, test section scores, total scores, and rankings.
This document appears to contain data from a test or study consisting of multiple entries organized in columns. Each entry includes a identification number, values of 1s and 0s for different variables or questions, test and re-test scores, and other numerical values that seem to represent performance metrics. There are over 50 entries listed in the document with varying results, suggesting this data comes from testing of multiple individuals or subjects.
The document contains a series of numbers organized in a table with increasing decimals. It progresses from single digit numbers to numbers with up to 6 decimal places organized in rows and columns.
This document contains a table with statistical data showing the standard normal distribution. The table lists z-scores ranging from -3.9 to 2.7 across the top and the corresponding probability values for each z-score listed down the left side. The probability values indicate the percentage of the distribution that falls below that z-score.
It is necessary for interactive digital signages to have attraction affordances. In this study, we develop a fluffy display and propose a method to detect human touch input. In the proposed method, we apply the Lucas-Kanade optical flow method to detect a touch, and a novel clustering method to recognize multiple touches. Based on the experimental results, we discuss ways to interact with the proposed screen.
This ppt describes one of the interesting algorithms to count the number of bits set in an unsigned integer.
x = (x & 0x55555555) + ((x>>1)&0x55555555));
x = (x&0x33333333) + ((x>>2)&0x33333333);
...
....
Continuous assessing of the Reviewed Event Bulletin with waveform cross corr...ivanokitov
International Data Centre of the CTBTO has a product of interactive analysis - Reviewed Event Bulletin. Cross correlation is used to improve completeness and consistency of the REB.
Similar to Advanced Roster Calculator sanitised (20)