The advancement of machine learning (ML) and deep learning (DL) techniques has significantly improved crop yield prediction, making it more accurate and reliable. In this review, the implementation of ML and DL algorithms for crop yield prediction is thoroughly investigated, focusing on their crucial role in enhancing crop productivity. Along with ML and DL algorithms examine, the review analyses the use of remote sensing technologies, such as satellite and drone data, in providing high-resolution inputs essential for accurate yield predictions. The study identifies the state of art algorithms, most used features, data sources and evaluation metrics, providing a comparison of ML and DL. The findings indicate that DL models are more effective with large datasets, while ML models remain robust for smaller datasets. The future directions are proposed to develop the generalised models for different crops and regions. The review aims to assist researchers by summarising state of art techniques and identifying the present.
![TELKOMNIKA Telecommunication Computing Electronics and Control
Vol. 23, No. 2, April 2025, pp. 402~415
ISSN: 1693-6930, DOI: 10.12928/TELKOMNIKA.v23i2.26621 402
Journal homepage: http://telkomnika.uad.ac.id
Advanced crop yield prediction using machine learning and
deep learning: a comprehensive review
Ayush Anand, Kavita Jhajharia
Department of Information Technology, Faculty of Engineering, Manipal University Jaipur, Rajasthan, India
Article Info ABSTRACT
Article history:
Received Aug 28, 2024
Revised Dec 28, 2024
Accepted Jan 22, 2025
The advancement of machine learning (ML) and deep learning (DL)
techniques has significantly improved crop yield prediction, making it more
accurate and reliable. In this review, the implementation of ML and DL
algorithms for crop yield prediction is thoroughly investigated, focusing on
their crucial role in enhancing crop productivity. Along with ML and DL
algorithms examine, the review analyses the use of remote sensing
technologies, such as satellite and drone data, in providing high-resolution
inputs essential for accurate yield predictions. The study identifies the state
of art algorithms, most used features, data sources and evaluation metrics,
providing a comparison of ML and DL. The findings indicate that DL
models are more effective with large datasets, while ML models remain
robust for smaller datasets. The future directions are proposed to develop the
generalised models for different crops and regions. The review aims to assist
researchers by summarising state of art techniques and identifying the
present.
Keywords:
Crop yield prediction
Deep learning
Machine learning
Remote sensing
Systematic literature review
Vegetation indices
This is an open access article under the CC BY-SA license.
Corresponding Author:
Kavita Jhajharia
Department of Information Technology, Faculty of Engineering, Manipal University Jaipur
Rajasthan 303007, India
Email: Kavita.jhajharia@jaipur.manipal.edu
1. INTRODUCTION
The field of computer science is constantly advancing and ever-evolving, driven by the pursuit of
even more sophisticated solutions to complex problems. Machine learning (ML) has emerged as a powerful
paradigm within this domain, enabling computers to learn and adapt without explicit programming [1]. ML
encompasses a diverse set of techniques, each with its unique strengths and applications [2]. Some common
approaches include supervised learning, which involves training algorithms on labelled data to perform tasks
like classification and regression. Unsupervised learning, on the other hand, focuses on uncovering hidden
structures within unlabelled data, allowing for tasks like data clustering and dimensionality reduction.
Additionally, reinforcement learning enables systems to learn through trial and error, interacting with an
environment.
ML is also making significant contribution in the agriculture industry, particularly in the area of
crop yield prediction [3]. ML can help farmers and policymakers mitigate food insecurities. It is based on the
concept of statistics and ML in which crop yield is predicted using historical data associated with the crops
like climate, soil, and region. Modern tools such as satellites, drones and sensors are also used to obtain data
and monitor crops. One of the key drivers of this progress is the integration of remote sensing technology [4].
Satellites and drones equipped with various sensors can gather data on factors like soil moisture, vegetation
health, and weather patterns from a distance [5]. These models then identify intricate relationships between
these diverse factors and historical crop yields, allowing for accurate predictions.](https://image.slidesharecdn.com/13id26621-250625064733-a7f007c5/75/Advanced-crop-yield-prediction-using-machine-learning-and-deep-learning-a-comprehensive-review-1-2048.jpg)
![TELKOMNIKA Telecommun Comput El Control
Advanced crop yield prediction using machine learning and deep learning: … (Ayush Anand)
403
With surge in demand of food with increasing population, ML in agriculture has propelled to the
forefront of research aimed at advancing the sector. However, navigating the complexities of choosing
suitable datasets, algorithms, and methodologies can be challenging for researchers as these vary greatly
depending on the area of study and type of crop. This review paper addresses questions such as the most used
features, data sources, types of evaluation metrics, the algorithms and models used and the type of remote
sensing techniques used in recent studies. Our review addresses these gaps by comparing and summarizing
the most recent advances based on the literature available to answer our prepared research question that aims
to create a more generalised approach for researchers that can be used for most crops and areas. The aim is to
equip researchers with the insights needed to make informed decisions by answering the following questions:
RQ1: what are the state-of-the-art techniques used?
RQ2: which among ML and deep learning (DL) is better for making yield predictions?
RQ3: what are matrices used for model evaluation?
RQ4: what are the data sources?
RQ5: what are the most used features?
RQ6: which among ensembled models and traditional ML and DL perform better?
RQ7: what are the limitations and future directions?
Similar reviews are conducted by researchers but each vary with one another based on the type of
crop or area being studied. It is crucial to analyse the recent reviews to get insights on the recent practices in
crop yield prediction. According to the study [6] which was carried out on different crops, geographical
positions and various features. It was found that DL performs better than ML for making predictions of
which convolutional neural network (CNN) and long short-term memory (LSTM)-based models were
identified to be most effective. It was also concluded that meteorological data and Vegetation are the most
used features. Similarly, the review [7] also included papers that conducted studies performed in different
environments stated that there were no single or multiple specific models found that were able to outperform
others and also stated that including more features in the dataset doesn’t necessarily mean that they perform
better. However, it concluded that there were a few popular models that are used very often such as random
forest, neural network, linear regression, and gradient boosting tree. Further, the review concluded that out of
the neural network, the most used models were CNN, LSTM, and deep neural network (DNN).
According to the study [8] which was conducted on Palm oil prediction stated that while there was
no particular algorithm that could be concluded as the best but few most promising ML algorithms were
linear regression, random forest and neural network. Out of the DL algorithms, the popular algorithms were
DNN, CNN, and LSTM. The review also concluded that there are very few studies on Palm oil with versatile
features which makes it difficult to determine which algorithm or features are best since it’s still in the early
stages. According to another review with emphasis specifically on DL algorithms for yield prediction [9].
Crop yield with DL depends majorly on the type of data and crops. It was also noted that image was the most
demanded source of data with the majority of publications focusing on supervised learning. CNN was widely
used for making predictions which also outperformed other DL algorithms such as DNN, LSTM, Faster
R-CNN and hybrid models. The most used evaluation metric was root mean square error (RMSE) followed
by R^2, mean absolute percentage error (MAPE), mean absolute error (MAE), and mean square error (MSE).
Similarly [10] also concluded that DL provides a promising solution for crop yield estimation. However, they
are largely depend on many factors including scalability, availability of the dataset, and location of study. We
still are very far from finding a generalised approach to predict crop yield in all types of environments. Our
study aims at finding the most relevant and common features for crop yield prediction in various
environments with state of the art techniques and data sources to give a better and cleared idea to researchers
to start with crop yield prediction with the updated techniques that can be be applied over most crops and
environments. Table 1 summarizes the gaps in the considered studies for comparison without study. ‘Y’
represents YES and ‘N’ represents NO.
Table 1. Test model specifications and test conditions
Comparison points [6] [7] [8] [9] [10] Our review
State of the art techniques discussed Y Y Y Y N Y
Comparison between ML and DL N N N N N Y
Evaluation metric N Y N Y N Y
Data sources N N N Y N Y
Ensembled vs classic ML, DL models N N N N N Y
Most used features N Y Y Y Y Y
Limitations and future work Y Y Y Y N Y](https://image.slidesharecdn.com/13id26621-250625064733-a7f007c5/75/Advanced-crop-yield-prediction-using-machine-learning-and-deep-learning-a-comprehensive-review-2-2048.jpg)
![TELKOMNIKA Telecommun Comput El Control
Advanced crop yield prediction using machine learning and deep learning: … (Ayush Anand)
405
2.2. Algorithms
There are several algorithms available for making crop yield prediction, and the selection of most
suitable one depends on multiple factors, including the type of data available, the number of features in the
dataset, and the nature of the data—whether it is statistical, image-based, or a combination of both.
Additionally, understanding the linearity or non-linearity of the data plays a crucial role in determining which
algorithm will perform best. Crop yield prediction is a complex issue involving various factors such as
climate conditions, soil properties, rainfall, temperature, humidity, fertilizer usage, and crop variety. The
accuracy of predictions depends on selecting an appropriate ML or DL model that can effectively capture the
relationships between these factors.
2.2.1. Support vector machines
These algorithms find a hyperplane in the feature space that best separates the data points belonging
to different classes. Support vector machine (SVM) focus on identifying a small subset of training data points
(support vectors) that define the hyperplane's margins. This approach makes them robust to outliers and
efficient for high-dimensional data. SVM has given promising results in many studies such as this study [11]
that predicts potato yield using Sentinel 2 data in Segovia, Spain with a high r^2 value of 0.93. Another study
[12] conducted in Tamil Nadu, India, compared different feature subsets for crop yield prediction and also
showed that SVM had a high R Score of 0.92. A research work [13] which also used Landsat-8 data showed
that SVM had achieved a high accuracy of 98.72%. A recent study [14] aimed at comparing various ML
models for Soybean yield prediction using remote sensing and weather data also showed that SVM had a
decent R^2 score of 0.722. A study [15] was each on the prediction of Winter Wheat on multi-sourced data in
China and also showed that SVM was among one of the highest accurate algorithms for making predictions.
This being said SVM though not the best in all cases gives promising results because of its inability to handle
non linear and very large datasets. SVM is also computationally very expensive.
2.2.2. Random forests
It is build upon decision trees by creating an ensemble of them. Each tree is trained on a random
subset of features and data points, enhancing accuracy and reducing overfitting. Predictions from all trees are
then aggregated for a final output. A study [16] done on soybean and corn datasets 4 times a year for 3 years
as test data concluded that random forest gives good accuracy with RMSE observed 5.62 bushels per acre for
the soybean dataset for August 2017. Similarly, another research [17] that was done in the main wheat-
producing region of China using data from various sources such as remote sensing meteorological data etc
also received the second highest R^2 score among all algorithms studied. The r^2 of random forest was 0.72.
A study [18] performed on wheat crops aimed to compare random forest and three different DL algorithms
and concluded that random forest had the best R^2 score of 0.89. Another research [14] also conducted on
soybeans also concluded that random forest after tuning its hyperparameters specifically gave a promising
and the highest R^2 of 0.748 in the particular study outperforming support vector regression (SVR). Another
study [15] that was done to predict winter wheat yield concluded that random forest demonstrates the best
generalization ability among other popular algorithms used. Also, according to Sarr and Sultan [19] random
forest performed the best in predicting Maize yield with an R^2 value of 0.64. The study also had peanut,
millet and sorghum datasets in which random forest also performed well and was behind by a small margin.
2.2.3. Artificial neural networks
They consist of interconnected layers of processing units (neurons) that learn patterns from data
through an iterative process called backpropagation. Strengths include tackling complex, non-linear problems
and excelling at feature extraction. According to a study [20] potato yield in Bangladesh using remote
sensing satellites using artificial neural network (ANN) and the error of prediction was very small and less
than 10%. Which indicated that ANN is highly accurate in predicting potato yield in Bangladesh. The study
[21] which was done on Rice crops in the Indian region found that the accuracy of ANN was 97.5 in this
study with a sensitivity of 96.3. Another research [19] was performed in Senegal located in the African
continent and statistical and satellite data were used ANN outperformed all other models in predicting Peanut
and Sorghum yield with an R^2 score of 0.66 and 0.57 respectively. Similarly [22] was carried to predict
Mustard crop yield which concluded that ANN had an accuracy of 99.94%, precision of 99.94% and an
F-Score of 0.9976. Another study [12] which was executed to predict paddy crops in the state of Tamil Nadu
in India which achieved an R^2 score of 0.92 for ANN. Similarly [23] aiming to predict rice produced a high
testing R^2 score of 0.978.
2.2.4. Extreme gradient boosting
It leverages ensemble learning with gradient boosting. New models are sequentially added to correct
the errors of previous models, focusing on minimising the loss function while controlling model complexity](https://image.slidesharecdn.com/13id26621-250625064733-a7f007c5/75/Advanced-crop-yield-prediction-using-machine-learning-and-deep-learning-a-comprehensive-review-4-2048.jpg)
![ ISSN: 1693-6930
TELKOMNIKA Telecommun Comput El Control, Vol. 23, No. 2, April 2025: 402-415
406
to prevent overfitting. According to research [24] extreme gradient boosting (XGBoost) was the best-
performing algorithm for crop prediction with the highest R^2 score of 84.79, which outperformed all other
algorithms in the study. The highest R^2 score by XGBoost was 0.92 in the month of April 2022. A study
[25] aimed at predicting maize yield and Nitrogen loss from soil using data from seven locations in the US
Midwest over 5-7 years and concluded that XGBoost had 3rd
highest R^2 score among all algorithms used in
the study. However, XGBoost had the highest R-RMSE in predicting N-Loss at 98.3%. Similarly [26] aimed
at predicting crop yield using meteorological data and remote sensing data from moderate resolution imaging
spectroradiometer (MODIS) and it was concluded that XGBoost had the best accuracy in the study with an
R^2 score of 0.845. However, a research [27] aimed at predicting corn yield in USA county-wise from the
year 2000-2018 XGBoost did not perform well as it had one of the highest RMSE scores among all the
algorithms used. Similarly [28] was conducted on nine features from remote sensing satellites and ML
algorithms were applied month wise out of which XGBoost’s performance was not outstanding with very
high R^2.
2.2.5. Long short-term memory
It is a specific type of recurrent neural network (RNN), that excels at handling sequential data (time
series) by learning long-term dependencies. LSTMs utilize memory cells with gates to control information
flow, allowing the network to retain relevant information for extended periods. A study [29] was aimed at
predicting winter wheat yield used a Bayesian optimization-based LSTM model which concluded that the
proposed model performed the best compared to all other models in the study with a R^2 score of 0.82.
Another study [30] performed over the region of Punjab, India to predict wheat crops showed that RNN with
LSTM outperformed all other algorithms in the study by a considerable margin. Similarly, the study [31] was
executed over a dataset consisting of meteorological data and soil and crop data and compared different
models in the study. LSTM performed the best among all other models with a marginal difference with an
accuracy of 86% in predicting yield. Another study [32] also showed that Stacked LSTM performed the best
out of all algorithms considered for the study with weather variables and had an R^2 score of ~0.732. This
shows that LSTM can produce promising results for crop yield prediction.
2.2.6. Convolutional neural networks
CNNs are specialized ANN architectures designed for processing grid-like data, particularly images.
CNNs efficiently extract spatial features through convolutional layers with learnable filters and pooling
layers for dimensionality reduction. A research [33] aimed to make crop yield prediction using CNN-RNN
performed well outperforming all other algorithms used in the study. Similarly, another study [34] aimed at
predicting soybean yields also showed CNN performed well when combined with LSTM the CNN-LSTM
model produced the best RMSE compared to all other models in the study. Another study [35] aimed at
predicting crop yield using satellite images in the US showed that the CNN-LSTM model had an R^2 score
of 0.91. Similarly [36] authors also showed that CNN+RNN+2FFNN produced the highest correlation
coefficient 0.9183. This shows that if the right data is obtained CNN in combination with other networks can
be very accurate in predicting crop yield.
3. EVALUATION METRICS
3.1. Regression metrics
Regression is a supervised ML technique that is used to predict continuous values. It plots a best-fit
line passing through the data. Crop yield prediction is typically a regression task, where models predict
continuous values (yield in tons per hectare). No model is perfect and there is always a scope of some error.
Regression metrics help in evaluating the models. Here are the key metrics for evaluating regression models:
RMSE measures the average difference between predicted and actual yield values. Lower RMSE indicates
better model performance. MAE calculates the average absolute difference between predicted and actual
yield values. R-squared (R²) metric represents the proportion of variance in the actual yield data explained by
the model's predictions. A value closer to 1 indicates a better fit.
3.2. Classification metrics
Classification tasks are also part of supervised ML and are typically used for categorising data by
predicting its correct label. In some cases, models might predict yield categories (low, medium, high) instead
of continuous values. Here are the relevant evaluation metrics used to evaluate classification algorithms:
Accuracy metric simply measures the percentage of correctly classified yield categories. F1-score metric
considers both precision (proportion of true positives among predicted positives) and recall (proportion of
true positives identified by the model). An F1-score closer to 1 indicates better model performance,](https://image.slidesharecdn.com/13id26621-250625064733-a7f007c5/75/Advanced-crop-yield-prediction-using-machine-learning-and-deep-learning-a-comprehensive-review-5-2048.jpg)
![TELKOMNIKA Telecommun Comput El Control
Advanced crop yield prediction using machine learning and deep learning: … (Ayush Anand)
407
especially for imbalanced datasets where some yield categories might be less frequent. Among the 80 papers
considered in our review four classification metrics were used F-Score, recall, precision, accuracy a total 20
times and regression metrics were used 135 times in total which consisted of MSE, RMSE, MAE, R^2,
MAPE, relative root mean squared error (RRMSE), and R Score.
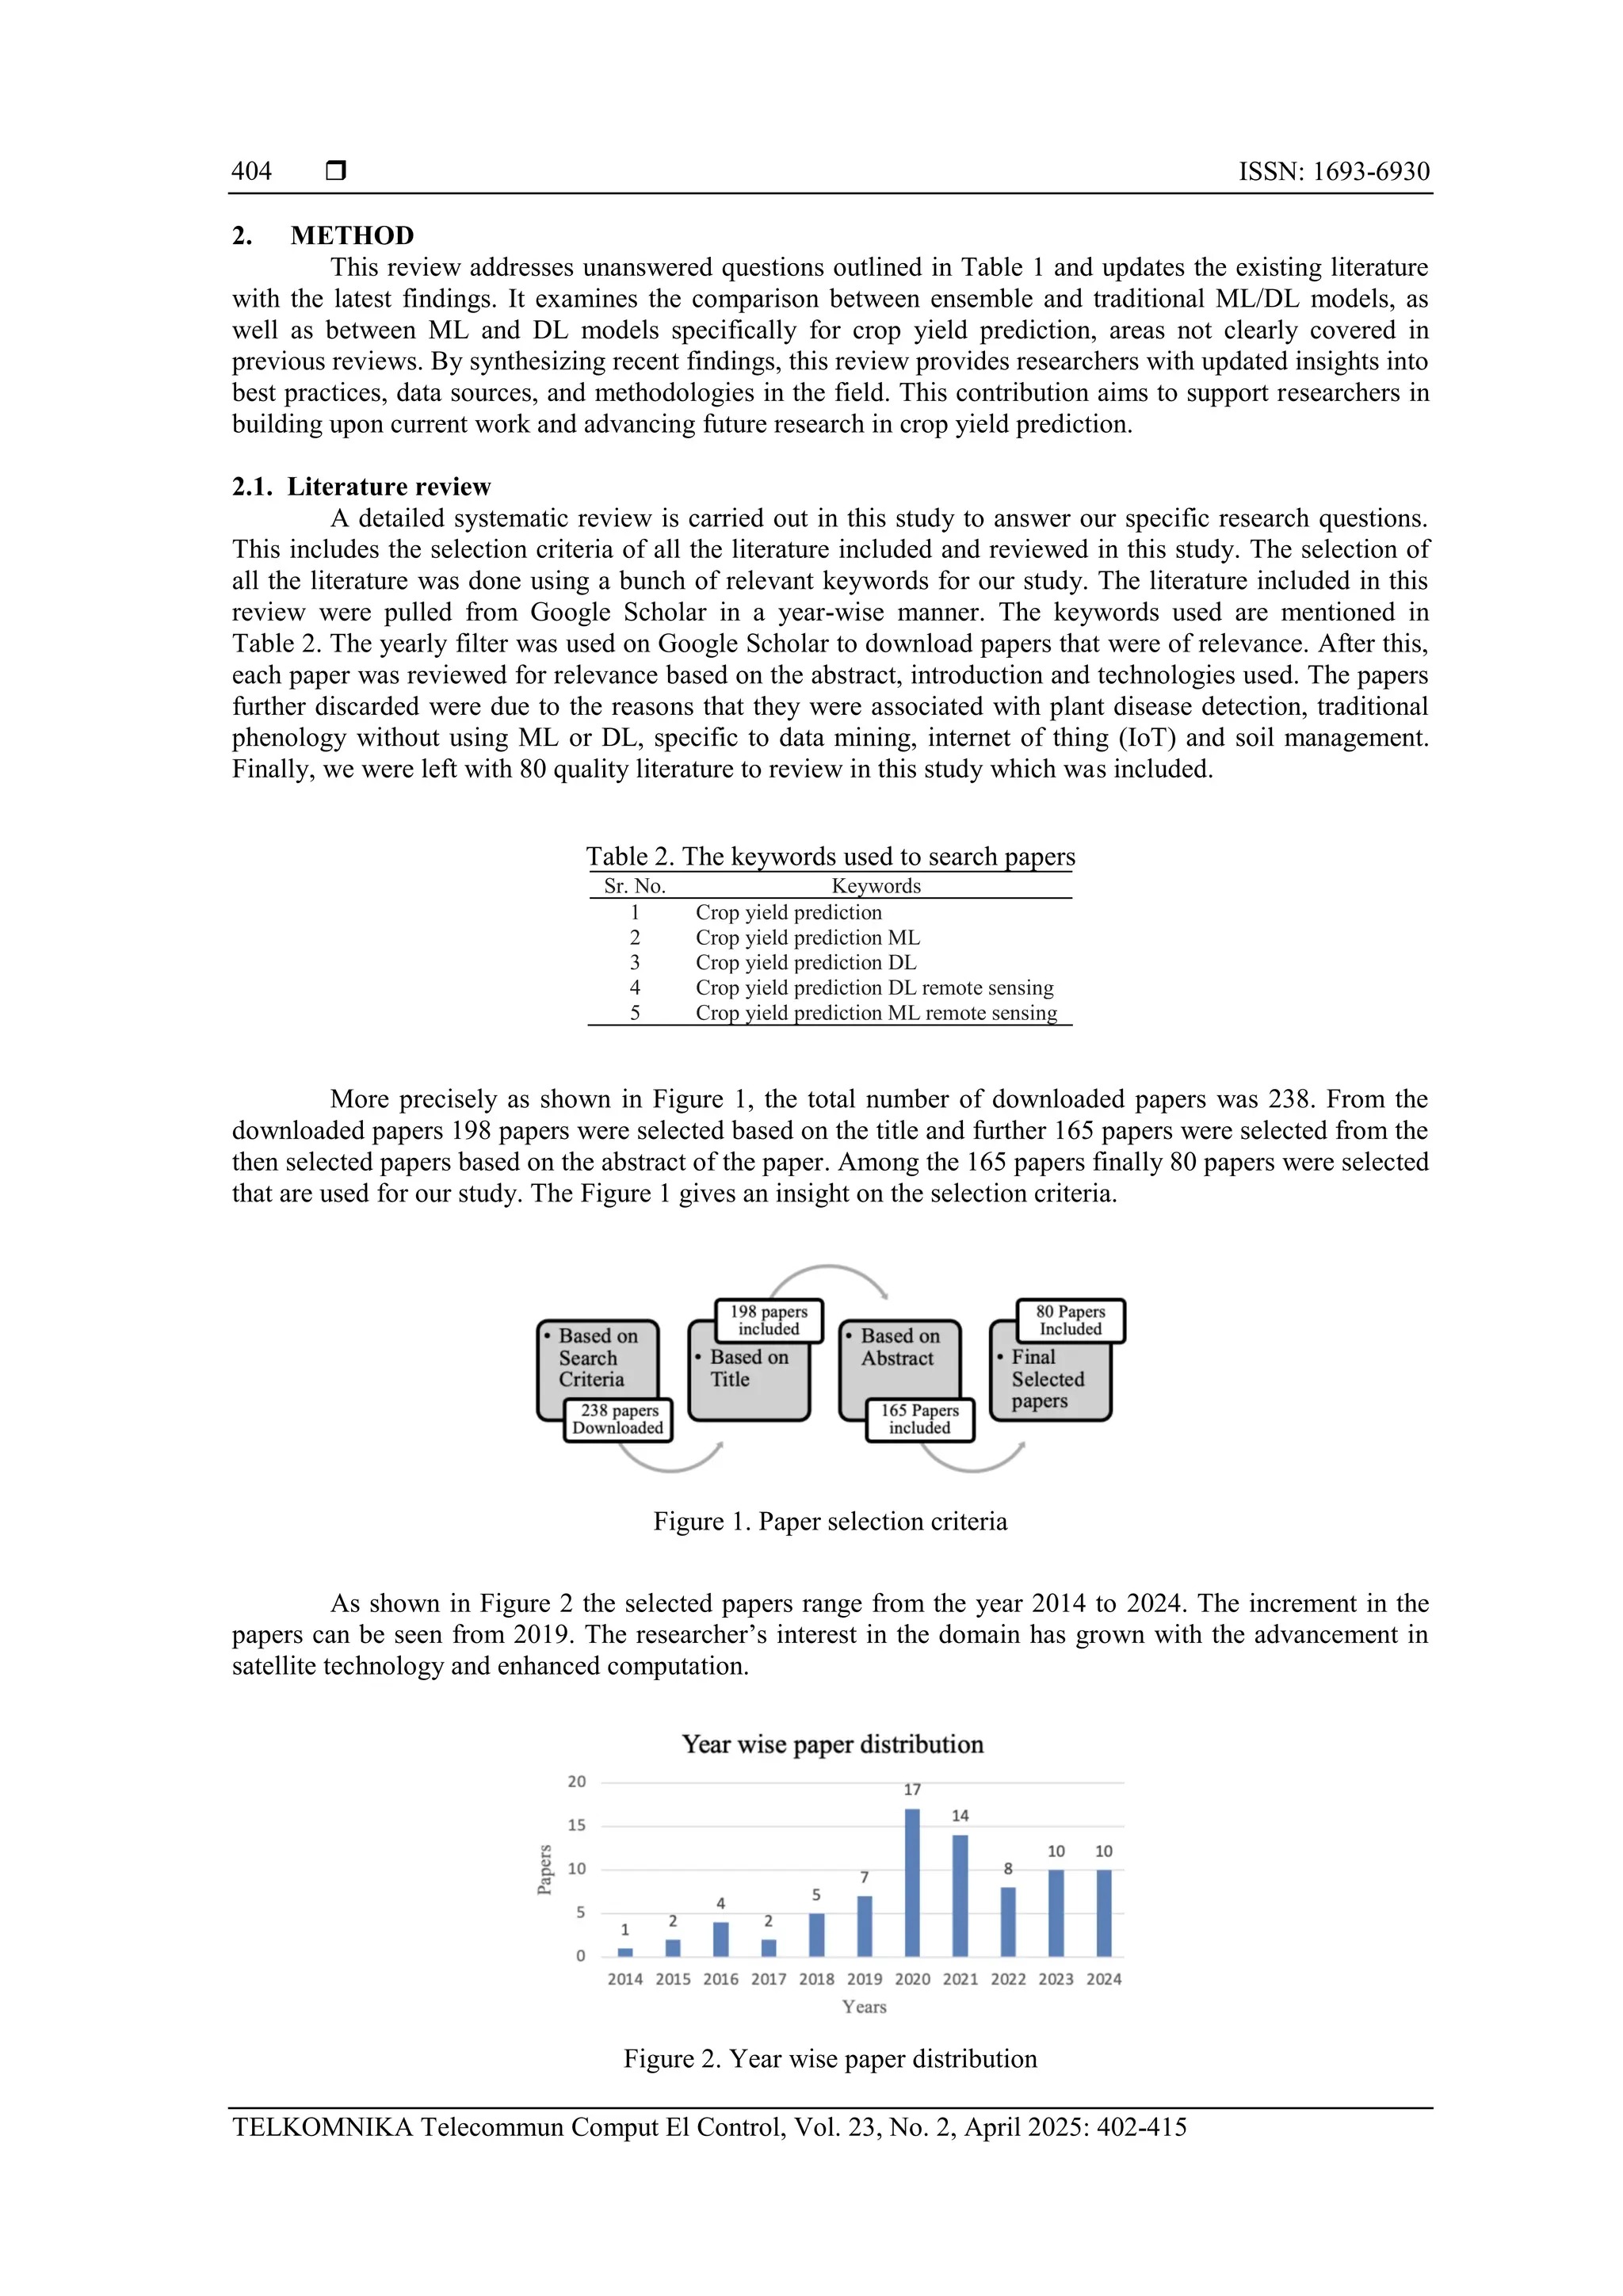
4. RESULTS AND DISCUSSION
For the present review, we have considered both conference and journal articles to ensure a
comprehensive analysis of the existing literature. To maintain the quality and relevance of the review, we
applied a rigorous inclusion and exclusion criteria, based on parameters such as relevance of studies to the
theme, and alignment with the objectives of our study. We have finalised 67 journal articles and 13 articles
from conferences i.e., 84% from journals and 16% from conferences as represented in Figure 3.
Figure 3. Journal vs conference papers
4.1. Research questions
4.1.1. RQ1: what are the state-of-the-art techniques used?
State-of-the-art techniques can be judged based on the most used techniques in recent publications
and the techniques or models that tend to perform the best in various studies to predict crop yield production.
In the study [37] concluded that random forest regressor outperformed all other supervised learning models
included in the study. Another study [38] that was done on Soyabean crop concluded that the best-performing
model was RNN in the study. A similar study [39] showed the reliability of making significant predictions.
The study [31] also compared various models and concluded that LSTM outperformed all other models in the
study. Another study [40] used an optimised LSTM approach to receive a high accuracy in prediction. The
study [41] carried in region of China on winter wheat also showed that LSTM performed the best among all
other models included in the study. The researchers [29] that used Bassein optimizer with LSTM performed
the best among all models. Considering the discussed studies and other detailed studies that we compared in
this review, we can infer that state of art algorithms used are ensembled tree models like decision tree,
random forest, XGBoost and LSTM, RNN, and CNN are also used that usually tend to perform better
compared to the classic ML models.
Figure 4 shows the number of times these algorithms were used in all the considered studies.
random forest emerged as the most frequently employed algorithm across 34 studies. Following closely
behind were SVM, ANN, LSTM, least absolute shrinkage and selection operator (LASSO), decision tree
regression, linear regression, CNN, and gradient boosting regression, with usage counts of 20, 16, 14, 14, 13,
13, 10, and 10 studies, respectively. The diversity of algorithms indicates the variety of tasks performed in
the research. The others in the below figure consisted of Bayesian Ridge, R-CNN, ACNN-BDLSTM, light
use efficiency (LUE), bayesian ridge (BR), Huberg regression, long short-term memory-Gaussian process
(LSTM-GP), wavelet convolutional neural network (W-CNN), radial basis function neural network (RBF-
NN), cat boost regression, Res-NET 2D, 3D, ABR, DCNN, multiple logistic regression, temporal
convolutional neural network (TCNN), CNN-RNN, convolutional neural network-Gaussian process (CNN-
GP), multi-view gated Fusion (MVGF), and adaptive boosting (ADA Boost) each being used a single time in
our selected papers and collective count being 19.](https://image.slidesharecdn.com/13id26621-250625064733-a7f007c5/75/Advanced-crop-yield-prediction-using-machine-learning-and-deep-learning-a-comprehensive-review-6-2048.jpg)
![ ISSN: 1693-6930
TELKOMNIKA Telecommun Comput El Control, Vol. 23, No. 2, April 2025: 402-415
408
Figure 4. Count of algorithms
4.1.2. RQ2: which among machine learning and deep learning is better for making yield predictions?
A study [42] that compared SVR, partial least squares (PLS) regression, random forest regression
(RFR) and DNN showed that DNN outperformed all other models in the study. Another study [38] done on
soybean crop compared various ML and DL models such as ADA Boost, DNN, least absolute shrinkage and
selection operator, random forest, and SVM out of which DNN outperformed all the models. The study [43]
which included DNN compared various models out of which SVR and KNN outperformed all other models.
This happened due to the small dataset used to train the model since DNN is more sensitive to the amount of
data fed into it. A similar study [41] which included LASSO, random forest, and LSTM concluded that
LSTM performed the best among all studied models in predicting winter wheat yield in China. The study
[18] that compared DL models such as DNN, CNN, LSTM, and random forest showed that DNN performed
best among the compared models. The research work [44] showed that XGBoost performed better than CNN
and LSTM due to small dataset again showing that DL models require a large dataset. Another study [30]
conducted over the region of Punjab, India on Wheat crop compared RNN and LSTM with ANN, random
forest and multivariate Linear regression. RNN and LSTM outperformed the classical ML algorithms with a
large margin. Another study [32] that also showed that stacked LSTM outperformed other ML models
included in the study such as LASSO and SVR. Another study [36] that used ensembled DL models also
showed that CNN-RNN+ 2Feed forward neural network outperformed linear regression, XGBoost, random
forest with considerable difference in testing accuracy. While it can be said that there is no definitive answer
as to which ML performs best. It can be concluded from the present literature that the performance of the
models majorly depends on the dataset that is being used and more over the size of dataset. In general when
there is large dataset available DL algorithms tend to perform better and when there is comparatively a
smaller dataset ML tend to perform better for making crop yield predictions.
4.1.3. RQ3: what are matrices used for model evaluation?
Evaluation metrics are an important aspect of any study as these serve as the parameters for
evaluating how well a model performs. The selection of evaluation metrics depends on the objective of the
study however, the few most used metrics for crop yield prediction are RMSE, R^2, and MAE. These are
used mostly in regression tasks. While RMSE is good to compare models on the same dataset this is not the
perfect parameter to compare models trained on different datasets as RMSE can vary and doesn’t have a
fixed range. For comparison of models from different studies, R^2 value is used because the value ranges
from 0 to 1, 1 being a perfect model. Studies often use more than one evaluation metric for model evaluation
to give a better idea for comparison such as [45] comparing 4 models on all three parameters to predict the
yield. Authors have similarly [18] made use of R^2 and RMSE to evaluate predictions made on wheat crops.
The Figure 5 shows the frequency of evaluation metrics used in the paper. The RMSE is the most used
evaluation metric followed by R^2 and MAE.](https://image.slidesharecdn.com/13id26621-250625064733-a7f007c5/75/Advanced-crop-yield-prediction-using-machine-learning-and-deep-learning-a-comprehensive-review-7-2048.jpg)
![TELKOMNIKA Telecommun Comput El Control
Advanced crop yield prediction using machine learning and deep learning: … (Ayush Anand)
409
Figure 5. Evaluation metrics used in papers
4.1.4. RQ4: what are the data sources?
Data sources primarily depend upon the region of study and the type of crop being studied. Crop
largely depends upon meteorological data such as rainfall, temperature, and humidity. National Oceanic and
Atmospheric Administration (NOAA) which is a part of the U.S. Department of Commerce stores a wide
range of meteorological datasets majorly from the U.S. Territories and waters. Studies such as [20], [46]
conducted over the U.S make use of this service. Similar to NOAA countries have their own datacentre to
monitor and collect data for research such as the study [47] conducted on Columbia used a dataset obtained
from the Consultation and Download of Hydrometeorological Data system of the Institute of Hydrology,
Meteorology and Environmental Study of Columbia, Ministry of Agricultural and Rural Development.
Another study [48] conducted over Tamil Nadu, India used the Department of Economics and Statistics,
Government of Tamil Nadu. Similar studies [49], [50] also used Indian government sources to obtain data.
The yield data of crop particularly is obtained from the United States Department of Agriculture such as in
the studies [34], [51]-[56].
Remote sensing data is actively used to monitor crops. Among our selected studies satellite data was
the major source of remote sensing data with some studies also using unmanned aerial vehicle (UAV). For
the satellites, MODIS was used majorly for the calculation of Vegetation Indices in 58% of the studies such
as [14], [19], [26], [35], [44], [51], [57]-[61]. Followed by Landsat 8 satellite used in the studies
[13], [57], [62], [63] and Landsat 7 used in the studies [35], [62]. This was followed by the use of other
satellites such as Sentinel 2 [23], [35], [52], [57], [62], Sentinel 2B and Sentinel 2B [64], World View-3 and
UAV [42], Landsat 2, Landsat 2 (L2A) [65], and Sentinel 2L1C [11]. The Figure 6 represents the satellite
sources used in the studies.
Figure 6. Type of satellites used in the study
4.1.5. RQ5: what are the most used features?
Meteorological data is crucial for making accurate predictions. The type of meteorological feature
depends on the crop being studied. However, there are a certain group of most commonly used features we
have encountered in our selected papers such as temperature. This was the most used feature among all the
selected studies such as [14], [19], [41], [47], [52], [59], [65]-[75] followed by precipitation in the studies
[15], [17], [18], [21], [33], [52], [54], [59], [72], [74]-[76], rainfall [12], [14], [48], [67], [69], [70], [77]-[79],
vapour pressure [19], [80] and other meteorological data such as humidity, wind speed, humidity. Soil](https://image.slidesharecdn.com/13id26621-250625064733-a7f007c5/75/Advanced-crop-yield-prediction-using-machine-learning-and-deep-learning-a-comprehensive-review-8-2048.jpg)
![ ISSN: 1693-6930
TELKOMNIKA Telecommun Comput El Control, Vol. 23, No. 2, April 2025: 402-415
410
characteristics such as Nitrogen, Phosphorus and potassium were most used soil features [22], [33], [41],
[65], [68], [69], [81]-[83] followed by Soil Ph [22], [41], [50], [54], [76], [82], [84]. Among the vegetation
indices obtained from satellite images normalized difference vegetation index (NDVI) [11], [13], [14], [19],
[23], [26], [29], [57], [58], [65], [68], [85]-[87] was the most used vegetation index followed by Enhanced
Vegetation Index (EVI) [13]-[15], [18], [57], [58], [60], [78], [88], and LAI [23], [29], [56], [62], [75].
Figure 7 shows the total count of the most used features used in the selected papers.
Figure 7. Count of features
4.1.6. RQ6: which among ensembled models and traditional machine learning and deep learning
perform better?
Ensembled models are a way of integrating more than one classical model to get advantages of both
and increase the accuracy of the prediction. The paper [52] demonstrates the effectiveness of ensemble models
that combine CNN and DNN in predicting corn yields. The ensemble models outperformed individual ML
models, suggesting that the combination of different types of neural networks can improve prediction
accuracy. Similarly, the research [27] also advocates for ensemble models in corn yield forecasting. The
optimized weighted ensemble and the average ensemble were found to be the most precise models. Another
study [87] used ensemble tree methods, specifically boosted regression trees (BRT) and random forests, for
early prediction of winter wheat yield. The results suggest that ensemble tree methods can effectively handle
complex interactions between variables and improve prediction accuracy. The study [89] focused on
predicting sugarcane yield in Brazil using NDVI time series and neural networks ensemble and also suggested
that ensemble methods can be effective in different geographical locations and for different crops.
From these studies, it seems that ensemble methods, whether they are based on classical ML
algorithms or DL algorithms, show superior performance in crop yield prediction. The ensemble methods can
effectively combine the strengths of multiple models to improve prediction accuracy and precision. However,
it’s important to note that the choice between ensemble and classical ML or DL algorithms may depend on
the specific problem and data at hand. While ensemble methods have shown promising results in these
studies, classical ML or DL algorithms might perform better in other scenarios.
4.1.7. RQ7: what are the limitations and future directions?
With advancing technology of satellites, it has become easier to monitor crops and obtain data for
making predictions. However, a large model that heavily relies on satellite data is still very difficult to run
because of the very high-resolution satellite images that are typically a couple of gigabytes, and they have to
be collected for a certain period to make a historic dataset for predictions making it costly to run. This has
however been made a little easier by Google Earth Engine which uses cloud computing for running such
heavy computations. But with large study areas, this is still a problem as platforms like Earth Engine have
their limitations such as time out limit, and limited size of particular satellite Images for computation at a
time. For very large study areas, it’s necessary to buy high cloud storage on platforms like Earth Engine for
making calculations or work on very high-end machines which are typically only in Labs. For researchers
looking to use these Satellite images directly, they have to be downloaded to perform operations using
various frameworks such as Geospatial Libraries and OpenCV. Historic images of an area for a couple of
years can easily go over a few hundred gigabytes and more. This requires very high storage capacity and very
advanced and capable GPUs for image feature extractions. The cost reduction can be looked as a joint effort](https://image.slidesharecdn.com/13id26621-250625064733-a7f007c5/75/Advanced-crop-yield-prediction-using-machine-learning-and-deep-learning-a-comprehensive-review-9-2048.jpg)
![TELKOMNIKA Telecommun Comput El Control
Advanced crop yield prediction using machine learning and deep learning: … (Ayush Anand)
411
of researchers in the field that can set up labs dedicated to crop predictions and other related work to crops, to
grow the community and help researchers collaborate which would in turn reduce the cost.
In developed countries like The United States and Canada the Agriculture sector is very organised
that the government is able to release a high-resolution crop data layer. The crop can be identified through
CDL without any other preprocessing. This is very useful as it allows researchers to eliminate the
unnecessary fields or roads and buildings being considered in the dataset. However, there are only a few
countries that have been able to do this. In developing countries crop data layers are still unattainable because
of mixed agricultural practices and lack of monitoring by the government which makes it difficult for
researchers to track down the exact area of the cropland that is to be studied. This makes crop data layers a
very crucial part of studies related to crops as they are responsible for the precision of the study as satellite
images being used directly cannot provide as a satellite image contains information of not only the cropland
but also of surrounding uncropped area that is not needed for study. While it is difficult to make crop data
layers in developing countries, efforts can be made by starting to work with small areas that cover a
particular state, district or county and further be expanded to other areas of the country. This, however, would
require a lot of groundwork as well to organise the agricultural practices so tracking crop fields can be made
easier for a particular crop. Multi-source data can also be experimented including different soil features,
water, and climate for each crop so the researcher can make informed decisions as to what exact features
impact the crop that is being studied. The more relevant VIs such as perpendicular vegetation index (PVI),
soil-adjusted vegetation index (SAVI), atmospherically resistant vegetation index (ARVI), solar-induced
fluorescence (SIF), and difference vegetation index (DVI) can also be used to further for making accurate
studies.
Comparing this study with similar reviews, according to a review [7], the most frequently used
features include temperature, soil type, and rainfall, with neural networks and linear regression being the
most common algorithms, followed by random forest and SVM. Common evaluation metrics were RMSE
and RR^2. Another study [6] noted LSTM and CNN-based approaches as prevalent DL techniques, primarily
using the MODIS satellite, followed by Landsat 8 and Landsat 7, with VIs, meteorological data, and yield
information as key features. Additionally, [8] identified VIs and satellite data, alongside historical yield and
climate data, as frequently used inputs, with random forest and ANN as top algorithms, followed by CNN,
using RMSE, Accuracy, and R2R^2R2 for evaluation. Similarly, [9] observed images, precipitation, and
actual yield as major features, with CNN, LSTM, ANN, and DNN as common algorithms, using RMSE as
the primary evaluation metric. Another review [10] showed CNN and RNN as the most-used algorithms. In
comparison, our study highlights temperature and precipitation as primary features, MODIS and Landsat 8 as
primary satellites, with RMSE and R^2 as main evaluation metrics, and random forest and SVM as prevalent
models, with CNN and LSTM as state-of-the-art techniques. Table 3 represents the comparison among
randomly selected papers.
Table 3. Comparison with similar work
Ref Paper focus Findings
[46] Improving crop yield prediction in
Morocco.
ML models outperformed statistical models inmaking predictions. ML
models achieved R^2 ranging from 0.76 to 0.84.
[52] County level corn yield prediction using
CNN-DNN in US corn belt.
The model made 2019 prediction with RMSE of 866 kg/ha.
[76] Improving crop yield prediction in China. Proposed a model that predicts pre season and in season prediction for 5
crops.
[63] Silage maize yield prediction using time
series dataset from NDVI.
BRT had highest R value of 0.87.
[28] Proposed a framework for wheat yield
prediction.
LASSO received highest performance with R^2 of 0.93.
The findings of the research questions in this study highlight that, leading crop yield prediction
models include ensemble techniques like random forest and XGBoost, alongside DL approaches such as
LSTM and CNN. Each model type offers distinct strengths depending on dataset size and complexity.
Ensemble and neural network models work especially well with larger datasets due to their ability to capture
complex patterns, while traditional ML models can perform effectively with smaller datasets. Metrics like
RMSE, R², and MAE are commonly used to evaluate model accuracy and reliability. Data sources span
meteorological information from organisations like NOAA, where temperature is a frequently used feature,
to satellite-based remote sensing data with vegetation indices like NDVI and EVI, which are essential for
monitoring crop health. However, challenges persist, such as the high computational cost of processing
satellite imagery and limited crop data availability in developing regions. Future research should focus on
improving model efficiency, creating crop-specific data resources in rural areas, and fostering collaborations](https://image.slidesharecdn.com/13id26621-250625064733-a7f007c5/75/Advanced-crop-yield-prediction-using-machine-learning-and-deep-learning-a-comprehensive-review-10-2048.jpg)
![ ISSN: 1693-6930
TELKOMNIKA Telecommun Comput El Control, Vol. 23, No. 2, April 2025: 402-415
412
to support global crop prediction efforts. This summary provides researchers with insights into the latest
methods and practices, helping them identify best practices for enhancing prediction accuracy and building
on existing advancements.
5. CONCLUSION
This study concludes that data sources are often specific to the area being studied, with
meteorological data frequently obtained from organizations like NOAA and soil data from Food and
Agriculture Organization (FAO). Satellites such as MODIS are widely used for calculating vegetation indices
like NDVI and EVI, while newer, high-resolution satellites like Landsat-8 provide improved precision.
Efforts to develop crop data layers in various countries could make satellite data more accurate, especially in
rural areas. Combining these vegetation indices with meteorological data, such as temperature, rainfall,
humidity, and soil characteristics, creates robust datasets for crop yield prediction. Tree-based models like
random forest excel with smaller datasets due to their ability to combine weak and strong learners, while
SVM are effective in high-dimensional spaces and for modelling non-linear boundaries. For larger datasets,
DL models like ANN and CNN-LSTM outperform traditional ML models by capturing complex patterns in
data. However, challenges remain, including the high cost of processing high-resolution satellite imagery and
limited access to crop data in developing regions. Future advancements in satellite and cloud computing
technology could help overcome these challenges, while collaborative labs and localized studies may
improve data accessibility. Expanding datasets to include advanced vegetation indices and multi-source data
could further enhance prediction accuracy and support the development of scalable, generalized models for
diverse crops and regions.
REFERENCES
[1] M. I. Jordan and T. M. Mitchell, “Machine learning: Trends, perspectives, and prospects,” Science, vol. 349, no. 6245, pp. 255–
260, Jul. 2015, doi: 10.1126/science.aaa8415.
[2] Y. LeCun, Y. Bengio, and G. Hinton, “Deep learning,” Nature, vol. 521, no. 7553, pp. 436–444, May 2015, doi:
10.1038/nature14539.
[3] A. Kamilaris and F. X. Prenafeta-Boldú, “Deep learning in agriculture: A survey,” Computers and Electronics in Agriculture, vol.
147, pp. 70–90, Apr. 2018, doi: 10.1016/j.compag.2018.02.016.
[4] Y. Xie, Z. Sha, and M. Yu, “Remote sensing imagery in vegetation mapping: a review,” Journal of Plant Ecology, vol. 1, no. 1,
pp. 9–23, 2008, doi: 10.1093/jpe/rtm005.
[5] P. S. Thenkabail, R. B. Smith, and E. D. Pauw, “Hyperspectral Vegetation Indices and Their Relationships with Agricultural Crop
Characteristics,” Remote Sensing of Environment, vol. 71, no. 2, pp. 158–182, Feb. 2000, doi: 10.1016/S0034-4257(99)00067-X.
[6] P. Muruganantham, S. Wibowo, S. Grandhi, N. H. Samrat, and N. Islam, “A Systematic Literature Review on Crop Yield
Prediction with Deep Learning and Remote Sensing,” Remote Sensing, vol. 14, no. 9, Jan. 2022, doi: 10.3390/rs14091990.
[7] T. van Klompenburg, A. Kassahun, and C. Catal, “Crop yield prediction using machine learning: A systematic literature review,”
Computers and Electronics in Agriculture, vol. 177, Pp. 1-18, Oct. 2020, doi: 10.1016/j.compag.2020.105709.
[8] M. Rashid, B. S. Bari, Y. Yusup, M. A. Kamaruddin, and N. Khan, “A Comprehensive Review of Crop Yield Prediction Using
Machine Learning Approaches With Special Emphasis on Palm Oil Yield Prediction,” IEEE Access, vol. 9, pp. 63406–63439,
2021, doi: 10.1109/ACCESS.2021.3075159.
[9] A. Oikonomidis, C. Catal, and A. Kassahun, “Deep learning for crop yield prediction: a systematic literature review,” New
Zealand Journal of Crop and Horticultural Science, vol. 51, no. 1, pp. 1–26, Jan. 2023, doi: 10.1080/01140671.2022.2032213.
[10] A. Joshi, B. Pradhan, S. Gite, and S. Chakraborty, “Remote-Sensing Data and Deep-Learning Techniques in Crop Mapping and
Yield Prediction: A Systematic Review,” Remote Sensing, vol. 15, no. 8, Jan. 2023, doi: 10.3390/rs15082014.
[11] Gómez, Salvador, Sanz, and Casanova, “Potato Yield Prediction Using Machine Learning Techniques and Sentinel 2 Data,”
Remote Sensing, vol. 11, no. 15, pp. 1-17, Jul. 2019, doi: 10.3390/rs11151745.
[12] M. G. P. S. and B. R., “Performance Evaluation of Best Feature Subsets for Crop Yield Prediction Using Machine Learning
Algorithms,” Applied Artificial Intelligence, vol. 33, no. 7, pp. 621–642, Jun. 2019, doi: 10.1080/08839514.2019.1592343.
[13] Kavita and P. Mathur, “Satellite-based Crop Yield Prediction using Machine Learning Algorithm,” in 2021 Asian Conference on
Innovation in Technology (ASIANCON), PUNE, India: IEEE, Aug. 2021, pp. 1–5. doi:
10.1109/ASIANCON51346.2021.9544562.
[14] J. D. Mohite, S. A. Sawant, A. Pandit, R. Agrawal, and S. Pappula, “Soybean Crop Yield Prediction By Integration Of Remote
Sensing And Weather Observations,” International Archives of the Photogrammetry, Remote Sensing and Spatial Information
Sciences-ISPRS Archives, vol. XLVIII-M-1–2023, pp. 197–202, Apr. 2023, doi: 10.5194/isprs-archives-XLVIII-M-1-2023-197-
2023.
[15] J. Han et al., “Prediction of Winter Wheat Yield Based on Multi-Source Data and Machine Learning in China,” Remote Sensing,
vol. 12, no. 2, pp. 1-22, Jan. 2020, doi: 10.3390/rs12020236.
[16] S. Khaki, H. Pham, and L. Wang, “YieldNet: A Convolutional Neural Network for Simultaneous Corn and Soybean Yield
Prediction Based on Remote Sensing Data,” Bioinformatics, preprint, Dec. 2020. doi: 10.1101/2020.12.05.413203.
[17] X. Wang, J. Huang, Q. Feng, and D. Yin, “Winter Wheat Yield Prediction at County Level and Uncertainty Analysis in Main
Wheat-Producing Regions of China with Deep Learning Approaches,” Remote Sensing, vol. 12, no. 11, pp. 1-20, 2020, doi:
10.3390/rs12111744.
[18] J. Cao et al., “Wheat yield predictions at a county and field scale with deep learning, machine learning, and google earth engine,”
European Journal of Agronomy, vol. 123, pp. 1-12, Feb. 2021, doi: 10.1016/j.eja.2020.126204.](https://image.slidesharecdn.com/13id26621-250625064733-a7f007c5/75/Advanced-crop-yield-prediction-using-machine-learning-and-deep-learning-a-comprehensive-review-11-2048.jpg)
![TELKOMNIKA Telecommun Comput El Control
Advanced crop yield prediction using machine learning and deep learning: … (Ayush Anand)
413
[19] A. B. Sarr and B. Sultan, “Predicting crop yields in Senegal using machine learning methods,” International Journal of
Climatology, vol. 43, no. 4, pp. 1817–1838, Mar. 2023, doi: 10.1002/joc.7947.
[20] K. Akhand, M. Nizamuddin, L. Roytman, and F. Kogan, “Using remote sensing satellite data and artificial neural network for
prediction of potato yield in Bangladesh,” presented at the SPIE Optical Engineering + Applications, W. Gao and N.-B. Chang,
Eds., San Diego, California, United States, Sep. 2016, pp. 1-15. doi: 10.1117/12.2237214.
[21] N. Gandhi, O. Petkar, and L. J. Armstrong, “Rice crop yield prediction using artificial neural networks,” in 2016 IEEE
Technological Innovations in ICT for Agriculture and Rural Development (TIAR), Chennai, India: IEEE, Jul. 2016, pp. 105–110,
doi: 10.1109/TIAR.2016.7801222.
[22] V. Pandith, H. Kour, S. Singh, J. Manhas, and V. Sharma, “Performance Evaluation of Machine Learning Techniques for Mustard
Crop Yield Prediction from Soil Analysis,” Journal of Scientific Research, vol. 64, no. 02, pp. 394–398, 2020, doi:
10.37398/JSR.2020.640254.
[23] Md. M. Islam, S. Matsushita, R. Noguchi, and T. Ahamed, “Development of remote sensing-based yield prediction models at the
maturity stage of boro rice using parametric and nonparametric approaches,” Remote Sensing Applications: Society and
Environment, vol. 22, pp. 1-18, Apr. 2021, doi: 10.1016/j.rsase.2021.100494.
[24] S. Hazra, S. Karforma, A. Bandyopadhyay, S. Chakraborty, and D. Chakraborty, “Machine Learning Techniques For Crop Yield
Prediction,” Journal of Survey in Fisheries Sciences, vol. 10, no. 1S, pp. 7096-7102, 2023, doi: 10.53555/sfs.v10i1S.2319.
[25] M. Shahhosseini, R. A. Martinez-Feria, G. Hu, and S. V. Archontoulis, “Maize yield and nitrate loss prediction with machine
learning algorithms,” Environmental Research Letters, vol. 14, no. 12, pp. 1-12, Dec. 2019, doi: 10.1088/1748-9326/ab5268.
[26] A. Shah, R. Agarwal, and B. Baranidharan, “Crop Yield Prediction Using Remote Sensing and Meteorological Data,” in 2021
International Conference on Artificial Intelligence and Smart Systems (ICAIS), 2021, pp. 952–960, doi:
10.1109/ICAIS50930.2021.9395849.
[27] M. Shahhosseini, G. Hu, and S. V. Archontoulis, “Forecasting Corn Yield With Machine Learning Ensembles,” Frontiers in Plant
Science, vol. 11, pp. 1-16, Jul. 2020, doi: 10.3389/fpls.2020.01120.
[28] U. Shafi et al., “Tackling Food Insecurity Using Remote Sensing and Machine Learning-Based Crop Yield Prediction,” IEEE
Access, vol. 11, pp. 108640–108657, 2023, doi: 10.1109/ACCESS.2023.3321020.
[29] Y. Di, M. Gao, F. Feng, Q. Li, and H. Zhang, “A New Framework for Winter Wheat Yield Prediction Integrating Deep Learning
and Bayesian Optimization,” Agronomy, vol. 12, no. 12, pp. 1-15, Dec. 2022, doi: 10.3390/agronomy12123194.
[30] N. Bali and A. Singla, “Deep Learning Based Wheat Crop Yield Prediction Model in Punjab Region of North India,” Applied
Artificial Intelligence, vol. 35, no. 15, pp. 1304–1328, Dec. 2021, doi: 10.1080/08839514.2021.1976091.
[31] S. Iniyan, V. A. Varma, and C. T. Naidu, “Crop yield prediction using machine learning techniques,” Advances in Engineering
Software, vol. 175, p. 103326, Jan. 2023, doi: 10.1016/j.advengsoft.2022.103326.
[32] J. Shook, T. Gangopadhyay, L. Wu, B. Ganapathysubramanian, S. Sarkar, and A. K. Singh, “Crop yield prediction integrating
genotype and weather variables using deep learning,” PLoS ONE, vol. 16, no. 6, pp. 1-19, Jun. 2021, doi:
10.1371/journal.pone.0252402.
[33] S. Khaki, L. Wang, and S. V. Archontoulis, “A CNN-RNN Framework for Crop Yield Prediction,” Frontiers in Plant Science,
vol. 10, pp. 1-14, Jan. 2020, doi: 10.3389/fpls.2019.01750.
[34] J. Sun, L. Di, Z. Sun, Y. Shen, and Z. Lai, “County-Level Soybean Yield Prediction Using Deep CNN-LSTM Model,” Sensors,
vol. 19, no. 20, pp. 1-21, Oct. 2019, doi: 10.3390/s19204363.
[35] G. Ghazaryan, S. Skakun, S. Konig, E. E. Rezaei, S. Siebert, and O. Dubovyk, “Crop Yield Estimation Using Multi-Source
Satellite Image Series and Deep Learning,” in IGARSS 2020 - 2020 IEEE International Geoscience and Remote Sensing
Symposium, Waikoloa, HI, USA: IEEE, Sep. 2020, pp. 5163–5166, doi: 10.1109/IGARSS39084.2020.9324027.
[36] P. Prashant, K. Ponkshe, C. Garg, I. Pendse, and P. Muley, “Crop Yield Prediction of Indian Districts Using Deep Learning,” in
2021 Sixth International Conference on Image Information Processing (ICIIP), Shimla, India: IEEE, Nov. 2021, pp. 250–255.
doi: 10.1109/ICIIP53038.2021.9702573.
[37] B. Panigrahi, K. C. R. Kathala, and M. Sujatha, “A Machine Learning-Based Comparative Approach to Predict the Crop Yield
Using Supervised Learning With Regression Models,” Procedia Computer Science, vol. 218, pp. 2684–2693, 2023, doi:
10.1016/j.procs.2023.01.241.
[38] D. R. Joshi et al., “Artificial intelligence and satellite‐based remote sensing can be used to predict soybean (Glycine max) yield,”
Agronomy Journal, pp. 1-14, Oct. 2023, doi: 10.1002/agj2.21473.
[39] J. H. Jeong et al., “Random Forests for Global and Regional Crop Yield Predictions,” PLoS ONE, vol. 11, no. 6, pp. 1-15, Jun.
2016, doi: 10.1371/journal.pone.0156571.
[40] U. Bhimavarapu, G. Battineni, and N. Chintalapudi, “Improved Optimization Algorithm in LSTM to Predict Crop Yield,”
Computers, vol. 12, no. 1, pp. 1-19, Jan. 2023, doi: 10.3390/computers12010010.
[41] P. Chen et al., “Improving yield prediction based on spatio-temporal deep learning approaches for winter wheat: A case study in
Jiangsu Province, China,” Computers and Electronics in Agriculture, vol. 213, Oct. 2023, doi: 10.1016/j.compag.2023.108201.
[42] V. Sagan et al., “Field-scale crop yield prediction using multi-temporal WorldView-3 and PlanetScope satellite data and deep
learning,” ISPRS Journal of Photogrammetry and Remote Sensing, vol. 174, pp. 265–281, 2021, doi:
10.1016/j.isprsjprs.2021.02.008.
[43] C. Kumar, P. Mubvumba, Y. Huang, J. Dhillon, and K. Reddy, “Multi-Stage Corn Yield Prediction Using High-Resolution UAV
Multispectral Data and Machine Learning Models,” Agronomy, vol. 13, no. 5, pp. 1-22, Apr. 2023, doi:
10.3390/agronomy13051277.
[44] Y. Kang, M. Ozdogan, X. Zhu, Z. Ye, C. Hain, and M. Anderson, “Comparative assessment of environmental variables and
machine learning algorithms for maize yield prediction in the US Midwest,” Environmental Research Letters, vol. 15, no. 6, p.
064005, Jun. 2020, doi: 10.1088/1748-9326/ab7df9.
[45] A. Sharifi, “Yield prediction with machine learning algorithms and satellite images,” Journal of the Science of Food and
Agriculture, vol. 101, no. 3, pp. 891–896, Feb. 2021, doi: 10.1002/jsfa.10696.
[46] R. Ed-Daoudi, A. Alaoui, B. Ettaki, and J. Zerouaoui, “Improving Crop Yield Predictions in Morocco Using Machine Learning
Algorithms,” Journal of Ecological Engineering, vol. 24, no. 6, pp. 392–400, Jun. 2023, doi: 10.12911/22998993/162769.
[47] B.-L. Sierra-Forero, J. Baron-Velandia, and S.-C. Vanegas-Ayala, “Assessment of the relevance of features associated with corn
crop yield prediction in Colombia, a country in the Neotropical zone,” International Journal of Information Technology, Mar.
2024, doi: 10.1007/s41870-024-01762-9.
[48] P. S. M. Gopal and R. Bhargavi, “A novel approach for efficient crop yield prediction,” Computers and Electronics in
Agriculture, vol. 165, pp. 1-9, Oct. 2019, doi: 10.1016/j.compag.2019.104968.
[49] S. S. Kale and P. S. Patil, “A Machine Learning Approach to Predict Crop Yield and Success Rate,” in 2019 IEEE Pune Section
International Conference (PuneCon), Pune, India: IEEE, Dec. 2019, pp. 1–5, doi: 10.1109/PuneCon46936.2019.9105741.](https://image.slidesharecdn.com/13id26621-250625064733-a7f007c5/75/Advanced-crop-yield-prediction-using-machine-learning-and-deep-learning-a-comprehensive-review-12-2048.jpg)
![ ISSN: 1693-6930
TELKOMNIKA Telecommun Comput El Control, Vol. 23, No. 2, April 2025: 402-415
414
[50] M. Champaneri, D. Chachpara, C. Chandvidkar, and M. Rathod, “Crop Yield Prediction Using Machine Learning,” vol. 9, no. 4,
2018.
[51] K. Gavahi, P. Abbaszadeh, and H. Moradkhani, “DeepYield: A combined convolutional neural network with long short-term
memory for crop yield forecasting,” Expert Systems with Applications, vol. 184, pp. 1-11, Dec. 2021, doi:
10.1016/j.eswa.2021.115511.
[52] M. Shahhosseini, G. Hu, S. Khaki, and S. V. Archontoulis, “Corn Yield Prediction with Ensemble CNN-DNN,” Frontiers in
Plant Science, vol. 12, Aug. 2021, doi: 10.3389/fpls.2021.709008.
[53] F. F. Haque, A. Abdelgawad, V. P. Yanambaka, and K. Yelamarthi, “Crop Yield Prediction Using Deep Neural Network,” in
2020 IEEE 6th World Forum on Internet of Things (WF-IoT), New Orleans, LA, USA: IEEE, Jun. 2020, pp. 1–4, doi:
10.1109/WF-IoT48130.2020.9221298.
[54] T. Lin et al., “DeepCropNet: a deep spatial-temporal learning framework for county-level corn yield estimation,” Environmental
Research Letters, vol. 15, no. 3, pp. 1-34, Mar. 2020, doi: 10.1088/1748-9326/ab66cb.
[55] J. Sun, Z. Lai, L. Di, Z. Sun, J. Tao, and Y. Shen, “Multilevel Deep Learning Network for County-Level Corn Yield Estimation in
the U.S. Corn Belt,” IEEE Journal of Selected Topics in Applied Earth Observations and Remote Sensing, vol. 13, pp. 5048–
5060, 2020, doi: 10.1109/JSTARS.2020.3019046.
[56] G. Leng and J. W. Hall, “Predicting spatial and temporal variability in crop yields: an inter-comparison of machine learning,
regression and process-based models,” Environmental Research Letters, vol. 15, no. 4, Apr. 2020, doi: 10.1088/1748-
9326/ab7b24.
[57] N. Guimarães, H. Fraga, J. J. Sousa, L. Pádua, A. Bento, and P. Couto, “Comparative Evaluation of Remote Sensing Platforms for
Almond Yield Prediction,” AgriEngineering, vol. 6, no. 1, Mar. 2024, doi: 10.3390/agriengineering6010015.
[58] A. Kheir et al., “Developing automated machine learning approach for fast and robust crop yield prediction using a fusion of
remote sensing, soil, and weather dataset,” Environmental Research Communications, Feb. 2024, doi: 10.1088/2515-
7620/ad2d02.
[59] M. Meroni, F. Waldner, L. Seguini, H. Kerdiles, and F. Rembold, “Yield forecasting with machine learning and small data: What
gains for grains?,” Agricultural and Forest Meteorology, vol. 308–309, p. 108555, 2021, doi: 10.1016/j.agrformet.2021.108555.
[60] M. D. Johnson, W. W. Hsieh, A. J. Cannon, A. Davidson, and F. Bédard, “Crop yield forecasting on the Canadian Prairies by
remotely sensed vegetation indices and machine learning methods,” Agricultural and Forest Meteorology, vol. 218–219, pp. 74–
84, Mar. 2016, doi: 10.1016/j.agrformet.2015.11.003.
[61] P. Bose, N. K. Kasabov, L. Bruzzone, and R. N. Hartono, “Spiking Neural Networks for Crop Yield Estimation Based on
Spatiotemporal Analysis of Image Time Series,” IEEE Transactions on Geoscience and Remote Sensing, vol. 54, no. 11, pp.
6563–6573, Nov. 2016, doi: 10.1109/TGRS.2016.2586602.
[62] H. Zare et al., “Improving winter wheat yield prediction by accounting for weather and model parameter uncertainty while
assimilating LAI and updating weather data within a crop model,” European Journal of Agronomy, vol. 156, pp. 1-12, May 2024,
doi: 10.1016/j.eja.2024.127149.
[63] H. Aghighi, M. Azadbakht, D. Ashourloo, H. S. Shahrabi, and S. Radiom, “Machine Learning Regression Techniques for the
Silage Maize Yield Prediction Using Time-Series Images of Landsat 8 OLI,” IEEE Journal of Selected Topics in Applied Earth
Observations and Remote Sensing, vol. 11, no. 12, pp. 4563–4577, Dec. 2018, doi: 10.1109/JSTARS.2018.2823361.
[64] M. Yli-Heikkilä et al., “Scalable Crop Yield Prediction with Sentinel-2 Time Series and Temporal Convolutional Network,”
Remote Sensing, vol. 14, no. 17, pp. 1-24, Aug. 2022, doi: 10.3390/rs14174193.
[65] P. Helber et al., “Crop Yield Prediction: An Operational Approach to Crop Yield Modeling on Field and Subfield Level with
Machine Learning Models,” in IGARSS 2023 - 2023 IEEE International Geoscience and Remote Sensing Symposium, Pasadena,
CA, USA: IEEE, Jul. 2023, pp. 2763–2766. doi: 10.1109/IGARSS52108.2023.10283302.
[66] M. J. Hoque et al., “Incorporating Meteorological Data and Pesticide Information to Forecast Crop Yields Using Machine
Learning,” IEEE Access, vol. 12, pp. 47768–47786, 2024, doi: 10.1109/ACCESS.2024.3383309.
[67] S. K. Upadhyay, P. Kushwaha, and P. Garg, “A Machine Learning Approach for Predicting Crop Yield in Precision Agriculture,”
2024 International Conference on Automation and Computation, Mar. 2024, pp. 289–294, doi:
10.1109/AUTOCOM60220.2024.10486160.
[68] E. Panek-Chwastyk et al., “Estimates of Crop Yield Anomalies for 2022 in Ukraine Based on Copernicus Sentinel-1, Sentinel-3
Satellite Data, and ERA-5 Agrometeorological Indicators,” Sensors, vol. 24, no. 7, Jan. 2024, doi: 10.3390/s24072257.
[69] H. F. Assous, H. AL-Najjar, N. Al-Rousan, and D. AL-Najjar, “Developing a Sustainable Machine Learning Model to Predict
Crop Yield in the Gulf Countries,” Sustainability, vol. 15, no. 12, pp. 1-21, Jun. 2023, doi: 10.3390/su15129392.
[70] M. Shripathi Rao, A. Singh, N. V. S. Reddy, and D. U. Acharya, “Crop prediction using machine learning,” Journal of Physics:
Conference Series, vol. 2161, no. 1, pp. 1-12, Jan. 2022, doi: 10.1088/1742-6596/2161/1/012033.
[71] L. S. Cedric et al., “Crops yield prediction based on machine learning models: Case of West African countries,” Smart
Agricultural Technology, vol. 2, pp. 1-14, Dec. 2022, doi: 10.1016/j.atech.2022.100049.
[72] G. Lischeid, H. Webber, M. Sommer, C. Nendel, and F. Ewert, “Machine learning in crop yield modelling: A powerful tool, but
no surrogate for science,” Agricultural and Forest Meteorology, vol. 312, pp. 1-23, 2022, doi: 10.1016/j.agrformet.2021.108698.
[73] J. Pant, R. P. Pant, M. K. Singh, D. Pratap Singh, and H. Pant, “Analysis of agricultural crop yield prediction using statistical
techniques of machine learning,” Materials Today: Proceedings, vol. 46, pp. 10922–10926, 2021, doi:
10.1016/j.matpr.2021.01.948.
[74] K. Alibabaei, P. D. Gaspar, and T. M. Lima, “Crop Yield Estimation Using Deep Learning Based on Climate Big Data and
Irrigation Scheduling,” Energies, vol. 14, no. 11, pp. 1-21, May 2021, doi: 10.3390/en14113004.
[75] M. Engen, E. Sandø, B. L. O. Sjølander, S. Arenberg, R. Gupta, and M. Goodwin, “Farm-Scale Crop Yield Prediction from
Multi-Temporal Data Using Deep Hybrid Neural Networks,” Agronomy, vol. 11, no. 12, pp. 1-31, 2021, doi:
10.3390/agronomy11122576.
[76] R. L. D. F. Cunha and B. Silva, “Estimating Crop Yields with Remote Sensing and Deep Learning,” in 2020 IEEE Latin
American GRSS & ISPRS Remote Sensing Conference (LAGIRS), Santiago, Chile, Mar. 2020, pp. 273–278, doi:
10.1109/LAGIRS48042.2020.9165608.
[77] M. Kavita and P. Mathur, “Crop Yield Estimation in India Using Machine Learning,” in 2020 IEEE 5th International Conference
on Computing Communication and Automation (ICCCA), India, Oct. 2020, pp. 220–224, doi:
10.1109/ICCCA49541.2020.9250915.
[78] P. Filippi et al., “An approach to forecast grain crop yield using multi-layered, multi-farm data sets and machine learning,”
Precision Agriculture, vol. 20, no. 5, pp. 1015–1029, Oct. 2019, doi: 10.1007/s11119-018-09628-4.](https://image.slidesharecdn.com/13id26621-250625064733-a7f007c5/75/Advanced-crop-yield-prediction-using-machine-learning-and-deep-learning-a-comprehensive-review-13-2048.jpg)
![TELKOMNIKA Telecommun Comput El Control
Advanced crop yield prediction using machine learning and deep learning: … (Ayush Anand)
415
[79] T. Islam, T. A. Chisty, and A. Chakrabarty, “A Deep Neural Network Approach for Crop Selection and Yield Prediction in
Bangladesh,” in 2018 IEEE Region 10 Humanitarian Technology Conference (R10-HTC), Dec. 2018, pp. 1–6, doi: 10.1109/R10-
HTC.2018.8629828.
[80] V. Shah and P. Shah, “Groundnut Crop Yield Prediction Using Machine Learning Techniques,” Jul. 2018.
[81] R. K. Rajak, A. Pawar, M. Pendke, P. Shinde, S. Rathod, and A. Devare, “Crop Recommendation System to Maximize Crop
Yield using Machine Learning Technique,” International Research Journal of Engineering and Technology (IRJET), vol. 4, no.
12, pp. 485–489, 2017.
[82] V. Joshua, S. M. Priyadharson, and R. Kannadasan, “Exploration of Machine Learning Approaches for Paddy Yield Prediction in
Eastern Part of Tamilnadu,” Agronomy, vol. 11, no. 10, Oct. 2021, doi: 10.3390/agronomy11102068.
[83] M. V. Rao, Y. Sreeraman, S. V. Mantena, V. Gundu, D. Roja, and R. Vatambeti, “Brinjal Crop yield prediction using Shuffled
shepherd optimization algorithm based ACNN-OBDLSTM model in Smart Agriculture,” Journal of Integrated Science and
Technology, vol. 12, no. 1, 2024.
[84] S. Agarwal and S. Tarar, “A hybrid approach for crop yield prediction using machine learning and deep learning algorithms,”
Journal of Physics: Conference Series, vol. 1714, no. 1, pp. 1-10, Jan. 2021, doi: 10.1088/1742-6596/1714/1/012012.
[85] M. S. Dhillon et al., “Integrating random forest and crop modeling improves the crop yield prediction of winter wheat and oil seed
rape,” Frontiers in Remote Sensing, vol. 3, pp. 1-19, Jan. 2023, doi: 10.3389/frsen.2022.1010978.
[86] N. R. Prasad, N. R. Patel, and A. Danodia, “Crop yield prediction in cotton for regional level using random forest approach,”
Spatial Information Research, vol. 29, no. 2, pp. 195–206, Apr. 2021, doi: 10.1007/s41324-020-00346-6.
[87] S. Heremans, Q. Dong, B. Zhang, L. Bydekerke, and J. V. Orshoven, “Potential of ensemble tree methods for early-season
prediction of winter wheat yield from short time series of remotely sensed normalized difference vegetation index and in situ
meteorological data,” Journal of Applied Remote Sensing, vol. 9, no. 1, pp. 1-21, Mar. 2015, doi: 10.1117/1.JRS.9.097095.
[88] N.-T. Son et al., “Machine learning approaches for rice crop yield predictions using time-series satellite data in Taiwan,”
International Journal of Remote Sensing, vol. 41, no. 20, pp. 7868–7888, Oct. 2020, doi: 10.1080/01431161.2020.1766148.
[89] J. L. Fernandes, N. F. F. Ebecken, and J. C. D. M. Esquerdo, “Sugarcane yield prediction in Brazil using NDVI time series and
neural networks ensemble,” International Journal of Remote Sensing, vol. 38, no. 16, pp. 4631–4644, 2017, doi:
10.1080/01431161.2017.1325531.
BIOGRAPHIES OF AUTHORS
Ayush Anand is a final-year undergraduate student pursuing a degree in
Information Technology at Manipal University Jaipur. With a keen interest in cutting-edge
technologies, he specializes in the application of artificial intelligence, machine learning, and
deep learning across diverse domains. His current research focuses on leveraging these
technologies to address challenges in various fields. He can be contacted at email:
ayush.209302396@muj.manipal.edu.
Kavita Jhajharia received her B.Tech. degree from Rajasthan Technical
University, India, in 2013 in Information Technology, and the M.Tech. Degree from SRM
University, Sonepat, India, in 2016. She has completed her Ph.D. degree from Manipal
University Jaipur. She is Assistant Professor in Manipal University Jaipur since 2016. She is
member of ACM. Her research interest is artificial intelligence, wireless networking, and
software engineering. She can be contacted at email: kavita.chaudhary@outlook.com,
Kavita.jhajharia@jaipur.manipal.edu.](https://image.slidesharecdn.com/13id26621-250625064733-a7f007c5/75/Advanced-crop-yield-prediction-using-machine-learning-and-deep-learning-a-comprehensive-review-14-2048.jpg)