Multiple Regression Analysisof Performance
Ratings
A Statistical Analysis of Factors Influencing Employee
Performance
2.
Presentation Outline
• 1.Introduction and Research Objectives
• 2. Literature Review and Theoretical Framework
• 3. Methodology and Data Collection
• 4. Exploratory Data Analysis
• 5. Multiple Regression Analysis
• 6. Results and Interpretation
• 7. Discussion and Implications
• 8. Limitations and Future Research
• 9. Conclusion
Research Objectives
• •To identify key factors influencing employee performance ratings
• • To quantify the relationship between predictors and performance
• • To develop a predictive model for performance evaluation
• • To provide evidence-based recommendations for performance improvement
Key Findings
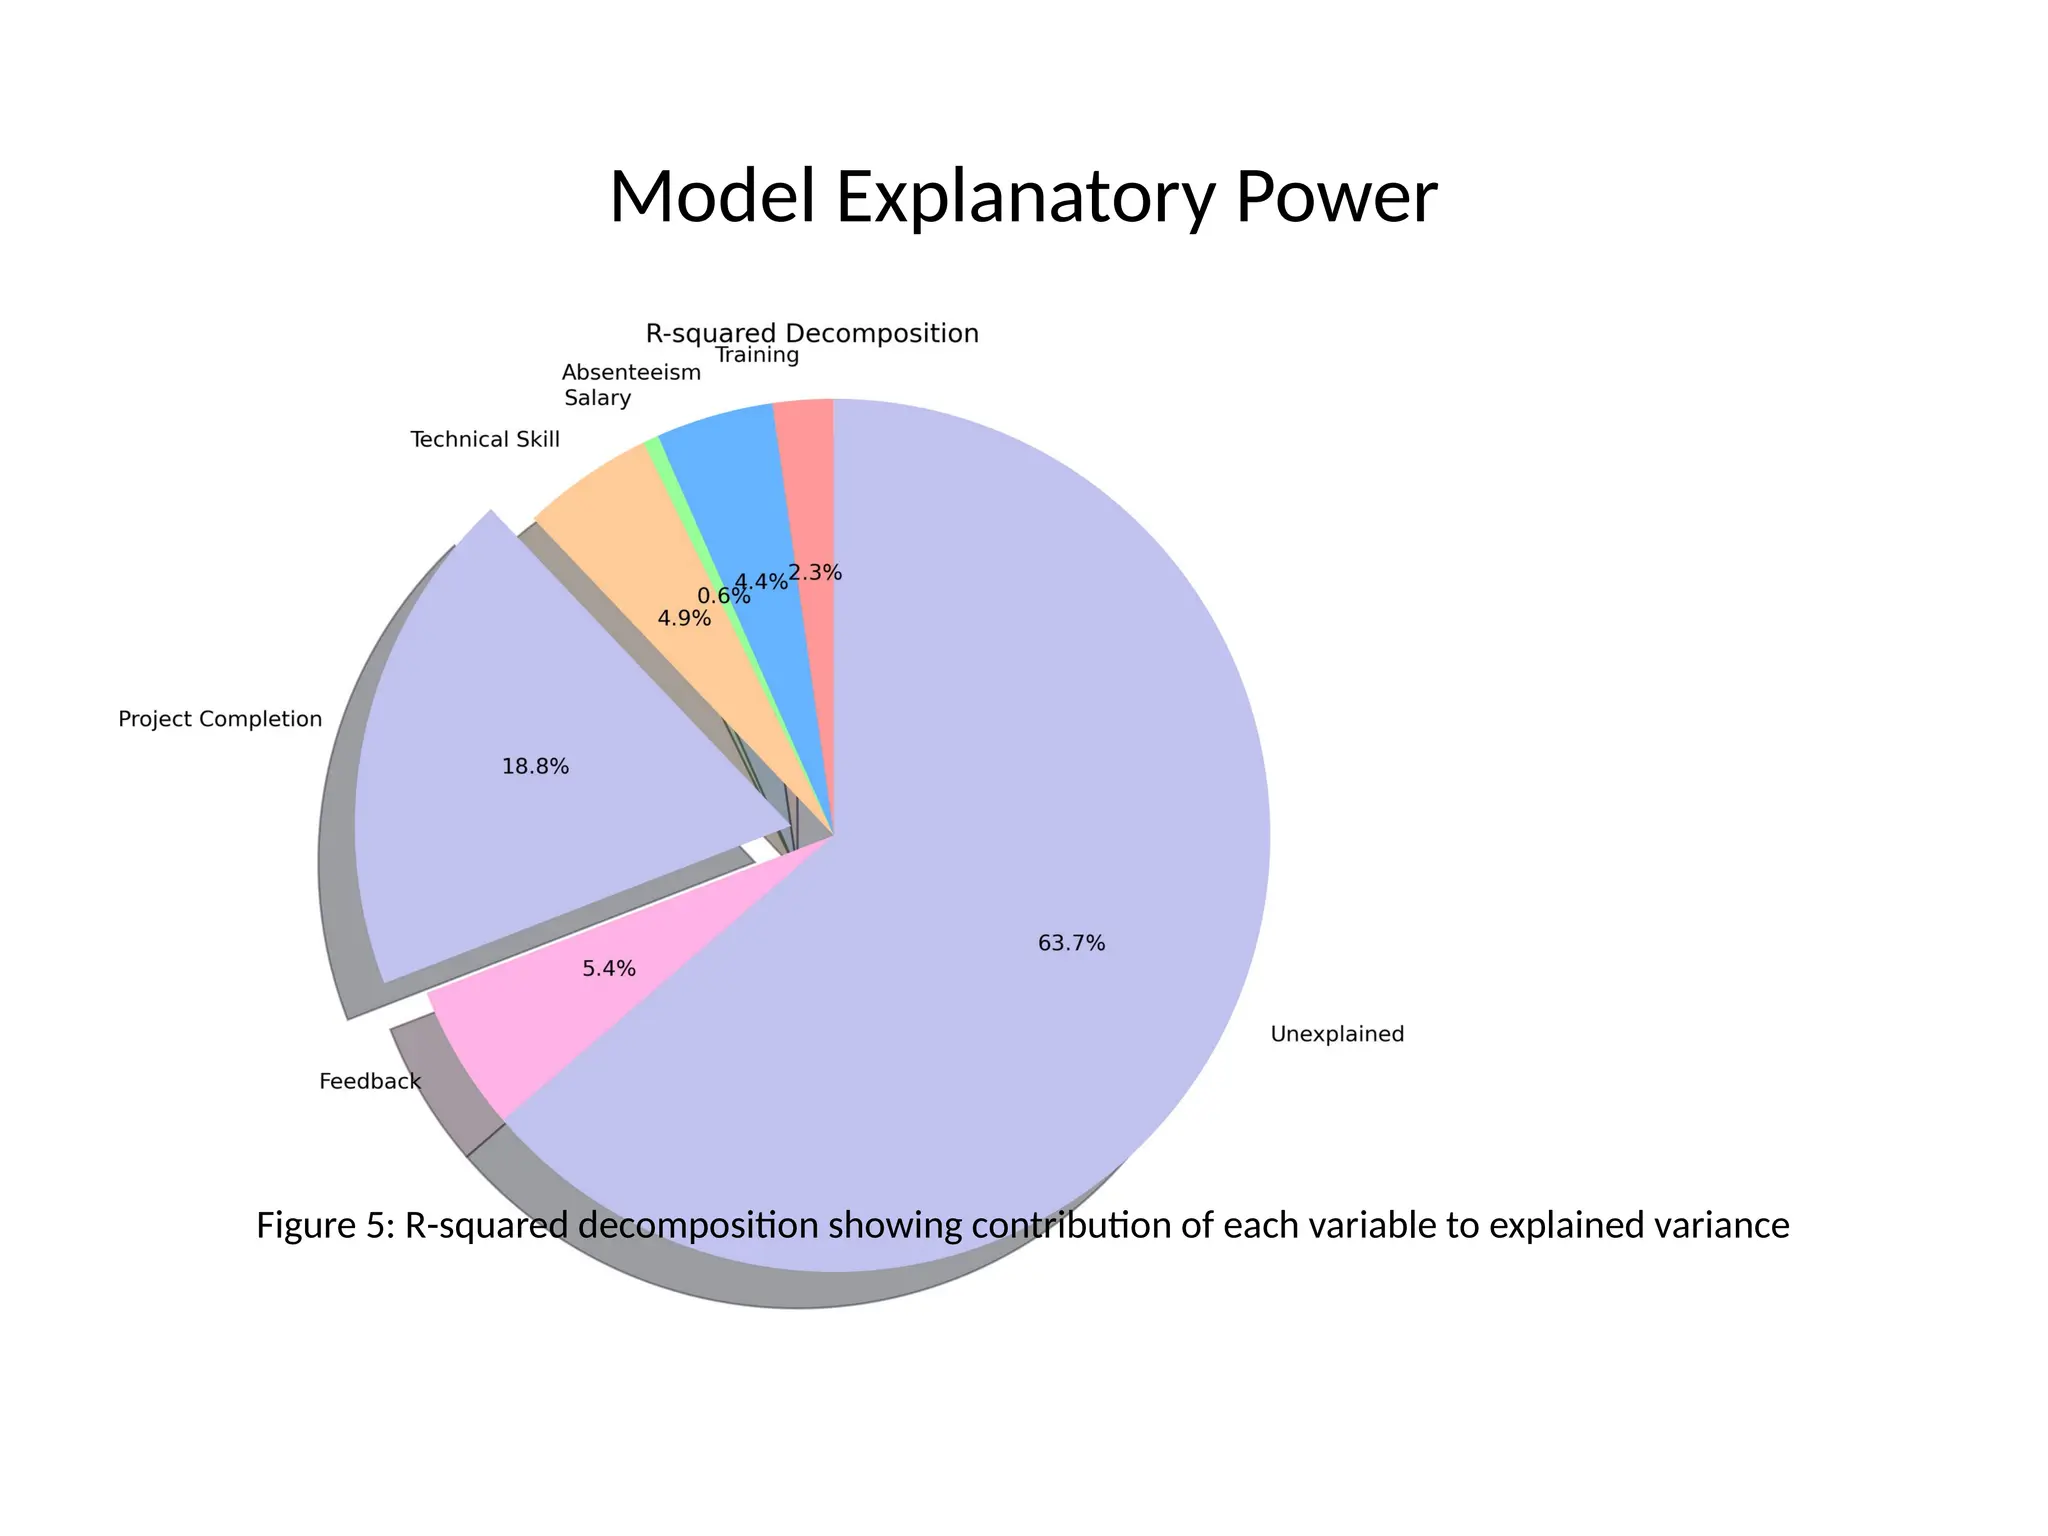
• •The overall model explains 36.3% of variance in performance ratings (R² = 0.363)
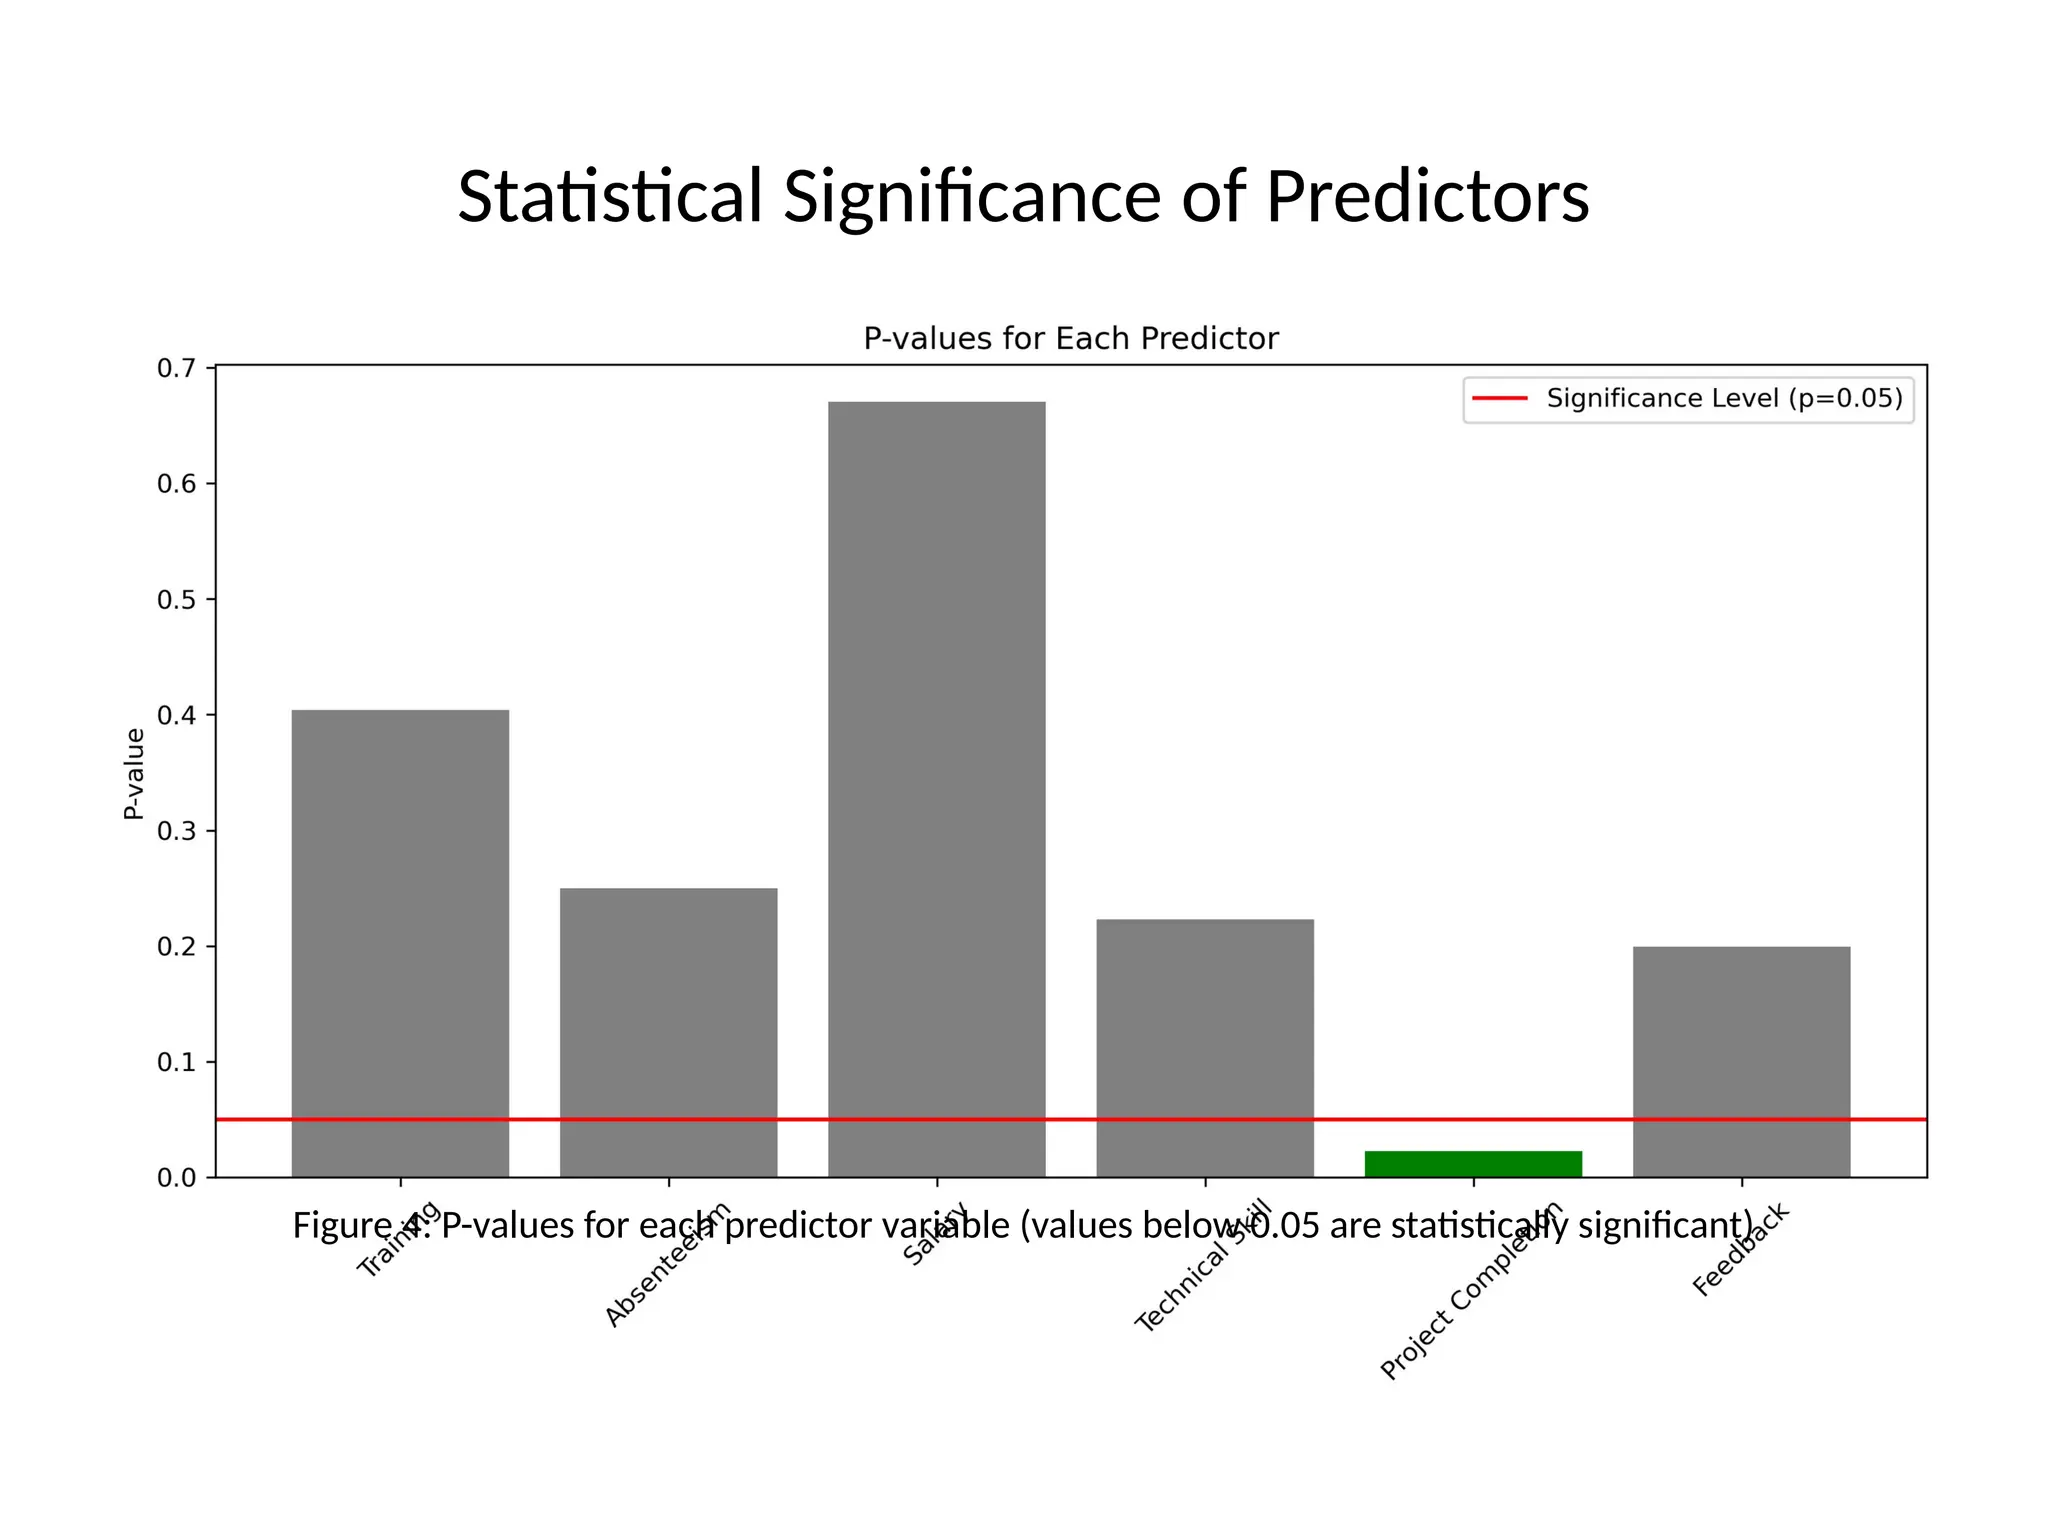
• • Project Completion Rate is the only statistically significant predictor (p < 0.05)
• • A 1% increase in Project Completion Rate is associated with a 0.08 increase in
performance rating
• • Other predictors did not reach statistical significance at the 0.05 level
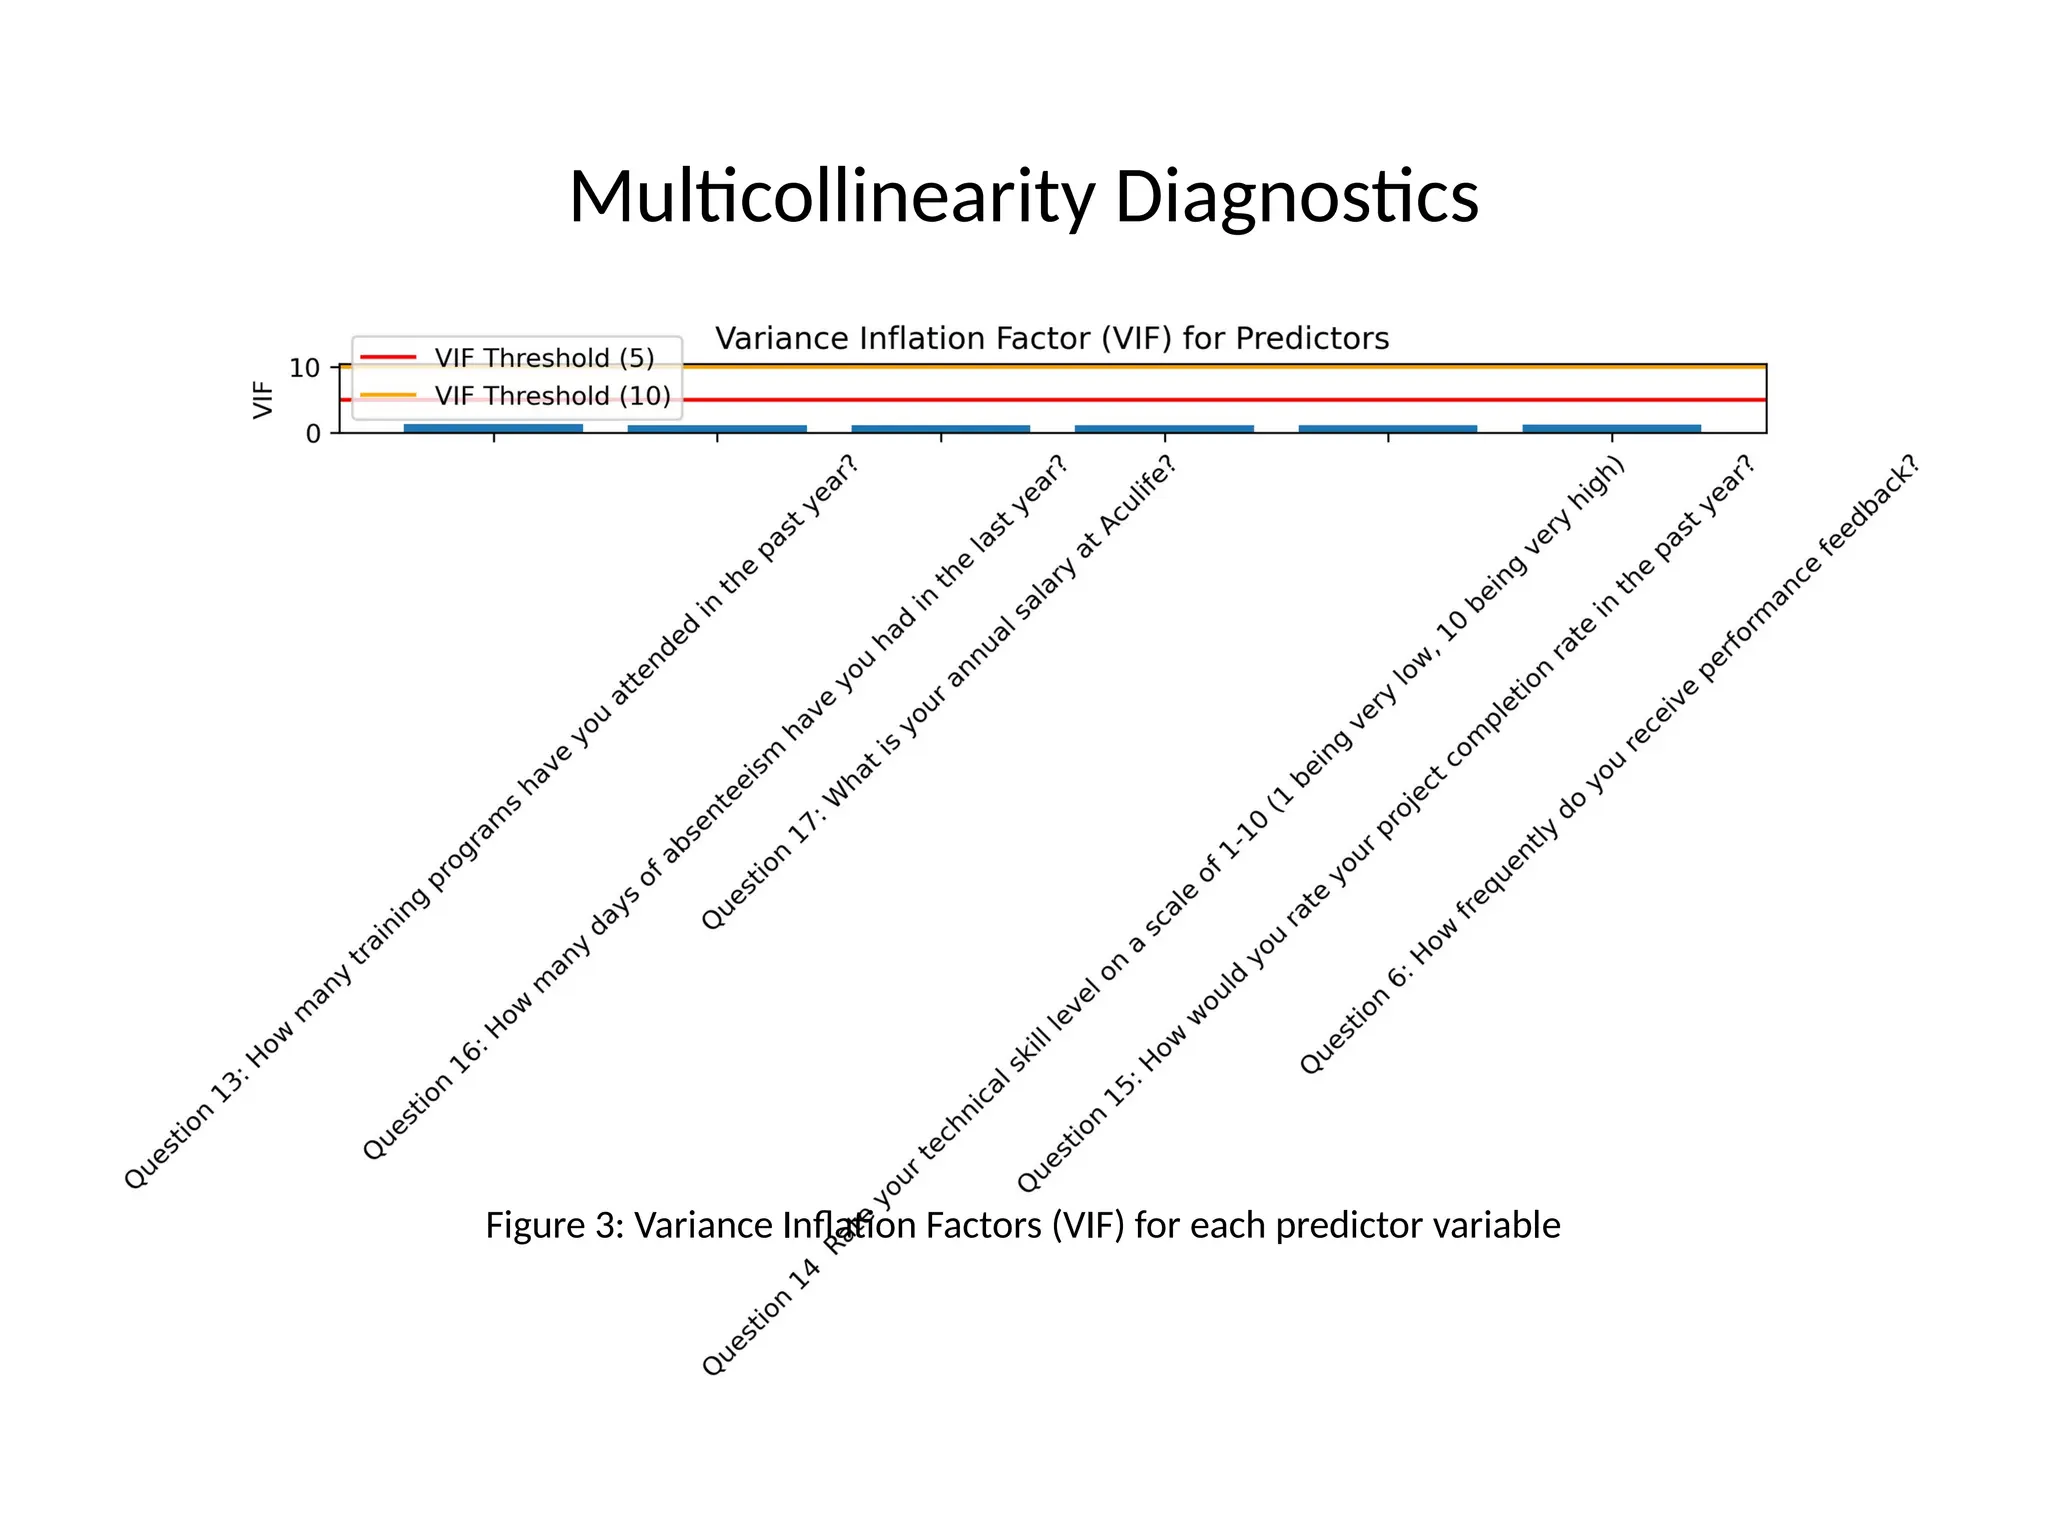
• • No significant multicollinearity issues detected (all VIF values < 5)
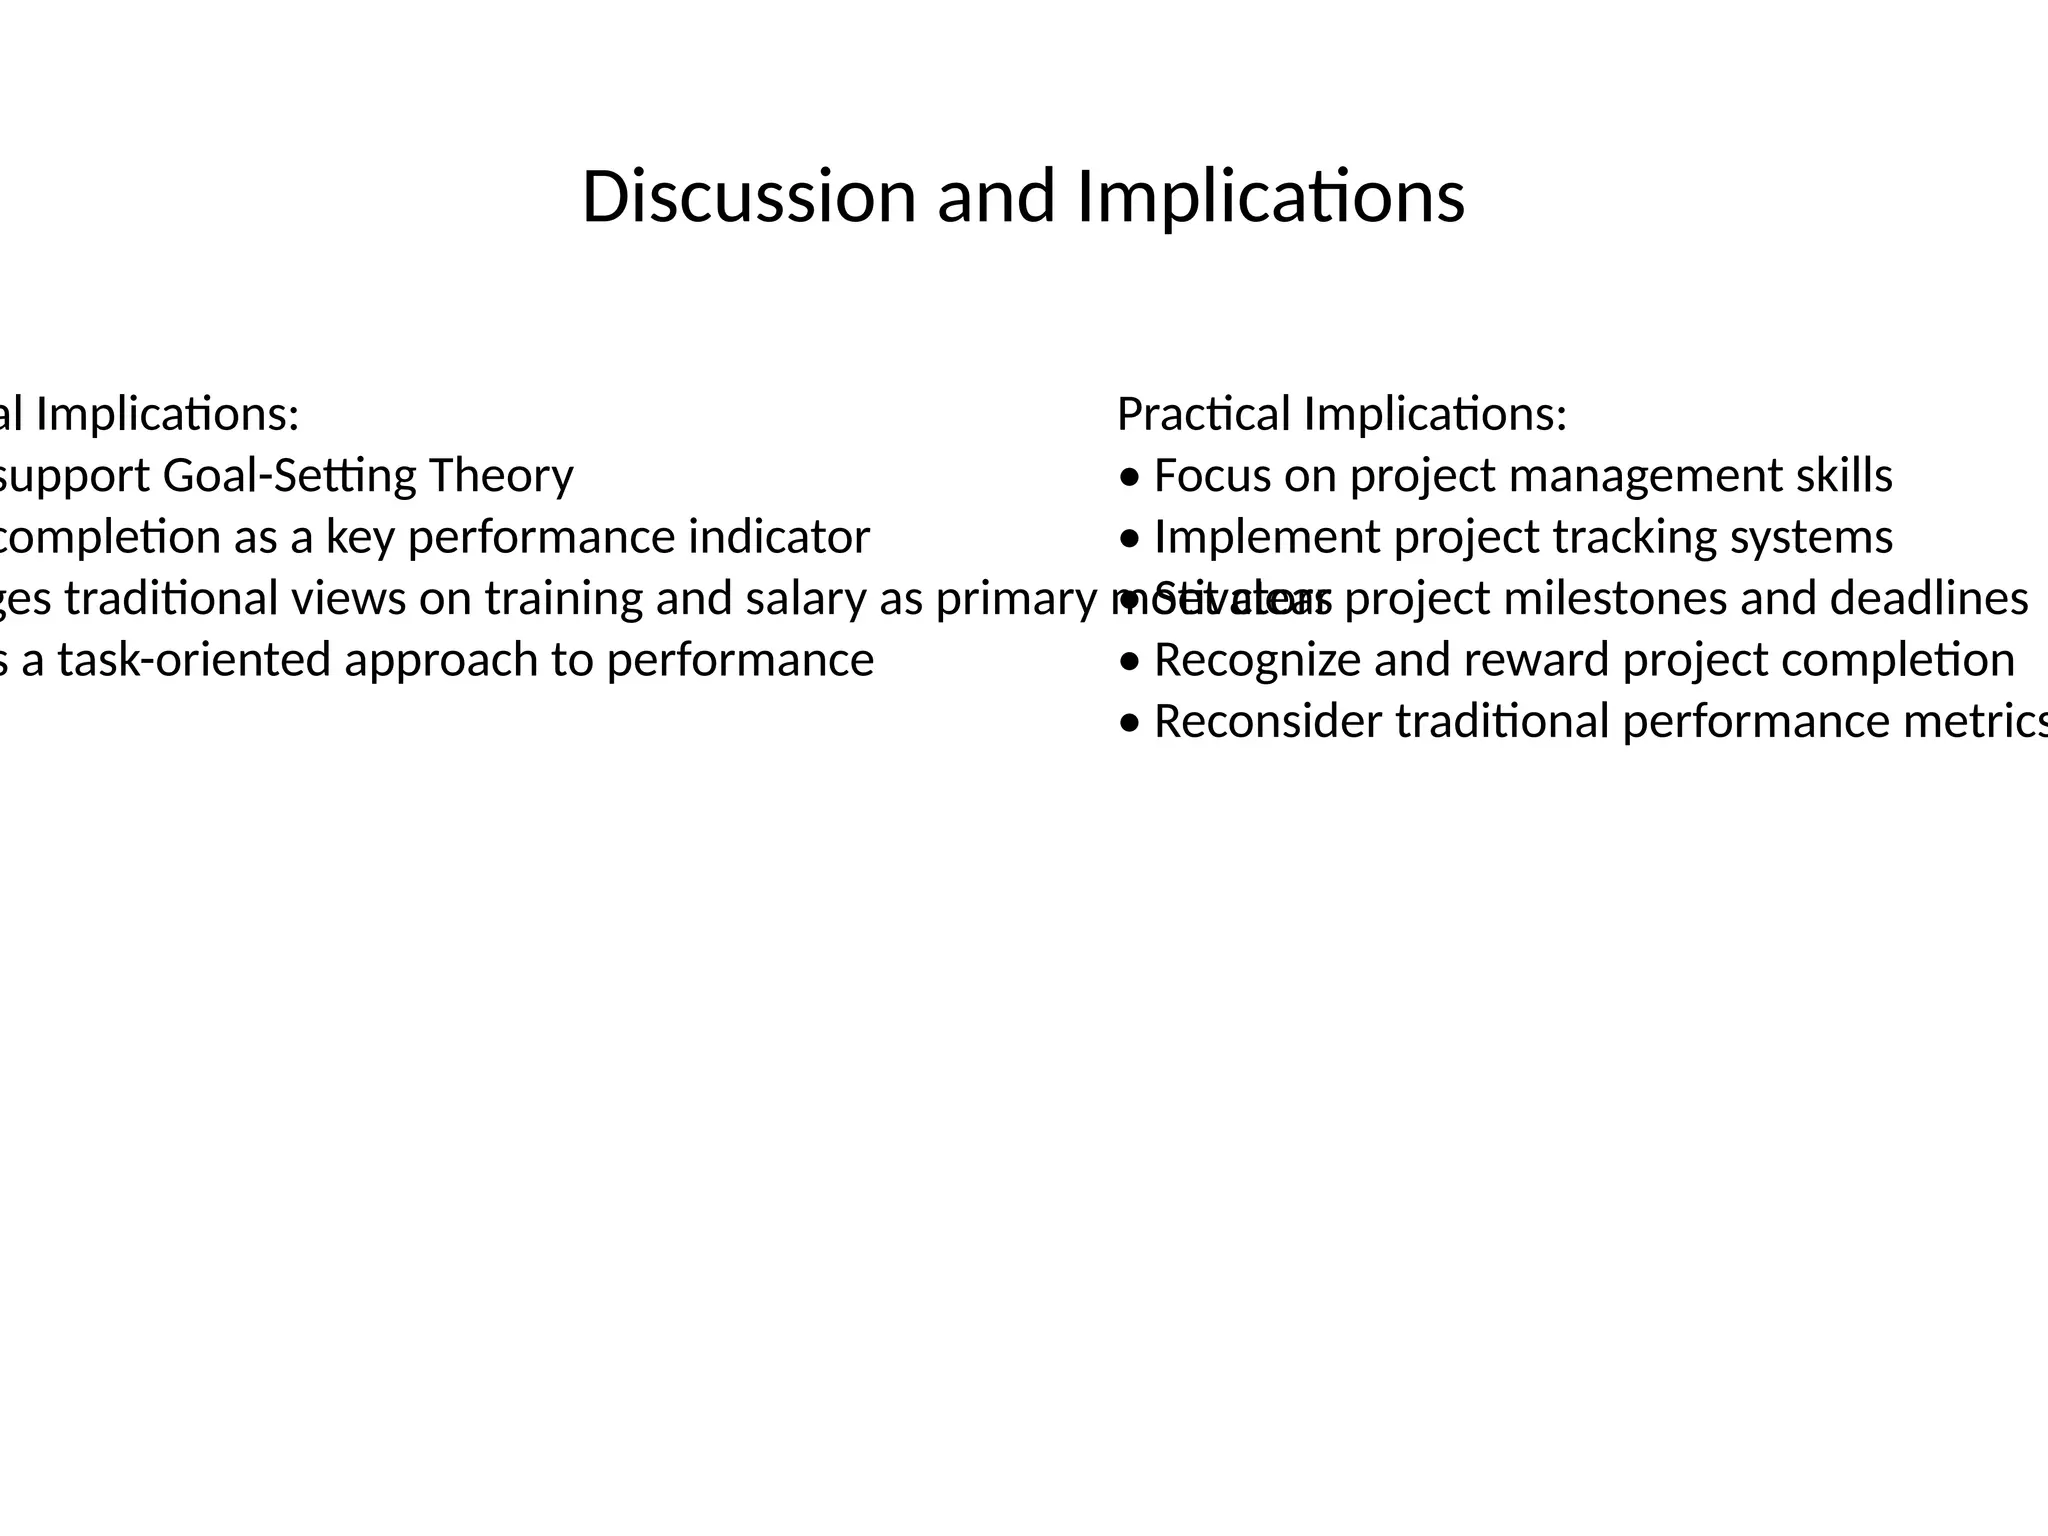
Discussion and Implications
alImplications:
support Goal-Setting Theory
completion as a key performance indicator
ges traditional views on training and salary as primary motivators
s a task-oriented approach to performance
Practical Implications:
• Focus on project management skills
• Implement project tracking systems
• Set clear project milestones and deadlines
• Recognize and reward project completion
• Reconsider traditional performance metrics
Conclusion
• • Projectcompletion rate emerges as the most significant predictor of
performance ratings
• • The findings challenge conventional wisdom about performance drivers
• • Organizations should prioritize project management capabilities and completion
metrics
• • Performance management systems should be redesigned to emphasize task
completion
• • Further research is needed to validate these findings across different contexts
• This study contributes to both theory and practice by identifying key drivers of
employee performance in the modern workplace.
25.
References
strong, M., &Baron, A. (2005). Managing performance: Performance management in action. CIPD Publishing.
er, G. S. (1964). Human capital: A theoretical and empirical analysis, with special reference to education. University of Chicago P
e, E. A., & Latham, G. P. (1990). A theory of goal setting & task performance. Prentice-Hall.
m, V. H. (1964). Work and motivation. Wiley.
J. F., Black, W. C., Babin, B. J., & Anderson, R. E. (2019). Multivariate data analysis (8th ed.). Cengage Learning.