Download to read offline


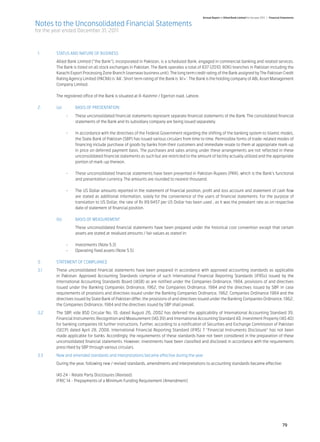
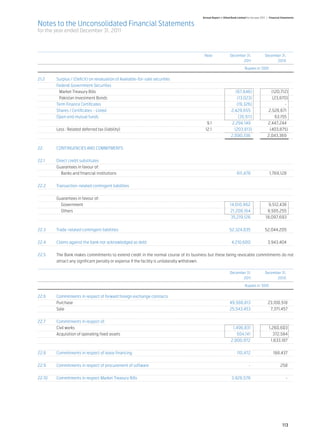
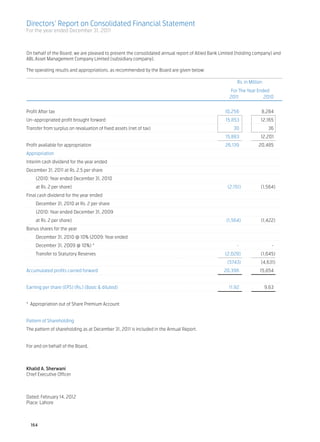
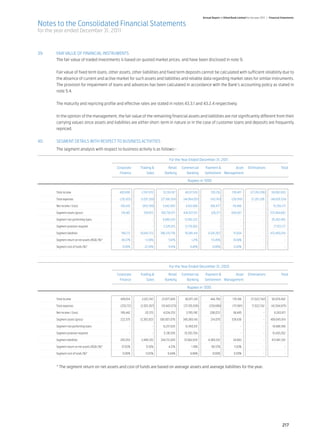
![Directors’ Report
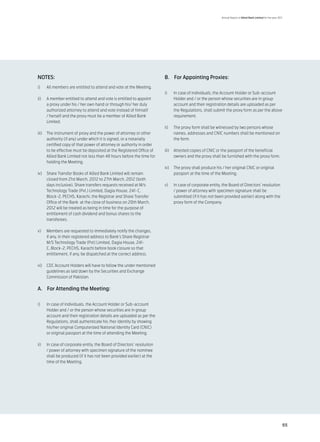
• Developed a comprehensive TFCs Issues Sidat Hyder, Chartered Accountants
Country Risk Management and Messrs KPMG Taseer Hadi & Co.,
Framework in order to improve JCR-VIS Credit Rating Company has Chartered Accountants, for the next
the Country Risk Assessment maintained rating of AA- (Double A term.
process at Allied Bank, and com- Minus) assigned to Your Bank’s 1st
TFC Issue (issue date: December 06,
ply with SBP’s Risk Management Events after the date of
Guidelines and Basel II require- 2006). This rating denotes high credit
ments. quality. The rating of Your Bank’s Statement of Financial
second TFC Issue (Issue date: August Position
• Comprehensively reviewed and 28, 2009) of Rs. 3,000 million has
developed ALM & Liquidity Risk There have not been any material
also been maintained at AA- (Double
limit / trigger structure and events that occurred subsequent
A Minus) by PACRA. The rating denotes
upgraded the MIS for Market Risk to the date of the statement of
a very strong capacity for timely
reporting. the financial position that require
payment of financial commitments.
adjustments to the enclosed
• Developed an Operational Risk financial statements, except those
Loss Database, concluded the Corporate Governance which have already been made or
Risk & Control Self Assessment Rating disclosed.
Exercise, prepared an inventory
of operational risks, and initiated JCR-VIS Credit Rating Company
Operational Risk Loss Data Re- Limited has re-affirmed Corporate Acknowledgements
porting in an effort to prepare for Governance Rating (CGR) rating On behalf of the Board and
migration from the simple ‘Basic of Allied Bank at “CGR 8+” which management, we would like to
Indicator Approach’ (BIA) to a denotes ‘high level of corporate express our sincere appreciation
relatively advanced ‘Alternate governance’. to our customers and shareholders
Standardized Approach’ (ASA) for Corporate governance ratings for their patronage, State Bank of
Operational Risk Capital Charge are based on evaluation of key Pakistan, Securities and Exchange
Calculation. governance areas of the rated Commission of Pakistan and other
institution, which include regulatory regulatory bodies for their continuous
The Bank devotes considerable compliance; board oversight; guidance and support, and employees
resources in managing the risks to management profile; self-regulation; for all their continued dedication,
which it is exposed. The momentum financial transparency and enthusiasm and loyalty.
attained thus far will be continued relationship with stakeholders. The
in the future through significant rating takes into consideration the
investments in human resources, continued commitment of the board For and on behalf of the Board,
technology and training. and management of Your Bank
to maintain a sound governance
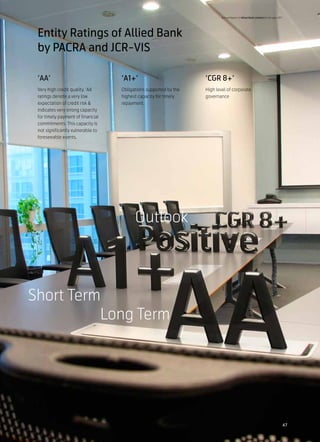
Entity Ratings framework.
The Pakistan Credit Rating Agency
(PACRA) has maintained ratings of Auditors Khalid A. Sherwani
Allied Bank Limited [long-term: AA Chief Executive Officer
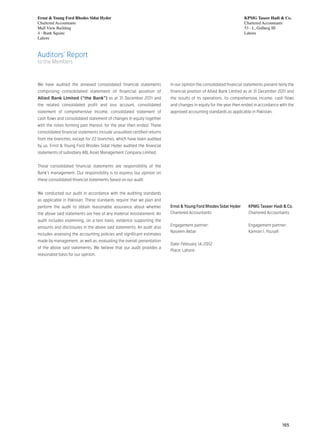
The present auditors Messrs KPMG
and short term: A1+] with a “Positive Taseer Hadi & Co., Chartered
Outlook”. The ratings denote a Dated: February 14, 2012
Accountants and Messrs Ernst &
very low expectation of credit risk Place: Lahore
Young Ford Rhodes Sidat Hyder,
emanating from a very strong capacity Chartered Accountants retire and
for timely payment of financial being eligible offer themselves for
commitments. The Positive Outlook re-appointment.
acknowledges Allied Bank’s consistent The Board of Directors, on the
robust performance, emanating from recommendation of the Audit
sustained growth and sound asset Committee, has recommended
quality. Messrs Ernst & Young Ford Rhodes
26](https://image.slidesharecdn.com/ablannualreport20112-130207040218-phpapp02/85/Abl-annual-report-2011-2-28-320.jpg)


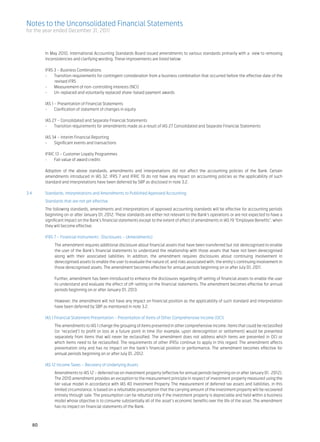
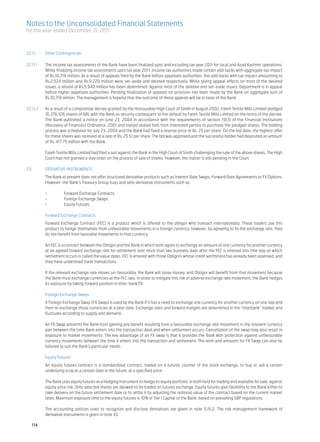
![Annual Report of Allied Bank Limited for the year 2011
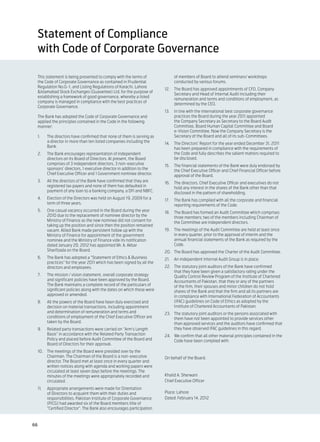
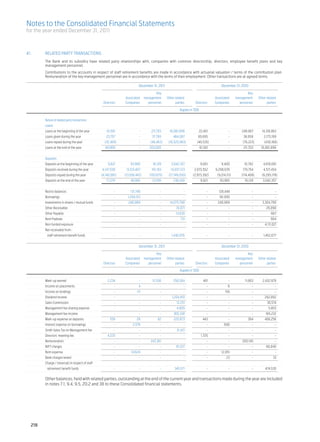
the “Best Retail Bank in Pakistan” Minus) by PACRA. The rating denotes ABL Asset Management
by the Asian Banker. The award is a very strong capacity for timely Company
referred by prominent global bankers, payment of financial commitments.
ABL AMC, a wholly owned subsidiary
consultants and academics. The
Corporate Governance Rating of Allied Bank, has established itself
evaluation was conducted on the
as a prominent player in the asset
basis of transparency in strategy; JCR-VIS Credit Rating Company
management industry of Pakistan.
value of franchise; annual financial Limited has re-affirmed Corporate
After launch of the Government
performance; sustainability; sales Governance Rating (CGR) of Allied
Securities Fund during 2011, the AMC
capability; risk management; Bank at “CGR 8+” which denotes ‘high
is now managing five open end funds.
processes and technology; level of corporate governance’.
Other fund offerings of ABL AMC
penetration and efficiency of
Corporate governance ratings include a conventional income fund,
distribution channels; people skills;
are based on evaluation of key an Islamic income fund, a money
and ethical banking.
governance areas of the rated market fund and a stock fund. The
Ratings institution, which include regulatory company’s funds provided impressive
compliance; board oversight; returns and were consistently ranked
Entity Ratings management profile; self- in the top quartile throughout 2011 in
The Pakistan Credit Rating Agency regulation; financial transparency their respective categories.
(PACRA) has maintained ratings of and relationship with stakeholders.
JCR-VIS has recently upgraded
Allied Bank Limited [long-term: AA The rating takes into consideration
the Management Quality rating of
and short term: A1+] with a “Positive the continued commitment of the
ABL AMC to ‘AM2-’ from ‘AM3+’,
Outlook”. The ratings denote a board and management of the Bank
acknowledging continuous
very low expectation of credit risk to maintain a sound governance
improvement in systems, controls
emanating from a very strong capacity framework.
and performance of the Company.
for timely payment of financial
As part of our initiatives to constantly During 2011, ABL AMC became only
commitments. The Positive Outlook
improve and compare ourselves the second Asset Management
acknowledges Allied Bank’s consistent
robust performance, emanating from against best international practices Company in Pakistan to achieve
sustained growth and sound asset and bench-marks, the Bank Global Investment Performance
quality. voluntarily get itself rated from Standards (GIPS) compliance. GIPS
Moody’s Investor Services, one of provide a universal standardization
TFCs Issues the premier International Rating of investment performance reporting
JCR-VIS Credit Rating Company has Agency. The ratings [Bank Deposits which provides investors additional
maintained rating of AA- (Double A - Foreign Currency: B3/ NP; Bank transparency to compare and
Minus) assigned to the Bank’s 1st Deposits - Local Currency: B1/NP; evaluate investment managers.
TFC Issue (issue date: December 06, Bank Financial Strength: E+], though
2006). This rating denotes high credit heavily influenced by the Sovereign
quality. Rating of the Bank’s second Ratings of Pakistan, are at par with
TFC Issue (Issue date: August 28, the international ratings of Tier-1 Peer
2009) of Rs. 3,000 million has also Banks in the domestic Industry as well
been maintained at AA- (Double A as important regional players.
43](https://image.slidesharecdn.com/ablannualreport20112-130207040218-phpapp02/85/Abl-annual-report-2011-2-45-320.jpg)


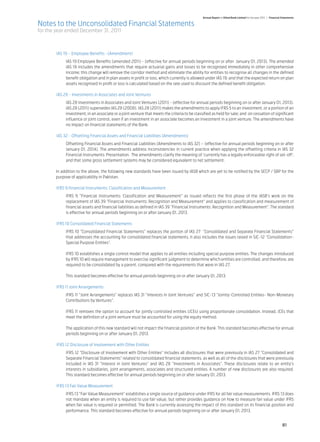
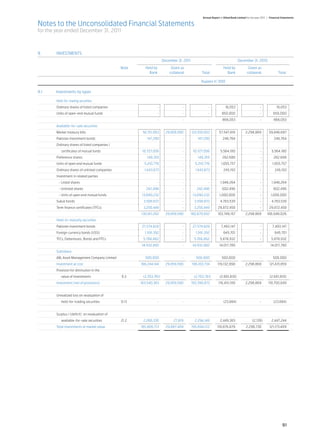
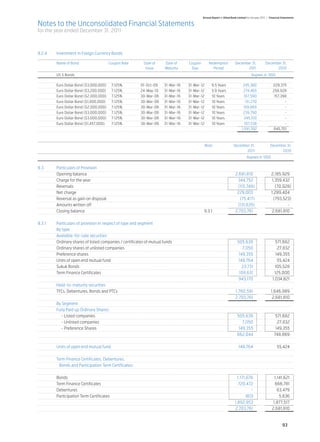
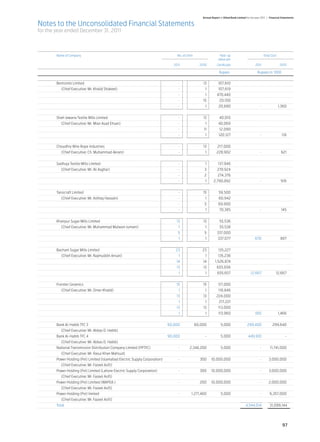

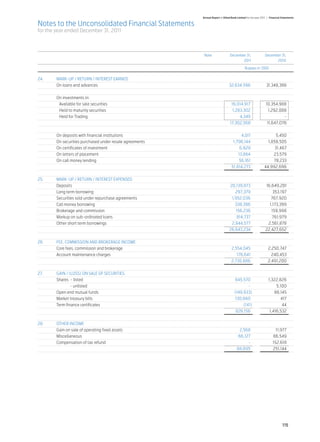
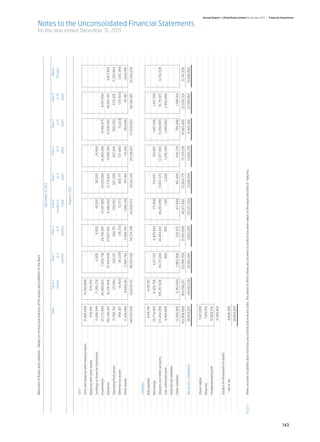
![Notes to the Unconsolidated Financial Statements
for the year ended December 31, 2011
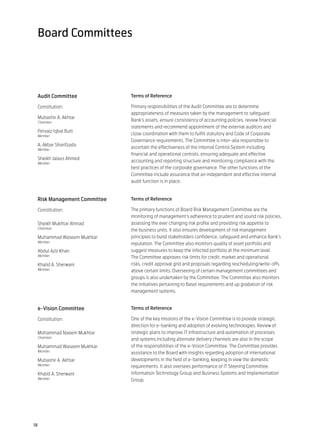
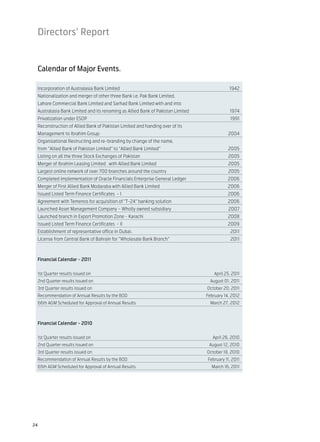
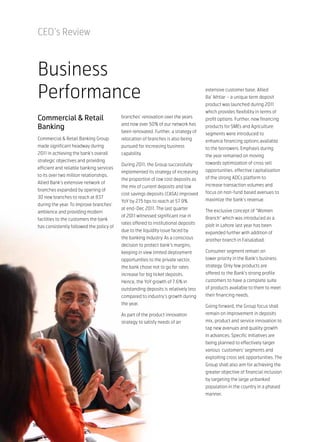
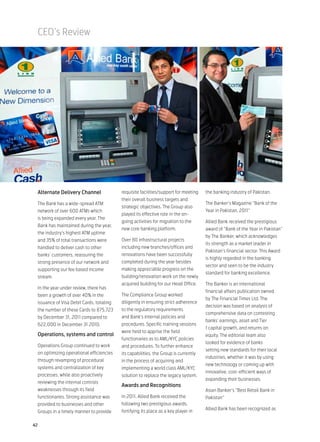
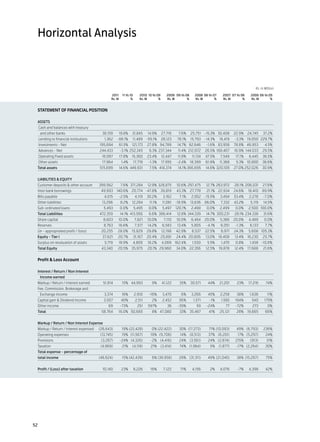
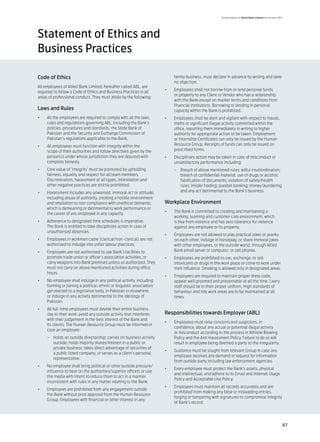
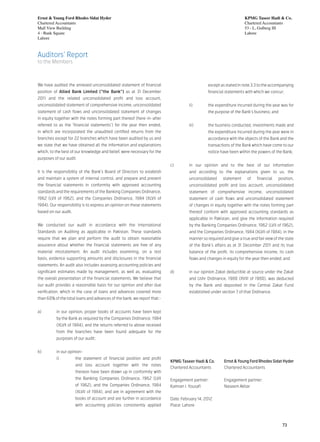
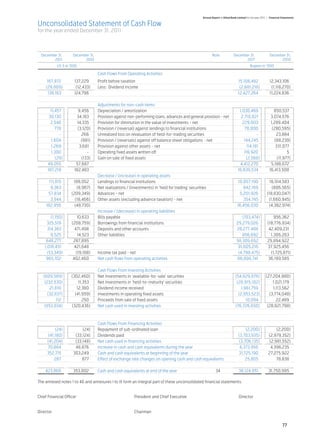
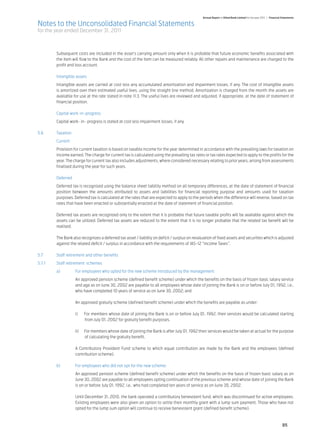
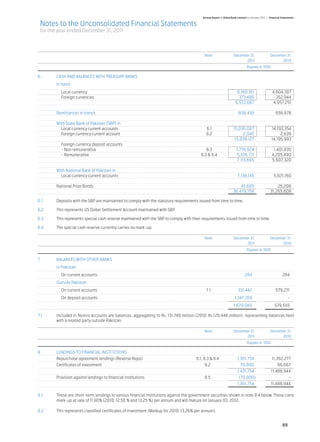
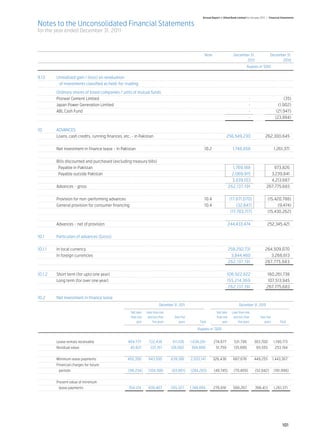
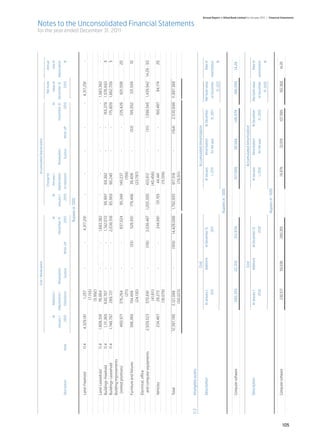
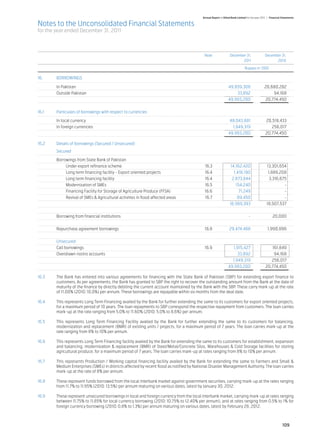
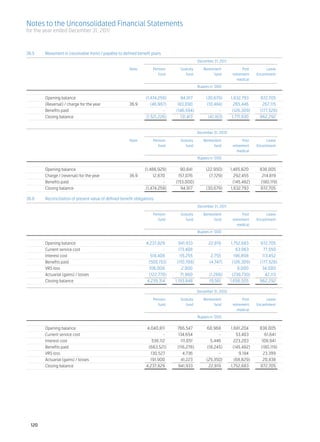
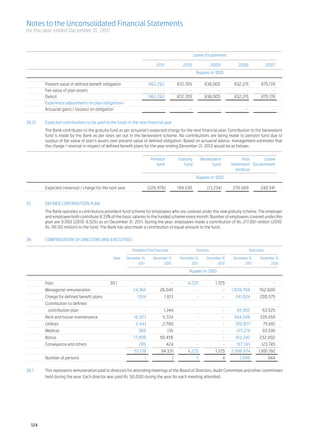
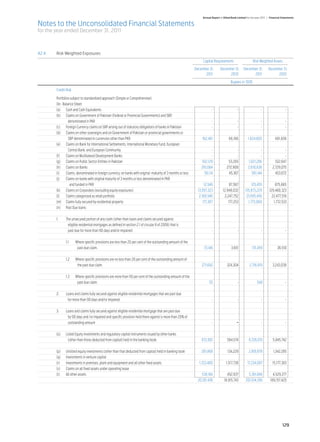
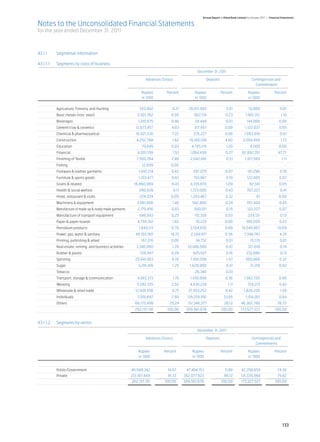
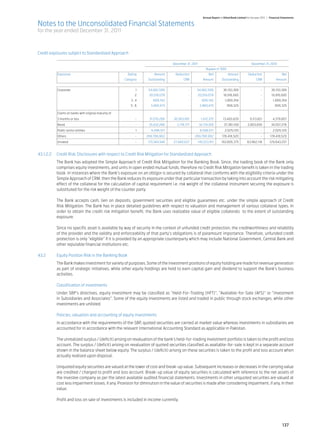
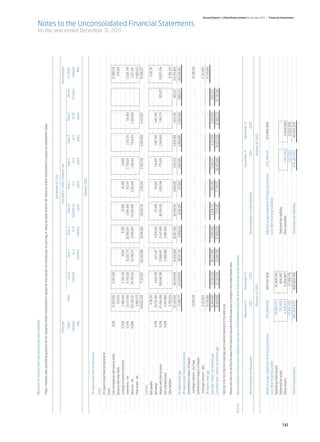
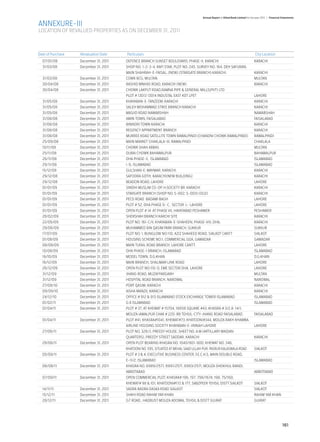
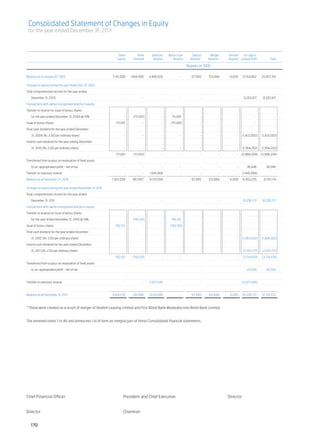
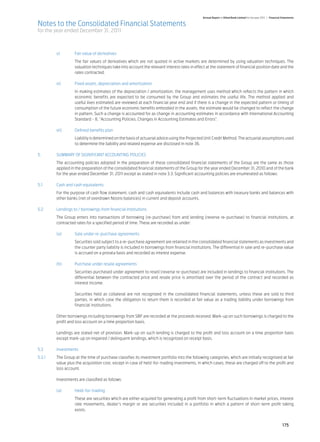
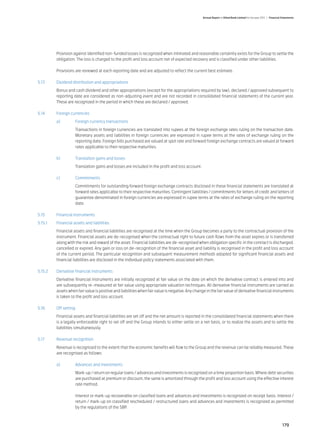
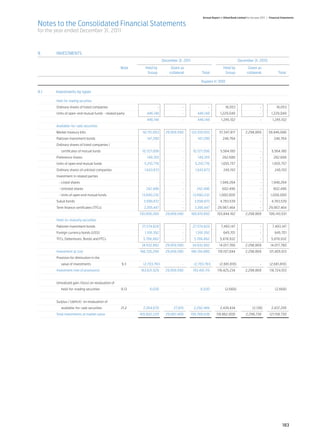
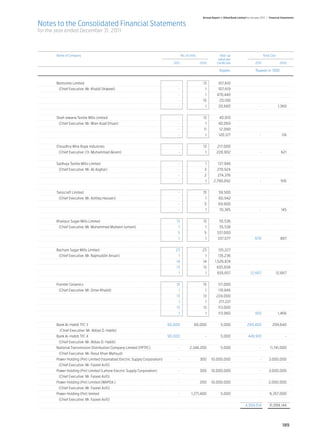
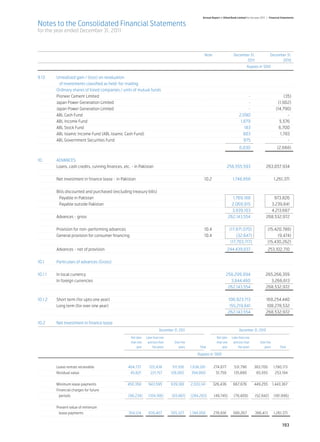
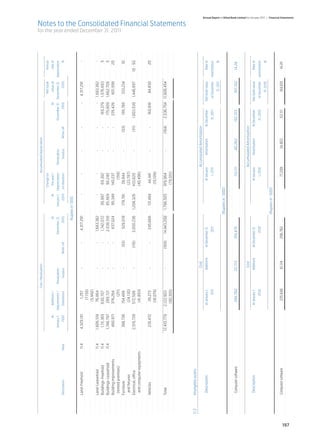
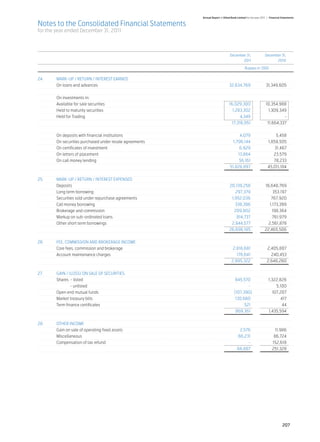
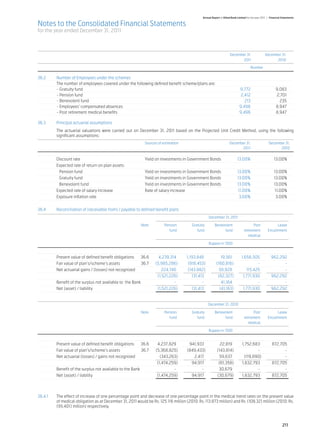
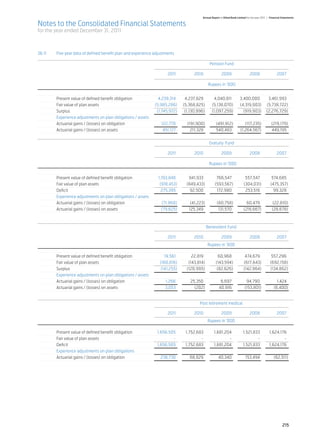
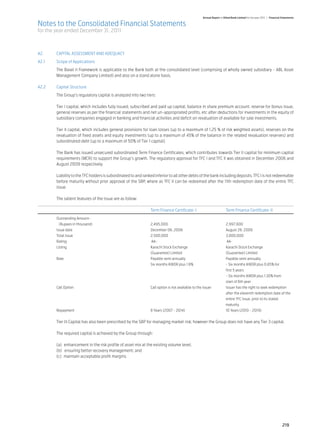
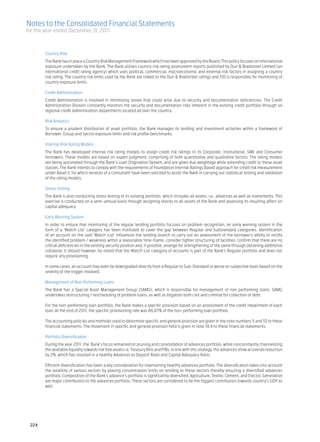
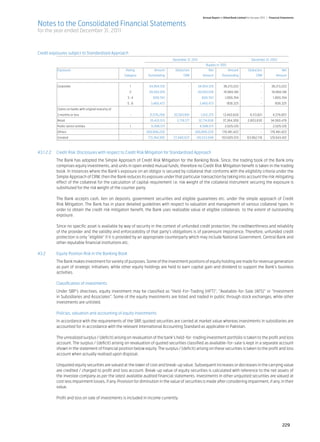
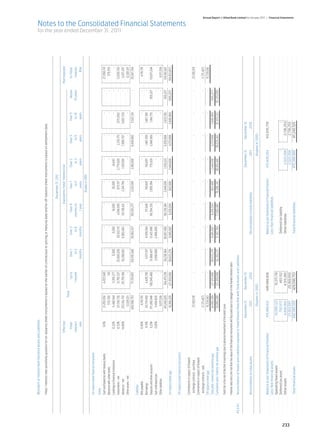
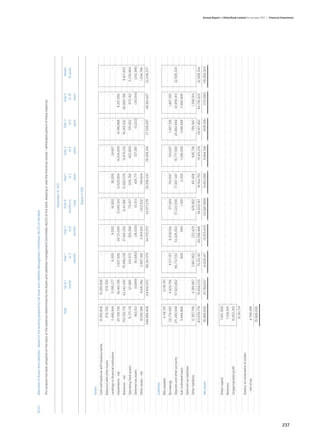
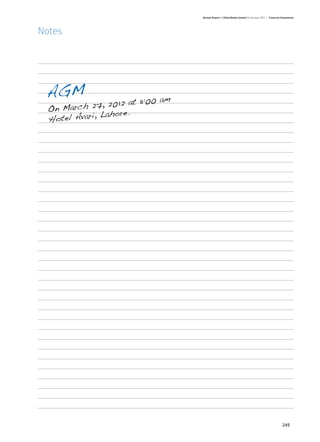
20. CAPITAL
SHARE
20.1
Authorized capital
December 31, December 31, December 31, December 31,
2011 2010 2011 2010
No. of shares Rupees in ‘000
1,500,000,000 1,000,000,000 Ordinary shares of Rs.10/- each 15,000,000 10,000,000
20.2 Issued, subscribed and paid-up capital
Fully paid-up Ordinary shares of Rs. 10/- each
December 31, December 31, Ordinary shares December 31, December 31,
2011 2010 2011 2010
No. of shares Rupees in ‘000
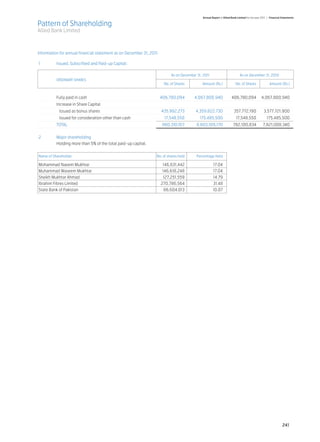
406,780,094 406,780,094 Fully paid in cash 4,067,801 4,067,801
435,982,273 357,772,190 Issued as bonus shares 4,359,823 3,577,722
842,762,367 764,552,284 8,427,624 7,645,523
18,348,550 Ordinary shares of Rs. 10 each, determined
pursuant to the Scheme of Amalgamation in accordance
with the swap ratio stipulated therein less 9,200,000
Ordinary shares of Rs. 10 each, held by Ibrahim Leasing
9,148,550 9,148,550 Limited on the cut-off date (September 30, 2004) 91,486 91,486
8,400,000 Ordinary shares of Rs. 10 each, determined
pursuant to the Scheme of Amalgamation of
First Allied Bank Modaraba with Allied Bank Limited
8,400,000 8,400,000 in accordance with the share swap ratio stipulated therein 84,000 84,000
860,310,917 782,100,834 8,603,110 7,821,009
Ibrahim Fibers Limited, related party of the Bank, holds 270,786,564 (31.4%) [December 31, 2010: 287,078,695 (36.71%)] ordinary shares
of Rs.10 each, as at date of Statement of Financial Position.
Note December 31, December 31,
2011 2010
Rupees in ‘000
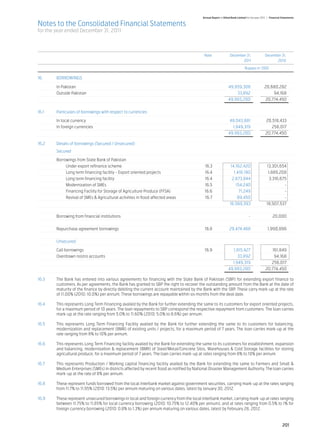
21. SURPLUS ON REVALUATION OF ASSETS - NET OF TAX
Surplus arising on revaluation of:
- fixed assets 21.1 3,629,110 2,765,036
- securities 21.2 2,090,336 2,043,369
Surplus on revaluation of assets - net of tax 5,719,446 4,808,405
21.1 Surplus on revaluation of fixed assets
Surplus on revaluation as at January 1, 2011 3,079,647 3,132,247
Surplus on revaluation during the year 11.2 928,659 -
Surplus realised on disposal of revalued properties - net of deferred tax - (5,303)
Transferred to unappropriated profit in respect of incremental
depreciation charged during the year - net of deferred tax (29,204) (30,743)
Related deferred tax liability 12.1 (15,728) (16,554)
11.6 (44,932) (47,297)
Surplus on revaluation as at December 31, 2011 3,963,374 3,079,647
Less: Related deferred tax liability on :
Revaluation as at January 1, 2011 314,611 331,165
Deferred tax liability on surplus on revaluation of fixed assets 35,381 -
Incremental depreciation charged during the year transferred to profit and
loss account 12.1 (15,728) (16,554)
334,264 314,611
3,629,110 2,765,036
112](https://image.slidesharecdn.com/ablannualreport20112-130207040218-phpapp02/85/Abl-annual-report-2011-2-114-320.jpg)


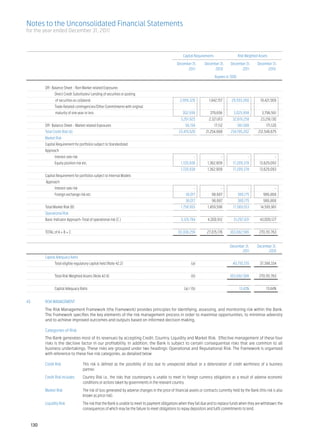
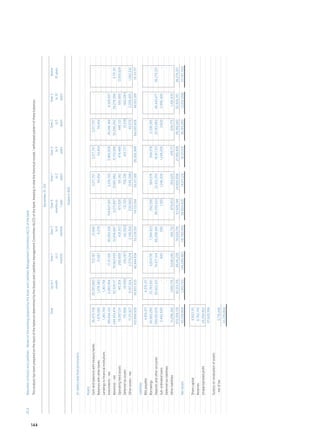

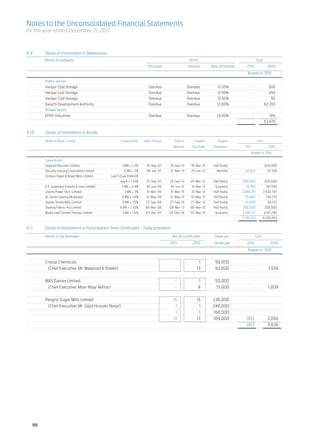
![Annual Report of Allied Bank Limited for the year 2011 | Financial Statements
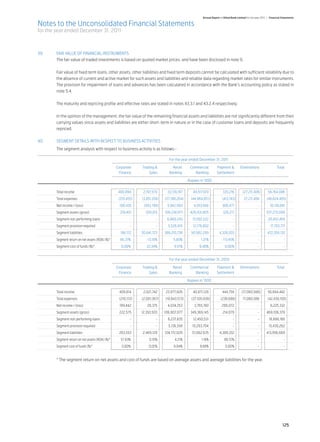
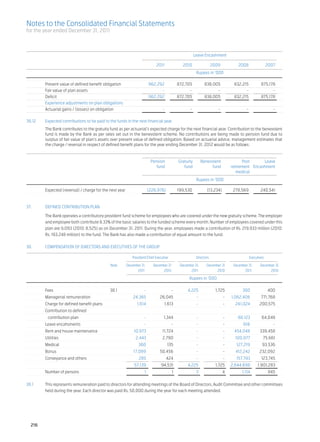
Notes to the Consolidated Financial Statements
for the year ended December 31, 2011
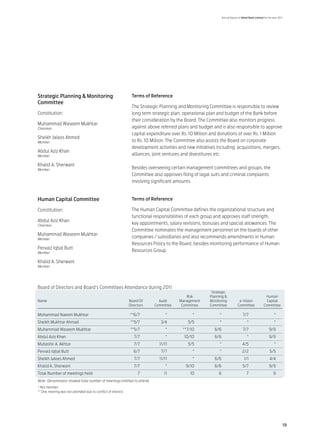
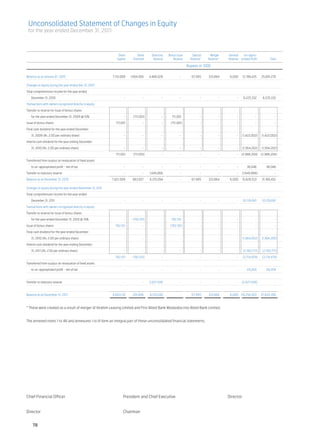
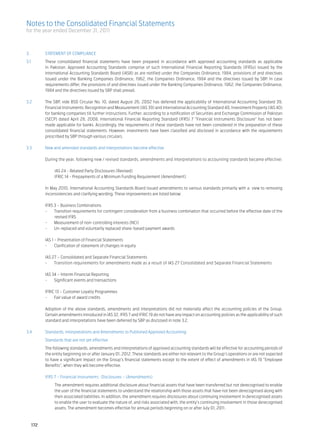
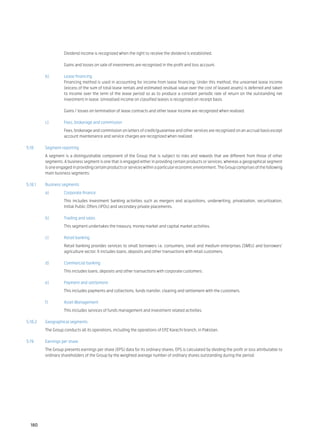
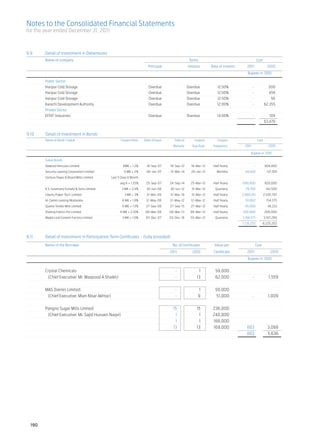
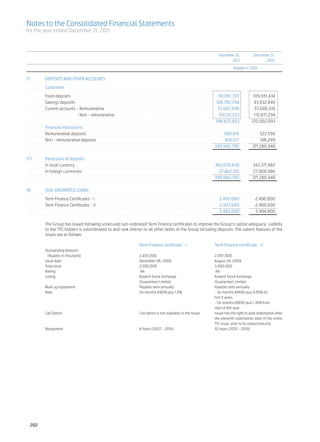
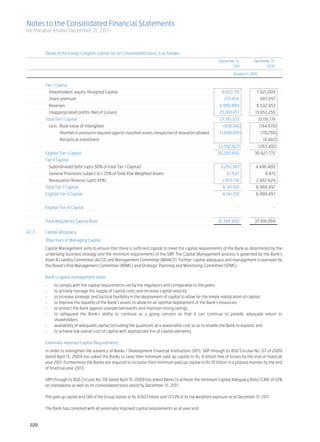
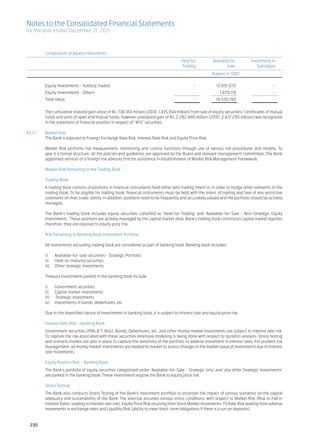
1. STATUS AND NATURE OF BUSINESS
The “Group” consists of:
Holding Company
Allied Bank Limited (“the Bank”), incorporated in Pakistan, is a scheduled Bank, engaged in commercial banking and related services.
The Bank is listed on all stock exchanges in Pakistan. The Bank operates a total of 837 (2010: 806) branches in Pakistan including the
Karachi Export Processing Zone Branch (overseas business unit). The long term credit rating of the Bank assigned by The Pakistan Credit
Rating Agency Limited (PACRA) is ‘AA’. Short term rating of the Bank is ‘A1+’.
The registered office of the Bank is situated at 8-Kashmir / Egerton road, Lahore.
Subsidiary Company
ABL Asset Management Company Limited, a wholly owned subsidiary of the Bank, is a public unlisted company incorporated in Pakistan
as a limited liability company on October 12, 2007 under the Companies Ordinance, 1984. The subsidiary company has obtained licenses
from the Securities and Exchange Commission of Pakistan (SECP) to carry out Asset Management Services and Investment Advisory
Services as a Non-Banking Finance Company (NBFC) under Non-Banking Finance Companies (Establishment and Regulation) Rules,
2003 as amended through S.R.O.1131[I] 2007 (the NBFC Rules, 2003). The subsidiary company received certificate of commencement
of business on December 31, 2007. The registered office of the subsidiary company is situated at 11-B Lalazar, M.T. Khan Road, Karachi.
The Management quality rating of the company, as assigned by JCR-VIS credit rating company limited, is AM2-.
ABL Asset Management company is managing following open ended funds:
- ABL-Income Fund Launched on September 20, 2008
- ABL-Stock Fund Launched on June 28, 2009
- ABL-Cash Fund Launched on July 31, 2010
- ABL-Islamic Income Fund Launched on July 31, 2010
- ABL-Government securities Fund Launched on November 30, 2011
2. (a) BASIS OF PRESENTATION
- These consolidated financial statements consist of holding company and its subsidiary company, for the year ended
December 31, 2011.
- In accordance with the directives of the Federal Government regarding the shifting of the banking system to Islamic
modes, the State Bank of Pakistan (SBP) has issued various circulars from time to time. Permissible forms of trade-
related modes of financing include purchase of goods by banks from their customers and immediate resale to them at
appropriate mark-up in price on deferred payment basis. The purchases and sales arising under these arrangements
are not reflected in these consolidated financial statements as such but are restricted to the amount of facility actually
utilized and the appropriate portion of mark-up thereon.
- These consolidated financial statements have been presented in Pakistan Rupees (PKR), which is the Group’s functional
and presentation currency. The amounts are rounded to nearest thousand.
- The US Dollar amounts reported in the consolidated statement of financial position, consolidated profit and loss
account and consolidated statement of cash flow are stated as additional information, solely for the convenience of the
users of financial statements. For the purpose of translation to US Dollar, the rate of Rs 89.9457 per US Dollar has been
used , as it was the prevalent rate as on date of statement of financial position.
(b) BASIS OF CONSOLIDATION
The assets and liabilities of subsidiary company have been consolidated on a line by line basis and the carrying value
of investment in subsidiary held by the Bank is eliminated against the shareholders’ equity in the consolidated financial
statements.
Material intra-group balances and transactions have been eliminated.
(c) BASIS OF MEASUREMENT
These consolidated financial statements have been prepared under the historical cost convention except that certain assets
and liabilities are stated at revalued amounts / fair values as stated in:
- Investments (Note 5.3)
- Operating fixed assets (Note 5.5)
171](https://image.slidesharecdn.com/ablannualreport20112-130207040218-phpapp02/85/Abl-annual-report-2011-2-173-320.jpg)


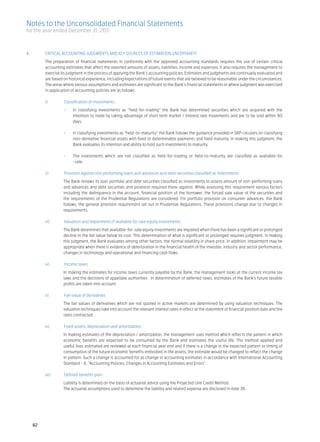
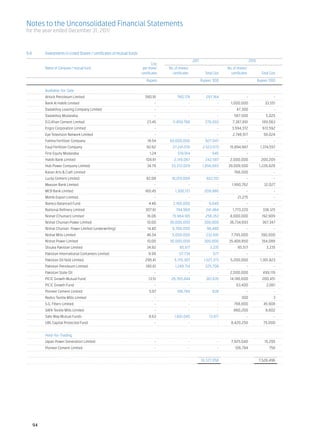
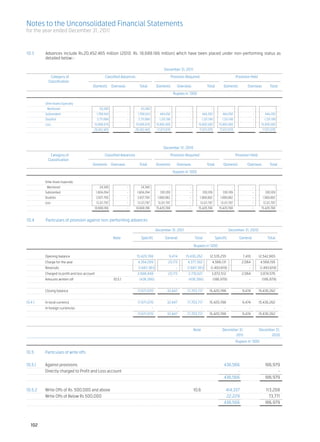
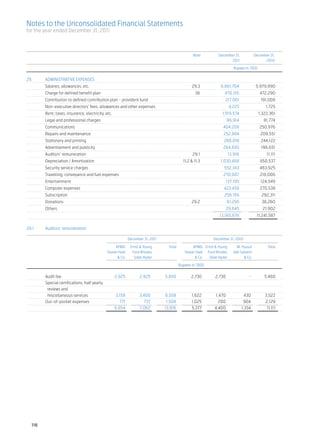
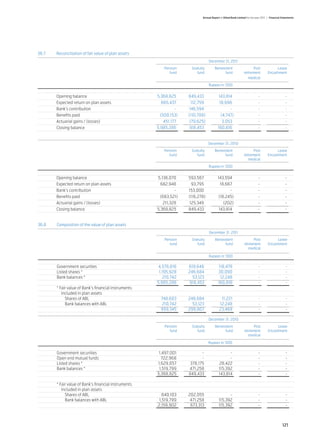
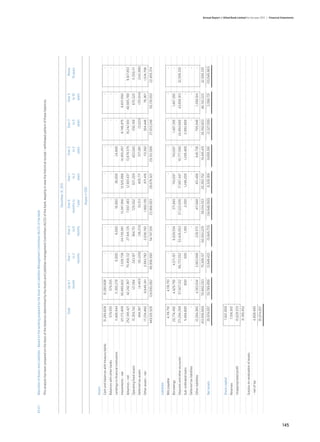
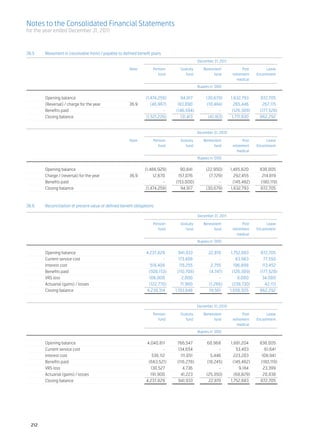
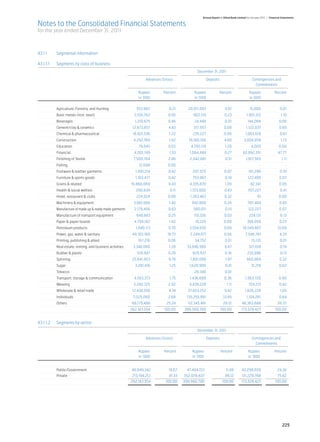
![Notes to the Consolidated Financial Statements
for the year ended December 31, 2011
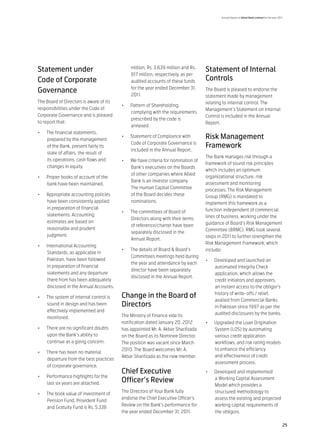
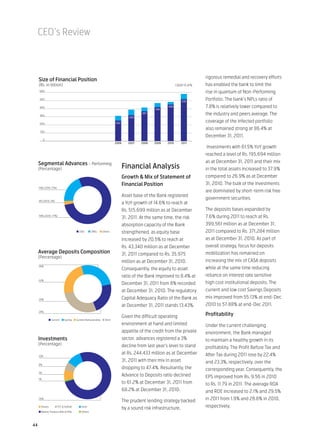
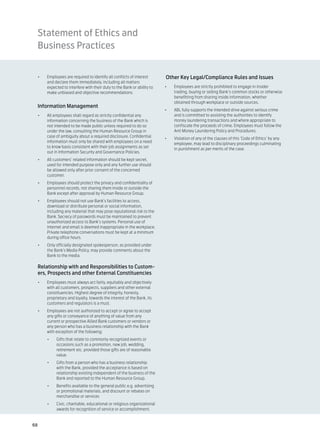
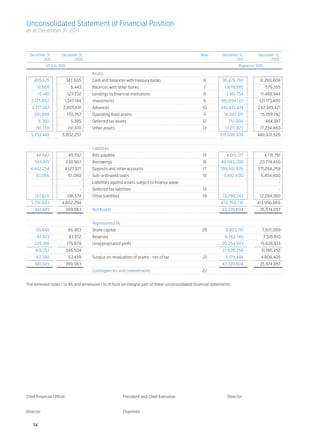
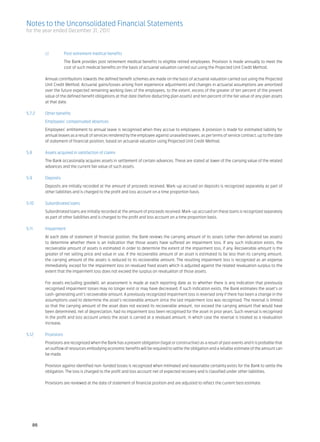
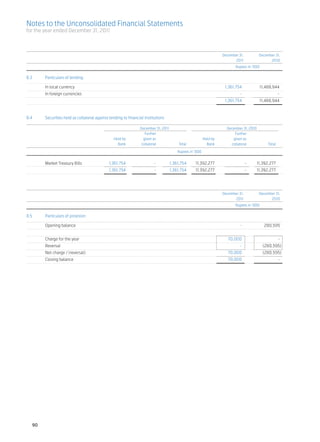
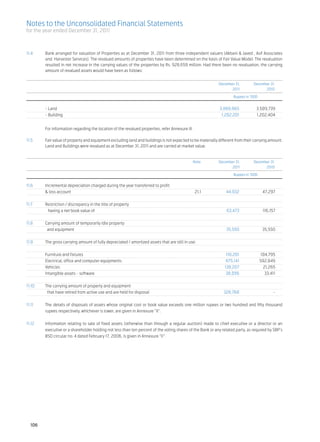
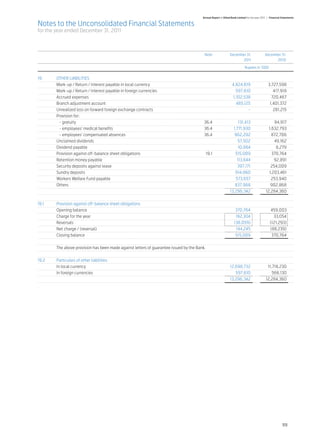
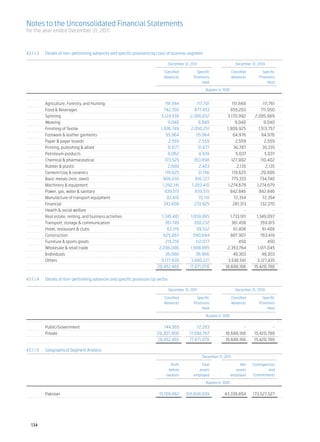
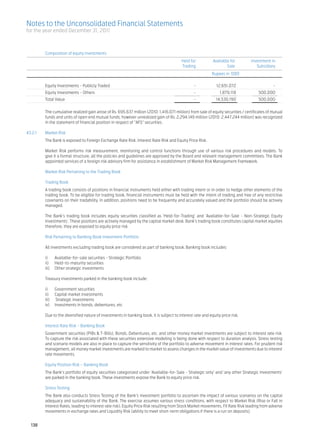
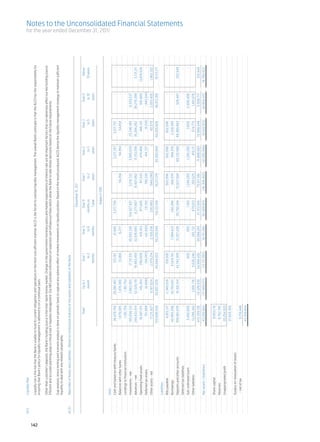
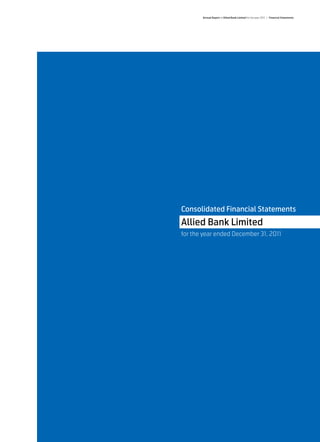
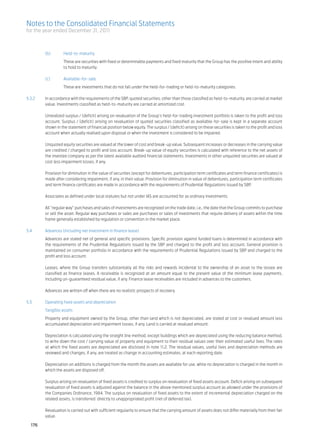
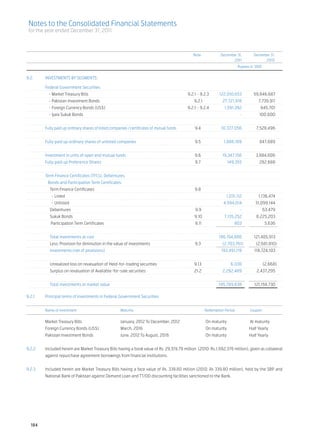
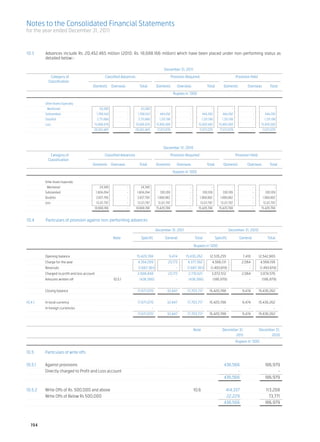
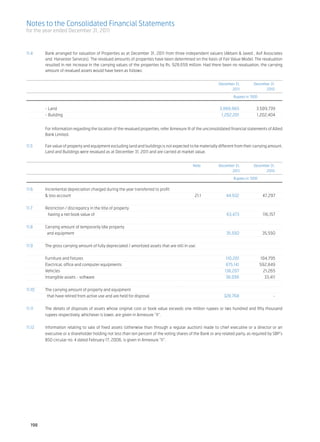
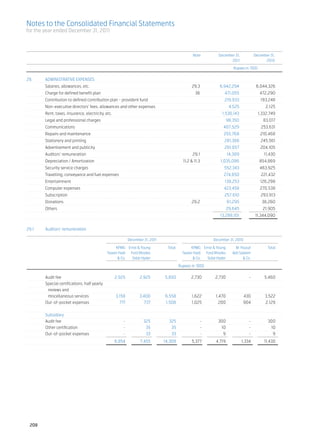
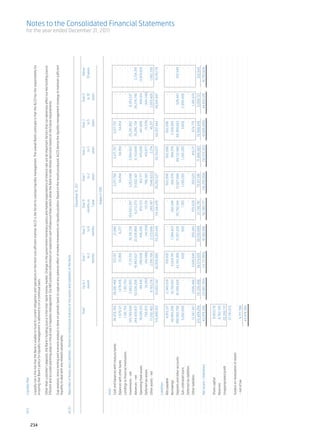
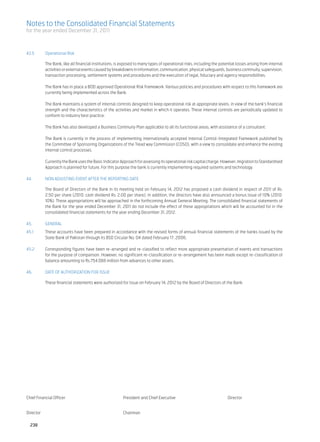
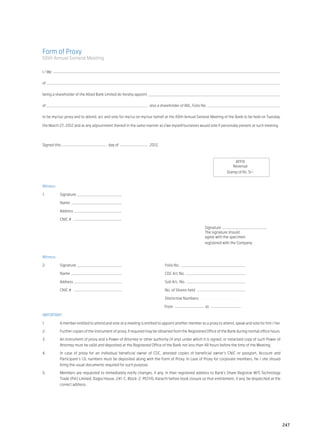
20. CAPITAL
SHARE
20.1
Authorized capital
December 31, December 31, December 31, December 31,
2011 2010 2011 2010
No. of shares Rupees in ‘000
1,500,000,000 1,000,000,000 Ordinary shares of Rs.10/- each 15,000,000 10,000,000
20.2 Issued, subscribed and paid-up capital
Fully paid-up Ordinary shares of Rs. 10/- each
December 31, December 31, Ordinary shares December 31, December 31,
2011 2010 2011 2010
No. of shares Rupees in ‘000
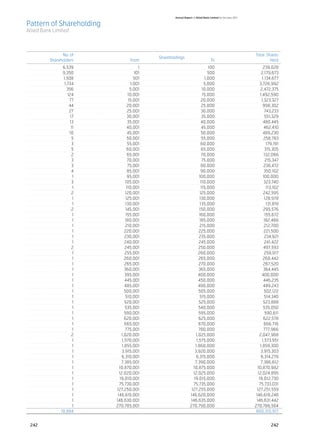
406,780,094 406,780,094 Fully paid in cash 4,067,801 4,067,801
435,982,273 357,772,190 Issued as bonus shares 4,359,823 3,577,722
842,762,367 764,552,284 8,427,624 7,645,523
18,348,550 Ordinary shares of Rs. 10 each, determined
pursuant to the Scheme of Amalgamation in accordance
with the swap ratio stipulated therein less 9,200,000
Ordinary shares of Rs. 10 each, held by Ibrahim Leasing
9,148,550 9,148,550 Limited on the cut-off date (September 30, 2004) 91,486 91,486
8,400,000 Ordinary shares of Rs. 10 each, determined
pursuant to the Scheme of Amalgamation of
First Allied Bank Modaraba with Allied Bank Limited
8,400,000 8,400,000 in accordance with the share swap ratio stipulated therein 84,000 84,000
860,310,917 782,100,834 8,603,110 7,821,009
Ibrahim Fibers Limited, related party of the Bank, holds 270,786,564 (31.4%) [December 31, 2010: 287,078,695 (36.71%)] ordinary shares
of Rs.10 each, as at date of Statement of Financial Position.
Note December 31, December 31,
2011 2010
Rupees in ‘000
21. SURPLUS ON REVALUATION OF ASSETS - NET OF TAX
Surplus arising on revaluation of:
- fixed assets 21.1 3,629,110 2,765,036
- securities 21.2 2,088,676 2,033,420
Surplus on revaluation of assets - net of tax 5,717,786 4,798,456
21.1 Surplus on revaluation of fixed assets
Surplus on revaluation as at January 1, 2011 3,079,647 3,132,247
Surplus on revaluation during the year 928,659 -
Surplus realised on disposal of revalued properties - net of deferred tax - (5,303)
Transferred to unappropriated profit in respect of incremental
depreciation charged during the year - net of deferred tax (29,204) (30,743)
Related deferred tax liability 12.1 (15,728) (16,554)
11.6 (44,932) (47,297)
Surplus on revaluation as at December 31, 2011 3,963,374 3,079,647
Less: Related deferred tax liability on :
Revaluation as at January 1, 2011 314,611 331,165
Deferred tax liability on surplus on revaluation of fixed assets 35,381 -
Incremental depreciation charged during the year transferred to profit and
loss account 12.1 (15,728) (16,554)
334,264 314,611
3,629,110 2,765,036
204](https://image.slidesharecdn.com/ablannualreport20112-130207040218-phpapp02/85/Abl-annual-report-2011-2-206-320.jpg)


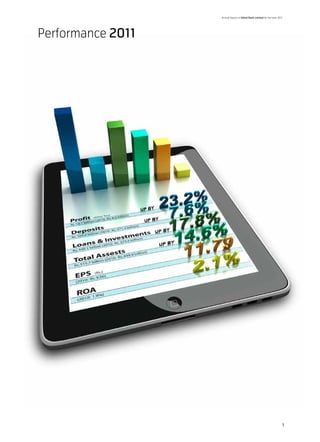
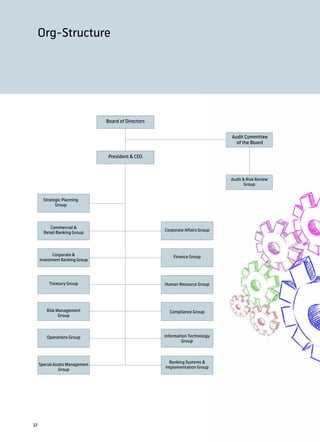
The 2011 Annual Report of Allied Bank Limited provides an overview of the bank's performance for the year. It discusses the bank's vision, mission, core values, board of directors, management team, and financial highlights for 2011. The Chairman's Message notes that despite challenges, the bank maintained its focus on clients and continued progress by delivering value-added services.


