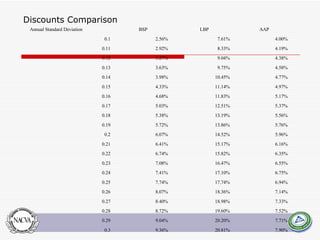
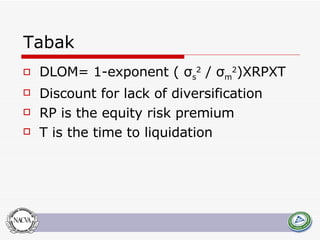
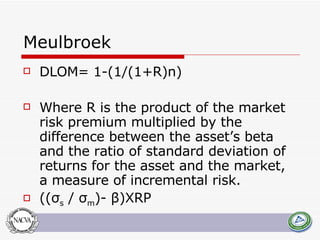
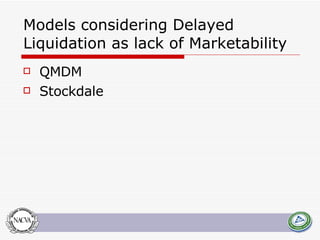
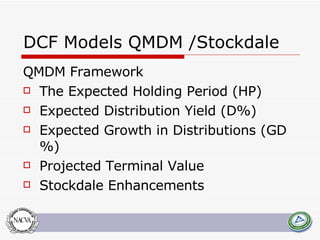
This document summarizes and compares several quantitative models for estimating discounts for lack of marketability (DLOM) and liquidity. It defines key concepts like marketability, liquidity, and degrees of marketability. It then describes several DLOM models including the QMDM, Silber, Bajaj, Abbott, Tabak, Meulbroek, and option-based models like Black-Scholes put, average price Asian put, and lookback put. The document estimates potential DLOM discounts under different volatility and time assumptions using these models for comparative analysis.


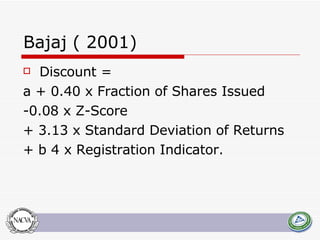
![Silber Model LN (RPRS) = 4.33 + 0.036 LN (REV) - 0.142 LN (RBRT) + 0.174 DERN - 0.332 DCUST LN (RPRS) is natural logarithm of the relative price of restricted stock expressed in percentage terms [(p*/p) • 100]. LN (REV), the natural logarithm of the firm's revenues (in millions); LN (RBRT), the natural logarithm of the restricted block relative to total common stock (in per cent); DERN, a dummy variable equal to one if the firm's earnings are positive and equal to zero otherwise; and DCUST, a dummy variable equal to one if there is a customer relationship between the investor and the firm issuing the restricted stock and zero otherwise.](https://image.slidesharecdn.com/abbottdisclackmarketabilitypresentation2-124217920101-phpapp02/85/Abbott-Disc-Lack-Marketability-Presentation-2-11-320.jpg)
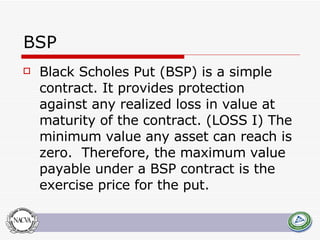
![BSP P(T) = e -rT N(-d2)- N (-d1) Where d1= [(r+σ2/ 2) T]/ σ T And d2 = d1- σ T The estimated BSP discount for lack of liquidity then becomes P(T)/[1+P(T)]](https://image.slidesharecdn.com/abbottdisclackmarketabilitypresentation2-124217920101-phpapp02/85/Abbott-Disc-Lack-Marketability-Presentation-2-22-320.jpg)
![BSP Basics σ is the standard deviation for the returns computed for the same d1= [Lognormal(S/K) + (r+σ 2 / 2) T]/ σ T d2 = d1- σ T And N(-d1) and N(-d2) are the Normal cumulative distribution probabilities Setting S=K=1](https://image.slidesharecdn.com/abbottdisclackmarketabilitypresentation2-124217920101-phpapp02/85/Abbott-Disc-Lack-Marketability-Presentation-2-23-320.jpg)
![Finnerty model :Asian Average Put D(T) = V[ e rt N(r/ T + T / 2) –N (r/ T - T / 2)] and 2 = σ 2 T + Ln [2( e σ2 T - σ 2 T -1)] - 2 Ln [ e σ2 T -1]](https://image.slidesharecdn.com/abbottdisclackmarketabilitypresentation2-124217920101-phpapp02/85/Abbott-Disc-Lack-Marketability-Presentation-2-24-320.jpg)
![Finnerty Model Discount Once again setting V to 1, D(T) becomes [ e rt N(r/ T + T / 2) – N (r/ T - T / 2)] and the corresponding discount for lack of liquidity becomes D(T)/ 1+ D(T)](https://image.slidesharecdn.com/abbottdisclackmarketabilitypresentation2-124217920101-phpapp02/85/Abbott-Disc-Lack-Marketability-Presentation-2-25-320.jpg)