This document contains the proceedings from the Sixth International Symposium on Interaction of Nonnuclear Munitions with Structures, held from May 3-7, 1993 in Panama City Beach, Florida. It includes over a dozen papers on topics related to the effects of conventional weapons on structures, such as empirical equations for projectile penetration of concrete, modeling of projectile penetration into geologic targets, blast environments from internal detonations of warheads, and materials for external protection of structures. The symposium was sponsored by the Wright Laboratory Airbase Systems Branch and coordinated by Applied Research Associates, Inc.


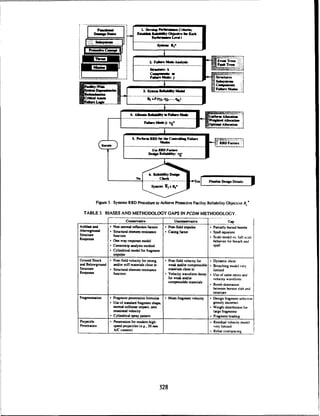
![the field of drilling. There are two solutiun schemes that Upper-boundsolution
are usually followed. The first is a lower-bound solution
where only equilibrium and yield (or material failure) are An upper-bound solution based on the Prandtl
considered, with no consideration of kinematics, [2]. The mechanism is derived here, [6]. Figure 3 shows this
second solution scheme is an upper-bound solution mechanism adjacent to the nose of the projectile. The
where the velocity (kinematics) and strain boundary mechanism consists of a log-spiral shear zone (ACD),
conditions are satisfied and resisting stresses are and a constant stress passive zone (ADE). The resisting
determined by equating the rate of work done by the stress, P, can be calculated by setting the rate of work
penetrator to the rate of energy dissipation on slip done by the projectile, W, equal to the rate of energy
surfaces, [3]. In this study during the restrained dissipation in the target material:
penetration stage of penetration, a lower-bound solution
is used. During the fully developed flow, an upper-bound WP= + E + ,z +W. (8)
solution is utilized.
Lower-bound solution where
The lower-bound solution used in this study is that 1 = Rate of energy dissipation due to
developed by Pariseau, and Fairhurst, [4]. In their friction along the nose length, AC.
analysis of wedge penetration in a plastic material they Ego Rate of energy dissipation along the
derived the following equation for resisting stresses, P,: log-spiral zone, CD.
11 = Rate of energy dissipation along the
. 1 cos2e(1 +cotStan20)sin0 exp (21tano) - passive zone, DE.
tan2,} tanj3 = Rate of work done to move
2tanotanIL (6) pulverized material up around the aft
body.
where the angles e, 13,
g, and Eare shown in Figure 2.
- b-=.
J -7
'
SHEAR ZONE Cf
Fig. 3. Assumed slip line field and velocity diagram.
Fig.2. Slip line field around the nose of the projectile.
6 is related to the angle of interfacial friction 0' through Expanding each term of Eq. (8) and simplifying
the following equation, [5]: leads to the following equation for pressure acting
normal to the surface of projectile:
P.=. No +(d - d.) .y -N
(9)
No
where C = cohesion of the target
material, where
= friction angle between N = exp(2ttano) (coso + coto) - coto, (10)
projectile and target material,
a = mean stress in the plastic
material, and
a /P No = sing tan-' (11)
2 -- sing3 + cosf3tano' tan3 + tano'
8](https://image.slidesharecdn.com/a276170-221126090128-e06297b7/85/a276170-pdf-17-320.jpg)


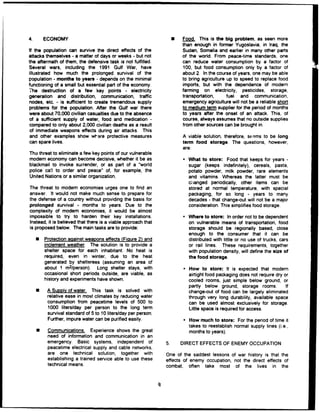
![The effects of layering interfaces on projectile REFERENCES
penetration are caused by the reflected waves that travel
back towards the projectile. In targets that have relatively [1] Heuze, F. E., An Overview of Projectile Penetration
thin layers like concrete screens, the reflected waves may Into Geologic Materials, with Emphasis on Rocks,
impart large enough forces on the projectile to cause Int. J. Rock Mech. Min. Sci. Vol 27, No. 1, 1990.
additional deviation in the path of the projectile. [2] Chen, W. F., and A. P. Pan, Finite Element and
At present the lower and upper bound equations Finite Block Methods In Geomechanics, Purdue
are being analyzed to include non-normal penetration. University, Civil Engineering Report CE-STR-90-20,
Wave propagation effects are also under study. The p. 3, 1990.
results of the final model will be presented in a future [3] Ibid, p. 4.
paper. [4] Pariseau, W. G., and C. Fairhurst, The Force
Penetration Characteristic for Wedge Penetration
Into Rock, Int. J. Rock Mech. & Min. Sci., Vol. 4,
pp. 165 - 180, 1967.
/ "-
cm [5] Ibid, p. 170.
[61 Chen, W. F., Developments in Geotechnical
/M OF• •
l•aDE
°Engineering 7, Limit Analysis and Soil Plasticity,
Elsevier Scientific Publishing Co., Amsterdam,
C 1975.
Figure 7. Slip surfaces in non-normal penetration.
CONCLUSIONS
A theoretical model was developed for prediction
of projectile penetration in geologic materials based on
energy tracking and the impulse-momentum principle.
The model was developed by analyzing the various
stages of penetration separately and then coupling them
together to calculate resisting stresses on the projectile,
and displacement, velocity and deceleration of the
projectile as a function of time. The coupled model was
then applied to two field experiments in different
materials. The comparison indicated good agreement
between predictions and experimental observations.
The governing equations were developed for
normal penetration. However, the assumptions leading
to these equations are also valid for non-normal
penetration. As a result a procedure was developed for
prediction of the projectile path in two dimensions. This
procedure can be used with the governing equations
presented in the paper after modifications are made to
include the angle of attack, &, in the equations.
ACKNOWLEDGEMENTS
UTD, Inc. expresses gratitude to the Tyndall AFB
for sponsoring the work described in this paper. The
contributions made by Drs. Eugene Foster and Steve
Majtenyi of UTD are also acknowledged.
11](https://image.slidesharecdn.com/a276170-221126090128-e06297b7/85/a276170-pdf-20-320.jpg)
![ANALYSIS OF ROCK-RUBBLE OVERLAY PROTECTION OF STRUCTURES
BY THE FINITE BLOCK METHOD
Joseph M. Gebaral, Austin D. Pan',
Jon B. Anderson2
,
'School of Civil Engineering, Purdue University, West Lafayette, IN 47907-1284
2
HQ Air Force Civil Engineering Support Agency, Survivability Branch,
Tyndall Air Force Base, FL 32403-5519
ABSTRACT
Rock-rubble overlays have shown to be effective in stopping, de- rn•.tr.timo Poroectil.
flecting, or breaking impacting projectiles. In this paper, the Fi- *ock Rb.
nite Block Method, along with an energy approach to the dynamic / -c bI
fragmentation of rocks, is used to model the penetration problem.
The Finite Block Method is a discrete element method based on
the minimization of the total energy of the block system. The -
analysis follows fundamental physical principles and shows that
the Finite Block Method is able to simulate a penetration problem Earth Hound
with results comparable to experimental observations described in -Shelter Structur
the literature.
Figure 1: Typical example for the use of rock rubble
INTRODUCTION
Burster slabs used to protect underground facilities from threaten- Experiments by: the Air force Civil Engineering Support
ing penetrating projectiles are inordinately expensive and unable Agency, Tyndal AFB, Florida; the U.S. Army Engineers Wa-
to be easily and quickly repaired after withstanding repeated hits. terways Experiment Station, Vicksburg, Mississippi; the Naval
On the other hand, rock-rubble overlays (Fig. 1) have the poten- Weapons Center, China Lake, California; and, the Air Force Ar-
tial to overcome the above mentioned drawbacks. However, more mament Laboratory, Eglin AFB, Florida, have shown that the
in-depth understanding of this defensive mechanism is needed, es- protective potential of the rock-rubble overlay depend to a great
pecially for categories II and Ill weapons, (see Table 1). Numeri- extent on the characteristics of the weapon against which the
cal, analytical, and empirical investigations have been conducted structure is to be protected. These characteristics include: length
on rock-rubble overlay protection systems [1]-[2]. The numeri- to diameter (L/D) ratio, sectional pressure (W/A), caliber or di-
cal methods developed in the past are limited by using simplified ameter (D), thickness of walls, material strength and fracture
fracturing schemes and by modeling the rock rubble as a uniform thoughness of the case. Test results have also shown that the
mesh of octagons [2]. A good numerical simulation of the pen- dominant mechanism of defeat depends on the characteristics of
etration mechanism will save valuable time and resources from the boulder pile such as: rock size, rock unconfined strength, num-
field experiments and provide insight for improving fortification ber of layers, and filler materials (sand and grout fillers have been
design. In this paper, the Finite Block Method is introduced to tested).
model rock rubble penetration and rock fracture based on funda- Rock rubble overlays have proved to be effective in breaking.
mental physical principles, up category I weapons due to triaxial loading or disarming them
by fuze disruption. On the other hand, rock rubble overlays were
BACKGROUND less effective with category II and III weapons since they are un-
likely to break because of their short L/D ratio and their high
Rock-rubble overlays have been proposed as an alternative to strength case. However, due to the short L/D, such projectiles
burster slabs for protecting underground installations from high may rotate significantly and tumble in the boulder pile. There-
kinetic energy penetrating projectiles. To understand the effec- fore the function of the boulder screen in this case is to reduce
tiveness of the rock-rubble overlay it is important to start by the depth of penetration by increasing the rotation and tumbling
identifying the threat weapon. Rohani [31 divided the weapons of the penetrator.
of interest into three categories, (Table 1). Where L, D, W, and The basic mechanisms involved in this defensive process are:
A are respectively the length, the diameter, the weight, and the the high probability of non-normal impacts will induce large obliq-
cross-sectional area of the penetrator. Whereas GP, AP, and SAP uity and yaw angles which will cause the projectile to deflect from
stand for general purpose, armor-piercing and semiarmor-piercing its original path; the fragmentation of rocks will result in a sudden
respectively. increase in the stress fields that is resisting the projpctile motion
12](https://image.slidesharecdn.com/a276170-221126090128-e06297b7/85/a276170-pdf-21-320.jpg)
![Category Weapon Type Characteristics vX - 0.0
I GP weapons Low to moderate L/D;, vy - 3000.0
Low WV/A; wxy - 0.0
Thin walls;
Low strength;
Low fracture toughness.
II SAP weapons Low to moderate L/D;
Moderate W/A;
Thick walls;2
Mild steel. 0
Ir, AP weapons Moderate to high L/D;
High W/A
Thick walls; 24 I
High strength ;
High fracture toughness
Table 1: Categories of weapons 212
thus promoting loss of velocity (thus loss of energy) and projec-
tile rotation; the moving of boulders in different directions will
also lead to the loss of energy. The above list of mechanisms is
not inclusive but it shows that the rock-rubble overlay has good
potential of defeating the penetrators. Figure 2: Finite Block Model
THE FINITE BLOCK METHOD based and uses hard contacts which better represents the contact
Researchers have approached the solution of the above described between rocks and between rocks and penetrator [7]. Moreover.
penetration problem from three different techniques: analytical, the representation for the displacement and velocity vectors by
empirical and numerical. The heterogeneous nature of rock rub- FBM directly gives strains, strain-rates and stresses that are nec-
bles and their complex constitutive behavior are definite obstruc- essary for implementing a fracturing scheme which is a major
tions to the application of analytical and empirical methods. Al- contribution of the present work.
though these methods have been used with some measure of suc-
cess, only numerical methods are credible in modeling structural DYNAMIC FRACTURE OF ROCK
analysis of rock-rubble overlays.
The method of Discrete Deformation Analysis (DDA) devel- The concept of dynamic fracture of flawed brittle material such
oped by Shi and Goodman [41 is the precursor of the Finite Block as rocks has been extensively studied by Grady and Kipp [9]. It
Method (FBM) which is a name coined by W.F.Chen (5] to bet- is basic to this concept to distinguish between the response of a
ter describe the present analysis. Chen recognized the essence single crack and the response of a system of cracks to impulsive
of these computer-based methods in extending limit analysis [6] loading. Experimental studieo of fracture under high strain rates
techniques to frictional materials, have revealed unusual features associated with the fracture phe-
Shi and Goodman [4] provides a complete kinematic theory nomenon, such as greatly enhanced material strength and fracture
that enables a large assemblage of blocks to undergo large defor- stress dependence on loading conditions. Grady and Kipp [9] dis-
mations under loading or unloading conditions without the over- cuss two theoretical descriptions of dynamic fragmentation which
lapping of one block onto another (Fig. 2). A system of equi- they describe as not compatible. The first is explicitly based on
librium equations for the block assemblage can then be derived the concept of a distribution of flaws that act as points of frac-
through the minimization of the total energy of the system (i.e. ture initiation. The second has no recourse to a flaw distribution:
potential, strain, frictional). These equations are solved itera- fragment size is based strictly on energy balance considerations.
tively in each time interval until the constraints of no-overlap and In the latter approach a tacit assumption of some sufficient flaw
no-tension between blocks are satisfied. At the end of each itera- distribution is implied. For the rock rubble problem where rocks
tion. external and internal equilibrium are satisfied for each block, are mined from quarries this assumption is satisfied.
and Coulomb's Law of friction is fulfilled at all contact points. A In his energy balance analysis Grady [10] states that it is rea-
major advantage this procedure offers is its ease in modeling a sonable to assume that if the material has sufficient flaws ("fa-
discontinuous block medium as an assemblage of convex, concave vorably disposed") a reasonable prediction of the dynamic spall
or even multi-connected polygons. strength (P,), the time to failure (t,), and the nominal fragment
The above characteristics of the Finite Block Method form the size (s) created in the spall event can be given by Eqs. (1)(3.)
basis for chosing this method to simulate the penetration and frag-
mentation phenomena as opposed to other discrete element and P. = (3pc0 K1 ()1/3 (1)
finite element approaches. The rock-rubble boulder can be easily
modeled by the Finite Block Method; and the method is energy-
13](https://image.slidesharecdn.com/a276170-221126090128-e06297b7/85/a276170-pdf-22-320.jpg)
![dynamic fragmentation and presented an excellent review of the
background of important earlier works.
There appears to be general agreement over the application of
geometric statistical fragmentation in one dimension - namely,
the random distribution of points which partition the line into a
distribution in fragment lengths. On an infinite line. the position
of the points is a Poisson variate and the only parameter is the av-
erage number of points per unit length which is expected to relate
to the intensity of the fracturing load. In contrast, there is ap-
parently no agreement on the application of geometric statistics
to the random partitioning of two and three dimensional bod-
ies. Although it is generally agreed that the random placement
in the space is Poisson, there are a variety of partitioning con-
structions which can be formed with these points. The theory of
Mott [15], for example, differs fundamentally from that of Gilvarry
[16] which also differs from that of Grady and Kipp [12], even
though all of them start with a Poisson process. Other common
constructions which have been explored extensively include the
Voronoi and the Johnson-Mehl [121. Such statistical fragmenta-
tion methods have been broadly applied in other areas of science
Figure 3: Example of Voronoi fragmentation including metallurgy, geology, and biology. Different statistical
constructions have been found to provide different fragment size
distributions and consequently it becomes necessary to rationalize
a particular choice to each application.
S1
r.3,'c]~2/3 In the present rock rubble study the Voronoi construction
= o j"[ 0(2) (Fig. 3) is chosen. The Voronoi construction uses perpendicu-
CO1Pco ] lar bisectors between the random points to partition the block
2/3 area [17]. Although this construction produces strongly centered
s 2 p C0 (3) fragment sizes [121, with a lag of the larger and smaller fragments
that are usually found in dynamic fragmentation, preliminary rock
Experimental evidence shows [11] that under high strain rates rubble penetration experiments appear to show that the fragment
these spall properties are less sensitive to microstructural details shapes are well represented by a Voronoi construction. Crain [18]
of the material, but depend more on a balance of the driving noted that "the perimeter and area are highly correlated show-
energy in the transient stress wave loading and some continuum ing that the polygon shapes tend to be equant or quasicircular
measure of fracture dissipation such as fracture toughness, surface rather than elongated". Moreover, the Voronoi construction is
tension or flow stress. extensively used for a wide range of applications including finite
In the present rock rubble problem, most rocks can be easily element mesh generation [19] and computer graphics [20].
considered as "favorably disposed" for fracture and the impacting
projectile will create high strain rates in the rocks. Thus the PROPOSED FRAGMENTATION
energy approach derived above is ideal for incorporation into the
Finite Block Method. PROCESS
It is important to note that the size of the rocks considered
DYNAMIC FRAGMENTATION in the rock rubble fortification problem is about three times the
diameter of the penetrator; hence the analysis is different from
The geometric modeling of fragments is an important part of a penetration problem where a projectile impacts a continuum
the present work since impact dynamics depends not only on the which is relatively large in size and where upon impact the pen-
size and fracture toughness of the impacting bodies, but also on etrator becomes embedded in the continuum. In the case of the
their shape. Unfortunately, the literature has focused more on system being analyzed, the projectile proceeds in a succession of
achieving a better understanding of the distributions in particle impact and fracturing of rocks that come into its path of pene-
size which result from severe fragmentation ([12]-[141), and have tration. The velocity of the projectile ranges between 1000 ft/sec
tended to ignore any description of the shape of the fragments. In and 2 500 ft/sec, thus upon impact a high stress level is reached
this section a brief overview of this work will be given from which in the rocks, leading some rocks to severe fragmentation.
the choice of theVoronoi construction approach for the present Impact between two or more bodies is known to go through
work will be explained. three stages. In the first stage, upon impact, each of the bodies
Statistical and physical principles underlying the dynamic will start to contract under a certain strain rate thus acquiring in-
fragmentation process have been substantially explored in the lit- ternal kinetic and elastic energy. The contraction will continue to
erature [121. Numerous ideas have been pursued which are clearly the point of maximum deformation which isstage two where there
related to observed fragmentation phenomena. However, a com- is zero kinetic energy and maximum elastic energy. In the third
plete theory of dynamic fragmentation is not yet available, and stage, depending on the material properties and the strain rates,
in many cases observed phenomena lack even a good explanation. solid bodies will either regain their original shape, stay perma-
Grady and Kipp [12] have focused on the statistical nature of nently deformed, or even fracture. It is worth noting that only in
14](https://image.slidesharecdn.com/a276170-221126090128-e06297b7/85/a276170-pdf-23-320.jpg)
![the nominal fragment size created by the spall process is approx-
vx - 63.26 imated by Eq. (3) and used to distribute N Poisson points inside
wxy--10.9 the fractured block element. N being the ratio of the area of the
fractured block to the nominal fragment area.
The Poisson points will form the basis of the Voronoi con-
struction that partitions the fractured block into a collection of
randomly shaped polygons. Each polygon is then given an initial
velocity th.t results from the kinetic energy not used to fuel thle
I fragmentation, referred to as the Kinetic Energy Difference. The
3 6 Finite Block analysis of the system is then continued to the next
contact, impact, and fracture progression. This process is con-
24 1 11tinued until the projectile stalls or penetrates through the rubble
a layers.
9• 3The Kinetic Energy Difference can be calculated by noting
1 that the total kinetic energy K.E. of a sphere expanding with a
t2120 strain rate i can be represented by
K.E. = 8 f j p .
r2 (r2 sin(d)drdO do) (6)
is
which is equivalent to
Figure 4: Finite Block Analysis without fragmentation K.E. = •2 (7)
Using the kinetic energy available for fracture from Eq. (8):
the case of perfectly elastic impact the total energy of the system 10p2 2 (8
is conserved. In the general case where elasto-plastic or plastic T 1---20 (8)
impact takes place, the coefficient of restitution is not unity, lost
energy is transformed into creating new fracture surfaces, generat- after multiplying it by the volume of the sphere since Eq. (8) repre-
ing elastic waves within the colliding bodies, as well as generating sents the kinetic energy density, the product will give the Kinetic
heat. Energy Difference K.E.D. as:
Thus in the restitution period, failure or rupture of condensed 1 .2
rock may occur due to stresses in excess of the tensile strength K.E.D. = 90ri s p (9)
- a process which is referred to as the spall process. The spall The Kinetic Energy Difference is used to initiate the dispersion
process becomes fairly complex under transient loads, especially velocity of the fragments. By equating K.E.D. to (I IIv) the
when the load leads to high compression before the material is 2
carried into tension. The material is thus in a state of tensile velocity v of each fragment can be calculated by:
stress that is intrinsically unstable and small perturbations can F2
lead to the opening of voids and initiation of the spall process. V = i S (10)
The threshold tensile stress at which void nucleation occurs
and spall fracture initiates, the time at which the threshold ten-
sile stress is reached, and the nominal size of the fragments were joins the center of gravity of the fragment to the equivalent center
derived by Grady [10] and are presented by Eqs. (1), (2) and (3), of gravity of the fractured block.
respectively.
In the rock rubble analysis, the Finite Block Method contin- ILLUSTRATIVE EXAMPLE
ues without fracture until contact between the penetrator and a AND DISCUSSION
boulder element occurs and a critical strain rate is reached. At
this strain rate the strain energy density U, needed for fracture is To illustrate the fragmentation process, a penetrator (E = 29x10
6
calculated using: 0b/in 2
, v = 0.30, and p = 0.28404 lb/in
3
) with an initial ve-
U, = 68...2c (4) locity of 15000 in/sec impacts an igneous rock rubble that has
62cot the following material properties: E = 14x10
6
lb/in
2
, v = 0.25.
where t is the time after contact and - = K
2
/(2pc2) is the frac- p = 0.102 lb/in
3
, and K1(= 7.764xi0
3
lb/in
3
/
2
.
ture surface energy density per unit area. In this process it is Knowing that the spall process appears at strain rates that
assumed that the strain rate in compression has the same order range between 10' /sec and 104 /sec. a strain rate of 103 /sec was
of magnitude of the strain rate in tension, thus the material will used in Eq. (2) to approximate the spall fracture time for the
expand at the same strain rate as it was compressed. U, is com- igneous rock at 6 psec. Thus a time step of the order of 1 it sec
pared to the elastic energy density U found in the Finite Block is needed for the analysis. A maximum displacement of 0.005
elements which can be written as: in. per time step and a contact spring stiffness of 109 lb/in wore
B0 i
2
t2 set for the Finite Block analysis. Note that fragmentation of the
U= 2 (5) projectile was not considered and that double precision on a 32-
bit SUN Sparcstation was used to minimize the effect of round-off
Fracture will occur when U > U,. After checking for fracture, errors.
15](https://image.slidesharecdn.com/a276170-221126090128-e06297b7/85/a276170-pdf-24-320.jpg)

![(7] CUNDALL, A.P. and ROGER, D.H., 'Numerical Modeling
of Discontinua,' Proc. of 1" U.S. Conference on Discrete
vx - -44.2 Element Methods, Golden, Colorado, (1989).
vy - -1
4
150.0
wxy--26.8 [8] SHI, G.H., 'Discontinuous Deformation Analysis: A New
Numerical Model for the Statics and Dynamics of Block Ss-
tems.' Ph.D. Dissertation. Department of Civil Engineering.
University of California at Berkeley, 1988.
'2
21 1 5 •[9] GRADY, D.E., and KIPP, M.E., 'Mechanics od Dynamic
Fragmentation Factors Governing Fragment Size,' Sandia
National Laboratories, Rept. SAND 84-2304C, 11984).
2S 2[10] GRADY, D.E., 'The Spall Strength Of Condensed Matter.'
J. Mech. Phys. Solids, 36(3), pp. 353-384, (1988).
[11] GRADY, D.E., 'Analysis of Prompt Fragmentation in Ex-
plosively Loaded Uranium Cylindrical Shells,' Sandia Na-
tional Laboratories. SAND 82-0140, (1982).
112] GRADY, D.E., and KIPP, M.E., 'Geometric statistics and
dynamic fragmentation,' Journal of applied physics, ,58(3),
pp. 1210-1222, (1985).
Figure 6: Penetrator before second contact is already starting to [13] TAKAGI, Y., MIZUTANI, H., and KAWAKAMI, S., 'In-
deflect pact Fragmentation Experiments of Basalts and Pyrophyl-
lites,' Icarus, L9, pp. 462-477, (1984).
[14] FUJIWARA, A., KAMIMOTO. G., and TSUKAMOTO,
E. Kipp of Sandia National Laboratories for their encouragement A., 'Destruction of Basaltic Bodies by High-Velocity Im-
and helpful discussions. pact,' Icarus, 31, pp. 277-288, (1977).
References [151 MOTT, N.F. and LINFOOT, E.H., 'ATheory of Fragmen-
tation,' Extra-Mural Research No. F72/80, Ministry of Sup-
[1] NELSON, R.B., ITO, Y.M., BURKS, D.E.. MUKI, Y., Cal- ply, England, (1943).
ifornia Research and Technology, Inc., and HOLLOWELL, [16] GILVARRY, J.J., 'Fracture of Brittle Solids, I. Distribution
J.A., MILLER, C.W., Avco systems Division, 'Numerical Function for Fragment Size in Single Fracture (theoretical),'
Analysis of Projectile Penetration into Boulder Screens,' Journal of Applied Physics, 32, pp. 391-399, (1961).
WES MP SL-83-11, U.S. Army Engineer Waterways Ex-
periment Station, Vicksburg, MS, (1983). [17] PREPARATA, F.P.. and SHAMOS,
[2] GELMAN, M.D., RICHARD, B.N., and ITO, Y.M., Cali- M.I., COMPnTATIONAL GEOMETRY An Introduction,
fornia Research and Technology, Inc., 'Impact of AP Pro- Springer-Verlag, New York, 1985.
jectile into array of Large Caliber Boulders.' U.S. Army [18] CRAIN, I.K., 'The Monte Carlo Generation of Random
Engineer Waterways Experiment Station, Vicksburg, MS, Polygons,' Computers and geosciences, 4, pp. 131-141.
(1987). (1977).
[31 ROHANI, Behzad, 'Penetration of Kinetic Energy Pro- [19] GIIOSH, S., and MUKHOPADHYAY. S.N.. 'A Two Dimen-
jectiles into Rock-Rubble/Boulder Overlays,' Report, U.S. sional Automatic Mesh Generator for Finite Element Anal-
Army Engineer Waterways Experiment Station, Vicksburg, ysis for Random Composites,' Computers and Structures,
Mississippi, (1987). j1(2), pp. 245-256,(1991').
[4] SHI, G.H., and GOODMAN, R.E., 'Generalization of Two [20] HOFFMAN, CM., 'Computer Vision, Descriptive Geom-
Dimensional Discontinuous Deformation Analysis for For- etry and Classical Mechanics,' Proc. of the Eurographics
ward Modeling,' International Journal for Numerical and Workshop Computer Graphics and Mathematics, Genove,
Analytical Method sin Geomechanics, 13(4), , pp. 359-380, Italy, (1991).
(1989). [21] MILES, R.E., 'On the humogeneous planar Poisson point
[5] CHEN, W.F. and PAN, A.D., 'Finite Element and Finite process,' Math. Biosciences, 6(1), pp. 85-127. (1970).
Block Methods in Geomechanics." Procpedings of the third
International Conference on Constitutive Laws of Engineer-
ing Materials, Tuscon, Arizona. (1991).
[6] ChEN, W.F. Limit Analysis in Soil Plasticity, Elsevier,
Amsterdam, The Netherlands. 1975.
17](https://image.slidesharecdn.com/a276170-221126090128-e06297b7/85/a276170-pdf-26-320.jpg)


![AN EMPIRICAL EQUATION FOR PENETRATION DEPTH OF OGIVE-NOSE PROJECTILES INTO
CONCRETE TARGETS
M.J. Forrestal*, B.S. Altman*, J.D. Cargilet, S.J. HanchakO
*Sandia National Laboratories, Albuquerque, NM 87185-5800
tWaterways Experiment Station, Vicksburg, MS 39180-0631
tUnlversity of Dayton Research Institute, Dayton, OH 45469-0182
ABSTRACT +NY
aV 2)
+Na
We develop an empirical equation for penetration depth of
ogive-nose projectiles penetrating concrete targets at normal - I
impact. Our penetration equation contains a single, N 2
2442b
dimensionless empirical constant that depends only on the
unconfined compressive strength of the target. We determine where the projectile has mass m, shank radius a. caliber-radius-
the empirical constant from penetration depth versus striking head V, and rigid-body velocity V. The target is characterized
velocity data for targets with unconfined compressive strengths
of nominally 14 MPa (2 ksi), 35 MPa (5 ksi), and 97 MPa (14 by density p and the constants (roA) and B that involve only
ksi). Predictions are in good agreement with six sets of material parameters obtained from triaxial tests.
penetration data for striking velocities between 250 and 800 m/s. Previous studies [2.3,4] showed that B depends mostly on
the compressibility of the target material and B has a narrow
range: for example, B = 1.1 for aluminum targets [2,31. and B =
INTRODUCTION 1.2 for soil targets (4]. By contrast. (r0 A) depends mostly on
the shear strength of the target materials, and (r)A) has a broad
Brown [1] presents an historical account of empirical range. For this empirical equation, we take B = I and
equations for penetration and perforation of concrete targets. (roA) = Sf,, where S is the dimensionless empirical constant
These empirical equations result from curve-fits with test data
and do not provide physically based descriptions. In addition, that multiplies unconfined compressive strength. Thus, the
the empirical equations in [I] are expressed in terms of specific empirical equation for axial force takes the form
units, so these equations are dimensionally dependent. In this
paper, we develop a dimensionally consistent empirical equation F = ra2
(Sfl + NpV2
), z > 4a (2)
for depth of penetration into concrete targets that contains the
functional form of recently published, experimentally verified, where N is given by equation (I b). Equation (2) is limited to
analytical models (2,3,4]. penetration depths z > 4a. For z < 4
a, the process is
MODEL FORMULATION dominated by surface cratering.
Forrestal and Luk [4) derive an analytical equation for Post-test observations ot soil and concrete targets show that
penetration into soil targets that requires triaxial material data the cavity left after penetration has a conical region with length
from samples cored from the target material. Unfortunately, about two projectile shank diameters (4a) followed by a circular
most penetration studies lack the necessary triaxial test data cylinder with diameter nearly equal to the projectile shank
required for input to analytical and computational models, diameter (2a). Thus. the cavity length 0 < z < 4a is called the
Many experimental studies do, however, report the unconfined crater region, and the cavity length 4a < z < P is called the
compressive strength f, for concrete targets. To use this data tunnel region, where z is measured from the target surface and P
base, we develop an empirical penetration equation that is final penetration depth. For the soil penetration tests analyzed
describes the concrete targets in terms of unconfined in [4], P= 10Ia; so the crater region was ignored. However,
compressive strength f, a dimensionless empirical constant S both the crater and tunnel regions must be taken into account in
that multiplies f', and density. the analysis of the more resistant concrete targets.
Deceleration data [41 show a rise time during the crater
The development of the empirical equation starts with the region. followed by a decaying pulse during the tunnel region.
equation for force on the projectile nose given in [4]. For the For this model, we take force on the projectile nose as
analytical model in (4] and this empirical equation. we assume
normal impact and that the projectile is a rigid body F=('z, 0<z<4a (3a)
(nondeforming nose). Axial force is given by
29](https://image.slidesharecdn.com/a276170-221126090128-e06297b7/85/a276170-pdf-38-320.jpg)
![F=ra 2
(Sfs-NpV 2
), 4a<z<P (3b) -_Co (7d)
),.
where c is a constant. From Newton's second law
Values of il, V1. and c can be determined with equations (7b.
d2
z c n )
mdt2 =-cz, 0<z<4a (4) c,andd).
Depth of penetration in the tunnel region is found from
With the initial conditions z(t = 0) = 0 and V(t =O)= V,,
equation (4) has the following solutions for projectile d2 mvd-
•=-ra 2
(Sf + NpV 2
), 4a < z<P
P 8
displacement, velocity, and acceleration: m-d- dz
(V.' Integrating (8) from V,to zero and 4a to P gives the final
z = (0 sin a, 0 < z < 4a (5a) penetration depth
V=-Z=Vcosowt, 0<z<4a (5b) P= , Inil+ ) +4a, P>4a (9)
dt 2iZrpN ( Sf '
d 2
z wV, sin wt. 0< z<4a (5c where V, is related to the striking velocity V, in equation (7c).
DETERMINATION OF EMPIRICAL CONSTANT FROM
_2 C PENETRATION DATA
= -- (5d)
m
We solve for S in equation (9) and obtain
We now define t1, and V, as the time and rigid-body 2
projectile velocity at z = 4a. The unknowns t1, V1, and c are S = NpV1 1 (10)
found from the conditions of continuity of force, velocity, and f 4raNp [ex
21ra2(P-4a)Np
displacement at z = 4a and t = t1. + m ) If m J
From equations (3) and ý5) For each experiment, all terms on the right side of equation
(10) are known, so we can calculate S for each data point. We
mo9V sin o 1 = Yraw(Sfc + NpV2), atz =4a (6a) take the average value of S for the data points in each data set
and compare results from equation (9) and penetration data.
Vscoson, = Vl, at z =4a (6b) This procedure produced accurate data fits for six sets of
penetration data.
(V4-/sin or = 4a, atz = 4a (6) 14 MPa (2 ksi) Grout Targets.
kr) Hanchak and Forrestal [5] conducted depth-of-penetration
experiments with 0.064 kg, 12.7-mm-diameter projectiles with
Substituting (6c) into (6a) gives 3.0 and 4.25 caliber-radius-head nose shapes into grout targets.
Table I lists the other parameters for these experiments. The
C_a(, + 2) value of S in Table I is the averag! of the values calculated
4 NPv2, (7a) from equation (10) for each data point. Figure I shows the
results from equation (9) with S= 21 and the data sets with
Squaring and then adding (6b) and (6c) give 'V= 3.0 and V = 4.25.
m(V2 _ VI) 35 MPa (5 ksi) Concrete TarMets.
c = ---6a- (7b) Canfield and Clator [6] present depth-of-penetration data
for full-scale (5.90 kg, 76.2-mm-diameter) and one-tenth scale
(0.0059-kg, 7.62-mm-diameter) armor-piercing projectiles.
Equating (7a) and (7b) gives the rigid-body velocity at z = 4a Table I lists the other parameters for these experiments and the
as calculated value of S. Figures 2 and 3 show penetration data
and results from equation (9) with S = 13 for the full-scale
V2 = +mV2
- 4ffa3
Nf (7c) projectile and S = 14 for the one-tenth scale projectile.
m + 41ra3NO Ehrgott and Cargile [7] conducted depth-of-penetration
experiments with 0.90 kg, 26.9-mm-diameter projectiles.
From (6b), Table I lists the other parameters for these experiments and the
calculated value of S. Figure 4 shows penetration data and
results from equation (9) with S = 12.
30](https://image.slidesharecdn.com/a276170-221126090128-e06297b7/85/a276170-pdf-39-320.jpg)
![97 MPa (14 ksi) Concrete Targets.
Ehrgott and Cargile [7] conducted depth-of-penetration
experiments with 0.90 kg, 26.9-mm-diameter projectiles. Table I Penetration Parameters
Table I lists the other parameters for these experiments with
the calculated value of S. Figure 4 shows penetration data and Parameter Ref. [51 Ref. [51 Ref. [61
results from equation (9) with S = 7. m (kg) 0.0642 0.0642 590
2a (mm) 12.7 12.7 76.2
An Estimate for S versus f•. 3 4.25 1.5
We obtained values of S for six data sets. For the two data N 0.106 0.076 0.204
sets with nominal 14 MPa (2 ksi) grout targets, S = 21; for the p (kg/m3) 1960 1960 2310
three data sets with nominal 35 MPa (5 ksi) concrete targets, S Cc (MPa) 13.5 13.5 35.1
= 12, 13, and 14; and for the single data set with a nominal 97 M 1 1 3
MPa (14 ksi) concrete target, S = 7. The model prescribes that 2 2
S depends only on f,, and equation (10) shows that S is Parameter Ref. [6] Ref. [7] Ref. (7]
proportional to l/f,. Figure 5 shows the calculated values of S m(kg) 0.0059 0906 -
m (g) .009 0906 0.904
and a curve-fit where S is proportional to l/f,. 2a (nmm) 7.62 26.9 26.9
SUMMARY 1.5 2.0 2.0
N 0.204 0.156 0. 56
We present a dimensionally consistent empirical equation p (kg/m3) 2240 2370 2340
for penetration depth of ogive-nose projectiles penetrating tc (MPa) 34.6 36.2 96.7
concrete targets. This equation has a single, dimensionless S 14 12 7
empirical constant S that multiplies unconfined compressive
strength f,. The empirical constant S depends only on the
unconfined compressive strength of the concrete target and is ,_ _
independent of the projectile parameters and striking velocity.
We note that the penetration equation is limited to normal , =, , /
impact and rigid projectiles (nondeforming nose). Most of the 4 O1425 /D
penetration data base is limited to V, <800 m/s, and for -- /
V, < 800 m/s, the nose remained undeformed. " //
Acknowledgment - This work was sponsored by the Joint P(M)
DoD/DOE Munitions Technology Development Program.
REFERENCES
I. S.J. Brown. Energy release protection for pressurized ,
systems. Part II. Review of studies into impact/:erminal
ballistics. Applied Mechanics Reviews, Vol. 39. 1986.
2I.) Mi ForesaX) N.aa VK u Pe)Sa d L P t or
2. M.J. Forrestal, N.S. Brar, and V.K. Luk. Penetration of V (m/s)
strain-hardening targets with rigid spherical-nose rods.
Journal of Applied Mechanics, Vol. 58, pp. 7-10, 1991.
Figure I. Penetration data [5] and model prediction for
3. M.J. Forrestal, V.K. Luk, Z. Rosenberg, and N.S. Brar. 0.064 kg, 12.7-mm-diameter projectile with f'c = 13.5 MPa.
Penetration of 7075-T651 aluminum targets with ogival- S=21.
nose rods. International Journal of Solids and Structures,
Vol. 29, pp. 1729-1736, 1992.
4. M.J. Forrestal and V.K. Luk. Penetration into soil targets.
International Journal of Impact Engineering, Vol. 12, pp.
427-444, 1992.
5. S.J. Hanchak and M.J. Forrestal. Penetration into grout
targets with 0.064 kg, ogive-nose projectiles. Work in
progress.
6. J.A. Canfield and L.G. Clator. Development of a scaling
law and techniques to investigate penetration in concrete.
NWL Report No. 2057, U.S. Naval Weapons Laboratory,
Dahlgren, VA, 1966.
7. J.Q. Ehrgott and J.D. Cargile, Penetration into concrete
targets. Work in progress.
31](https://image.slidesharecdn.com/a276170-221126090128-e06297b7/85/a276170-pdf-40-320.jpg)
![.1.5,Dm[ W2'f --
%.'7
9 MPa"Daa
, __ V=2. f. _9 7
. aM
. Equw w ,,)
07 0 1 10
0 -- =2. V=36.2MPa. Equ,.'•in9) /
06 1 Of
P 'm P (m) o
1
6 r• /l
()P (mMo
~V
04
04 rl
0.1
0.2 -.
0.2
(
0I , , lo
,W , W
, A , i _
000 450 6400 7%4 900o 2 ,,M1) 1)J 601 II)
V (m/s)
V (mIs)
Figure 4. Penetration data [71 and model prediction for
Figure 2. Penetration data [61 and model prediction for 0.904 kg, 26.9-mm-diameter projectile with Vc = 36.2 MPa,
5.9 kg, 76.2-mm-diameter projectile with f'c = 35.1 MPa, S=12 and f'c = 96.7 MPa. S=7.
S=13.
0.09 22
0.08 20
V=1.5. Equafion
(9) o
0.07 18
(
)006 S 14
0.04 1 12
0.03 • 50
002 0
00 o 0
1 0 03 4.5 (0) 7%0 90060 20 40 60 80 too
V (mIs) f"C
(MPa)
Figure 3. Penetration data [6] and model prediction for Figure 5. Dimensionless empirical constant versus unconfined
0.0059 kg, 7
.62-mm-diameter projectile with Vc = 34.6 MPa, compressive strength.
S=14.
32](https://image.slidesharecdn.com/a276170-221126090128-e06297b7/85/a276170-pdf-41-320.jpg)


![IMPACT OF PROJECTILES ON HARD LAYERS
T. Fries M. Koller
D. Favarger
Defence Technology and Procurement R~sonance SA
Agency (DTPA)
Ballistics, Weapons and Ammunition Consulting Engineers
CH-3602 Thun, Switzerland CH-1227 Gen~ve, Switzerland
A physical model simulating the impact behaviour
of projectiles on hard layers will be presented.
It isbased on the Bernard theory [1]. The cor-
responding computer code accounts for the 3D D, a
geometry of a cylindrical projectile with ogival
or blunt nose.
In the operational range of 200-300 m/s impact
velocity, projectiles with ogival nose can
penetrate into a burster slab for angles of
incidence less than 45 to 550. A greater R
obliquity leads to ricochet. Blunt noses enable
more reliable penetration up to about 750
obliquity. For higher values of the obliquity,
blunt projectiles rebound on hard layers.
Results of parametric studies on the impact
behaviour -ricochet, tumbling motion or penetra-
tion- of projectiles with blunt and ogival noses Fig. 1. Symbols and parameters.
will be presented. 1. Introduction
During the field tests in Val Nalps (Switzerland)
in 1987 and 1988, 22 GP and SAP, inert and live
Swiss bombs were dropped -a rock rubble layers as
well as 4 Mark 82 and 84 bombs. These full scale
experiments have not answered all questions asked
List of abbreviations, symbols and parameters [2, 31. It was assumed that Mark bombs with
ogival nose would penetrate more into the
a "calibre, of 2D projectiles protective layer than blunt Swiss bombs. Although
CRH calibre radius head = R / D this assumption was most likely right for targets
D calibre of lower hardness than a burster slab, the
F penetration force effects of the four different Mark bombs dropped
L projectile length did not lead to clear conclusions. In previous
L/D projectile slenderness field tests, bombs with ogival nose had showed
R curvature of the ogival bow strong path deflection in the target material and
V impact velocity a poor penetration ability [4]. Since the
x,y,z rectangular coordinates publication of the last reports [2, 3] on the
xz-plane plane of incidence (y = 0) above mentioned tests, an attempt has been made
Y target strength to study these topics by using a physical model.
2D 2 dimensional
3D 3 dimensional For this purpose, a previous 2D model simulating
GP general purpose the impact behaviour of blunt bombs on hard
SAP semi armor piercing layers [5, 6] has been extended for rigid bombs
a obliquity or angle of incidence with ogival nose as well.
lim(a) limit of a
7 angle of attack A further question has been how the number of
Sbow angle of the ogive dimensions influences the model results;
Sangular velocity of the projectile in Therefore, the model has been extended to 3
the xz-plane dimensions.
39](https://image.slidesharecdn.com/a276170-221126090128-e06297b7/85/a276170-pdf-48-320.jpg)
![Experiments in White Sands Missile Range (N.M) Actually, the model reported here in is not fully
with 1-2000 bombs [7, 21, have raised a few more 3-dimensional: the angle between the c.g.
questions as well. One of them will be to ve"'locity vector and the projectile axis (fig. 1)
determine as well as possib)le the actual remains in.
the plane of incidence. It implies
protection offered by existing shelters and their that the pitc.h angle is zero throughout the
burster slab. impact event. This jimitation is of minor
importance in this study. in most of the
2. Development and description of the model computations, the initial angle of attack set is
zero.
The penetration force due to material inertia and
strength is calculated with the Bernard theory 3. Comparison between the 2D and 3D model
[1), discarding strain hardening, compressibility
effects and friction. The influence of the The curves of fig. 2 below show the limit of the
reduced strength due to the free surface is taken obliquity a in function of the impact velocity V
into consideration [5, 61. Such semi-empirical for several types of projectiles: for values of a
penetration theories often do not give accurate below this limit, the projectile type considered
values of the penetration depth. In the code penetrates into the target. For values of a above
used, they are adjusted by one global factor to the curves, it rebounds after its impact on the
match the mean depth reached by the bombs dropped burster slab or performs only shallow
in the full scale tests. This model is not a penetration. In the last case, defined by a
penetration theory; it allows investigations only penetration depth less than one calibre D, the
on the case of shallow penetration. Hence, the damages caused by an unconfined explosion would
typical errors made by modelling roughly the be light; this case may occur if a projectile
mechanical properties of the target material do began to rebound throughout nose burial, but
not play an essential role. would come to rest before losing the contact with
the target.
The equations of motion are solved numerically.
The conservation of energy is checked throughout Currently, air-delivered bombs achieve an impact
the time integration to get an estimate of the velocity between 200 and 300 m/s.
errors.
9o
In an earlier study, excellent agreement between
experimental results and the model was obtained 80- -. .
for impacting spheres [1]. Another model for 2D - -
projectiles described in [1) has been extended to -0 - . - -7
account the observed bending of GP bombs at 60 Z. / -
impact [6]: in (6], the projectiles are made of
two rigid parts held by a hinge. This hinge has a so --- - -
rigid ideal plastic caracteristic corresponding
respectively to the yield bending strengthes of 40 -
the GP and SAP bombs. The bending angles of the
GP bombs established during the tests and the 30 -b
angles given by this simple model of projectile 20 -bkst oA1du_
deformation correspond qualitatively.... 2Da•
10 - -O-
-ve -
The sphere refered to in fig. 2 has the same 0 ---
weight and the same cross section as the SAP 0 100 200 300 400 500
bombs used in the tests. The motion of 2D hpkdvw [nVsf
projectiles remains in the xz-plane or plane of
incidence (fig. 1). In a 3D space, such 2D
projectiles would have a constant vertical shape Fig. 2. Limit of the obliquity a in function of
in the y-direction. In the code, they have a V for several types of projectiles.
square cross section of equal area to that of 3D
cylinders. Their side a is given by: A 2D beam rebounds on a hard layer for smaller
D2
/4) - 0.89 D angle of incidence than a 3D cylinder (fig. 3).
sqrt(D.The explanation is obvious: the penetration force
This useful assumption simplifies the comparison F is proportional to the buried part of the
with 3D projectiles. The 2D projectiles have the front. The corresponding area and the force F are
shape of blunt or pointed beams depending on the greater in the case of a 2D quadratic cylinder as
type, "beam* or "2D ogive". The 3D projectiles long as less than half of the front is embedded.
tye
ba"o 2 gve.Te3 rjcie The resulting force acts farther from the
have a circular cross section of diameter D and a
blunt ('cylinder*) or ogival nose ('3D ogivel). projectile axis than in the case of a 3D
For 2D and 3D ogives, the CRH set is 4. cylinder. The resulting torque, inducing a
forward rotation, is greater as well. The
corresponding explanations for projectiles with
ogival nose will be given below.
40](https://image.slidesharecdn.com/a276170-221126090128-e06297b7/85/a276170-pdf-49-320.jpg)


![8. Influence of the target strength Bombs with ogival nose falling on a flat area
penetrate better into a target than blunt ones if
The impact behaviour depends considerably on the the angle of incidence is within the limit.
target strength (fig. 9). On hard rocks reaching Moreover, their impact behaviour is almost
more than 150 MPa yield strength, the projectiles independant of the angle of attack. It cannot be
achieve only shallow penetration. Their impact made worse by a guidance system like Paveway If.
behaviour is similar to that of slow projectiles
-say V < 200 m/s- hitting a reinforced concrete The full scale tests and the model have showed
slab of 35 MPa yield strength. Because the that burster slabs of about 3 calibres thickness
weapons effects would be minor in both cases offer a very good protection against 450 kg bombs
mentioned, it is not important to know whether independently of their impact behaviour
the projectiles would rather rebound or not. - penetration or rebound. The level of protection
can be expressed by a number of hits per unit
v 25
sorV area without significant damages. However, we
90 cannot expect that burster slabs of the tested
thickness achieve a sufficient protection against
80 bombs like 1-2000: investigations on the impact
70 behaviour of such bombs with the model presented
herein lead to the conclusion that guided 1-2000,
so dropped under operational conditions, would not
10 _rebound. Such bombs can be defeated only by thick
__50 rock rubble layers imparting strong deviations to
the penetrating bombs and limiting the
40 -penetration depth in this way. The costs for the
3 ____--___corresponding level of protection are only
justified for the most important installations.
20
_ F Of course, camouflage and deception isanother
1-3D00- important topic for the protection of all
10 __underground structures as well.
0
0 30 so 90 120 IS0 180 References
W"tal-tst;Igh Y [N/ITVTl
[11 Bernard R. S. Development of a Projectile
Penetration Theory. US Army Engineer. WES,
Fig. 9. Influence of the target strength on the Vicksburg, Mississippi. June 1975.
limit of a.
9. influence of the c.g. position [2] Favarger D. Bazberg and Val Nalps Tests:
9 Final Report. P. 109-118. of [7].
For aerodynamical reasons, the ballistic [31 Favarger D. Wirkungen von konventionellen
stability of projectiles requires the c.g. to be Waffen auf Schutzschichten und unterirdischen
enough forward. The limit of a -i.e. the Anlagen. Bericht B 946. GRD FA 27. CH-3602
penetration ability- increases slowly for more Thun 3. August 1992. VERTRAULICH.
forward c.g. positions. But, even if we replace
explosive by steel in front of the projectile, [4] Janser 0. Bombenabwbirfe in Kloten.
the practicable improvement is very limited. Versuchsbericht Nr. 1191. GRD S 4.8.
10. Final remarks Flugversuche Emmen. 17. Mai 1976.
[5] Favarger D., Eyer P. and Koller M. Ricochet
The study presented herein is only of interest if and Shallow Penetration of Bombs Impacting on
it leads to some link with the actual interaction Hard Layers. Proceedings of the Fourth
of bombs with burster slabs. Blunt SAP ("rigid") International Symposium on the Interaction of
bombs achieve penetration into a hard target for Non-nuclear Munitions with Structures. P.
a greater obliquity than bombs with an ogival 86-92. Panama City Beach, Florida. Anril
nose. But, this advantage may disappear if they 17-21, 1989.
are guided because their impact behaviour depends
strongly on their angle of attack (fig. 7): a
guidance system like Paveway II imparts [6] Eyer P., Koller M., Favarger D.
considerable changes of this angle to the bombs Aufprallverhalten von Bomben auf
throughout their trajectory. This is even visible Zerschellerschichten. Bericht FA27-SIG B
with nacked eye. Hence, the advantages of blunt 900511 910. GRD FA27, CH-3602 Thun. 11. Mai
bombs may be limited to unguided ones, falling 1990.
with small angle of attack, dropped on bumpy
ground, where the angle of incidence depends [71 Proceedings of the TELL 91 Symposium.
strongly on the impact location. Conventional Wapons. Penetraticn, Protection
and Prediction Techniques to include Results
from TELL 91 Test series. NC-Laboratory,
CH-3700 Spiez. April 22-23, 1992.
43](https://image.slidesharecdn.com/a276170-221126090128-e06297b7/85/a276170-pdf-52-320.jpg)


![the curve up to the deflection equal to 1/150 of the span. This
yields a value in inch-pounds, and is a reliable indicator of U
absorbed energy. For the compressive strength tests, a Chinese 1 r
standard test method was implemented, in which the critical
load point of 85 percent of the ultimate load replaces the first I J
E • U n F]
flexural crack point in defining the compressive toughness / I- U
index (7). This method was selected because ASTM has no /"
method for determining the toughness index for a cylinder in U r.
static compression. - LJ
Test Program
The FY 91 test program was an exploratory experimental - m m -
effort to determine the effect of perforated concrete slab .. .. .. El
. . . ..... . . .
sections on the stability of an advanced penetrating weapon. "-........-
This effort, in its early stages, focused on the geometry of the L' L D I' [-] [E-
concrete deflection grid, and the influence of compressive
strength. Due to a wide variance in projectile rotational rates,
and the catastrophic damage to the deflection grids at high Eii E Li Li
Ei [--E
compressive strengths, steel and nylon fibers were added to the i 0
mix designs. Burster slabs were not incorporated into the tests - - D w
until FY 92, since observatior of the projectile's induced
rotation was the objective of the FY 91 tests. The projectile
was allowed to travel freely for 20 feet after striking the 7 FD1 D D•-
• -
deflection grid, to obtain sufficient high speed photography of
the event. Based on the FY 91 test results, the FY 92 test
program systematically varied deflection grid and burster slab D D Di L Li L
configuration parameters to obtain response data from which
to develop an antipenetration system design procedure.
Figure 3. Deflection Grid Type 01
FY 91 Tests
reduced the amount of steel reinforcement, and reduced the
A test matrix was developed to determine the effects of deflection grid thickness to four inches. Simplicity of
geometry, compressive strength, impact angle, amount of steel construction was a major factor in these earlier designs, to
reinforcement, and fibers. Table I shows the test schedule. minimize labor and construction costs for the full-scale
systems. To achieve the target compressive strengths shown in
the test matrix, four mix designs were developed. Low
TABLE
1 FY91ANTIPENETRATION DEFLECTION
GRIDTESTIMATRIX strength is classified as 4,000 psi and high strength as 8,000
. EFO,,CEM VALUES psi. Table 2, contains results obtained in FY 91, including shot
S GRRT RREIRCEMN•,s IMPACT number, impact angle, exit angle out ot the grid, rotation rate
_I •. in degrees per body lenghts of travel, and remarks on the
3, X material composition of the deflection grid.
S XI X 30
0 01 VI
S 0, o 0 g FY 92 Tests
'S 0'X 0
X
O
,0 01
0,0 X X
0' X
•Based on observations during the FY91 program, a test matrix
3? 31 X 30
3 X X 0 was developed to investigate the effects of geometry, density,
3
.X. . 0 0 and compressive strength for a series of eighteen experiments,
W
03 0 0
;as shown in Table 3. Four densities and two compressive
13 0 X X o strengths were selected, resulting in six concrete mix designs.
n 03 X X Initially, strike points were selected at locations that would
27 0
29 - produce conservative rotation rates, with all shots conducted at
normal impact. The test matrix shows three grid types tested
for the FY 92 program. To conserve materials and reduce the
Molds for three geometric deflection grid patterns were test specimen weight, the grid dimensions were reduced to
constructed from marine grade plywood. Grid type 01 was a three foot square, with a thicknees of four inches. Reinforcing
square hole perforation design as shown in Figure 3. Grid type steel was reduced to a single layer of #3 rebar. Figure 4 shows
02 was a staggered circular hole configuration to accomodate a an isometric view of Grid Types 16, 20, and 25, named for the
higher percentage of reinforcing steel. Grid type 03 was a number of perforations. Grid Type 20 was designed with
waffle style design which eliminated the grid perforations, rectangular openings in an offset pattern to enhance irregular
52](https://image.slidesharecdn.com/a276170-221126090128-e06297b7/85/a276170-pdf-61-320.jpg)
![IAIIL: 2 1I
Y 9
•J i44.-(1I(N US
IJ 44
I44 DATA F - -- 1
Shot h,,,. , A,, : .. ., A,,l. '.. .,4.. .,,,
Kai I Y . .,,.u . L E] L-J I- I
No. dcgnx' 0111.1
4444I Ik~n~
1 60 1114
S4 27 54I/04)/1's I~ i 1
2 44 7 S 62 14)9 SI I/I)DR/IS •_
4 34) 111 44X41 2H444 S14UD/I)
4.S
6 445 2444 K4 S
4 1411/*144/.5
452 1 7 7 b SI I/)RA/4.5
,5 4A 1...
7, 427 1,,,,,,,,..-
66 11 64. I) 4 SI/1)R/4.S
17 04 4 2 2 S, I) 1 SII/I)Ri .S --
N1 4.45 4 1 14 179 S1J4),H4.S-
25 04 7 7 S 2 IX SI |/NK/1IS/NI'
26 4) 6 2 7 .1 21 0 4
S1I/N14/ IS/NI
14, 0 2'4 7 14 54UNR/IIS/NI - - -
344 344 7 1441
44 4.4R
'4 4454/45/4
1I 44 7 4I) 21
1X SI I/SR/I IS/NIF
'2 111 4 4 . 1. 444, I4/SR/IVIS/NI
3.7 ,114 '( 2 4,
6 21 , SI I/ R/4IIS/NI: .H
1 171/104/I
2 4 - 5 1 H , 2 SII/SR/IIs/NF,
7 45 (•5 N2 22 If HWRAll)I3
9I l) 7 •4 IN I t RJI)VD JI3
-S [II
1) SI 7 it 4 RIDASiiAl .'
1.3 (1 IJ 1 7 7 2'K' 41DRlllrlS!
21) 0 1 X 5 244 WI/S/I ,IS/SI'
22. 0 1 S I h
Ih WI/NIIIR NMI:
27 04 5 7 4It,
7 W I/N t/IIS/NI
28 40 S 7 1
4 44,
1 W I/NR/IIS/NF i
Rc'I,,aarla
RIl Romllt1 I-,le:Bl Is[
SI I h. lc U).44,
,,k .I
~
WTI- Wlllk '.4,h: •lr .4'k•sa
SR Single ,
I ,,,. ...............
4 Figure 4. Isometric View of Grid Types 16, 20, and 25
NR. Naiccl 4l.,l
l ,lC, lll
IS-44,:: ...... 44.......
4:.,,:,,,
....... •.4/:,,4,71,.,,,,a a,,u Eighteen deflection grid tests were performed on the three
NF •Nyh: I,,
Il,
SUSlv. 1,.1w,, basic geometries. With the exception of four targets, impact
points were generally confined to the center of a web were
theoretical modeling had shown the resulting weapon rotation
would be least. Table 4 provides data by shot number,
TALL, 3. FY92 ANTIPENETRATION DEFLECTION GRT F
TEST MATRIX
COliCR
E'T 644440445534
V LIS
TESNO.4*4W94044, PdI rc, I"AI4I.I: -I FY 92 l)l'l I.I (lIION (1RI4) 445 4)5T
I AT
TESTNO, GRIID
1" 50
1 21
•0 326 4,000 1 8ODO
.2 If Shol p rc 1 , ,,Anpia Y;- Ra., 1,
|-4 '4,
4 VrI,,,4,
vr lnip
|,,44.1
,
53 6 4X x No p.5f I'- d4gre,0 I4444
I l:4(:r4 III4 f41 P 'nl4
46 44 4
54 ;6' x
, 44
470 I ( " l
79 14 96 1116 I1 i9
.5 2
4 X i 42 121 s(O44 2 2 4 , I44XI
441 .1
4
I
20 X x
24
20 47
151 52 4I' 1l 2 404 4044 4
5ii
4 2117 60,2N¢ ')1
A 2N)" lf~ 910 1,
"4" x 444) 10445 444I 7h '4 41.4 4414 4I
4,7 4
2S
I 25 44x
SI 25 I 45 116 414X I1 7 11
147 1141 1
• Is 25 ' x I
2S, 44 424 144,41 2'4 ix 4,14 4444 4444 1
34 2
52 151 S45141 74 1
42 1 4i4l l44), I
55 2417 44124 44, 4
6.- 2 4447 1414
6 4
fracture lines upon impact. This design had the least volume 46 116 144.4 52 4 4 :,44
4474 , .
of all six geometries. Grid Type 25 still maintains the same 4 4121 ,40-N 44
.4 4427 44444 I
size hole perforation but has a reduction in spacing. The 51 151 45
4
t, 2 7 5 144 4444 1
purpose was to retain the symmetry but decrease the mass in 44 '07 10 10 6
, X01 'S
, '
1A
.44 2447 644244 Il44 4444 24.4, 44)4 441044
the web areas. Six concrete mixes were designed to achieve the IN 35 K1 124,1
4 74 7 1 4444 1446,7 2
target values in the test matrix. To maintain precise control
during construction of the deflection grids, a single rubber including grid type designation, target material unit weight in
mold was cast for each geometry type, and concrete mixes pounds per cubic foot, static compressive strength in pounds
were poured in batches of three. The two light weight mixes per square inch, exit angle in degrees, rotation rate in degrees
were designed for a unit weight of 110 pcf and a static per body lengths of travel (DBLT), tctal yaw in degrees at
compressive strength of 4,000 and 8,000 psi, designated three body lengths of travel (the distance between the
LW4000 and LW8000, respectively, deflection grid and the burster slab), velocities before and after
53](https://image.slidesharecdn.com/a276170-221126090128-e06297b7/85/a276170-pdf-62-320.jpg)


![LEAKAGE PRESSURES BEHIND BLAST WALLS
TA.Rose, PD.Smith and G.C.Mays
Civil Engineering Group, Royal Military College of Science (Cranfield],
Shrivenham, Swindon, Wiltshire, SN6 8LA, United Kingdom
between the wall and the building.
Abstract Whitham [4] describes an analytical method of calculating
This paper describes a programme of research in the shape of shock fronts which have diffracted around external
which detailed measurements of the blast environ- corners. It is an approximate theory and if applied to a blast
ment were made behind a 1/101 scale vertical blast wall assumes firstly, that the shock wave incident at the top of
wall when scaled realistic threats were detonated at the wall would be vertical and plane and, secondly, reflections
appropriate distances from the wall. A grid for mena- from the ground do not occur. This method may be useful for
surement was established out to six wall heights be- examining waves which have progressed only a short distance
hind the wall and up to three wall heights above from the wall.
the ground. From the pressure-time histories thus Beyer [5] presents blast wall design criteria derived from a
obtained, contour plots of overpressure and impulse series of high explosive trials. These criteria are based on peak
were developed. These were compared with histories blast overpressure, total blast impulse and effective duration.
obtained with the wall absent so that the regions of The objective was to express these quantities in terms of the
maximum benefit from the wall's presence could be important problem parameters. These are net explosive weight,
identified. distance of point of interest behind the wall, elevation of the
point of interest behind the wall, elevation of the charge above
the ground, distance of the charge from the wall and the mass of
the canopy attached to the wall. The experimental programme
was performed at 1/61A scale, and the results from one of the
ten trials is comparable with the work undertaken in the study
Introduction reported here.
Further experimental data is contained in Jones et al [6]
Car and other vehicle bombs have proved to be a major terrorist which describes a series of blast wall tests which were carried
threat in many parts of the world. They can have devastating out as part of the U.S. Department of State "Design of Struc-
effects not only on the occupants of buildings but also on the tures to Resist Terrorist Attack" programme. There were two
building structure itself. Although a significant degree of hard- objectives to the tests. The first was to determine the benefit
derived from a perimeter wall in terms of the airblast pressure
ening may be incorporated into new buildings at relatively low recigabldnstuedehdtewl.Tescodbj-
cost (Elliott, Smith and Mays [11), the hardening of an existing reaching a building situated behind the wall. The second objec-
cost(Eliot, Smth
nd ays I]) th harenig o an xising tive was to investigate various designs of perimeter wail. This
building to minimise the damage sustained from every conceiv-
able form of attack is a very expensive procedure. Furthermore, data was employed in the formulation of exponential equations
the resulting appearance of the hardened structure is likely to for both pressure and impulse contained in the U.S. Department
of Transportation (DOT) Technical Manual (7].
be extremely austere. An alternative method of protection is to A method isOsugges hil [frsa t teba
construct a perimeter wall which increases the stand-off from any A method is suggested by Philip
o8f for estimating the blast
bomb and so reduces the blast resultants (overpressure, impulse pressure and impulse on one side of a wall resulting from the
and fragments) to an acceptable level from the point point of explosion of a charge on the other side of the wall. This method
and ragent) t
anaccptale lvelfro th pont oin of is based on empirical reduction factors linked to the sum of the
view of the building and its occupants. Such a wall is designed chare/ w all retian Tare appled to blastpa
to stop not only the vehicle but also to prevent any breaching charge/wt alul/target angles. These are applied to blast pa-
by the bomb. rameters calculated from the charge to wall plus wall top to
Procedures exist to enable solid and composite reinforced target path length.
concrete walls to be designed to resist these threats provided This paper describes an experimental programme of research,
there is some separation between the wall and the point of det- the objective of which is to define accurately the blast environ-
ther issom sepraton
etwen te wll nd he pintof et- ment behind vertical cantilever blast walls.
onation of the explosive device [2). Also, criteria exist for as-
sessing the damage to buildings, given the blast environment at
the building [3]. However, there is little published information
on methods for predicting the blast environment in the region
56](https://image.slidesharecdn.com/a276170-221126090128-e06297b7/85/a276170-pdf-65-320.jpg)
![channel with pressure transducers located at H/2 intervals was
Experimental Method and placed to complete the spacial grid at h=0. For the experiments
which involved the wooden box alone or when the channel section
Programme was located some distance from the wall, blanking plates (which
The experimental layout and design of the apparatus was gov- were weighted on the underside to improve stability) were used
erned by the desire to make pressure measurements in an area to fill the gap between the slabs and ensure the uniformity of
which extended six wail heights beyond the blast wall and three blast wave reflections.
wall heights above the ground. This was considered to be the In the main series of trials a charge equivalent to
7
5g of
most important area of interest given a typical operational wall TNT was employed. The charge was spherical and supported on
height of about 3m. With this figure in mind it was also de- a polystyrene block so that its centre was located at r=138mm
heigt o abot 3.
Wth tis igue inmin itwas lsode- from the wall and z=109mm above the ground.
cided at the outset that 1/10" scale experiments should be per- fro m the
wlaerim enthe ground.
A summary of the experimental programme is contained in
formed as this scale provided the best compromise in terms of Table 1 below. In this table the column summarising the ge-
ease of construction and measurement, and the charge weight ometry contains three entries: the first states whether or not
limitations of the Explosives Research and Demonstration Area the blast wall was present, the second describes the vertical and
(ERDA) at the Royal Military College of Science (RMCS). The horizontal intervals on which measurements were made, and the
use of small-scale models to obtain useful blast loading data is third describes whether measurements were made on or above
discussed by Smith et al [91. the ground.
The test structure was a vertical cantilever wall 2100mm long
and 350mm high with a base 600mm wide. It was constructed
from 20mm thick steel plate in three 700mm long sections which Results
were subsequently bolted together to form the test wall.
An area of ground at the ERDA was cleared and a bed In this section examples of the results of the pressure measure-
of sand was laid and made flat. The wall was positioned and ments and scaled impulse calculations are given. Figure 2 shows
600mmx600mm concrete slabs 50mm thick were laid over the the logarithm of peak pressures measured with and without the
base of the wall making the effective wall height H=300mm. wall along the horizontal gauge line h = 0.SH (150mm), ie in
The slabs extended away to a distance of 2400mm (8H) behind the shadow of the wall half a wall height above the ground. Fig-
the wall and formed a flat reflecting surface above which mea- ure 3 is the graph of the logarithm of scaled impulse for the same
surements could be made. On the near side of the wall concrete gauge line. Both sets of data are plotted against scaled distance
slabs were also laid, but in the central region where the charges behind the wall (R/W'/ 3
). The benefit of the presence of the
were to be detonated, thick steel plates were positioned and made wall is clear in both graphs.
level with the top of the slabs. Contour plots of the natural logarithm of peak pressure and
This layout proved to be fairly robust and although small actual scaled impulse are shown in Figures 4 and 5 for the trials
adjustments had to be made to the wall and slabs throughout when the wall was not present, and in Figures 6 and 7 when the
the experimental programme, no major alterations to the system wall was present. Both sets of data are shown on spacial axes
were necessary during the trials. A diagram showing the layout which are marked in intervals of the wall height H. In Figures 6
of the concrete slabs and the blast wall is given in Figure 1. and 7 the wall occupies the region from (0,0) to (0,H).
The design of the measuring system was again linked to the
aim of measuring in a 6Hx3H space behind the wall. It was
decided to make measurements of side-on overpressure using Comparison with Other Methods
Kistler type 603B and 6031 piezo-electric pressure transducers in
a "mushroom mount" arrangement. The action of this arrange- No Wall
ment is effectively to separate the incident wave from any pulses
which have reflected from the measuring equipment. Clearly, The primary means of validating the data captured during the
such reflected waves cannot be completely avoided, but the aim blast wall experiments was to perform the same series of ex-
was to delay the reflections for a length of time sufficient to pre- periments without the blast wall and compare the results with
vent them overlaying the incident wave. published data. Two sources were available for comparison with
The mounts themselves were attached at right angles to the the data measured at the ground surface (h=0): the first -.-
;as
end of long square section steel tubes. The transducer cables ran the program DNA BLAST [10] and the other was the program
inside the tubes and were completely shielded from the blast. BLASTTNW [11]. The second of these also provided a means
A large wooden box was constructed around a steel angle of comparison for points above the ground (h >0). In this sec-
frame, with a series of square holes at H/2 intervals in which tion graphs are presented which show the comparison of peak
the tubes and transducer mounts could be located and secured pressure and scaled impulse data for the horizontal gauge line at
by clamps. This box also contained the amplifiers and an inter- h=0.
com system used to facilitate communication between the test Figure 8 demonstrates good agreement between the surface
area and the instrumentation laboratory. Generally, three pres- pressure measurements and the data from the other two sources.
sure measurements were possible at one time by positioning the The calculation of blast resultants by the program DNA BLAST
gauges at intervals above the ground. The box was moved for- was performed using appropriate scaling and a nuclear device
wards and backwards to complete the spacial grid for each series twice the weight of the equivalent TNT charge. This is in ac-
of tests. The box and mounts can be seen in Figure 1. cordance with the range of TNT equivalences for nuclear explo-
The two rows of concrete slabs behind the wall had a gap sions given in Baker et al [121. Figure 9 shows good agreement
of about 80mm between them. In this gap an inverted steel between experimentally determined scaled impulse values and
57](https://image.slidesharecdn.com/a276170-221126090128-e06297b7/85/a276170-pdf-66-320.jpg)
![those obtained from the program DNA BLAST. However, all of The benefit plot for impulse (Figure 13) shows a very similar
the impulses calculated from the no wall records showed the ex- pattern, except the reduction is less pronounced than for the
perimental results to be approximately 50% higher than those pressure. The area above the wall and for a distance of H behind
calculated using BLASTINW. it shows a small disadvantage and the shadow region immediately
behind the wall shows a reduction to 40% of the no wall value
Wall Generally, for the area extending beyond 3H (the area most
likely to be of interest) the impulses are between 60% and 80%
The comparison of blast wall data with other sources is more dif- of those measured without the wall
ficult because of the scarcity of other data and predictive meth- It should be recognised that the generalisations mentioned
ods. In this section the data of Beyer [5] and the equations above are for the one particular set of parameters and the shape
contained ia Mayor and Flanders [7] are used for comparison, of the benefit plots will vary with these parameters.
Because the data of Beyer were measured along only two gauge The summary of Reference [6] concludes that the pressure on
lines (at h=0 and h=H) there are only two sets of comparable a structure behind a blast wall is t54%of that expected without
data. Strictly, none of the Beyer data is directly comparable a wall. Similarly, the impulse is 72% of the value without a wall-
because different values of H/W
1 1 3
and r and z were employed. These are essentially the same results that have been found in
The Beyer data presented here is taken from the experiments the present study.
which most closely matched those conducted for this project.
The parameters are summarised in Table 2.
The graphs comparing peak pressure and scaled impulse with Conclusions
data from the above sources are given in Figures 10 and 11.
It should be mentioned that the equations of Reference [71 It has been demonstrated that blast experiments can be per-
from the U.S. Department of Transport (DOT) were not in- formed successfully at 1/10'h scale and that data obtained from
tended to describe the process of blast wave diffraction around a experiments with blast walls are self-consistent.
wall but to provide a guide for designers based only on the dis- The benefit of a blast wall has been quantified in terms of
tance behind the wall. As a consequence they predict the same a so-called "shadow" region behind the wall where overpressure
pressures and impulses for the -omparisons at both h=O and and overpressure impulse levels undergo substantial attenuation.
h=H and their correlation with the experimental data is poor. The experiments described here are a starting point for a
more comprehensive investigation in which the parameters
H/W,
1
'/3 r/W
1
/
3
and z/W'/
3
will be varied with the aim of de-
Comparison of Wall with No Wall veloping a series of charts that will be of assistance to designers in
In this section the benefit of a blast wall will be demonstrated providing blast walls for optimum reduction of blast resultants.
by comparing the pressure and impulse data from the two sets
of experiments, with and without the blast wall. Acknowledgements
Intuition tells us that we might expect a region extending
a short distance above and beyond the top of the wall where This work has been carried out with the support of the Defence
the pressures will be greater than expected in the absence of a Research Agency, Christchurch, an executive agency of the Min-
wall because of the "focussing" effect caused by reflected waves istry of Defence, under Agreement No 2004/121/RARDE.
travelling up the front face of the wall.
However, everywhere else, particularly in the region shad-
owed by the wall, the blast resultants should be greatly reduced. References
It is the extent to which these effects take place which is of most
interest to a designer and it is this subject which is addressed [1] Elliott, C.L.; Mays, G.C.; Smith, P.D. "The Protection of
here. Buildings Against Terrorism and Disorder." Proceedings of
the Institution of Civil Engineers, Structures and Buildings.
Figures 12 and 13 are "benefit plots", ie they show the pres-
sures and impulses which occur in the region behind the wall in
terms of the percentage of the quantity measured when the wall [2] "Structures to Resist the Effects of Accidental Explosions,
was not present. For example: Volume IH. Blast, Fragment, and Shock Loads." TM5-1300
Candidate Upgrade, AD - A176 673 Armament Research,
Pressure benefit x 100% Development and Engineering Center, New Jersey, 1986.
Referring to the pressure plot (Figure 12) it can be seen that [3] 'Military Engineering Volume IX: Assessment, Strengthen-
the area above 100% which is where the pressures are higher than ing, Hardening, Repair and Demolition of Existing Struc-
tures. Army Code No 71523 D/HQDT/18/27/7, Ministry
if there was no wall present, extends upwards to over 3H and ofrefc Ar il 192.
backwards to r0.75H. The most benefit is seen directly behind
the wall in the shadow region where the pressures are less than [4] Whitham, G.B. (1957) "A New Approach to Problems
10% of those experienced without a wall. From a designers point of Shock Dynamics. Part L Two Dimensional Problems."
of view the most important generalisations which can be drawn Journal of Fluid Mechanics, 2, pp 146-171.
from the plot are that in the area up to a distance of 3H behind
the wall the pressures are less than 50% and up to 4H they are [5] Beycr, M..E. (1986). "Blast Loads Behind Vertical Walls."
30% - 40% Uf those without the wall. Beyond 4H, although the 2 2 'd Explosives Safety Seminar, Department of Defence Ex-
pressures are obviously less, the benefit is reduced. plosives Safety Board, Anaheim, California.
58](https://image.slidesharecdn.com/a276170-221126090128-e06297b7/85/a276170-pdf-67-320.jpg)
![(61 Jones, P.S; Vitaya-Udom, K.P.; Watt, J.M., Jr. "Design of
Structures to Resist TerrorstAttack, Report 1, 1/101h Scale Table 1: Experimental Programme
Model Perimeter Wall Tests', Technical Report SL-87-13.
Structures Laboratory, Waterways Experimental Station, Series Experimental No of No of
U.S. Army Corps of Engineers, Vicksburg, Mississippi, Oc- No geometry records charges I
tober 1987. with wall
[7] Mayor, R.P.; Flanders, R (1990) "Technical Manual, Sim- I H/2 intervals 85 34
plified Computer Model of Air Blast Effects on Building (h =0 and h >0)
Walls.' U.S Department of Transportation, Research and with wall
Special Programs Administration, Transportation Systems 2 H/2 & H/4 intervals 77 32
Center, Vehicle Crashworthiness Division, Safety and Secu- (h >0)
rity Systems Division. Kendall Square, Cambridge. with wall
3 H/4 intervals 31 8
[8) Philip, E.B. "The Passageof Blast Over a Wall." Ministry (h =0)
of Home Security, 1942. no wall
[9) Smith, P.D.; Mays, G.C.; Rose, T.A.; Teo, K.G.; Roberts, 4 H12 intervals 24 6
B.J. "Small Scale Models of Complez Geometry for Blast (h =0)
no wall
Overpressure Assessment." Int. J. Impact Engineering Vol. 5 H/2 intervals 90 27
12, No. 3, pp. 345-360, 1992. (h >0) 90_27
(101 "BlastEffects. Version 2.1" Defence Nuclear Agency, Wash-
ington, DC 20305. Horizons Technology, Inc, 7830 Claire-
mont Mesa Blvd. San Diego, CA 92111. 21st December
1984. Table 2: Comparison of experimental parameters
[11] Britt, J.R; Drake, J.L; Cobb, M.B; Mobley, J.P. "Blastinw
User's Manual." Applied Research Associates, Inc. U.S. Parameter (m/kg/l3) RMCS Beyer (ref[51)]
Army Engineer Waterways Experiment Station, 3900 Halls H/W'/ 3
0.711 0.654
Ferry Road, Vicksburg, Mississippi 39180-0631. r/W"/
3
0.327 0.291
[12] Baker, W.E.; Cox, P.A.; Westine, P.S.; Kulesz, J.J.; z/W11 3
0.258 0.291
Strehlow, R.A. "Explosion Hazards and Evaluation" Else-
vier Scientific Publishing Company, 1983.
PLAN
List of Symbols
H = Wall height, (mi) Gauge Instrument
R = Distance to point of interest behind wall, (mnm) array carriage
h= Elevation of point of interest behind wall, (mm) r
W= Charge weight (kg TNT equivalent) "II*
r = Distance of charge to wall, (mm) Charge
z = Elevation of charge above ground, (mam) W R
/ 7777 //7///7
ELEVATION
Figure 1: Experimental layout at ERDA
59](https://image.slidesharecdn.com/a276170-221126090128-e06297b7/85/a276170-pdf-68-320.jpg)


![allowing the reacting products to propagate into wave. As the radial distance is increased to about
surrounding space, where more oxygen is 5 charge radii, the contact surface will lag the
available. The thermal environment within the front of the shock by about 0.4 charge radii.
initial space, or the expanded space, will be of Figure 2 shows the approximate geometry at 5
more concern than for the same detonation in free
air, since the reacting products cloud will expand
throughout the structure until a volume of space • to
has been enclosed sufficient to provide the (n RECI NWPSS.ED-
requisite oxygen for combustion. Addition of PoOIf s2 - -s
___ ___AIR
admixtures such as powdered aluminum to the LU0.5 S- --
explosive fill simply compound the problem even P M
further, due to the longer reaction times involved. o _ ..
AGMENT r 22
0 1 2 3 4 5 6
To an analyst or engineer attempting to assess DISTANCE, feet
effectiveness, vulnerability, or structure survival,
it will be necessary to have modeling capability to
treat this multicomponent, time- and space- Figure 2
dependent environment.
charge radii [after Kinney, 1968 and Brode, 1957].
In Figure 2, we show the relative overpressure.
ENVIRONMENT ILLUSTRATION The position of the fragments from the weapon
case is also indicated. As the expansion continues,
Consider an idealized spherical, cased charge, as let us take another "snapshot" at a distance equal
illustrated in Figure 1. Let us consider the to I I charge radii, as indicated in Figure 3. Note
detonation of this item in detail.
Wto
0W 24kCOMPR SSED
WTOT. PRO CTk94
(1000
~ ~ ~ 40
b)Ib)rTS"
N
0.5 ____ HOCKED
40.1
CM0.
(118 )WFAGWNS-_. S2-U Si
> 08
32-8 cmDISTANCE, feet
(400 Ib)
Figure 3
Figure I
the second shock, inward directed, at this time.
Initially, consider the charge of Figure 1 to Note also the pressure rarefaction behind or inside
detonate in free air. As discussed above, the case the region of recompressed products.
will initially expand to a radius of about 22 inches,
before rupture. At that point, the gas escape and In an idealized sense, assuming a sufficient supply
initial shock formation will begin. Initially, and of oxygen, the products cloud will reach a
out to a distance of some 2 charge radii, the maximum dimension of about 16 charge radii.
contact surface, or interface between outer edge of Within that distance from the weapon, the
products cloud and shocked air, will nearly environment will be one of complex blast, as
coincide - the contact surface will be just over one opposed to pure air blast, and any structural
shock front thickness behind the front of the shock element within this region will first see the air
63](https://image.slidesharecdn.com/a276170-221126090128-e06297b7/85/a276170-pdf-72-320.jpg)

![overpressure may be estimated from Equation 1, 4000
due to Weibull [1968]. .
(I) • 3ooo
_3 00
P=22.5 2.20 0 a
V ~~~~~2000 ______
800
0 1.0 2.0 !
4.0
Where: P = pressure, bars 0 ASS-VOU ME
PAT2IO,
kg/m
3
Q = weight of TNT, kg
V = compartment volume, m3
Figure 6
This quasistatic pressure phase can be important
for structural loading. A heavy element could mass to air volume. Bear in mind that for an
survive the impulsive loading of the initial blast, explosive with an oxygen balance that is different
only to fail under the effective static loading of this from TNT, a different thermal peak should be
phase, at a lower pressure, but over a longer time. expected. Figure 7 shows an actual record of
temperature obtained within a partially vented
Finally, one needs to consider the thermal
environment produced by such an internal 2000
explosion. As indicated above, this effect is
usually ignored in most free field weapon effects 1600
studies, since the high thermal excursions occur
only in the fireball region, and within this region 1200
most targets of interest are damaged by the blast
and/or fragmentation effects. Within a structure 800
however, the fireball is likely to fill an "average"
sized compartment, as indicated above. Two 400
mechanisms lead to temperature reduction from
peak fireball temperatures. First, the original o . . . . . . . . .
I
walls or surfaces of the compartment may be -.0 0 to 2.0 3.o 4.0 5.0
breached, allowing expansion of the products cloud TAE, sec
(or fireball) into adjacent spaces, and consequent
cooling. Second, if the products are contained in Figure 7
an unbreached or unvented enclosure, only heat
transfer to the surrounding surfaces will cool the chamber during experiments at our laboratory.
fireball. In either case, the temperature will Note that, while the temperature reaches a high
remain elevated for an appreciable period of time. initial value, the longterm or residual temperature
is much below this peak. The peak fireball
Peak (or fireball) temperatures may be estimated temperatures, as inferred from data such as Figure
for our ideal TNT weapon, using published results 6, will last only a very short time - of the order of
[Kinney, Sewell, and Graham, 1979]. As can be milliseconds to tens of milliseconds, while the
seen from Figure 6, the peak temperature within a elevated residual temperature will typically decay
space is controlled largely by the ratio of explosive over durations of seconds to minutes.
AN INTERNAL EXPLOSION
Let us consider the detonation of our idealized
warhead at the exact geometric center of a room,
32 feet square in plan, with 10 foot height, floor to
65](https://image.slidesharecdn.com/a276170-221126090128-e06297b7/85/a276170-pdf-74-320.jpg)


![Figure is a schematic view of the interaction pressure, Pi(t). The
dotted line in this load diagram represents the free-field stress.
9121346
PI P
high -explosive P
charge. W,L,B
k dl
L HI-11H
R2
to
Figure 1 Side burst load case of a buried rectangular Figure 3 One-Mass-Spring System with damping and inter-
structure. [11 action load diagram, Pi(t).
In the next section, the in-structure accelerations predicted with
912,3-7 the TM5-855-1 are compared with response results of the Mass-
Spring System loaded with predicted interaction pressures and
D •with measured interaction pressures. These results are
0T compared with measured in-structure accelerations.
08
COMPARISON PREDICTIONS WITH EXPERIMENTAL
RESULTS
06
Set-up conditions
a,
0 - ,Experiments were performed in dry, loose, backfilled sand. The
free-field ground shock pressure was measured with special soil
pressure transducers. These transducers record the interaction
W-K"at,,odpressure between soil particles and transducer adapter. A built-
L C.* orrootin accelerometer records the motion of the adapter which is used
R1 duitlaý front oxPboon to
WodrQ•,, oe01,d. to adjust the measured interaction pressure to the actual free-
0 Ifield pressure the soil particles experiences. This measurement
S2 technique is discussed in 131 and appeared to be valid. The
R/H'rateofrargelolh2 ofwad (sie ox) or l1 adjustment appeared to be essential. As mentioned earlier,
a 01
ratnge Iowdh ofrool (ov""ad to"t) references (21 and 13j concluded that the free-field ground
shock parameters were underpredicted when compared to
Figure 2 Reduction factor, RF, for in-structure acceleration. measured values.
[1] A fully instrumented cubic concrete structure (volume = I m3
,
mass = 1000 kg) was buried at a depth of 2 metres. The
In this approach it is assumed that the average motion of a measured in-structure accelerations are used to verify the TM5-
volume unit of soil particles responds in the same way as any 855-1 predictions and the Mass-Spring System results.
given structure with the same dimensions. However the actual Table I shows the scaled distances of the structure and the free-
interaction process taking place is a function of shockwave, field pressure transducers to the point of explosion.
structure and surrounding soil characteristics. Because of the
acoustic impedance difference between surrounding soil and Table I View of performed experiments (21
structure, reflection of the shock wave will occur. Therefore the
actual peak load on the structure can be significantly higher than Experiment Charge Rs Rs Rs
the free-field stress. The decay of the load in time is determined Number Weight Structure T•,nsducer I Transducer 2
by rarefaction waves which are developed at the edges of the (kg) (mikgI/3
) (m/kgl/ 3
) (mA/gl/ 3
)
structure. These wave properties depend on the free-field ... ...
shockwave velocity and duration and the structure dimensions. 1,2, 3 0.125 6.0 6.3 4.0
One method to quantify the dynamic response of a structure 4.5, 6 0.250 4.8 5.0 342
loaded with a interaction pressure, Pi(t), is modelling with a 7. 8,6 0.35 4.2 5.0 2
One-Mass-Spring System. In such a model the structure is 7, 8 ,9 0.5 4.2 4.4 2.8
characterized as a lumped mass and the surrounding soil that
offers resistance against the motion of the structure is
characterized with a spring and damper. A schematic view of Rs* = Scaled Distance RIWI/ 3
this system is presented in Figure 3. Also presented in this
81](https://image.slidesharecdn.com/a276170-221126090128-e06297b7/85/a276170-pdf-90-320.jpg)
![Prediction TM5-855-1 Figure 4 shows the response of the lumped mass loaded with a
pressure-time diagram as predicted with the TM5-855-1 (scaled
The manual [I] suggests for dry, loose sand an attenuation distance 3.8 mi/kg"/ 3
), i.e. peak pressure is 30.6 (2x15.3) kPa,
coefficient, n, of 3.00 to 3.2-. A worst case value of 3.00 is duration is 32 ms and risetime is 1.6 ms.
chosen for the predictions. The acoustic impedanc, (p.c) is
suggested to be 2.7.105 kg/m2
-s [1. The coupling factor, f, is
for this set-up condition 1.0.
According to the Technical Manual [1] the duration of the free- '-
field shock wave, to, is twice the predicted time of arrival which E
is defined as the distance to the point of explosion (3 m) -
devided by the seismic velocity of the shock wave (183 m/s) '- !
and is therefore 32 is for all charge weights. The risetime, tr, is
defined as 10% of the time of arrival, i.e. 1.6 ms l].
[I].-
In Table 2 the prediction of free-field shock wave parameters in . " .... _
front of the structure and the in-structure acceleration for this
experimental set-up are presented. -.
Table 2 Prediction of free-field and in-structure parameters [ 0 2o 40 60 4.
R/Wi/3 P0 to tr AO. Lu...... mass
(m/kgI/3) (kPa) (nis) (mns) (•xTVsI)
6.0 3.8 32 1.6 4.8 Figure 4 Acceleration of lumped mass (scaled distance
4.8 7.7 32 1.6 9.7 3.8 m/kg 1
/3
) to TM5-855-1 load.
4.2 11.5 32 1.6 14.5
3.8 5.3 32 1.6 19.4 The response of the Mass-Spring System on the measured load.
i.e. peak pressure is 43.6 kPa, duration is 17 ms and risetime is
ATM* = In-structure acceleration (= RF-Aavg) 3 ms [21, is shown in Figure 5.
One-Mass-Spring System calculations F
As explained earlier, the Technical Manual procedures ignore 20.]
the interaction process taking place between the ground shock I
and structure. To quantify this miscalculation towards in- 104
structure motions, One-Mass-Spring System calculations are
performed with the predicted and the measured interaction load..-----/ _
...
0_ _
One of the major difficulties to determine the dynamic response o._-
of a structure in soil is quantifying the volume of soil that offers
resistance against the motion of the structure and therefore the -10-
spring constant. Richart (41 defines the spring constant, k, for a - .
One-Mass-Spring System as function of the shear modulus, a 0 20 40 6o 80 1(j
normalized radius of the surface that experiences the resistance, Ti.o 1-;1
the length of the structure and Poisson's ratio of the soil. acct•o
-at,o umoo. mass
According to reference [4] the spring constant for this set-up
has a value of 9.6-10 7
N/ni.
The damping of the system is characterized with the acoustic
impedance [51 and measures 2.7.105 kg/m2
-s [1]. Figure 5 Acceleration of lumped mass (scaled distance
The response of the Mass-Spring System is calculated with the 3.8 m/kg 1
/3
) to measured load.
predicted and measured interaction load. In the case of the
predicted load its shape is simplified to a triangular shape with a This response simulations are also performed for the remaining
certain risetime, peak load and duration. The risetime as well as scaled distances of 4.2, 4.8 and 6.0 n/kg'/ 3
. The results are
the duration of the load function is the same as for free-field presented in Table 2.
shock wave. The amplitude is amplified with a factor two to
include the reflection process. This is the case in which the Experimental results
structure does not move during impact and is therefore the
worst case. Calculations have shown that the influence of the On each scaled distance three experiments are performed.
rarefaction process, i.e. the influence of the kink in the decay of Figure 6 shows an example of a measured in-structure
the load (see Figure 3) on the peak response is negligible, acceleration in the case of a scaled distance of 3.8 m/kg /3.
Therefore the decrease of the load is taken to be linear.
82](https://image.slidesharecdn.com/a276170-221126090128-e06297b7/85/a276170-pdf-91-320.jpg)
![In [2] and [31 it was stated that the measured free-field ground
20i -shock parameters were about 5 to 100% higher than the
predictions depending on scaled distance. For useful corn-
SI parison of the Mass-Spring System results with measured in-
structure accelerations (AMEAS) the response calculations were
Ic- also performed with the measured interaction pressure as load
on the lumped mass. These Mass-Spring results (AME.SDOF)
... are almost similar with measured values (AMEAS).
---- - --- - ---- The measured in-structure accelerations (AMEAS) are about 30
to 100% higher than predicted values (ATM). This means for
this particular test program that the TM5-855-1 is not as
-.0 conservative as it is presented. Nevertheless the TM5-855-1
0 o2 40 6'0 80 00o
0miO I,0 procedures are presented only for preliminary design purposes
G--,o-a ,,,kQ and in that context they are useful.
CONCLUSIONS
Figure 6 Example of measured in-structure acceleration
(scaled distance 3.8 m/kgI/3). The Technical Manual TM5-855-1 presents a procedure to
determine in-structure shock data for preliminary design
The mean measured peak accelerations of three experiments per purposes. However, the manual ignores the aspects of the
scaled distance are presented in Table 3. In this table the interaction process between ground shock and structure. The
predicted and Mass-Spring System results are also included, paper examined the introduced errors by comparison with
experimental and theoretical results.
Table 3 In-structure peak in-stnucture acceleration dam In the particular test set-up the approach of the TM5-855-1 to
ignore the interaction process and the dynamic response of the
structure, gives reasonable good results (within 10%). In
R/W!/3 A ATM-S )F AME-Sl2OF AMEFS general, it depends on the structure and surrounding soil
(m/kg1/3) (rn/Ts) (nT/s?) (n/Sz) (nflsz) characteristics in what extent the ignored interaction process
influences the result.
6.0 4.8 5.2 7.9 10.2 The dynamic response determined with the proposed procedure
4.8 9.7 10.6 12.9 14.7 agreed well with measured in-structure accelerations.
4.2 14.5 15.8 7.3 19.9 The applied procedure enables us to predict the in-structure
3.8 9.4 22.4 24.2 25.1 shock, due to the measured load, within 30%.
The applicability of the TM5-855-1 to predict the in-structure
ATM = Prediction of TM5-855-1 shock is limited by the accuracy of the free-field ground shock.
=Response One-Mass-Spring System on twice TM Under the applied test conditions the shock was underestimated
ATM-SDOF =RsosOn-ssprnSytmotieTM up to 100%.
free-ficld load
AME-SDOF = Response One-Mass-Spring System on measured
interaction load REFERENCES
AMEAS = Mean measured value 1. TM5-855-1,'Fundamentals of protective design for con-
ventional weapons'. US Army Corps of Engineers, Huntsville
Table _j shows that the TM5-855-1 predictions, which are Division. November, 1985.
assumed to be on the conservative side, underpredict the in-
structure acceleration. 2. Van Dongen, Ph., 'Verification of experimental determined
The calculations of the response of the Mass-Spring System on ground shock parameters with TM5-855-1 and the response of
the predicted free-field loads are executed with a reflection a buried concrete structure' (in Dutch). PML 1991-69.
factor 2 (ATM-SDOF). The peak acceleration of the lumped 3. Van Dongen, Ph. and Weerheijm, J. 'Interaction of
mass is about 10% higher than the predictions (ATM). With this Ground Shock with Soil Pressure Transducers'. Structures
result it is concluded that in this particular test case the Under Shock and Impact II: Proceedings of the Second Inter-
structures' peak response is almost the same as the soil particles national Conference, held in Portsmouth, U.K., 16 th-
so the TM5-855-1 procedure is in this particular case accurate. 18 th June, 1992.
To quantify the effect of another mass weight on the dynamic
response the same calculation is performed with a mass of 4. Richart, F.E. and Woods, R.D., 'Vibrations of soils and
5000 kg and 500 kg in stead of 1000 kg on a scaled distance foundations', Prentice-Hall, Inc., Englewood Cliffs,
of 3.8 m/kg 1
/3
. The results are respectively a peak acceleration New Jersey, 1970.
of 5.9 and 34.3 n/s 2
and are considerable different than the
TM5-855-1 prediction of 19.4 m/s 2
(see Table 3). In this 5. Hinman, E.E. and Weidlinger, P., Single-Degree-of-
example only the mass is varied but is obvious that also the Freedom solution of structure-medium interaction. Inter-
other Mass-Spring parameters have effect on the response nationales symposium'Interaktion konventioneller munition mit
result. So it depends on the structure and surrounding soil schutzbauten', band 1. BRD, Mannheim, 09-13 Marz 1987.
characteristics if the prediction of the manual is acceptable or
not.
83](https://image.slidesharecdn.com/a276170-221126090128-e06297b7/85/a276170-pdf-92-320.jpg)
![STOCHASTIC SIMULATION OF IN-STRUCTURE SHOCK
DUE TO CONVENTIONAL WEAPON EFFECTS
Erwin Kessler, Consultant of Laboratory Spiez
Bernard Anet
Defence Technology and Procurement Agency
Laboratory Spiez, CH-3700 Spiez, Switzerland
ABSTRACT and without burster slabs (fig. 1). The simulation code
combines three different shock components: (a) Rigid
SHOCK is a computer program able to stochastically body motion of the shelter, (b) inelastic deformations and
simulate in-structure shock effects within shelters due to (c) elastic vibrations inthe reinforced concrete structure.
conventional weapons effects. The simulation model
combines three different shock components: the rigid body (a) Rigid body motion
motion of the shelter, the inelastic deformation of the To calculate the motion of the center of gravity of the
reinforced concrete structure and the elastic vibrations of shelter, thestructure is modelled by arigid body embedded
the structure. The program provides stochastic default inthe soil [2). So far only a one-dimensional wave model
values, e.g. interm of probability distributions for many is implemented, suited for superseismic nuclear loadings
model parameters or the user has the option to define his but less adapted to the case of conventional weapons
own specific values for particular site conditions. loading because the plane wave assumption is rather
inexact in this loading case. We are presently working
towards a better solution.
(b) Inelastic deformations of the shelter
Dynamic inelastic deformations of the shelter are a main
INTRODUCTION loading effect for equipment attached to the inside of the
shelter. The ceiling, walls and floors of the shelter are
Under contract with the Laboratory Spiez, a computer modelled by Equivalent Simple Oscillators (one-degree of
program has been developed to stochastically simulate in- feedom) - a classical procedure - assuming that the main
structure shock effects within shelters. The name of the inelastic deformations are governed by the fundamental
program is SHOCK. Some years ago, the nuclear shock mode of the system. The soil-structure interaction is based
simulation part of the program was completed and has anthe interaction of one-dimensional ground shock waves
been successfully applied since for various practical withthemovinganddeformingshelterwall(2,5. Meanwhile,
purposes such as shock testing of shelter equipment this model has been developed and published
[1,2,3,4,5]. Conventional weapons effects are now independently by other authors [6,7,8]. The basic principle
implemented too and we are working on further of the model is the physical fact that the dynamic soil
improvements. pressure on a wall due to the reflection of a plane pressure
wave becomes weaker, ifthe wall moves away due to rigid
body motion and/or deformaiton.
INSTRUCTURE SHOCK MODELING
(c) Elastic vibrations
The application range of the program SHOCK includes The amplitudes of the elastic vibrations are limited by the
shallow buried reinforced concrete box-type shelters with ultimate strength of the shelter construction materials
84](https://image.slidesharecdn.com/a276170-221126090128-e06297b7/85/a276170-pdf-93-320.jpg)
![//
stochastic impact Ifoints. angles and velocities /
/
I //
horizontal •••
shock "-
Fig..L Shelt:.Ji concept underlaying the program SHOCK
(steel, concrete). Although these elastic vibrations are developed with the the theoretical frequencies as mean
mainly responsible for the peak acceleration level of the values. Thei 100 damped harmonic vibrations with
total shelter response, their contribution to the velocity and stochastically changed frequency, phase and amplitude
displacement of the shelter are small. They are therefore were superposed. This allows to determine the elastic
only critical for brittle equipment staying in direct contact vibration loading at each point of the shelter wihre
with the shelter walls. Usual fixing elements are able to equipments are attached. Although sophisticated analysis
absorb the very small displacements related to high ofthe problem have been performed [4]. the model is rather
frequencies above 300 Hz. Thus the frequency range of the hypothetical and needs to be verified by large scale tests.
elastic vibration model for typical Swiss shelter has been The vibrations are damped by the soil contact as the
chosen from about 50 Hz (the fundamental frequency) to vibration energy radiate into the soil. That means that the
300 Hz. In this frequency range, nevertheless about 100 laoding due to the elastic vibrations is less intense insmall
different vibrational modes can be identified for a three shelters than in larger ones with many partitioning walls
dimensional shelter construction. These modes cannot be which are not incontact with the soil. Such partitioning walls
calculated or measured exactly, as they are very sensitive can vibrate quite freely in certain modes and induce
to small variations in dimensions, stiffness, cracks etc that resonance effects in attached equipment. The elastic
may occur under practical conditions. To overcome this vibrations of the shelter dominate the peak acceleration
inherent difficulty, a stochastic vibration model has been values of the total shelter response, but their contributions
85](https://image.slidesharecdn.com/a276170-221126090128-e06297b7/85/a276170-pdf-94-320.jpg)
![to velocity and displacement are negligible, penetration characteristics of the bomb; the dynamic
The pressure time functions of the detonating weapons are structural parameters of the shelter as well as the soil
taken from standard literature [10.11]. properties which are in our case representative of Swiss
shelters. For each parameter the user has the option of
applying either the pre-defined random variables or his
STOCHASTIC SHOCK SIMULATION AND EQUIPMENT own specific values for particular site conditions.
TESTING
The results of a large number of purely stochastical
The not precisely known location of the many vibration sinulationsprovidestatistica lInformationforcertain shelter
modes of the shelter mentioned above is not the only classes, enabling the user to define maximum instructure
aspect of the shock simulation problem requiring a shockeffectsonthedeslred confidencelevel. This again is
stochastic modelling. The penetration of projectiles into a basis for balanced shelter and equipment design.
soil and concrete is another one: to determine if a bomb Furthermore, the stochasticshock-time-functions provided
perforates a shelter or if it causes spalling effects at 'he by the program can be used to drive servo-hydraulic
inside, a stochastic model has been implemented based facilities for shock testing of equipment and to gather
on a paper presented by Lawrence Twisdale and others at information about suvivability of a particular equipment.
the 5th International Symposium in Mannheim, Germany,
in 1991. Inthis paper (91 probability distributions are given
forthe penetration depth of projectile and forthe occurrence EXAM PLE
of spalling. For many other model parameters, our program
provides "stochasticdefault values", that means probability A bomb with 250 kg TNT penetrates deep into the soil by
distribution functions. Among these are: the actual impact the side of a small shelter and detonates 6 m away from the
point on the target taking into account the Circular Error shelter wall. The shock time functions, here in terms of
Probability (CEP); the impact angle, velocity and the acceleration histories, arecalculatedforthefollowingcases:
a) horizontal rigid body motion of the the shelter (acceleration in units
g = 9.81 m/s 2
):
maximum acceleration = 28.7 g
maximum velocity = 2.0 m/s
90. ~-
60. -- - - - -
a
[p
30.
0.
-30.
-90.
.0 .05 .10 .15 .20 0.25 0 30
Time [86
86](https://image.slidesharecdn.com/a276170-221126090128-e06297b7/85/a276170-pdf-95-320.jpg)
![b) horizontal motion at the center of the front wall due to rigid body motion
+ Inelastic deformation:
maximum acceleration = 198.9 g
maximum velocity = 2.99 m/s
ak (g]
90. _
60.
30.~~ 7__ __
30.
-30._______
-60. s___ ___
-90. ________
.0 .05 .10 .15 -20 0.25 0.30
c) horizontal rigid body motion + inelastic deformation + elastic vibrations
at the center of the wall:
maximum acceleration = 211 g
maximum velocity = 3.1 mls
90. _
30.
30.
-30.
-60.____
-90.________
.0 .05 .10 .15 .20 0.25 0.30
87](https://image.slidesharecdn.com/a276170-221126090128-e06297b7/85/a276170-pdf-96-320.jpg)

![SUB SURFACE BARRIERS FOR GROUND SHOCK ATTENUATION:
NUMERICAL TECHNIQUES TO MODEL EXPERIMENTAL RESULTS
Leslie J. Kennedy', Major Frederick G. Hulton RE2
and Michael C.R. Davies3
'Royal Military College of Science (Cranfield) Shrivenham UK
2
Defence Research Agency, Christchurch UK
3University of Wales, Cardiff UK
ABSTRACT
The paper charts the development of a numerical model, attractive option as well. The benefits of computer
using the AUTODYN finite difference computer code, modelling are: the accurate prediction of results by
designed to replicate centrifuge experiments carried out to computer reduces the need for experiment, with savings in
examine the effects of sub surface barriers on ground both time and money; also, because a computer can
shock attenuation. The experimental results have been used readily produce far more results than an experiment, the
to validate the model performance but the material models computer model can be used to select the most fruitful
used have derived from other sources. In this way the areas for experimental investigation and, finally, if the
model is independent of the experimental parameters. The mathematical model is a good idealisation, it may aid
numerical modelling has not included the model structures understanding of physical behaviour.
used in the original experimentation but has concentrated
upon free field pressures in front of and behind the various With the rapid evolution of computer capabilities, the
barrier options tried viz polystyrene foam, concrete and prime need is to validate the numerical models being
composite. The modelling results show an encouraging developed. The i ucity of data from explosive tests make
agreement with experimental measurements. Some the dynamic effects of explosive events and material
limitation in the soil model has been identified due to the response at high rates of strain difficult to model. A
unknown effects of pore water pressures but, at a number of researchers are working to develop better
reasonable working range for structures, the model material models and techniques [eg References 2,3 and 4].
produces very acceptable results.
Centrifuge model tests provide an excellent means of
INTRODUCTION validating numerical methods by comparing results
obtained. In a scale model, the boundary conditions are
Sub surface barriers have been considered for screening exactly specified; removing the necessity for making
the effects of ground shock against underground structures. approximations of boundary locations in the analysis.
Such barriers might be installed during the building of Materials which have well defined properties may be
these structures or else be added later to enhance chosen for the model and the repeatability of model tests
protection. Barriers could screen out the ground permits the applied loading and system response to be
transmitted shock altogether orjust attenuate the shock and closely monitored.
loading effects. The traditional approach to ground shock
prediction has been to carry out instrumented tests at full Studies of the attenuation of ground shock using protective
scale and use the results to derive the likely effects in barriers have been conducted using centrifuge model
similar situations. Full scale tests are very expensive and testing [References 1and 5] and these have provided the
considerable effort has been devoted to making use of opportunity to make use of the recent advances in
scale modelling techniques and numerical analysis. Such numerical modelling to develop a method which can be
techniques require validation. It has been shown that model validated using the results from the centrifuge experiments.
testing in a centrifuge gives good results, because the self
weight of the soil is increased to prototype values It is important to distinguish between models which rely on
[Reference 1]. input data obtainable only from experiments involving the
situations to be modelled and models that can predict
However, even centrifuge tests are considerable results using input data obtained from other sources. The
undertakings and this makes computer modelling an former type of model should, within its range of
89](https://image.slidesharecdn.com/a276170-221126090128-e06297b7/85/a276170-pdf-98-320.jpg)


![KEY pressures and increased the effective soil strength. This
Pressures ] Model Experiment would reduce the crater volume. The numerical model, of
behind Barriwe Free field 0 course, made no allowance for the presence of pore water.
• 31 bar Foam barrier o
SConcrete barrier o a The numerical model did not reproduce the standard bowl
Composite barrier & A shape. The true angle of friction is a function of porosity.
thus at the sides of the crater, where the sand has been
12mm compressed by the shock wave, the angle of friction is
15m comparatively steep but elsewhere, particularly in fallen
27mm ejecta, the angle is lower. This produces the characteristic
1Foam bowl shape. The linear Mohr-Coulomb model must
Face of barrier ocrete inevitably produce a cone-shaped crater. To provide a
S•
j• ompooste more exact result, it is likely that a material model
10 including the influence of pore water would be needed.
,to cm However, crater prediction is not a particular area of
"0 uncertainty because there is plentiful empirical data
0
o " available with reasonable predictive relationships
a • [Reference 81.
. 0 PRESSURE
,3 6
0
0 I 2.a
r
15 20 25 30 I"
Distance from Charge Centre (cm)
Figure 7. Pressure reductions behind barriers. V/1
The figures in the table show a significant underestimate //
by the model of the experimental attenuations achieved. 8
9.4 9. 12
However, the general trend of variations between barrier (CU,
gm,s) TI•E
types is modelled. Also, the model predictions are on the FloR
safe side. Because the experimental pressure gauges were
not always at exactly 20 cm from the charge centre, some Figure 8. Pressure plots behind composite barrier at
judgement has been necessary in calculating the figures. "targets" spaced from 20 to 28 cm from charge centre.
Figure 7 clearly shows the relationships too. In addition,
it should be noted that the experimental barrier was planar, The free field pressure predictions. best summarised in
whereas the model barrier is cylindrical. Off the normal, figure 6, show reasonable agreement with experimental
the distance to the experimental barrier is increased and results, particularly at the range of interest for structures
the barrier thickness is also increased. Refraction effects being considered for barrier protection ie 20 cm in the
may occur. model. The higher experimental values at short range may
be due to the means of recording pressures.
DISCUSSION OF RESULTS Experimentally, free field pressures are measured using
load cells of finite mass, so there is inevitably some soil-
The preliminary work produced model craters of realistic structure interaction which is likely to enhance the
form though incorrectly proportioned. The lesser scale of pressures recorded [Reference 9]. This effect is likely to
the experimental craters, when compared with the model be most marked in areas of high rate loading near the
version (figure 4), was probably due to the influence of explosion and less significant when loading is slower. On
pore water. The initial experimental set up had relied upon the other hand, since the mathematical model chosen does
suction pressures in the pore water to achieve stability (to not take account of stiffness enhancement on initial loading
hold the model intact on its side prior to centrifuge spin at high rates in partially saturated soil, the computer mcdel
up). During soil failure under explosive pressures, might underpredict free field pressures close to the
dilatancy effects would have enhanced negative pore explosion.
93](https://image.slidesharecdn.com/a276170-221126090128-e06297b7/85/a276170-pdf-102-320.jpg)
![The behind barrier effects, which are best summarised in to allow the study of soil-structure interaction, in particular
figure 7, have been over-predicted by the model. This the phenomenon of inertial loading and by the use of a
provides a safe solution. There is closer agreement with 3-D model program.
the foam barrier results and this also applies to the foam-
concrete composite. These barriers are shown, by both ACKNOWLEDGEMENT
modelling techniques, to be effective in reducing ground
shock. This is, however, not the complete situation. The experimental results were produced with the support
Underground explosions can produce two forms of of the Procurement Executive, Ministry of Defence and on
pressure loading on buried structures: "shock loading" and behalf of the Defence Research Agency, Christchurch.
"inertial loading" [Reference 1]. Shock loading is
essentially the loading produced by free field pressure
waves, which may be enhanced on reflection at the soil- REFERENCES
structure boundary. Shock loading may be mitigated by the
insertion of low acoustic impedance barriers in the path of 1. Davies MCR and Williams AJ "Centrifuge Modelling
the shock wave. Inertial loading is the effect of the the Protection of Buried Structures subjected to Blast
momentum of the soil mass set in motion by the explosion. Loading" Structures under Shock and Impact I1Bulson PS
Since momentum cannot be reflected, a foam barrier will Ed.,Thomas Telford London, pp 663-674, 1992
have minimal effect on inertial loading but a rigid barrier
may provide some protection. 2. Stevens DJ and Krauthammer T "A Finite
Difference/Finite Element Approach to Dynamic Soil-
The experimental programme was designed to study Structure Interaction Modelling', Comp and Str 29 (2), pp
barriers protecting against both forms of loading. 199-205, 1988
However, while free field pressures give a good indication
of shock loading pressures, inertial loading does not 3. Pullen AD, lanucci L, Newman lB and Perry SH,
become apparent until the motion of the soil mass is "Experimental Investigation of the Dynamic Loading of
obstructed by a structure. Unlike the experimental set-up, Soil and the use of Finite Element Simulation for
the computer model does not contain structures and so is Analysis", Structures under Shock and Impact Bulson PS
restricted for the time being to the investigation of free Ed, Elsevier Amsterdam, pp 443-454, 1989
field pressures, the determinants of shock loading 4. Sheridan AJ, Pullen AD and Newman JB, "The Search
CONCLUSIONS for a General Geologic Material Model for Application to
Finite Element Methods and Hydrocodes", Structures
There is very good qualitative agreement between the under Shock and Impact II, Bulson PS Ed, Thomas
experimental results and the output of the mathematical Telford London, pp 199-210, 1992
model developed. For the region of predominant interest
(range 20cm) there is good quantitative agreement for free- 5. Davies MCR, Williams AJ and Claber KJ, "Centrifuge
field stresses in the absence of a barrier and adequate Model Testing to investigate the use of Barriers to mitigate
agreement for the attenuation effects with various types of Blast Effects on Buried Structures", Proc 6th International
barrier. Symposium on Interaction of Nonnuclear Munitions with
Structures, Panama City Beach Florida, May 1993
A satisfactory mathematical model of the soil was
constructed using data obtained from non-explosive 6. Private Communication from University of Manchester
experiments. However, the model could usefully be Engineering Department, 1992
developed further to take account of the effects of partial
saturation, though this would be difficult, and thereby 7. Private Communication from the Defence Research
improve the prediction of free-field pressures. Also, the Agency Farnborough, 1992
variation of angle of friction with porosity could be
incorporated to improve crater shape. 8. TM5-855-1 Fundamentals of Protective Design for
Conventional Weapons, HQ Dept of the Army, Nov 1986
The shock attenuation effect, when using barriers, shown
by the model was in line with the experimental results 9. Dongen Ph van and Weerheijm J, "Interaction of
though less in scale. The numerical model developed gives Ground Shock with Soil Pressure Transducers". Structures
sufficient confidence in the method and the material under Shock and Impact II, Bulson PS Ed, Thomas
models to carry on with the work. It is intended to develop Telford London, pp 625-635, 1992
the model further: by the introduction of buried structures
94](https://image.slidesharecdn.com/a276170-221126090128-e06297b7/85/a276170-pdf-103-320.jpg)
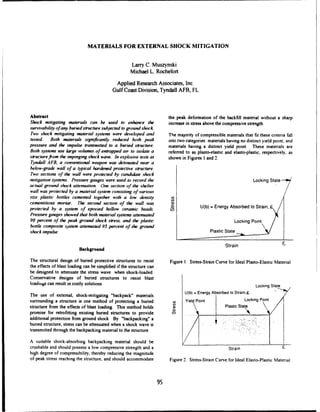


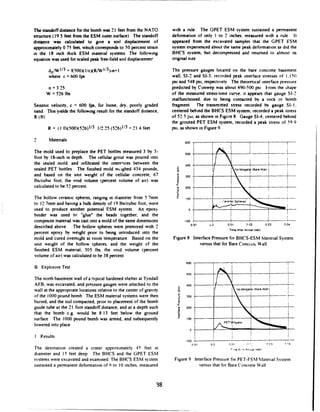


![enco,., itered in situations involving confined explosions It was desired to expand this evaluation for the following
The results are compared with response to simple conditions:
triangular approximations. The analysis is conducted
using a one-dimensional elastic-plastic spring mass Elastic-Plastic Response
system which is a true SDOF system. This is * A Combined Pulse as Defined in SHOCK
appropriate since this study evaluates only time * Variations of duration and Shock Arrival
variations in the shock load and because SDOF
equivalent systems are typically used in blast analysis Analysis
and design. Variations in load distribution over an For the current study, a similar approach was taken to
element are not considered here and are left to future that in the analysis described above Nondimensional
studies. Also, consideration of a total load history, terms now include scaled pulse duration, ultimate
shock plus a longer term gas load, typical of confined resistance, and deflection. These are defined as
explosions is not made here. Response to shock load follows:
alone is investigated and response to confined load are d 1
d/T,
left to future investigation.
In Ref. 2 we have evaluated the response of an elastic
spring mass system to a time varying load. The load is Tý rJP
comprised of the three pulses shown in the inset in
Figure 4 which are deemed representative of a shock where:
histcoy in a confined environment. The first pulse is the
largest with the second having half the amplitude (P/2) T= 2n ]_2l
and the same duration of the first. The third pulse has
half again the peak of the first (P14) while keeping its X. = r,,Ik
duration the same. The arrival of later pulses are
spread in proportion to the arrival time of the lead shock, The responding system is described by a bilinear,
which Reference 2 indicates is related to the time for elastic-perfectly plastic resistance-deflection curve. A
shocks to reverberate within a structure. The response program which solves the SDOF equation of motion for
of the spring-mass system to this triple pulse was an undamped, elastic-plastic system through numerical
compared to that under two separate triangular pulse integration was used to make numerous calculations of
load cases, also shown in Figure 4. One is a triangle response under the varied load conditions. The results
with the duration of the first pulse of the triple-pulse, and are provided in a series of plots which compare
a peak pressure adjusted to match the impulse of the maximum scaled deflection to scaled duration (Figures
triple pulse, we call the "combined pulse". The second 5-10 for several different scaled ultimate resistance
is the first pulse of the triple-pulse, or referred to simply values. In each plot four cases are evaluated as
as the "first pulse". follows:
The system can be solved for a maximum scaled elastic e Case 1: First Pulse Only
response * Case 2: Combined Pressure Pulse; Duration
= Pequal to incident pulse with pressure increased to
as a function of scaled pulse duration conserve impulse; i.e. Peak pressure = 1.75P and
I d - (IW, = 1dF . duration unchanged.
Case 3: Combined Duration Pulse: Similar to that
Definitions of terms are provided in the nomenclature, provided by SHOCK, pressure matching incident
The solution is shown graphically in Figure 4 for a pulse with duration increased to preserve impulse,
particular scaled shock pulse duration and arrival time i.e. Duration = 1.7
5td and peak pressure
combination. The scaled maximum response for the unchanged.
triple-pulse tends to lie between the response of the first Case 4: Triple-Pulse: Second peak half the first,
pulse and the combined pulse. This study indicated that third peak half the second and all durations the
the triple-pulse can cause maximum deflections in same, t .
resonance as great as the combined pulse which serves
as a conservative upper limit over a wide range of These four cases are depicted in figure 11. Note that
scaled frequency for elastic systems. the scaled pulse spacing for case 4 has not been
specified in Figures 5-*i0 as was provided in Figure 4,
123](https://image.slidesharecdn.com/a276170-221126090128-e06297b7/85/a276170-pdf-132-320.jpg)


![S. SECOND PHASE : TESTS + RESULTS.
In this phase (1991-1992) all the slabs with a reinforced
edge were treated. This test series covered around 50 slabs D sag
which clearlN had much less reinforcement that) the previous
slabs. T%,o identical slabs were made from each ,
reinforcement combination. ()nl) 4 stirrups, required for
structural purposes. were placed in all the slabs in order to
stud, the influence of the steel fibres when the traditional
stirrups were replaced. Four identical reference slabs were
made with 88 kg/m- CR. These "reference slabs" were used. "
among other things. to examine the reproducibility of the -
tests. The reference slabs therefore had to display almost
identical damage patterns under an identical load.
STAND - OFF 750 MM.
The first series of slabs produced a number of results which
max be considered reliable in view of the good
reproducubility of the test series. Fig.5 shows the results in
connection with deflection as a function of the total
reinforcement. It is important to point out that the slabs .LASS
showed no visible damage or cracks. Cracks did not become
%isible until the slabs were moistened. However, the effect
of the fibres was not so immediately visible here. Photo no.2 SLAB 5
The deflec!i )ns of a number of slabs with CR + SF were
extremel) low : slab no.5 (Photo 2) with a total
reinforcement of 79 kg/m3
CRC+SFRC I 1%by volume) had
a deflection less than that of slab no.I (Photo 3). with 88
k-,,/ C'R.
[he general deflection pattern include the well-known plastic . .
hinges. wkhich varied from a fine crack to a series of parallel
cracks bearing no direct relationship to the reinforcement
percentage. No scabbing was observed.
Fig. no.7 shows that steel fibres contribute more to
deflection limitations than the same weight of reinforcing
bars. It represents the mean deflection at a constant bar
reinforcement content and variable fibre content, with the
total reinforcement content as abscis. Here it is clearly seen
that with the same total reinforcement the slab with the
lowest weight of reinforcement bars shows the least
deflection (88 and 56 kg/min)
CON(CLIUSION : So an addition o]Jiher%
in the vane total -
weight of reinloreement produce.%a higher re.%istance .
rewiltint' in a reduced keflection.De.pite the fact that the 4 •
ttUe o/ the wteel fihre.%in thi.s pha.se of the teXt.S i.s not
immediatel vribihle, the latter observation i.s %tillvery
imnportant in view of the deflection limiting property of the Photo no.3 SLAB I
fibres, even in low dosage.%.
*,
_____,_I_
6-
M11 IIo14 1211 M.14T1 IN4.4 M1A
14 11144 4241 .444 (.411
f
01 N1
I41 SI
f 1.
i 44E4I'
4( '1".s1" i sI"
•,uI . t "o tll( Si"1.
HiK[IlFl 4444
EIK'i I" SF444414
444•
IS K114.l 4414l
•'41 SIT "-I.
I'l-U 5;.1 I -X
e+I IS 1,I+1.144 *445
;fSEl'l l'-
IiK 11 4 1'54%
lIl-.ll"
Fit 5. RESULTS OF SLAB iOTO 22 Fix 7. INFLUEN(CE OF THE FIBERS
WITH LSTAND-OFF EQUAL TO 7-,0 MM WITH A ('ONSTANT WEIGHT OF BARS
160](https://image.slidesharecdn.com/a276170-221126090128-e06297b7/85/a276170-pdf-169-320.jpg)
![RESU ITS OF SLAB 10I/11/12/1
WITH A STAND-OFF EQ( AL TO 750 MI%1
r I
nt
6 SLABS WITH 88KG / %13FIBERS AND A
DIFFERENT QL ANTITY OF BARS
STAND -OFF 550 MM.
F~en in these tests good reproducibility, was observed. In
this series of tests the deflections were higher than in the
previous series. Yet the deflection pattern is totally different:
cracks along the edge. followed by a circular crack along
about ten cm of the edge. The well known plastic hinges - as
Seen] "ith a stand-off of 75 cm. had disappeared almost
conipletelN. Different slabs with a higher reinforcement
"roteflt shtowed no scabbina. whilst slabs with a lower Poon. LB1
reinforcement content did show scabbing.
The slabs with CR only. however, displayed majcr scabbing
wkithout exception.Photo 4 (slab lxx) and photo 5 (slab 5)
show~ the slabs sawn through and clearly indicate the 1
difference between the crumbled areas in a slab without
fibres (slab lxx) and with fibres (slab 5).
The deflections of both slabs are roughly identical. However.
slab 5 had a reinforcement content of 78 kg,/r 3
CRC+SFRC.
whilst slab lxx had a reinforcement of 88 kg/rn3
CR.
Absolutel% no deflection or damage was observed on the
front of the slabs.
jow 14
-A
111%.#9P R AjjlIIP U4R
1 K1. U
N ELVRN. A RT
Fiv9 EILSWTASTDOFEIATO50MIPoon.
SLB.
29161](https://image.slidesharecdn.com/a276170-221126090128-e06297b7/85/a276170-pdf-170-320.jpg)


![IMPACT COMPRESSION PROPERTIES OF CONCRETE
D. E. Grady
Experimental Impact Physics Division 1433
Sandia National Laboratories
Albuquerque New Mexico 87185
ABSTRACT by the Army Waterways Experimental Station (WES) [Ergott,
1992]. A 15-cm by 30-cm core of concrete obtained from a
Controlled impact experiments have been performed on con- larger body of material was machined to precise cylindrical
crete to determine dynamic material properties. The properties dimensions. Density and ultrasonic measurements were per-
assessed include the high-strain-rate yield strength (Hugoniot formed on the cylinder before further machining to impact
elastic limit), and details of the inelastic dynamic stress versus specimen dimensions was performed. A bulk density of
strain response of the concrete. The latter features entail the ini- 2263 kg/m3, and a longitudinal and shear elastic wave velocity
tial void-collapse modulus, the high-stress limiting void-col- of 4.45 km/s and 2.68 km/s, respectively, were determined-
lapse strain, and the stress amplitude dependence of the Ultrasonic measurements both along and across the cylindrical
deformational wave which loads the concrete from the elastic axis indicated isotropic elastic behavior. Density and ultrasonic
limit to the maximum dynamic stress state. Dynamic stress-ver- properties are in good agreement with independent measure-
sus-strain data are reported over the stress range of the data, ments at WES [Ergott, 1992]. A crystal density of about 2550-
from the Hugoniot elastic limit to in excess of 2 GPa. 2680 kg/m3
and a free water content of 4.1-4.8% by weight are
reported for this concrete [Ergott, 19921.
1NTRODUCTION
The transient response of concrete to impact loading represents
a complicated mix of thermodynamic compression and EXPERIMENTAL METHOD
dynamic strength resistance. The development of computational
models which adequately describe the behavior of this complex Impact experiments were performed with a single-stage light-
engineering material to such loads represents a challenge not gas gun of 100 mm inner-bore diameter capable of achieving
afforded by most other materials, controlled velocities over a range of approximately 50 m/s to
I km/s. A reverse ballistic configuration was used (Grady and
In the present study, controlled impact experiments are per- Furnish, 1988) in which a disc-shaped specimen of the test con-
formed which are intended to reveal the response of concrete to crete was mounted in the projectile and caused to undergo pla-
transient loading conditions, and to provide a base of dynamic nar impact on a stationary diagnostic target- The principal
compression and strength data for developing constitutive component of the stationary target was a large polymethyl
response models. Specifically, a smoothbore gas gun was used methacrylate (PMMA) disc with an interior reflecting interface
to perform planar impact experiments on concrete. A maximum (vapor-deposited aluminum). A diffused laser velocity interfer-
velocity of 1.0 km/s constrained the range of impact test data to ometer (Barker and Hollenbach, 1972) was used to measure the
below approximately 2.5 GPa compressive stress. Within this time-resolved motion as shock waves caused by the planar
stress range statistically significant data describing the dynamic impact traversed the recording interface. The impact experi-
strength, compressibility and deformational wave speed of mental configuration is illustrated in Figure 1.
aggregate concrete were obtained.
The reverse ballistic experimental configuration was used in the
MATERIAL DESCRIPTION present study because the method effectively averages the mea-
sured dynamic compression state over a sensibly large volume
Concrete tested in the present study was prepared and supplied of the test sample. This feature is attractive in heterogeneous
172](https://image.slidesharecdn.com/a276170-221126090128-e06297b7/85/a276170-pdf-181-320.jpg)


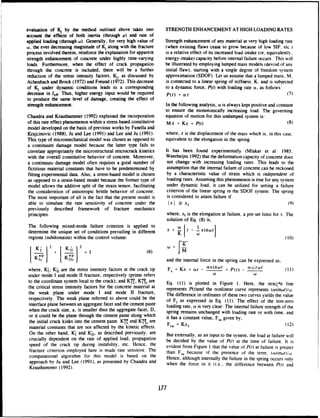


![PP
A -- °
Pf. Failure -
envelope
log(a)
Figure 6: Failure envelope for 2-DOF system Figure 7: Variation of critical rate. 0,i with r and rK
(which is stronger). On the other hand, cf, decreases as the r.). Evaluation of critical rate, in turn, requires consideration
stiffness ratio, rK increases. This means that as spring I of the continuum to include all possible modes of wave
becomes stiffer relative to spring 2, lower loading rates are propagation. To simplify this problem, longitudinal and
required to cause failure first in spring 1. transverse vibrations of the concrete body are considered
separately. Thus, two critical rates, a•t and ac, are evaluated
The two strengths, Pf
1 and Pf when plotted against log(ct), also corresponding to longitudinal and transverse vibrations,
intersect at ac as shown in Figure 6. The overall strength curve respectively Then, the overall elastic moduli corresponding to
for the system can be drawn by connecting the points of lower longitudinal and transverse deformations are determined from
ordinates as shown in dashed line. And, when ac is plotted ec and ai:2, respectively, To calculate act and tc2, similar
against rM and rK, a 3D surface is generated as shown in transfer functions as used for the 2-DOF system can be
Figure 7 which depicts very clearly its mode of variation with employed. Thus.
rM and rK as described earlier. For practical purposes, this 3D k
surface can be obtained by fitting an approximate spline surface Iog(at 0 ) = • ci (Iog(r 0 ) aimd [Iog(r,) bi•] d
through an analytical transfer function (refer to Eq. 18). , I (18)
where, aja, b
10, cia, mid n
10 and k are constants and 0=1.2
The main goal for applying 2-DOF analysis to a concrete body stands for longitudinal (1) and transverse (2) waves. Numerical
is to obtain equivalent moduli for concrete at high loading methods can be employed to evaluate these constants
rates. Thereafter, these equivalent moduli are used to determine rigorously.
its fracture mechanics behavior governing the constitutive
model described by Chandra and Krauthammer (1992). The Thereafter, find the effective modulus, Ee of concrete body to
concrete body is idealized as a combination of two different be used in the subsequent analysis by incrementing E,,,I as
materials: Cement matrix and aggregates. Each of these entities follows:
is considered homogeneous within itself. Nevertheless, one 8a1 (19)
must consider the effect of a continuum, and the following Ee/!= E. -9
procedure is proposed: .-
f E
Using the given moduli for cement matrix and aggregates where, cc is the failure strain of concrete (either in longitudinal
(assuming each to be homogeneous within itself), find an or in transverse mode): I is a characteristic linear quantity
overall modulus, Eo,, for the concrete body at a given loading (equal to either mean aggregate diameter [if ca> fc] or mean
rate as follows: inter-aggregate clear spacing within the concrete [if a < aj);
E, = (1 ~aI
-ac)Em +(a/ctc) E, , ifat (17) PO isan overall density of concrete that can be obtained by an
Eo,, E=,,
(-c/)E+cE, if <cic (17) interpolation function similar to Eq. (17). Eq. (19) was derived
Eo,1 = Ea, if a >a% using the analogy with an SDOF system and the principles of
where, Em and Ea are the elastic moduli for cement matrix and elastodynamic wave propagation in an elastic solid.
aggregates, respectively. The rate of loading, ca, in this case,
is considered to be the rate of applied stress. This algorithm The performance of the present model in comparison to other
requires the determination of a critical loading rate, ac similar analytical and experimental results is illustrated in Figure 8.
to that defined for a true 2-DOF system. The mass ratio, rM as The solid bold line was obtained for a concrete body under
introduced for the 2-DOF system, is replaced by the ratio of pure uniaxial tension.
mass densities of cement matrix and aggregates (denoted by rQ)
and the stiffness ratio, rK in 2-DOF system, is replaced by the
ratio of moduli of cement matrix and aggregates (denoted by
180](https://image.slidesharecdn.com/a276170-221126090128-e06297b7/85/a276170-pdf-189-320.jpg)

![DYNAMIC COMPRESSIVE BEHAVIOUR OF CONCRETE AT STRAIN RATES UP TO 103
JS - COMPARISON OF PHYSICAL EXPERIMENTS
WITH HYDROCODE SIMULATIONS.
A D Pullen1
, A J Sheridan2
, J B Newman 1
1 Department of Civil Engineering, Imperial College, London, SW/ 2BU, UK.
2 Defence Research Agency, Farnborough, Hants, GU14 6TD, UK.
comprise of a specimen of the material and the
ABSTRACT apparatus used to load it. Such systems exhibit
their own peculiar characteristics which may
Experiments designed to determine dynamic material significantly influence the measured results.
properties often indicate modification of those Systems which perform predictably at low strain
properties when compared with material properties rates may have dynamic characteristics which must
determined statically. The hydrocode assisted be accounted for before the true dynamic
analysis of a split-Hopkinson bar experiment is properties of the material can be determined.
described, the aim of which was to determine how Some of the investigations reviewed by Bischoff
much of the apparent enhancement of the material (eg., [2]) have involved attempts to calculate and
strength often observed in such experiments is remove system effects from results.
generated by inertial effects within the apparatus 2 5
and the specimen. It was concluded that inertial Figure 1. Reported increase in
effects within the specimen significantly modify compressive strength ol concretc
the stress state and hence the results of such at high strain rates ,-,- 30
physical experiments. (after Uischofl 1908 111)
1 INTRODUCTION IS,
The use of analysis techniques which involve
computational simulations of the real world is now "
widespread across many disciplines. Hydrocodes or - ,
dynamic finite-element programs used by scientists
and engineers to analyse the behaviour of s wtab I
structures subjected to dynamic loads are just one .0.--.---. o,
example of this. A realistic hydrocode simulation -1
-, - 6-4
- 3-2 -, 0 1 2
,
requires that the engineering properties of the This paper describes the hydrocode assisted
materials from which the structure is built are analysis of a split-Hopkinson bar (SIIB)
accurately represented. These properties must be experiment. The aim was to determine how much of
applicable at the appropriate strain rates for the the apparent enhancement of the material strength
real event. There is evidence that the often observed in such experiments is in fact
engineering properties of many materials undjr generated by inertial effects within the system,
dynamic loads (at strain rates greater than 10-3) that is, the apparatus and the specimen.
differ from those which are measured under static
lcads (at strain rates of less than 10-). For 2 DESCRIPTION OF PHYSICAL EXPERIMENTS
example, a concrete specimen loaded at a strain
rate in the region of 102 may support twice the 2.1 76.2mm diameter split Hopkinson bar
load than when loaded at a strain rate of 10- 5
. A series of experiments have been carried out
Consequently, there is a need to quantify these using a 76.2mm diameter split Hopkinson bar sited
differences in order to improve the accuracy of at DRA Farnborough (Figure 2). Each experiment
hydrocode simulations. involved the detonation of a PE4 explosive charge
using an L2A1 detonator. The charge was generally
Bischoff [1] reviewed earlier experimental a disc 70mn in diameter and 5mm thick with a mass
investigations into the properties of concrete of approximately 30g. This geometry was defined
loaded at strain rates from 10-8 to 102. He found by the internal profile of a cylindrical perspex
a wide variation in the reported incriase in block which held the charge in contact with a
concrete strength at strain rates from 10- to 102 steel anvil 76.2mm in diameter and l5nm long,
(Figure 1) and suggested that much of this itself in contact with the end of the incident
variation may be due to differences between the bar. A concrete specimen, 75.2nin in diameter and
testing techniques employed, typically 20 to 25mm thick was placed between the
incident and transmitter bars (each l8Onin long).
A typical experimental system designed to measure The transmitter bar butted against a 25nmn thick
the engineering properties of concrete will stopper plate attached to the support "spine" of
182](https://image.slidesharecdn.com/a276170-221126090128-e06297b7/85/a276170-pdf-191-320.jpg)
![F'igure 2. DRA 76.2mm Split Hopkinson Bar
Linear bearings Stopper plate
Incident bar TransaiLter bar Moneninin l .pps
Support spine for burs
Charge/detonator Specimen Strain gauge
the apparatus. Cylindrical plates were placed in lateral stress and strain curves can be evaluated
contact with the other side of this plate, to act for conditions of approximately uniaxial strain
as momentum traps. An acoustic coupling gel was ([3] and [4]).
used on the steel/concrete and anvil/incident-bar
interfaces. This also reduces friction at these 2.3 Age of concrete at testing
interfaces. A single 6nmn long electrical Although the primary static testing took place at
resistance strain gauge was placed on each of the 42 days, the timing of dynamic testing was
incident and transmitter bars, at mid-length and controlled by the date of implementation of the
aligned axially. SHB apparatus and the availability of range time.
Consequently, the age of the concrete specimens
The fourth trial after comnisioning the apparatus used in T4 and T5 was 100 days and 148 (lays
(T4) was the first to successfully produce a full respectively. The concrete properties iayhave
set of high-quality data suitable for comparison changed significantly in this period, thus
with hydrocode predictions. The 21.5nm thick complicating the analysis which follows. Further
concrete specimen was cut from a 76.2nin diameter experiments are planned in which specimen age will
by 150nim long cast cylinder produced from the same be 42 days for all test techniques.
batch as similar specimens tested statically. The
fifth trial (T5) also used this concrete. 3 HYDROCODE SIMULATIONS OF THE SHB EXPERIMENW
2.2 Static testing of the concrete material T4 has been simulated using the hydrocodes DYIIA2D
The concrete from which the SHB specimens were and AUTODYN2D. The compressive material data used
made (designated DRA92-3-5) was one of many was generated from the GREAC cell tests carried
concretes tested statically as part of the out on the same concrete mix as described in
production of a large database of triaxial section 2.2. A pressure/compaction relationship
concrete, rock and soil properties. DRA92-3-5 was and yield stress/pressure relationship were
made with a crushed limestone coarse aggregate of extracted from the GREAC cell data and used as
nominal size Onun, this aggregate composing 58%m of input data to the following hydrocode material
the concrete by weight. The free water/cement models.
ratio (by weight) was 0.50. For each concrete in (a) "Soil and crushable foam" (material 5) -
the database, three 101.6mm cubes were crushed, DYNA2D/3D and NIKE2D/3D [5]
one at 28 days and two at 42 days. Also at 42 (b) "Porous" Equation of State and "Mlohr-
days, a single 76.2mm diameter by I5Omnm long Coulomb" strength models - AUTODYN2D/30 [6]
specimen was tested in indirect tension (the
split-cylinder or Brazilian test) and two 76.2nun The pressure-volume relationship used is shown in
diameter by 148nmm long specimens were tested in a Figure 3. Both models used a 5-point linear-
"Gauged REActive Confinement" (GREAC) cell. The piecewise (Spt L-P) relationship for the
GREAC cell consists of a gauged cylindrical uncompacted material which is easily fitted to the
(steel) jacket around an axially loaded specimen. GREAC cell data. For unloading and reloadinig
Using this apparatus, a complete set of axial and partially compacted material, a constant bulk
183](https://image.slidesharecdn.com/a276170-221126090128-e06297b7/85/a276170-pdf-192-320.jpg)

![Figure 5. 76.2=m SIM] trials compared with hydrocode s~inulaUons
Incident pulse
160 170 180 190 200 210 220 230 240 250 260
to
10rime (micro-seconds)
o
~-100
_5600 N
Figure 6. 76.2=m StIM trials comipared with hydi-ocode simulations
Transmitter bar stresses
40 -Time (micro-seconds)
20 T5
-20
-40 D
-80
1-100A'DOV
.~-120
S -140 TD V
-100
Figure 7. 76.2mm StIM trials compared with hydrocode siumulations
Reflected stresses in incident bar
T4
S 450-
400
350 -- A
-
~ 300
250 - -- DO
200.....D
150V
too DY
-0 r- DYS I
- -100 Time (micro-seconds)
500 520 540 580 500 600 620 6410
185](https://image.slidesharecdn.com/a276170-221126090128-e06297b7/85/a276170-pdf-194-320.jpg)

![5 CONCLUSIONS The material models used in this study are not
particularly complex and do not allow for the
The hydrocode analyses described above, yield stress increasing to a higher ultimate
particularly A and 00, used realistic static stress with volume dilation during the failure
compressive triaxial properties for the concrete process, as has been observed in static triaxial
material and had no rate dependent components. testing of concrete [8]. More ccmplex material
Nevertheless, an increase in the axial load models could be used in the hydrocode simulations
supported by the specimen was noted. It can be provided that suitable static data can be
concluded that at least some of the ability of measured, for example, material type 16 in DYNA2D
such a specimen to support a higher axial load [5].
than its statically-loaded uniaxial-stress
counterpart can be explained by the presence of a 7 ACKNOWLEDGEMENTS
compressive triaxial stress state within the
specimen, caused by the radial inertia of the This research was funded by the Procurement
specimen Itself. This is often refered to as Executive of the Ministry of Defence and forms
lateral inertial confinement [1]. It has been part of the programme of the Defence Research
concluded by other workers [1,7] that significant Agency to investigate the response of concrete
lateral inertial confinement occurred only after structures to conventional weapons effects.
the peak stress had passed through the specimen British Crown Copyright 1993 /DRA
because lateral deformation increased rapidly at br ish Cro h
Copyrigh 19 the
that time (at strdiii rates up to 100, an order of Published with the permission of the
magnitude less than those considered in this Controller of Her Britannic Stationary
study). Analysis DO indicates that (at strain 8 REFERENCES Office
rates of the order of 1000) lateral inertial
confinement increases immediately with increasing [1] Bischoff, P. H., "Compressive response of
axial stress, though more rapidly once the yield concrete to hard impact", PhD Thesis,
envelope is achieved. Moreover, the peak lateral University of London Imperial College of
confinement coincides with the peak axial stress. Science, Technology and Medicine), 1988.
At least at the strain rates considered here, the [2] Hughes, B. P., and Watson, A. J.,
effect of lateral inertial confinement "Compressive strength and ultimate strain of
significantly modifies the otherwise uniaxial concrete under impact loading", Magazine of
stress state throughout the period of interest. Concrete Research, Vol. 30, No. 105,
December 1978, ppleg-Igg.
Unfortunately it is not possible to determine how [3] Sheridan, A. J., "Response of concrete to
much of the observed increase in specimen strength high explosive detonation", PhD Thesis,
in this study was due to lateral inertial University of London (Imperial College of
confinement and how much was a true increase in Science, Technology and Medicine), 1990.
material strength dependent on strain rate, [4] Sheridan A. J., Pullen, A. D., Perry, S. H.,
because of differences in the ages of the "Material Modelling for Hydrocode Analysis
dynamically and statically loaded specimens. of Concrete Response to Explosive Loading",
However, the work described here demonstrates that 5th Internationales Symposium Interaktion
care must be taken when determining rate-dependent Konventioneller Munition mit Schutzbauten,
effects on material properties if the dynamically Mannheim, 22-26 April, 1991, pp3Ol-308.
generated triaxial stress state within the [5] Whirley, R. G., Engelmann, B. E., and
specimen is not fully accounted for. Hallquist, J. 0., "DYNA2D - A nonlinear
explicit two-dimensional finite element code
6 FURTHER WORK for solid mechanics - user manual", Lawrence
Livermore National Laboratory, UCRL-MA-
For the analysis described in this paper, 110630 April 1992.
hydrocode simulations were carried out using [6] Century Dynamics Inc., "AUTODYN Users Manual
concrete material properties measured under Supplement version 2.2", 1989.
conditions of approximately uniaxial strain. [7] Malvern, L. E., Tang, T., Jenkins, D. A.,
Although the SHB specimen is initially loaded and Ross, C. A., "Dynamic compressive
under these conditions, it subsequently tends testing of concrete", Proceedings of the
toward uniaxial stress as it deforms and unloads Second Symposium on the Interaction of Non-
radially. This can be prevented by confining the Nuclear Munitions with Structures, Panama
circumference of the specimen using a cylindrical City Beach, Florida, April 1985, pp. 194-
steel jacket similar to the GREAC cell. 199.
Measurement of the circumferential strain on the [8] Kinsohita, M., "Constitutive relations of
outside of this jacket facilitates determination concrete under passive confinement and their
of the lateral stress and strain in the specimen. use in structural analysis", PhD Thesis,
AUTODYN2D and DYNA2D simulations of this proposed University of London (Imperial College of
GREAC cell/split Hopkinson bar combination Science, Technology and Medicine), 1992.
indicate that a reasonably consistent state of
stress exists throughout such a confined specimen.
A prototype trial has been carried out and is
being analysed.
187](https://image.slidesharecdn.com/a276170-221126090128-e06297b7/85/a276170-pdf-196-320.jpg)

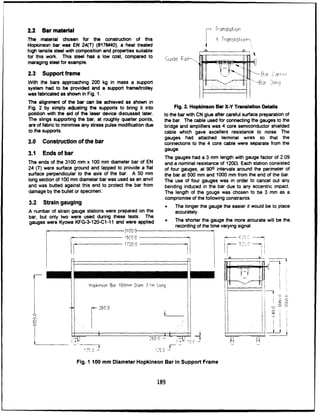


![FRACTURE ENERGY OF CONCRETE UNDER DYNAMIC TENSILE LOADING
J. Weerheijm"), J.C.A.M. van Doormaal*) and L.J. Sluys**)
")TNO Prins Maurits Laboratory, P.O.Box 45, 2280 AA Rijswijk, The Netherlands
"') Delft University of Technology, Department of Civil Engineering.
P.O.Box 5048, 2600 GA Delft, The Netherlands
ABSTRACT integrating the load-deformation-curve, is proportional to the
In an experimental programme, impact tensile tests were increase instrength. This can be described by:
performed on notched and unnotched cylindrical specimens in a _ G
Split Hopkinson Bar apparatus to determine the dynamic Gfracfdyn st frac~sg (I)
fracture energy of concrete. The results have been compared to
static deformation controlled tensile tests. Distinction must be
made between material and structural response in order to obtain Geom2 ts
a correct material model. The combination of experiment and
numerical calculations offers the possibility to analyse these (7
contributions. It has been observed that the fracture energy just
slightly increases with the loading rate. -,4
INTRODUCTION 0 i I/S
For the design of concrete structures, which must resist
explosive and impact loadings, knowledge of the dynamic 2s 1-6/s
material behaviour is essential. Advanced computer codes offer
the possibility to calculate the distribution of the load in complex
loading situations. A necessary condition to obtain reliable
results, is the implementation of a corect material model. 0
In this study, we focus on the dynamic deformation capacity 0 0.05 0.10 0.5s 0.20
and fracture energy. From many studies in preceding years ([I], 6 mml
[2], [31, [4]) it is well known that a higher loading rate results
in a higher uniaxial strength, but the influence of the loading
rate on the deformation capacity is more debatable. There is still Figure 1 Rate effect on load-deformation curve for tension (6].
little knowledge of the dynamic deformation capacity and
fracture energy. If this relation (1)is true, it implies that the rate dependence on
Uniaxial impact tensile tests have been performed by T L the tensile strength in the pre-peak deformation process, where
and DUT in a Split Hopkinson Bar apparatus on notched micro-cracking occurs, can be extended to the macro-cracking
cylindrical specimens in order to determine the influence of the mroc king occurs, anibe
exteed the
macrackin
process. But the question arises whether the increase in
loading rate on the fracture energy. In former experiments [5] absorbed energy during the post-peak deformation is not just
this testing technique in combination with numerical simulation caused by structural instead of material response. The fracture
appeared to offer good possibilities for the determination of zone for instance is not fixed and multiple cracking occurs. The
correct material models. larger number of (micro) fracture planes increases the total
The results of these tests concerning the deformation capacity fracture energy. But this does not mean that the fracture energy
will be discussed here. They will be compared with static per fracture plane changes. Inertia effects can also influence the
experiments and a numerical simulation. The influences of the behaviour. hese aspects were not considered in the past.
loading rate, geometrical aspects and inertia on the fracture
energy will be of primary interest. The possibility that deformation data could be influenced by
DEFORMATION UNDER DYNAMIC LOADING these aspects of structural response was realised by the authors
[5]. Therefore, we tested notched specimens in a Split
The general opinion ([6] and [7]) is that the deformation Hopkinson Bar apparatus. Because of the notch, fracture was
capacity increases with the loading rate, in the same fashion as limited to a single zone.
the strength is sensitive to the loading rate. Figure 1,determined As a result of these tests, after taking the influence of the
by Kbrmeling [6] from impact tests with a Split Hopkinson Bar notches into account, a tendency was found that concrete had a
apparatus, illustrates this sensitivity for concrete under dynamic more brittle behaviour under a higher loading rate. The total
tensile loading. This figure shows that the strength increases, deformation decreased with an increasing loading rate and the
but that the maximum deformation is not affected by the strain fracture energy remained approximately the same. Furthermore,
energy that can be absorbed and which can be found by it was shown by numerical simulation that these data still
overestimated the real fracture energy because of inertia effects.
200](https://image.slidesharecdn.com/a276170-221126090128-e06297b7/85/a276170-pdf-209-320.jpg)
![EXPERIMENTS depicted in Figures 2 and 3. These load-deformation-curves
give information about the deformation and fracture energy of
The conclusion of a more brittle behaviour under higher loading the specimens. These data are given in Table 1.
rates by Weerheijm [51 was based on a small set of experiments
and the test conditions were not optimal. The experiments were Table I Strength, deformation and fracture energy
carried out within the scope of a biaxial study, in which the
primary interest was neither the deformation capacity nor the DO D2 D4 S2 S4
fracture energy under uniaxial load conditions. For the biaxial
study it was necessary to use a prismatic geometry, which is not
the best choice for uniaxial tests. Furthermore, the comparison dpldt [GPa/sj 24.0 22.8 19.7 0.03 0.03
with static behaviour was done on the basis of experimental data ft IMPa] 5.1 4.6 3.9 2.5 2.4
available in literature and not on the basis of static experiments dflop [l.ml - 6.0 9.5 4.5 7.7
on the same specimens. dflot [1unj 270 153 135 >200" >200"
For these reasons, it was decided to perform additional tests J,top [N/f]i - 22 25 9.8 16.1
with improved conditions to verify the test method and the con- jftot [N/n] 270 163" 170*" 108" 114"
clusion of the previous experiments with regard to the influence
of the loading rate on the deformation capacity and fracture Tests were stopped at 200 pin
energy. Determined at a deformation of 153 jLm
In the Split Hopkinson Bar apparatus impact tensile tests with a Deteinined at a deformation of 135 pim
loading rate of approximately 20 GPa/s were performed on
cylindrical notched specimens with a diameter of 74 mm and a Some observations can be made from the load-deformation-
height of 100 mm. The notches were 2 or 4 mm deep, which curves and from the deformation data.
corresponds with a reduction in cross-section of 10% or 20%. The expectation that the strength increases with the loading rate
These test series will further be indicated as D2 and D4 (D has been confirmed. The specimen strength in the dynamic tests
stands for dynamic and the number for the depth of the notch). was higher than in the static tests. This increase can be
Unnotched specimens (indicated as DO) were also tested. attributed to the changing geometry of the fracture plane and
Static, deformation controlled tests with a loading rate of inertia effects on crack propagation (see model as described by
approximately 0.03 GPa/s were performed on the same notched the author [5]).
cylindrical specimens at the DUT (indicated as S2 and S4, The difference in strength between the DO, D2 and D4
where the S stands for static). specimens shows that another phenomenon also influenced the
strength of the specimen. This phenomenon must be coherent to
From the measurements the load-deformation curves of the total the application of notches since that is the only difference
specimen and of the fracture zone could be derived. They are between the specimens. The most probable explanation is the
92513-2
DD2 S2
0.
2
2
L 0 -i
0.00 0.05 0.10 (mm) 0.15 0.00 0.05 0.10 0.15 0.20
0 03
~~(mm)(rm
i f I I I I I I I I I I
D4 3S
CL C
2 32
22
1
1
0.00 0.05 0.10 0.00 0.05 0.10 0.15 0.20
(MM) (MM)
Figure 2 Average load-deformation-curves of the fracture zones,
201](https://image.slidesharecdn.com/a276170-221126090128-e06297b7/85/a276170-pdf-210-320.jpg)
![gasl" of stress before maximum stress (see also (51), thanks to which
i f 7 I I I failure is delayed. Another reason why the resistance did not
-5 - DOimmediately drop is rotation. While the strength is reached on
"L/0 one side of the specimen, the other side has still some reserve.
4 -Rotation occurs because of the heterogeneity of concrete.
3 -Comparison of the dynamic deformation data of unnotched
specimens with those of notched specimens shows clearly the
2 effect of the size of the fracture zone. In the unnotched
specimen the location of the fracture zone was not fixed, which
1 caused multiple cracking, a larger deformation and a higher
fracture energy. This effect can also be observed from the form
0 * of the load-deformation-curve for the DO-series. The ascending
0.00 0.05 0.10 0.15 branch of the curve showed a considerable pre-peak
(m11) deformation. Since this non-linear response cannot be caused
by notch-sensitivity as for the D2 and D4-series, it must be
attributed to the larger fracture zone, where multiple micro-
- cracking occurs. The descending branch showed a similar
D2 feature. After an initially steep drop the descending branch
4"-4becomes moderate sooner.
3 DThe dynamic fracture energy, found in the DO, D2 and D4 test
series is larger than the fracture energy in the static experiments
S2 and S4. This result is in contradiction with the results of the
2- former experiments [5], in which it was seen that the dynamic
fracture energy was approximately the same as static and
1 showed the tendency to decrease with an increasing loading
rate.
0 1 This contradiction can be explained by the difference in
0.00 0.05 0.10 0.15 geometry of the specimens in both experimental programmes.
(mM) In the former programme the specimens were prismatic (50 mm
wide, 80 mm deep and 100 mm high). The cross-section was
reduced by applying notches at two opposite sides. So, the
cross-section was reduced in just one direction. Due to
04 heterogeneity concrete behaves asymmetrically. This means that
in one direction failure starts earlier than in the other direction.
C" In the prism probably the weakest direction was reduced,
3 -resulting in a mor brittle behaviour.
The asymmetrical behaviour of concrete is shown in Figure 4,
which gives the load-deformation-curves, derived from
measurements at different sides of the specimen. It is obvious
S.from the differences in mainly the descending branches that the
average of the left and right curves differs from the average of
0 - the front and rear curve which also results in different fracture
0.00 0.05 0.10 energies. And it is likely that again another result would be
(mm) found if measurements were performed at two other opposite
sides of the concrete specimen.
92513-4
Figure 3 Average load-deformation-curves of the whole
specimen. 4
S• front
sensitivity for stress concentrations, which occur due to the 23 ....... left
applied notches. This sensitivity is more pronounced for high . rear
loading rates, when time available for redistribution is limited. right
2
In the dynamic tests the pre-peak deformation is larger than in ,. .
the static tests. From comparison of the deformation-load- 1 , -
curves it emerges that for the dynamic curves the ascending. ,. -
branches become nonlinear sooner. In the D2-series the - -,_
nonlinearity startsatapproximately60%ofthemaximum stress 0 , i
, , I i i
and in the D4-series the nonlinearity starts at approximately 0.00 0.05 0.10 0.15 0.20
30%. In the static tests nonlinearity starts at approximately 80% (ram)
of maximum stress for the S4-series and at approximately 90% Figure 4 Load-deformation curve at different sides of the
for the S2-series. Because of stress concentrations at the notch Figure formtio curveas
the strength is reached locally and the specimen becomes specimen for the D4-series.
nonlinear. Micro-cracking increases and enables redistribution
202](https://image.slidesharecdn.com/a276170-221126090128-e06297b7/85/a276170-pdf-211-320.jpg)
![Next, it will be shown with use of numerical results that inertia followed a dual approach, namely, that for the tensile strength
influences the energy data. These inertia effects are another we included the dynamic effect and for the fracture energy we
reason why the fracture energy found from the current tests is did not.
higher. The higher loading rate increases the influence of The increase of the tensile strength under dynamic loading
inertia, conditions is measured in this programme and is commonly
accepted (e.g. [41). The measured value, f, = 4.0 MPa. in the
The fracture energy in the dynamic experiments is not as large D4-series is influenced by geometrical effects and is not a
as predicted by equation (1). This equation overestiniates the material parameter. It turned out that the value we had to put in
dynamic fracture energy as is shown by the difference in the the smeared crack model should be taken larger, namely
predicted and the measured dynamic fracture energy and by fct = 5.2 MPa, to compute the same tensile strength as it has
Figure 5. been measured in the test. Compare this value with the strength
Based on equation (1)a fracture energy of respectively 220 N/m found in the DO-series.
and 233 N/m for the 2 and 4 mm test series is predicted, which
is more than found in the dynamic test series D2 and D4. One of the objectives of this study is to investigate the influence
92513-s of the strain rate on the fracture energy. The fracture energy of
the specimen is influenced by three effects, namely (i) the
geometry of the specimen, (ii) the inertia of the specimen and
2c(iii) a possible increase of the material parameter due to rate-
. 2 • static effects. The first two effects have been covered by the
.......... dynamic adjusted numerical simulation. By taking the static value for the fracture
energy G" = 125 N/in the third effect has been analysed.
Next to the tensile strength and the fracture energy two
parameters determine the smeared crack model, namely the
shape of the strain-softening curve and the crack band width h.
...
...
. . . ..................
0.00 0.05 0.10 0.15
(MM)
Figure 5 Comparison of the static load-deformation curve
with the dynamic curve which has been divided by
fd/fst for the D2-series.
In Figure 5 the static and dynamic load-deformation-curves for
the 2 mm test series are compared. For that purpose, the
dynamic curve is divided by fdlfst. The figure shows that the
form of the moderate part of the descending tail is not the same
in both curves. It is due to this part of the curve that the fracture
energy is overestimated by equation (1). The ascending branch
and the steep drop is the same for both curves except for the top
of the curves because of the greater notch sensitivity in the
dynamic experiments.
NUMERICAL SIMULATION
The response measured in the experiments is influenced by
structural effects as the geometry, the inertia of the specimen
and the stiffness of the experimental set-up. For this reason the
material parameters which determine the post-peak response can
not be derived directly from the test. A combination with a
numerical analysis can overcome this problem. Figure 6 Crack patterns and displacements.
The specimen with a 4 mm notch was modelled with eight-
noded axi-symmetric elements, using a nine-point Gaussian The power-law function of Moelands [101 has been taken to
integration scheme. By making use of the axial-symmetry of the describe the nonlinear post-peak behaviour. The crack band
specimen it suffices to analyse a plane section of the specimen width h is a parameter which controls the mesh sensitivity of the
along its axis of symmetry. The finite element modelling of the solution. A finite element representation of strain-softening
experimental set-up was done similarly to a previous study on materials results in a severe mesh dependence, because the
prismatic specimens (see [8]). The elastic material properties crack will always propagate along one row of integration points
have been taken as: Young's modulus Ec = 40 GPa, Poisson's [8]. But by introducing a parameter which is dependent on the
ratio vc = 0.2 and mass density Pc = 2325 kg/in3 for the [].Btyinrdcgaprmerwhhiseedntoth
conreteoandE 68 a
= 0.2 and
massdensity p a
= 240 kg/ 3
for
t size of the zone belonging to that row of integration points, the
concrete and Ea = 68 GPa, va = 0.2 and pa = 2400 kg/m3 for result can be kept objective with respect to the finite element
the aluminium. size.
A smeared crack model (91 was used to model fracture in the The results have been plotted in Figures 6 and 7.Cracks start to
notched zone. For the inelastic material parameter set we propagate in one row of elements from the notch to the centre of
203](https://image.slidesharecdn.com/a276170-221126090128-e06297b7/85/a276170-pdf-212-320.jpg)
![the specimen. In Figure 6 the crack pattern and the total CONCLUSIONS
displacements show the development of the crack plane. When
the crack reaches the axis of symmetry the deformation pattern As a result of the research programme the following
changes into a symmetric failure mode. In Figure 7 the stress- conclusions can be drawn:
deformation curve has been plotted, where a represents the - Deformation data in dynamic experiments are influenced
vertical stress at the top of the specimen and 5 the deformation by structural response. This has been demonstrated by the
at the notch. difference (40-50%) in total deformation and fracture
energy between unnotched and notched specimens
5
a [MPa] - The observed dynamic fracture energy of a specimen is
5.0 larger than the material fracture energy because of inertia
effects. These effects are responsible for the observed and
calculated long tailed load-deformation curves.
4.0 - The fracture energy slightly increases with the loading
.- rate.
- In order to obtain the best results currently possible, it is
3.0 recommended to apply the static fracture energy in
dynamic calculations.
2.0
full crack REFERENCES
1.0- [1] Reinhardt H.W., Concrete under impact loading. Tensile
strength and bond, Heron, Vol. 27, No. 3, 1982
0.0- [21 Suaris W. and Shah S.P. Constitutive model for dynamic
loading of concrete. Fracture Mechanics of Concrete, ed. F.H.
0 0.05 0.10 0.15 Witteman, Elsevier Science Publisher B.V., Amsterdam, 1983
& [mmI [31 Jensen J.J., Ductility of high strength concrete under
special loading conditions, SINTEF Report, No STF65
Figure 7 Calculated stress-deformation curve in fracture zone. A9101 1, Norway, December 1990
[41 Zielinski A.J., Fracture of concrete and mortar under
Two main conclusions can be drawn from the calculations. uniaxial impact tensile loading, Dissertation, Delft University of
First, the inertia of the specimen contributes to the increase of Technology, Delft, 1982
G in comparison to the static case. This phenomenon is
obvious from Figure 7 in which it is observed that at a certain [5] Weerheijm J., Concrete under impact tensile loading and
stage a full crack situation occurs, without the ability to transmit lateral compression, Dissertation, Delft University of
a force. Despite of the full crack the stress contribution to inertia Technology, Delft, 1992
effects is still present.
Secondly, comparison of the calculated load-deformation curve [61 Kdrmeling H.A. and Reinhardt H.W., "Strain rate effects
and the measured curve shows that the long tails, in which on steel fibre concrete in uniaxial tension", Int. Journal of
inertia dominates the transmitted force, almost coincide. The Cement Composites and Lightweight Concrete, Vol. 9, No. 4,
main difference occur just beyond the peak. The applied pp. 197-204, 1987
softening model and the static Gf(125 N/m) results in a
calculated curve just below the measured load-deformation [7] Oh B.H., Fracture behavior of concrete under high rates
curve. Because geometry and inertia effects have been taken of loading, Int. J. Eng. Fract. Mech., Vol. 35, No. 1/2/3,
into account, the difference is caused by a small increase of Gf 1990, pp 327-332
due to the rate-dependent material response. [8] Sluys L.J., Wave propagation, localisation and dispersion
in softening solids, Dissertation, Delft University of
So far, only the first numerical simulations of the experiments Technology, Delft, 1992
have been carried out. A complete numerical study will be
carried out including a variation of loading rate and geometry [9] Borst R. de and NAUTA P., Non-orthogonal cracks in a
(notch-depth) to quantify the different contributions (geometry, smeared finite element model, Eng. Comp.,.B 2(1), pp. 35-46,
inertia, material) to the fracture energy. By following the 1985
experimental-numerical approach for a variety of problems a
proper material model should be derivable. [10] Reinhardt H.W., Cornelissen H.A.W. and Hordijk D.A.,
Tensile tests and failure analysis of concrete, J. Struct. Engrg.
At this stage, it is still recommended to apply the static fracture ASCE, 112(11), pp. 2462-2477, 1986
energy value and the power-law function of Moelands [10] to
present the softening branch for dynamic response calculations.
204](https://image.slidesharecdn.com/a276170-221126090128-e06297b7/85/a276170-pdf-213-320.jpg)
![A NumericalSimulation ofStress Wave Propagationin Concrete
andits Effect on SpallandBreachin Scaled Tests
Charles J. Oswald
Kirk A.Marchand
Ben H. Thacker
Southwest Research Institute
6220 Culebra Road
San Antonio, TX 78228-0510
Abstract time scale with the scale factor, and all material propernies, such as
strength, stiffness (modulus), and density are scale independent. All
Numerical simulation is used to analyze the stress wave dimensionless parameters are also scale independent (the same in
induced in small scale and prototype reinforced concrete slabs by both the prototype and scale model). Provided that replica scale
high pressure airblast loading from close-in detonations. The stress modelling laws are correctly applied, the damage mode and relative
wave is ofinterest because localized concrete damage such as spall amount of damage should be scale independent.
and breach, which is caused by the wave, does not scale in replica
scaled tests. In this paper, through thickness stress histories A potential problem with the application ofreplica scaling
calculated with the PRONTO2D code are shown to compare tocases with dynamic loading is that the strain rate, which canaffect
reasonably well with experimental results. It is also proposed that material parameters such as strength and stiffness, is not identical
the use of reduced concrete strength in small scale models can be in the prototype and scale model. In almost all previous scale tests
an effective way to produce subscale localized damage similar to on reinforced concrete structures the effect ofload or straining rate
that in the prototype. on material strength, stiffness or ductility has been ignored. This
assumption is not a bad one in cases of blast and impact provided
the primary response mode of concern is flexural motion where
strain rates are below 0.1 sec-'. In these cases scale model tests
Introduction involving blast loading of structures have typically yielded results
which compare well against those obtained from full scale
Reinforced concrete structures have been used for decades experiments.[1][21[31
as protective structures for use in warfare, in hazardous material
processing and storage applications, and as robust structures However, in a number of recent cases where scale
designed for secure storage of sensitive or valuable material. To modelling has been used to investigate spall, breach, and concrete
more effectively design concrete structures for these applications it wall breakup under severe close-in loading, good correlation with
is important to gain a better understanding of concrete spall (rear full-scale results has not been observed. This isdue in large pan to
face impact induced tensile failure) and localized breach or shear the fact that strain rate has asignificant effecton material properties
failure. These types ofresponse can control the design in cases such in this response realm. The principal set of data that will be used
as near miss bomb explosions in air or soil, storage facilities throughouttheremainderof this paper to consider the effectof strain
subjected to the accidental detonation of high densities of stacked rate on concrete strength is shown in Figure 1. This data was
munitions or explosives, or secure storage facilities attacked with generated through the use of the Split Hopkinson Pressure Bar
terrorist tools or explosives. (SHPB).[4] Concrete tensile strength is of primary interest here
because most spall and breach damage is caused by tensile stresses
In order to establish this understanding, a combined induced by close-in explosions which overcome the relatively low
theoretical and experimental approach is necessary. Typically, tensile strength of concrete.
experimental testing of structural response to blast loading relies
heavily on the use of small scale testing. However, as the body of WH
EN....-
this paper discusses, significant problems have been encountered - :::.:... 1
in applying this approach because localized spall and breach EW.........
SCURtlENlT
W[ýF.ACH!• O- -
observed in scaled testsdoes not compare well with that infull-scale .'sp,, ....
W- Uyl
.
tests. This paper describes acomputational simulation ofthe stress 'D ....
T .....
wave induced in concrete by close-in explosions and applies the .C,•,,ss, 2: 0,:. ý,1CN- IN ... ....---
computationalapproach to the problem ofscaled testing oflocalized CI t" I' n...... q I"
concrete response.3" IA'
Use ofScale Modelling to Investigate Concrete Spall and Breach i
In this section, scale modelling is briefly discussed since
aprimary goal ofthispaper is to apply the computational approach
which is presented to available scaled data of localized concrete , I
response. Principally, replica, or geometric scaling has been used . .
for blast and impact loaded structures since this approach is more
straightforward than other types of scaling and a number of Figure 1. Tensile and Compressive Strength Ratios of
complexities, such as large plastic responses and dramatic failures, Concrete versus Log,. of strain rate (from Reference 4)
often occur. Replica scaling laws require that all dimensions and
205](https://image.slidesharecdn.com/a276170-221126090128-e06297b7/85/a276170-pdf-214-320.jpg)
![Data'fromRe-ent Scaled TestsInvestigating Concrete Spailand propagates through the thickness ofa twelve inch concrete slab At
wallp time 1,the wave is shown prior to reflection off the back face of the
slab. The wave shape issimilar to that ofthe applied pressure history
An example of replica scaled tests where the observed except that an elastic precursor, which has a stress slightly greater
localized damage did not follow replica scaling laws is shown in than the assumed unconfined concrete yield stress, travels ahead of
Table 1. This data is from a large test series performed recently by the rest of the wave, where much higher stresses exist. The peak
SwRI for the Department of Energy (DOE) which studied the pressure and impulse in the high stress "plastic" region ofthe wave
breakup ofreinforced concrete and masonry structures subjected to attenuate as the wave propagates so that in a very duck slab the
close-in explosive loading.[51 Replica scaling laws were used to wave shape becomes nearly square with a peak stress near the
construct the scaled walls in the test series and Hopkinson-Cranz unconfined yield stress. The concrete is assumed to be an elastic,
scaling (which is based in replica scaling) was used to apply the perfectly-plastic material where only the deviatonc stresses cause
scaled blast loads. The reinforcing steel size and placement and yielding. The equation for the von-Mises stress (a.), which is used
concrete aggregate size were scaled except as noted in the table and in the computational approach to define the yield condition, is shown
material sengths,and therefore stiffnesses, were scale independent below in terms of the three principal stress differences.
within practical limits, except for Test 3.1. In this test the scale
model strength was intentionally reduced inorder to cause damage
more similar to that measured in the protoype. o= [(o, -flo+ (0 - 03)"+ (!-3
The test results in Table I clearly show that more severe
modes of damage occurred in the larger scale tests in each pair of
scaled tests. The debris velocities also were not scale independent
as replica scaling predicts. Other wall breakup parameters, such as
total number ofdebris andaverage debris weight, also didnot follow
replica scaling laws. If the response of the prototype had been
predicted solely by "scaling up" the response measured in the scale
model using replica scaling laws, it would be significantly '2
underprecicted. 2-
In addition to the test series summarized above, other
researchers have also noted that local damage to concrete from
close-inexplosive loading in small scale studies is significantly less Time
than that in the prototype.[6][71 Itis emphasized here that this trend Cop;...eo (ý
IZm
is observed within the limited loading realm of close-in airblast Te.si.. (T)
loading of concrete and masonry walls.
Stress Wave Propagation in Concrete (C)
Ted r _ - -- - - -
Most of the damage to the concrete walls in Table 1 was I V Tme 2
caused by the stress wave that propagated through the thickness of
the wall near the explosive, reflected off the unloaded face as a
tensile wave with a magnitude greater than the dynamic concrete
tensile strength, andfailed the concrete. As shown in Figure 1,the Fo.t
dynamic tensile strength differs from the static strength by a factor
which depends on the strain rate of concrete response to the stress V 3
wave. An understanding of the stress wave propagation and the
concrete response is therefore critical to an understanding of how IT) T...
a scaled test should be conducted so that it will accurately predict
concrete spall and breakup observed in full-scale. Figure 2. Simplified Illustration of Stress Wave Propagation
in Concrete Slab
Figure 2 shows an idealized representation, based on
results obtained with the computational approach explained below,
of how the stress wave generated by an close-in explosion
Table 1. Summary of Results from Tests ofReinforced Concrete Walls
Investigation Effect of Scale Factor
Debris Veladly
(R/Se) I
cye Wa T s Charge
Struglht Thlelsm Disae Weighi Standoff Wals
Group Tedl No. seek (Pull (hehm) (fi) (6. () Damop Maziasmm Average
1.1 1/2 64M0 6 4.5 25 1.5 Total 92 62
1__ ___ Collapse
1.2 1/4 5800 3 1225 3 0.75 Spell 54 25
3.1 1/4 1600 3 2.25 3 0.75 Total Joe 65
Collapse
2 3.3 Full 4'00 12 9 25 1.5 Single 32 26
r Crck
2 34 1/4 50D0 3 2.25 0.4 0.375 Large Spall 17 15
Area
"1/4"aggregate used for all seats
206](https://image.slidesharecdn.com/a276170-221126090128-e06297b7/85/a276170-pdf-215-320.jpg)
![Stress in the through thickness direction greater that the Figure 3 shows the model of the concrete slab used in the
von-Mises yield stress exist because large stresses also develop in PRONTO2D simulation of both sets ofexperiments. The slabs and
the other two directions. Plots of calculated stresses in these applied loading were modeled as axisymmetric with the axis of
directions confirm that this is the case. The attenuation ofthe plastic symmetry extending from the center of the charge through the
portion of the wave is most probably due to the gradual conversion thickness of the slab. Therefore. a circular portion of the slab was
of the energy in this portion of the wave into strain energy. The modeled centered below the explosive charge. The slab thickness
large strains also cause significant lateral strains which are in turn in the model was equal to the actual thickness and the radius of the
restricted by the lateral confinement of the localized region of the slab volume considered in the model was equal to at least three times
slab. This lateral restraint is the cause of the large lateral stresses the thickness. This radius was found to give the same results in a
that permit the plastic portion of the wave to exist. preliminary study as a model with a radius equal to six times the
thickness. A non-reflecting boundary condition was used at the far
At time 2, the plastic portion of the wave has reflected and boundary through the thickness so that no stress wave reflections
the stress at a point in Figure 2 two inches in from the back face is wouldoccur there. A very fine mesh (a minimum of2200 elements)
tensile. For the simplified case shown here, where the slope of the was used for all analyses.
plastic portion of the stress wave is constant, the tensile stress at a
given point remains constant until either the whole wave passes
through the point or the front of the wave reflects off the loaded 2
face and passes back through the point as a compressive wave. As 1 2
the stress history shown at time 2 indicates, the tensile stress is 4
heavily dependent on the slope of the receding portion of the stress
wave (the "backslope") and distance from the back face. For a
non-idealized case, this slope is not constant. ThnS
Th;ck~ness •Nn•e etn
The stress history at time 3 shows the wave has reflected Var;es
off the loaded face as a compressive wave and has passed through "
the point of interest two inches off the back face. Because of the 1
high sound speed of concrete, the wavelength of the stress wave 3 x thckness
caused by blast loading is usually equal to several wall thicknesses
and therefore "wraps around" on itself within the thickness. The
duration of the tensile stress at any point through the thickness is Axis of Symmetry
dependent on time required for the stress wave to wrap around as a
compressive wave, which is afunction ofthe wall thickness and the Region Test Test 3.4
concrete density and stiffness. in in in
Figure 3 Reference 13 Table I
Description of Computational Study of Concrete Response to -
Close-in Blast Loading 1 33000 0.1 23000 0.2
The previous section described the propagation of a stress 2 15800 008 20000 0.2
wave induced in the slab near the explosive for the blast loading 3 15800 0.08 16000 0.2
realm of interest here in a general manner. In the following sections
results from the numerical simulation of two experiments where 4 15800 0.1 11000 02
close-in blast loading was applied to concrete slabs are presented 5 5000 0.1 5000 0.25
and discussed.
PRONTO2D, which is used to perform the simulations, is Figure 3. Model Used in Numerical Simulations of Close-in
atwo-dimensional transient soliddynamics code for analyzing large Blast Loading Applied to Concrete Slabs
deformations of highly nonlinear materials subjected to extremely
high strain rates.[9] It is the latest in a series of transient dynamics The blast pressures applied to the slab surface were
finite element codes that has been developed at Sandia National calculated from the chiurge weight and standoff used in the
Laboratories, beginning with HONDO.[ 10] As such, PRONTO2D experiments with the CONWEP computer program.[ 11] This code
contains a number of state-of-the-art numerical algorithms, uses the methodology in the U.S. Army handbook TM5-855 (121
including anadaptive timestep control algorithm, arobust hourglass to calculate blast pressures. Separate pressure histories were applied
control algorithm, an accurate incremental rotation algorithm, and at various distances from the axis of symmetry as drawn to scale in
a robust surface contact algorithm. Four-noded, uniform-strain, Figure 3 to model the spatial variation in the applied blast load. The
quadrilateral elements with single-point integration are used in the pressure and impulse used within these areas were average values
finite element formulation. Beyond its general capabilities, calculated from contours of reflected pressure and impulse
PRONT02D was chosen for this study because of the extensive calculated with the CONWEP code from a free air explosion. A
suite of existing constitutive models, and the fact that new models simplified linearly decaying blast pressure history was used in all
can be easily added. A three-dimensional derivative ofthe program the analyses which preserved the calculated positive phase peak
is also available (PRONTO3D). pressure and impulse. In the case of the test in Reference 13, the
pressure distribution was simplified to cause the average pressure
The equations of motion are integrated using a modified over locations in the slabwhere the stress was measured to be exactly
central difference scheme in PRONTO2D. The velocities are equal to the pressure calculated over the gage locations.
integrated with a forward difference and the displacements are
integrated with a backward difference. Numerical damping is An elastic, perfectly plastic material model was used in all
introduced in the solution by adding artificial viscosity. This the analyses. A von-Mises yield strength equal to 1.5 times the
prevents high velocity gradients from collapsing an element before measured cylinder strength of the concrete in the experimental slabs
is has achance to respond, and to quiet truncation frequency ringing. was assumed. The factor of 1.5 approximately accounts for strength
The technique used in PRONTO2D is to add viscosity to the "bulk" enhancement caused by the high strain rate of the concrete response
response. This generates a viscous pressure in terms of the volume to the compressive stress wave and enhanced strength due to lateral
strain rate. confinement provided by the concrete surrounding the region of
207](https://image.slidesharecdn.com/a276170-221126090128-e06297b7/85/a276170-pdf-216-320.jpg)


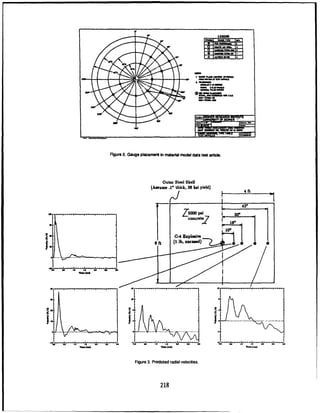


![TABLE 2. SUMMARY 01: SAND AND SELEcr
TE SmiaLANT TABLE 3 MODEL S'rRUCfL'RAL RADIAL RIGID BODY
PROPIWrTIFS BASED ON LABORATORY TFSI S AND BENDING VELOCITY
"" Propery WES Coa Leadcoa T
Flume Sand 6&40 b Wt
GraimDensity, kg/ms
3
264 1330(coal) RadialVelocity I 10 Repica 15 Froude* 1 10 Froude**
11300 (lead)
Porosity, dimensionless 0.39 0.4 0.4 c .ues
(06s) 0.37
1.6 0 6 0.37
Bulk Mass Density, kgirm3
1610 850 1850 14 06 0 3
initial Constrained Modulus, MPa 230 - 375 20 -40 20 -40 1 2 0 45 0 39
Poisson's Ratio, dimensionless 0.34 0.34 0.34 Nondimensionalized 00064 0 0058 0 0037
Angle of Internal Fnction, Deg 30 31 31 by Sod/ Simulant 00057 00050 00044
- -Popel (v/c) 00050 00050 00037
I_ - 1 0.0043 0OO38 0 0046
*Mass and Bending stiffness approximaely correct
*Mass: 0.8X low and bending stiffness factor of lOX high for
".exact"I/O Froide Scaling
1.2 m
4.2 m Simplified French
2.5 m SCPS Facility
6.0 M
I' ,--
-. 25m
Point of 7.35 m
Detonation -
Figure 3. 500 Kg TNT Prototype System.
1.0
v/c
0.1 _ _
Key
0 sand q1-0.4
'& coal v a 0.34
e coalilead -31*
0.01 1 1 __ _
]__
0.2 0.5 1.0 2.0 3.0
RI(EFpc2)1•
Figure 4. Non-dimensional Velocity vs. Non-dimensional
Range.
234](https://image.slidesharecdn.com/a276170-221126090128-e06297b7/85/a276170-pdf-243-320.jpg)
![IMPACT LOADING OF PLATES
A COMPARISON BETWEEN NUMERICAL SIMULATIONS
AND EXPERIMENTAL RESULTS
Magnum Langseth, Torodd Berstadand Per Kr. Larsen
Department of Structural Engineering
The NorwegianInstitute ofTechnology, Norway
and
Arnfinn Jenssen
NorwegianDefence ConstructionService, Norway
Abstract primary variables have been the plate thickness, mass of
projectile and support conditions.
Model tests have been carried out to study the plugging
capacity of thin steel plated structures of grade St52-3N Based on these results and basic principles of mechanics a
subjected to circular blunt ended large mass projectiles in the design model has been proposed to calculate the plugging
low velocity regime (vi < 50 m/s). To extend the parametric capacity of thin steel plates subjected to large mass projectiles
range of this study numerical simulations have been done with [4] [5]. However, to extend the parametric range of this model
LS-DYNA3D. The simulations so far have been carried out to and to get a better understanding of the physical mechanisms
verify the code against the present test results. Good agreement present during impact, numerical simulations have been done
has been found between tests and analyses based on models with LS-DYNA3D [6]. The simulations so far have been
using shell elements and the quasi-static material properties. carried out to verify the code against the present test results.
The comparison is made for simply supported plates and
clamped plates equipped with stringers.
1 Introduction The experimental results have been published in ref 171.
According to the Norwegian Petroleum Directorate large mass However, as a basis for the present comparison between the
projectiles such as dropped objects and fragments generated by experimental results and LS-DYNA3D calculations, a short
a gas explosion have to be considered in the design of offshore summary of the most important findings from the experiments
astru repsin hwill be given.
structures.
Based on a survey of possible dropped objects, long rods such
as drill-collars are identified as the most dangerous item due to 2 Experimental studies
its high kinetic energy and small contact area with the structure
during impact. A drill-collar has a mass of approximately 3200 2.1 Test program
kg, a length of 10 m, a diameter in the threaded pin end of 146
mm and may be dropped from heights up to 40 m. All tests were carried out in scale 1:4 using replica modelling.
As structural model for the impacted structures was chosen
Fragments generated by a gas explosion can be both primary clamped plates with and without stringers (test series DM) and
and secondary fragments and can vary both in shape and size. simply supported hatches (test series Al, BI-3, C1-2) of the
However, for large mass fragments the response in a steel type used in the wellhead area on a platform for simultaneous
plated structure will be the same as for dropped objects, drilling and production, Table 1.The hatches consisted of a
consisting of global elastic and plastic deformations combined square steel plate reinforced with rectangular transverse
with a local failure at the impact point. This combined mechan- stiffeners along all four sides.
ism results in a difficult design situation, and existing design
formulas show poor agreement with large mass projectile tests For the present tests the projectile was modelled as a rigid body
[11 (2]. Furthermore, formulas developed for other mass and with a flat ended circular nose. Throughout the tests the
velocity regimes are not directly applicable, as the physical diameter of the projectile was taken as d - 36.5 mm.
behaviour during impact is quite different (3].
The dynamic tests were performed by means of a pneumatic
Due to lack of knowledge about penetration mechanics in the accelerator consisting of a reservoir of compressed air and an
low velocity regime (v, < 50 m/s) for large mass projectiles, a accelerator tube. The reservoir operated at a pressure up to 7
model test study has been carried out. Rigid body blunt ended bar and allowed a 50 kg mass to be accelerated to an impact
projectiles have been fired against thin steel plates of grade velocity of 40 m/s. For each combination of target geometry
St52-3N to study the plugging capacity of such targets. The and projectile mass, a sequence of tests were carried out. By
235](https://image.slidesharecdn.com/a276170-221126090128-e06297b7/85/a276170-pdf-244-320.jpg)
![Table 1 - Test program and specimen geometry
Plate geometry Projectile
Test mass Test spcmen geometry and boundary conditions
seris h(mm) a (mm) MUakU)
Test series Al. B1-B3. Cl-2 Test series DM
Al 4,6.8,10 52 49.54 A
81 4,6.8 52 18.86
B2 4.6.8 52 34.62 _I_
53 6.8 52 26.00 0 .
Cl 4,8 137 49-54 _______ .,.
C2 4,8 242 49.54 1;T 1
DM 4,6 49.54
Boundary conditions in laboratory Boundary conditions in laboratory for test series DM
for test series Al, 61-B3, CI and C2 175 •s
Shfis,
7<2
SNOWS D3
RH-WW hsP
Namm S5O-VM
Diameter of pmjectile d - 36.5 mm
varying the impact velocity the critical velocity giving plugging deformed shape of the target plate throughout the impact. The
of the target was determined, impact velocity of the projectile was measured by means of two
photocells located immediately above the target.
In addition, a series of static tests were performed in order to
study a possible relationship between the dynamic and static
plugging capacities. Furthermore, the material properties were 2.2 Experimental results
determined by means of tests at elevated rates of strain in
tension and torsion [8]. The primary information gained from the experiments was the
impact velocity at incipient plugging. Fig. I shows how the
The test program, test specimen geometry and support con- impact velocity was varied in order to bracket the critical
ditions in the laboratory are shown in Table 1.Test series Al velocity. Fig. 2 depicts a typical time history of the interface
was designed to study the plugging capacity as a function of force between projectile and target for a hatch. As seen, the
the plate thickness, while series B1-3 were carried out to impact can be divided into a transient and a global mode phase.
investigate the influence of the mass ratio of the projectile to In the transient phase only inertia forces are present in the
target. Test series C1-2 were included to study the influence of plate, as no forces are transmitted to the supporting structure.
an increased inplane stiffness. Finally, test series DM were In the global mode phase the supports a,- fully activated, and
included to study the effect of stringers in the free span. As the target behaves almost quasistatically.
shown in Table 1,the hatches rested on RHS-profiles while the
clamped support for test series DM was obtained by clamping A sequence of displacement profiles for a hatch is given in Fig.
the plates between RHS-members bolted to a rigid base. 3 for five discrete times during the impact The permanent
displacement profile is given as well.
The projectile was instrumented by strain gauges that were used
to record the interface force between projectile and target. The most significant results of the experimental study were as
Based on this force-time history the displacement of the follows:
projectile and consequently the displacement of the plate was • The critical kinetic energy at impact was an increasing
generated by double integration. The target plate was instru- function of the plate thickness. Reducing the projectile mass
mented with a total of 24 strain gauges, which were primarily from 49.54 kg to 18.86 kg led to an increased critical
used to determine the strain and strain rate levels in the target energy. However, the critical kinetic energy seemed to
during impact. Furthermore, a high speed camera shooting approach the static plugging energy when the mass was
10000 frames per second made it possible to determine the increased.
236](https://image.slidesharecdn.com/a276170-221126090128-e06297b7/85/a276170-pdf-245-320.jpg)
![0.0
PLAN SECT.ON -30
0
"03 •.11l Y-
0Test 3wis A
02 -O 0 .- 1602-
o, h 7
, mm
0 a
5 0 10 0 150 0 200 0 250 0 300 0
0.0 1 -" I IDistane from center, r(-)
0.0 030 0.30
Scaled plate thickness Figure 3 Displacemnent proffies of taget at discreae tunes
Figure I bmpect energy at incipient Plugging Stress___________
2000
400O
J 002 50 0.v0162n•s 7e
00 400 o o •oo 20o 2• 0
Transient Glbl oepae
5000
Io
0 L L L 1, 12
00 1l0 20 30 40 50 60 70 80 90 4 3 2 I 0 I 2 6)
Time. t (ms)
Figure 2 Time histr of interface form Figure 4 Tests in tension. stress vs smrn rale 18]
" An increase in the inplane stiffness reduced the critical 3.0 Numerical simulations
plugging energy.
The comparison between numerical simulations and tests is
" Stringers seemed to have no effect on the critical plugging carried out for the simply supported hatches from test series A l
energy. and BI and the clamped plates equipped with stringers from
test series DM, Table 1.
" Plugging always took place at maximum interface force, and
the critical force for each plate thickness was independent
of the mass of the projectile and the support conditions. 3.1 Modelling
" A comparison showed that the dynamic force at plugging During an impact large elastic and plastic deformations take
deviated from the corresponding static one with + 5 %. The place which extend to the supports. Tests have shown that 90 -
permanent deformations at plugging were quite similar for 95 % of the initial kinetic energy of the projectile is absorbed
the static and dynamic tests, even though more energy was as global strain energy in the plate and that only a small
required to produce plugging in the dynamic tests. This fraction is spent to push out a plug. This means that the test
indicates that the path dependency of the plastic work is specimens can be modelled using shell elements and that no
important. account needs to be taken of the local indentation of the
projectile into the plate at the impact point.
" The energy absorption connected to the indentation of the
punch into the plate represented less than 10 % of the total The Belytschko-Lin-Tsay shell is the default element in LS-
absorbed energy at plugging. DYNA3D due to its computational efficiency and is chosen
here. Five through-the-thickness integration points and one
" Plastic strain rates up to 40 s -1 were measured in the plates. integration point in the plan of the element are used. The
Based on the tensile strain rate data shown in Fig. 4, this projectile is modelled as a rigid body using 8-node hexahedron
gave an increase of the lower yield stress of 30 %, while a elements.
reduced strain rate sensitivity was found in the hardening Fig. 5 shows a view of the finite element model of the test
region. specimens. As seen, the test specimens and projectile are both
modelled using two symmetry planes. 144 solid hexahedron
237](https://image.slidesharecdn.com/a276170-221126090128-e06297b7/85/a276170-pdf-246-320.jpg)
![profiles for test no Al-8-7. As seen, the deformation profiles
are different during the loading periode of the impact, Fig. lOa,
resulting in larger permanent displacements than those for the
test, Fig. lOb.
Even if the magnitude of the deformations are different in
analysis and test, the deformation patterns are similar during the
deformation process. After initial impact, a deformation wave
moves radially towards the support. Before this wave reaches
the support both test and analysis show that the shape of the
deformation pattern is approximately axisymmetric. After this
(a) (b) time yield lines extend inwards from the comers. This is shown
FIgm'e 5 Rear view of finite element models in Fig. 11, where contour line plots of the computed defor-
(a) Hatch, test series Al and BI mation pattern are given. Fig. 1la shows the deformation
(b) Clamped plate equipped with stringers, teat series DM pattern before the deformation wave reaches the support, while
Fig I lb depicts the permanent deformation shape. Furthermore,
elements are used for the projectile while 1273 and 2067 shell it is worth noting that the impact event in the analyses, as for
elements are found to give sufficient accuracy for the loose the tests, is divided into a transient phase and a global mode
hatches and clamped plates respectively. This element mesh phase, and that the time when the supports are activated is
requires a time step of 1.3 its for numerical stability. The approximately equal for test and analysis, Figs. 6-9.
support conditions of the test specimens from test series AI and
B1 (Table 1) are modelled as a stonewall that prevents inner Fig. 9 shows a comparison for a case where a plugging failure
penetration of boundary nodes while allowing for separation. occurs. As the local indentation of the projectile into the plate
Both the stringers and the plate are modelled as clamped for has insignificant influence on the global response, the measured
test series DM. Furthermore, the contact between the projectile and calculated curves are approximately equal until plugging
and plate is modelled as a sliding interface without friction. takes place followed by a sudden drop in the measured force-
time curve. As plugging always takes place at maximum force,
Due to the length of the yield plateau for steel grade St52-3N the shell analysis can then be used to determine the onset of
compared to the measured magnitude of the strains in the plugging when the critical interface force between plate and
plates, the plate material is modelled as elastic perfect-plastic. projectile is known. In ref. [7] the critical interface force for a
Even if the plate material has shown to be strain rate sensitive, circular blunt ended projectile is determined based on a mean
the best fit to the test data is found by using the quasi-static critical shear stress, t,, - oJ(0.41 hid + 042).
material properties. However, a separate comparison will be
shown when the material strain rate effects are modelled by the In the previous analyses, the quasi-static material properties are
Johnson and Cook Plasticity Model, using the tensile strain rate used. However, Fig 12 shows a comparison between test and
data shown in Fig. 4. Also for this case the material is model- analysis when the latter is based on the Johnson and Cook
led as elastic perfect-plastic. Plasticity Model and the strain rate data shown in Fig. 4. For
comparison the analysis based on the quasi-static material
properties (; - 10-4
s -) is shown as well. As can be seen, the
3.2 Comparison and discussion inclusion of the strain rate effect increases the stiffness of the
plate causing the maximum interface force to be overestimated,
When comparing measured and computed time series, it should while the maximum displacement is underestimated compared
be noted that no attempt has been made to filter out the toite te data. T inceaent is evde nt ase
oscillations due to tra,,ýIling stress waves in the projectile for responseein theaplate is inco ned by plastmemrae
the easredintrfac-foce
Xrn seies.As he ompted response in the plate is mainly controlled by plastic membrane
the measured interface-force •ime series. As the computed stresses. An increase in the yield stress will then imply an
values are only available at 0.2 ,nstime intervals, the computed increase in the overall stiffness of the plate.
histories are in effect filtered.
Test series DM: Fig. 13 shows a comparison between the
Test series Ad and B l:
Figs. 6-8 show a comparison between measured and calculated interface force and displacement
the measured and calculated interface force time curves for a histories for a 4 mm thick plate equipped with stringers when
representative case when a rebound occurs. Plotted is also the a rebound occurs. Good agreement is also here found between
displacement of the plate at the edge of the projectile and good test and analysis. However, as for the simply supported hatches,
agreement between the measured and calculated data is found. the numerical model is too stiff during the unloading periode,
However, the permanent displacement at the center of the plates resulting in a larger permanent displacement than for the test.
is too large compared to the measured value. This means that No further discussion will be given to this test series as only
the numerical model is too stiff during the unloading phase of the interface force and the permanent central displacement are
the impact. High-speed camera measurements have shown that measured.
this effect may be related to a difference in deformation
profiles for test and analysis during impact. Fig. 10 shows a
comparison between the measured and calculated deformation
238](https://image.slidesharecdn.com/a276170-221126090128-e06297b7/85/a276170-pdf-247-320.jpg)


![ROOF
BEAM
CROSS SECTION A-A
REINORCEO-SOIL WALLS
-/NTEOCKING iOAR WALL
Figure 1Conceptual View of Protective Shelter
will likely have a covering of soil, burster slab and beam mid span relative to an er.d, approximately
deflection layer. For purposes of concept comparison, corresponds to the plastic strain in the hinge. Concrete
the shelter was assumed to have six feet of overlying soil, maintains its ultimate flexural resistance for support
contributing to the mass of the system and reducing the rotations up to 2 degrees, whereas achieving support
available moment capacity of the beam. rotation up to 4 degrees requires special reinforcement to
confine the concrete or to permit tensile membrane action
Threat assessment and development of design roof [2]. This study used a maximum support rotation of 4
loading are not directly addressed in this study. With degrees, with consideration given to reinforcing the
blast generally representing the critical design case, a compression zone to give the concrete added ductility.
uniform distributed pressure with an instantaneous rise
time and linear decay (triangular load pulse) Evaluation Criteria
approximated the impulse from detonation of a general
purpose bomb over the shelter. Penetration or breaching It is helpful to identify a set of criteria and associated
are being addressed by separate design features under weighting factors for evaluating various beam designs or
development, concepts. A proposed set of criteria and weights is:
Size and weight restrictions associated with transportation 1) Fabrication Cost (25%) - Price to initially design and
and placing the beams using equipment normally fabricate the beams, including material, labor and capital
available presents another problem constraint. This equipment used in fabrication.
criterion will likely differ for shelters situated in more 2) Handling (15%) - Moving beams between fabrication,
remote settings versus locations easily accessible by land storage and erection, including special precautions or
or water transport. The latter case could make use of equipment.
fewer larger beams versus more numerous lightweight 3) Storage (15%) - Addresses long term storage and
beams for shelters in areas with difficult access. maintenance requirements such as protection from
Therefore, beam weight represents a problem constraint corrosion, prestress losses and amount of storage space.
and affects a number ofevaluation criteria described 4) Erection (25%) - Degree of difficulty and resources
below. required to erect the beams in a shelter.
5) Reliability (20%) - Level of confidence in design and
Performance Requirements performance of a given concept or material.
Ductility and support rotation commonly measure the Having established the problem parameters, performance
ability of a structure to :.-,sist dynamic loading. Ductility requirements and evaluation criteria, the analysis
expresses the ratio of the maximum dynamic deflection to procedure is described next.
the yield deflection, assuming the beam has an elastic-
plastic response. This study adopted a target ductility DYNAMIC ANALYSIS METHODOLOGY
factor of 6, typical for this type of construction I1
1.
Support rotation, calculated as the angular rotation of the In this study a single degree-of-freedom model
242](https://image.slidesharecdn.com/a276170-221126090128-e06297b7/85/a276170-pdf-251-320.jpg)
![approximates the dynamic response of the roof beam. In addition to shear, designing and detailing the beam
This approach permits analysis of numerous designs due such that flexural response governs includes
to the moderate computational effort involved and consideration of:
provides sufficient accuracy for structures such as the
simply supported roof beams. Conventional or prestressed concrete:
A majority of the required calculations for a given 1)Web thickness and reinforcement for shear
concept pertain to determining the flexural resistance and 2) Shear and bending of the top flange in the transverse
stiffness. A spreadsheet containing the strength and direction
stiffness formulas and numerical integration of the 3) Effective width of the top flange
resulting SDOF differential equation was developed to 4) Prestress losses due to shrinkage and creep
facilitate the analysis.
Composite steel-concrete:
Calculating the beam's flexural resistance uses the
accepted strain compatibility and force equilibrium 1) Local buckling of the web or flange
approach. The procedure generally follows the 2) Shear capacity of web
assumptions and guidelines given in the ACI Building 3) Shear connectors
Code (3] and the AISC Manual of Steel Construction 141, 4) Bearing and intermediate stiffeners
with the exception of load and resistance factors. The
underlying statistics represented by the load and Member sizes are proportioned or checked for conformity
resistance factors in the codes do not apply to blast with requirements from the relevant portions of the
resistant design. Thus, the analysis uses load and concrete and steel design codes [3,41 including concrete
resistance factors equal to unity in accordance with the cover, rebar or strand spacing and weld requirements.
general practice for blast resistant design.
VALIDATION OF THE DESIGN PROCEDURE
The stiffness of a conventional or prestressed concrete
beam depends on the extent of cracking it has An initial evaluation of the three concepts considered in
experienced. As an approximation, the analysis averages this study based solely on estimated fabrication cost
the gross and cracked moments of inertia to calculate the favored prestressed concrete and composite over
stiffness of a concrete beam [2,5J. Computing the conventionally reinforced concrete. Subsequent
stiffness of a composite steel-concrete beam uses evaluation using the above criteria and weights found that
transformed-section moment of inertia. Finite element the composite steel-concrete beam ranked highest. The
analysis provides a means of validating these composite steel-concrete concept ranked particularly well
assumptions, as described later in this paper. for each criteria and permitted significant flexibility in
individual beam weight.
The design methodology described above relies on the
beam attaining its intended flexural response. Other limit Keeping the analysis methods intentionally simple
states, such as shear failure, must be prevented from required using more detailed methods to check the
governing the beam's ultimate strength. validity of the key assumptions and calculations. Finite
element analysis of several beams for each concept
The design procedure employs two methods to estimate showed good agreement with the static load/deflection
the shear force in the beam. Dynamic reactions obtained response predicted by the design procedure. Load tests of
from the SDOF calculation consider the dynamic prototype beams serve to further validate the design
equilibrium of the applied load, resisting moment and procedure. In going to each of these levels, greater detail
inertial force. I , approach uses the assumed deflected is included in the validation. The following discussion
shape to compute the inertial force and applies to both the more fully describes some of the finite element results
elastic and inelastic ranges. The second approach and subsequent static load tests.
includes the contribution from the higher normal modes
since they become increasingly important when Finite Element Analysis
calculations involve higher derivatives of the deflection
expression, as for shear [5]. Therefore, the analysis uses Finite element modeling utilized the nonlinear analysis
a simple procedure to computes the shear force using the program ADINA [6) to validate the static resistance
higher modes over the linear response range of the beam. functions embodied in the design procedure. Plane-stress
Shear design is based on the higher of these two results. two-dimensional elements modeled the steel and concrete
portions of the beam while truss elements modeled the
shear connectors and longitudinal reinforcing.
243](https://image.slidesharecdn.com/a276170-221126090128-e06297b7/85/a276170-pdf-252-320.jpg)
![The response of a 50 foot conventionally reinforced beam LOW (kil.)
is shown in Figure 2. The load deflection curve depicts 20D, A MO"
the mid span deflection and total applied load computed
using the design procedure and predicted by the finite16-SO
element analysis. The figure also shows the extent of I ' ....-....
concrete cracking at three stages of loading, starting with
the development of flexure cracks and progressing to 120
shear and flexure cracks at intermediate and yield loads.
-10. 20 30 4.0
__d Span Oeftcon (fthes)
a) Flexural Cracks Figure 3 Load-Deflection Response of 10 Foot Long
Prototype Test Beam - Design Procedure vs FE Model
- The finite element analysis also indicated that achieving
an end rotation of 4 degrees requires strains of 2-3% in
the concrete and 4-5% in the steel. Concrete typically
b) Flexural and Shear Cracks - exhibits only 0.2 to 0.4% maximum usable compressive
b) Flexural and Shear Cracks strain. However, adding confining stress causes concrete
]] to behave in a more ductile manner and greatly enhances
its compressive strength. Analytical procedures and
experimental results of columns of various sizes and
shapes quantify the ductility achieved by using closely
spaced rebar cages to create a confined concrete core
c) Cracks at Yield 17,8,91. Figure 4 shows the reinforcing used to confine
the concrete in the test beams and the resulting stress-
strain curve used to derive the ADINA concrete model.
PC5O
1000 F
eoo-[.s•÷
-
il'r.•i---------------#3RebarCage2"O.C.
800
Z-700
04c600 -- -y
J~200
Il'300 - - - - - - - - - - -
Si . .
a 'e
4 " 18"ConcreteSlab
too-- -
- -- -- --- ---- ---stress (psl)
0 2 4 6 i b Ii 1'4 am&
Deflection at Mid Span (in) 700confined byreinforcing cage
E- -E Design Procse1jre
Figure 2 Finite Element Results for 50 Ft 4=
lConventionally Reinforced Beam3= U-oitd
Figure 3 plots the predicted load-deflection curve for one 10
of the test beams and shows the good agreement between
the design procedure and the finite element model. 0.0%r.50% t
'Strain
5
20 2.%
Differences include aslightly less stiff elastic response Figure 4 Concrete Slab Reinforcement and Predicted
and positive slope in the plastic region due to the strain Stress-Strain Response for Prototyp Roof Beam
hardening behavior of the steel in the model.
2'44L](https://image.slidesharecdn.com/a276170-221126090128-e06297b7/85/a276170-pdf-253-320.jpg)


![u2=0 (Q <0) in the design calculations. Figure 2 shows different
characteristics of the confined versus unconfined stiffnesses
= VaO~ e422~gvt)~t~eVi) ofCONWED Stratagridn' 9027(Farrag et al. 1991)ý
(2 > 0) (27) Geogrld CONWED
u3=0 (t3 <0 ) Confining pressu
.e 48 KN/I
2
- *0
=l
(t3>0) (28) L
u4=0 (t4<0) -.
--
1' 2(- e-4144)- 42(-e-144)+4mq[I- (I+
- 4)e--
y4
txq2.
... 5Unconfined Extension Test
1" (6. in height x 7 in length)
(t4>0) (29) I
u5=0 (t5<0) o 5 10 is 20
Strain dy/dx Wl
2
V0 {2(i - e-a15) - 4M2(l -eCris5+ 4mq[II-(I+ yis5)e-' J" Fapam 2. Confinim v,. Unwn~wod Sufftimiii ofakOsop
The higher confined stiffhess can be attributed to the
-A.[c. t I-
I- er't5)]+ 2)AI- (I + y. t5)e-r"S composite action of the reinforcement with surrounding soil.
I If the wall panel stays in contact with soil, the connection
(t5 >0) (30) system is termed "compression-controlled" If the wall panel
The expressions for the longitudinal normal stress, particle separates from the soil, the connection system is termed
velocity, particle acceleration of the soil medium can be "tension-controlled". Figure 3 shows the relationship
readily derived from Eqs. (26)-(30). Although higher order
terms could be added to the solution, the transient response between the ratio a and the ratio a0 / R which can
of the reinforced soil system due to shock loading will have be used to determine whether separation will occur
been damped out before they become effective. The I-D
model accounts for superposition of incident and reflected INTERFACE STRESS
waves propagating between the explosion point and the (Perfectly-piwic: structural response)
interface, and accommodates Eq. (1) as a special case. The
I-D model gives the same interface stress as that given by Eq.
(1) when the soil medium is semi-infinite. The I-D model is
used as the basis to develop a procedure for the design of a Compression
100
modular wall panel and soil reinforcement connection system. = =--
DESIGN CONSIDERATIONS
___ V
When the deceleration of the panel by the structural C
resistance from panel connection and soil reinforcement is - - Tension
less than the deceleration of the incident shock, the interface -
stress becomes tensile and the wall panel tends to pull the l li l
soil reinforcement out from the soil. The soil reinforcement ,., V,,
will have to carry the tension developed at the interface. The Peak incident stress/aximurn unit resistance, oF/ Rmax
equation of motion ofthe wall panel, Eq.(7), becomes
Fi-,2U
R Predicton o'Terue orComapiveuawrfam Sune
M a + Rmaxbh + T = 0 (31) The free-field soil displacement under the shock wave
°&2 9prescribed by Eq.(6) is
where Tg is the tension in the soil reinforcement at the
interface. If this interface tension is greater than the "pull-
out resistance" of the soil reinforcement, slippage will occur Uff (t) = v° (1-e a) (32)
between soil and soil reinforcement and the wall panel will cc
become separated from the soil. The confined stiffness or The maximum wall panel displacement, Uma,, for a
"pull-out resistance" of the soil reinforcement should be used compression-controlled system is always less than twice the
249](https://image.slidesharecdn.com/a276170-221126090128-e06297b7/85/a276170-pdf-258-320.jpg)


![DIMENSIONING OF HIGH EXPLOSIVE DETONATIONS
ON CONCRETE STRUCTURES
Prof. Dr.-Ing. D. Kraus
Dipi. Ing. 1. R6tzer
University of German Armed Forces
Department Structural Engeneering
2 INTRODUCTION on the basis of an Euler-Lagrange-link. At
each timestep the state of equilibrium and
This contribution continuous a paper [5] the conservation of mass, impulse and en-
presented 4 jears ago at the Fourth Inter- ergy are satisfied.
national Symposium. In this report the
boundaries for the posibility of a kinema- In the Lagrange-formulation the nodes,
tic chain and the fixing of the necessary which are describing the investigated me-
destruction areas (hinges) were described. dium, are moveable. The grid gets the pos-
sibility to deforme and distort. In this
case the elements may degeneratet, so that
negative masses or energies can occur.In
the Euler-formulation the grid is located
T (D
•in the space and the medium moves through
" it. In the Euler-Lagrange-connection, the
I -pressure -calculated in the Euler grid -
-- _will be act on the structure which is de-
.. 4 -" .-- -[ scribed by the lagrange grid.
0 3 SIZES OF THE SPATIAL GRIDS AND THE
TIMESTEPS
For the spatial grid of the detonation
Fig. 1: Arrangement and dimensioning of area the size of one element is taken so
the necessary hinges small, that the highes occuring pressure
reaches at least 50 % of the Chapman-Jou-
guet-pressure.
In this contribution the analytical de- With the chois of the timestep the fol-
scription of the explosion-impact and the lowing conditions have been satisfied
behavior of concrete and steel and the
coupling of the explosion with the struc- - the numerical stability of the calcu-
ture are presented. lation
- the shockwave must reach each element
- the loss of energie must be limited un-
2 SPATIAL AND TEMPORAL REPRESENTATION OF der a fixed level because the energie-
THE HIGH EXPLOSIVE AND DESTRUCTION conservation is satisfied approximately.
PROCESSES
The two last conditions guarantees the nu-
The interaction of a high-explosive deto- merical stability of the calculation auto-
nation upon a reinforced concrete struc- matically.
ture can be solved sufficiently through a
numerical simulation. The description of
impact and detonation processes is possi- 4 DESCRIPTION OF THE MATERIALS
ble in a coupled or separated process. For
our examination we have been used a cou- For a practical description of the
pled solution which can include the corre- materialstrength it is necessary to divide
lation between the impact and the reaction the stresses and strains in a hydrostatic
of the structure directly. and a deviatoric part.
The used program AUTODYN solves this pro- In a simple approximation the hydrostatic
blem-with the method of finite differences parts represents the volumetric change and
259](https://image.slidesharecdn.com/a276170-221126090128-e06297b7/85/a276170-pdf-268-320.jpg)
![A more exact adaption of the failure cri- the deviatoric parts represents the pla-
teria to testseries is not worth untill stic behavior, the failure and the strain-
the influence of the strain-rate in the rate influence.
rang. • = 1001*1 cannot be described yet. The explosive properties are described
with the Jones-Wilkins-Lee equation.
+ B, (I - -) C"'+V
0 6W ~R 2
1 V, .
For characterising the material two funda-
mental relationships are necessary.
u--'"byUT--- 2 - The equation of state, EOS, which des-
Scribes the stress-strain-relations.
I I t
II I t 0.4
-,8 -16 -14 -12 -10 -8 -6 -4 -2 YT 6.tlfý - The failure-criterion. It determines the
maximal possibile stresscombination.
Fig. 3: Failure-criterion (3]
S COMPARISON OF NUMERICAL CALCULATIONS
WITH FIELDTESTS
The used calculation models and the laws K0
of material are checked for her abilitys.
This happens by comparing craterdiameter, I
craterdepth and damage of the lower side I
of the plate. For our first inverstigati- -4 / f
ons we used the fieldtests of the /
"Forschungsinstitut fUr milit~rische Bau-
technik", ZUrich (4]. failure criterion
used by AUTOODY
-2 -4 -6 -8 -10
fieldtest 3O,,
• q.¢'. .- ,/ Fig. 2: stress-strain-relation [3]
For the presentation of the EOS we use the
pressure-density-relationship. This is
similar to the hydrastatic stress-strain-
relation. The pressure is equal to the
octahedral normal stress Goct and the
S
first approach step density is indirect proportional to the
volume.
The fail-ure of the concrete is described
by Drucker-Prager with
Fig. 4: First approach step
f = J +- - . 0=
260](https://image.slidesharecdn.com/a276170-221126090128-e06297b7/85/a276170-pdf-269-320.jpg)
![4 R3IUUCw 3I
(1] AUTODYN TM, Software for Non-Linear
Dynamics, Century Dynamics Incorporated,
Users Manual, Oakland 1989.
(2] Bartlm&,F.: Gasdynamik der Verbren-
nung, Springer-Verlag, Wien - New York:
1975.
(3] Chen, W.F.: Plasticity in Reinforced
Concrete. Mc Graw-Hill:1982.
[4] FMB ZUrich: Lokale Schadenwirkungen
auf armierte Betonplatten bei der Explo-
sion von Sprengladungen und Grana-
ten.Forschungsinstitut fUr militlrische
Bautechnik ZUrich, FMB 79-13, 1979.
[5] Kraus, D.: A new Blast Method for Con-
crete Bridges. Proceedings of the Fourth
International Symposium of fhe Interaction
of Non-nuclear Munitions with Structures.
Panama City Beach, Florida: 1989.
[6] Nilson, A.H.: Finite Element Analysis
of Reinforced Concrete. Americon Society
of Civil Engeneers, New York: 1982.
(7] Yi, P.: Explosionseinwirkungen auf
Stahlbetonplatten. Dissertation TH Karls-
ruhe: 1991.
261](https://image.slidesharecdn.com/a276170-221126090128-e06297b7/85/a276170-pdf-270-320.jpg)


![additional eroded length ALs/dI. Most of the compu- In the following, one presents several comparisons
tations have been performed for a 7km/s impact velocity between calculations and experiments, which show the
and a 1.1 GPa strength steel targets. Influence of the AL,, term on jet residual velocities
predictions. Table 1 presents the results obtained for
the experiment previously shown on figure 2: one can
ALs- - see that the use of the additional erosion terms gives a
-l1 Cu -- RHA good agreement with experiment.
ALs/dI - 2.9 [I - Table 1
/ residual velocity Vir after plate I after plate 2
,.."""experiment (fig.2) 8.0 km/s 7.20 km/s
2 ID-code + eq.(3) 8.45 km/s 8.09 km/s
0o V-7km/s ei-.I GPa ID-code + eq.(5) 8.05 km/s 7.25 km/s
I' * V - 4km/s a- I.i GPa
o V-7km/s o-0.6 GPa
id I Similar comparisons have been performed In the case
f et/d1 of inclined plates. It is commonly considered that a jet
S2 6, 'a 10 Interacting with a plate of thickness et under an obliquity
a has to perforate an equivalent 'line of sight thickness'
figure 5: computed let scaled additional erosion as a e -
- et/cos(e), -a being measured between jet axis and
function of scaled RHA plate thickness. the normal to the plate. But when looking at the the
schematic representation depicted on figure 6, one can
consider two additional terms corresponding to plate
On figure 5 are also plotted both one hydrocode result entering and exiting, which may be added to the 'line of
for a 4km/s Impact velocity and one result obtained for sight thickness'. The following expression:
a 0.6GPa strength armor plate. The computed
corresponding ALs values show the same tendency as eeq - et/cos(a) + dj tg(a) (6)
the reference results (7km/s, 1.1Gpa), showing that im-
pact velocity -in the hypervelocity range- and target giving the equivalent normal thickness.
strength do not affect significantly the additional jet
erosion. On figure 5 is also plotted the following
equation:
ALs/d1 - 2.9 [1 - e'('ll/d1)] (4)
which fits the hydrocode results and will be used for
ID-code modelling.d=2rd
MODELLING JET INTERACTION WITH SPACED PLATES
Among the existing analytical penetration models
reviewed in 161, no model accounting for the additional
erosion effect can be found. It appears that Backofen's
"Kernel' model [8], provides an Improvement for
describing local interaction between penetrator and et
target: this model allows for a better prediction of crater
diameter In thin plates [91, but has still to be further
developed for quantitatively predicting jet additional
erosion. Reference [10] suggests to reproduce the figure 6: schematic representation of the equivalent 'line
additional erosion in analytical models by adding extra- of sight thickness' to be perforated In an oblique plate.
layers of a hypothetical superdense material on the rear
surface of each spaced plate: adding 1mm of a material
with a density one hundred times higher than steel, Table 2 shows a comparison between computations and
would allow for predicting jet residual velocities for an experimental measurement of the residual velocity
60-70mm diameter shaped charges. of the same jet as for table t, after perforating two steel
plates of 1Omm thickness under an Incidence of 60°. The
In the present work, the results obtained from hydrocode distances measured along the jet axis being respectively
and plotted on figure 5, have been introduced in the 90mm between the charge and the first plate, and 20mm
analytical ID-code. Using equations (3) and (4), the between the two plates. These. results show the res-
consumed jet length AL on perforating a plate with pective influence of eq.(5) and eq.(6
). As in the normal
thickness et is now given by: impact case, it appears that the correcting terms induce
more than 10% reduction of the V value and allow for
AL t( (V -U) )dP 2.9 d1[I - et
. Ie~dl)] (5) a good agreement with experiment al values.
270](https://image.slidesharecdn.com/a276170-221126090128-e06297b7/85/a276170-pdf-279-320.jpg)

![[51 J. Brown. Modelling and Experimental Studies of a 181 J. Backofen. The effect of Local Target Deformation
Family of Shaped Charges in a European Collaborative Motion on Cratering. 12th International Ballistics Sym-
Forum, 12th International Ballistics Symposium, San posium, San Antonio, 1990
Antonio, 1990
(91 J. Backofen, Shaped Charge Jet Perforation of Thin
161 W.P. Walters, W.J. Flis and P.C. Chou, A Survey of Plates-- The 'Kernel' Model, 13th International Ballistics
Shaped Charge Jet Penetration Models, Int. J. Impact Symposium, Stockholm, 1992
Eng. 7, No3, 307-325, 1988
1101 J. Brown, The Shaped Charge Jet Attack of Confined
17] D.A. Matuska, HULL User's Manual, AF'L Report and Unconfined Sheet Explosive at Normal Incidence,
TR-84-59, 1984 11th International Ballistics Symposium, Brussels, 1989
272](https://image.slidesharecdn.com/a276170-221126090128-e06297b7/85/a276170-pdf-281-320.jpg)

![Optimization criteria were total borehole depth and the energy - A
criterion, i e. as explained jet energy consumed between 300 mm and a Csz*tT'%300-2900...
1000 mm depth in the target. From a greater number ot FSC oesigns _HA
seven were selected for further investigation (Fig 4) Table 1 gives FSC
the results ot the simulations.
DESIG• DESIGN2 DESIGN3 DESIGt 4t 2800 Make S.-,
-, 4000
24Kot,-4440
11000-- _
ý FXR, 0s
DESIGN 5 DESIGN 4 DESIGN 7to::Mk::
+a. .o '.%A=, + •:,.-.•f ,+Tra FXR. MaH
ke S.,i Tch
~~~
....... ...... VIEW A-8 •
The first visible particle has a velocity of about 9.800 rnvs. Three large
particles occur over the range from 8.000 to 8.500 nvs. Below 8.000
Fig 4 FSC-Oesigns 0 185 rn/s a particulated jet is found, with the jet for the most part having the
appearance of macaroni. This means that it is not a question of small
Design Vtip Energy (crit) fishes but small tubes which, however, in their cumulative length are
[nvs] [kJ] indicative of good particulate behaviour. The second flash X-ray
shows the jet over the range between 7 500 mvs and 3.300 nvs. The
1 9.700 1.340 jet is not yet particulate over the range below 3.300 mis.
2 10.600 1.570
3 8.200 1.260
4 9.700 1.340 Design 3:
5 9.500 1.340 With this design peak velocity of 8.600 rn/s occur. Compared to the
6 9.700 950 photograph relating to Design No. 1 large particles cannot be
7 ......... determined at the peak of the jet, the particulate effect is very uniformr
Here again there is no pronounced macaroni effect, the jet is fully
Table 1 Simulatin results particulate up to a velocity of 2.800 mis. The apparently final particle
of the jet is again in the picture.
FXR-TESTS
Design 5:
Following theoretical examination FSCs to the seven designs were In this instance a tip velocity of 8.925 rnvs can be evaluated. The
fabricated and test fired with FXR diagnostics. Type of HE was contact film, however, has been triggered by particles which must
TNT/HMX 15/85. The test set-up is shown in Fig. 5 The FXR photos have had a velocity of 12.500 m/s. The jet is seen in its entirety as a
(Fig. 6) were evaluated and four of them are described in detail below, shower or an elongated cloud, the tip being relatively thin, thickness
These tour designs have been selected for further testing against around 8.000 mis, becoming somewhat thinner up to a range of 7.000
targets. mis and then thickening continually in diameter up to its visible end of
about 3.500 rnvs. Jet density appears to be constant.
Design 3
Design 5
~*' Design 7
Fig.. .,, -,_--..- -
- - - - m.w_-
Fig 6 FXR-pictures of FSC-Jets
274](https://image.slidesharecdn.com/a276170-221126090128-e06297b7/85/a276170-pdf-283-320.jpg)
![Design 7: Additionally a FTC dummy (Fig 8) was pushed into the hole and the
The fastest particles occur with this design at a velocity of 5.900 rris. CG-depth of the HE-charge of the FTC was determined This gave a
A relatively regular particulate effect arose. The particle shape, more realistic measured for the quality of the holes The table 4 shows
however, is indlative of severe shear fracture behaviour, i.e the liner that the best results in terms of C.G -depth were achieved with design
material is certainly not comparable with that of high-performance I and 5. C.G -depth for these designs also were markedly above the
liners. In addition, it can be seen in this photograph that a certain requirement which was 570 mm.
asymmetry of the jet is present. This could be due to initiation On
account of the flash being triggered by the contact film particles of-.
about 8.000 mns must have occured here, too, but are not visible in L
- 30 23 CC"
the picture. The second flash shows the jet over the whole range V
[- -- o 23_--
down to approcimately 2.800 mns. "
VO
L. .24 CC"
A remarkable difference is visible of the particle shapes and sizes for ...
the various liner materials pure Aluminum (99.5%), cast Aluminum
alloy AISI12 and copper. 1<1
The X-ray photographs were evaluated in accordance with the 2-70..o25 CC,
standard used at DASA-Schrobenhausen. Evaluation o1 the X-ray
photographs was performed for both the first photograph, i.e. the L- -
J V ..--s
.,, Ca
exposure with the short delay time, and the second exposure. The
results are listed in table 2. It was not possible to perform an _ _ _
evaluation of this kind for Design No. 5. When this variant was
detonated, no classical particles were produced; a particle shower and_. VOL 44W70.2 CC--
highly distinct disintegration of the jet occured. Since a continuous jet j .,
length is visible in the X-ray photograph, it was not possible to rW 30f
determine a prticulation time. *o. ,'
Comparison of velocity and energy from simulation and test shows
some minor differences yet still the same trend in relation to the ti--f
various designs. VOL
v, o453 .,S CC-
Design i Energy (crit) Patic. lime Jet-length I-z:Zi •- i::
(kmns) (kJ) (us) (mm)
Fig 7 Bore Hole Proiles
t 9.8 2.000 295 1650 1 9.8-4.2)
2 11.0 2.300 218 1680 (11.0-4.3) I"-. -
3 8.6 1.900 416 2290 (8.6-3.1)
.4 9.8 190 1200 (9.8-3.5)
5 8.9 (12.5) . ..-..... .-
-
-
6 10.2 800 182 1040 (10.2 -45)'.-2 37
7 6.0 1.500 358 1220 ( 6.0-2.6) I,
Table 2 Test results cG
TESTS AGAINST TARGETS
Fig 8 FTc Dummy
As mentioned above four of the seven designs were selected on the Dsg
8 DpPe tao d t
basis of quantitative and qualitative jet characteristics for further tests. Design CG-Depth Penetration depth
Two each SCs to these designs were fabricated and fired against a __ [mm]
reinforced concrete target with a width of 1.53 m. Concrete quality 1 597 624 1000
was 855 (German designation) which means a compressive strength 651 1038
of 8.000 psi minimum. The characteristics of the four designs are 579 1036
listed in Table 3. 3 480 530 892
Design Description of Design 738 616 1301
495 1252
1 70e- Cone; 8,6 mm; At 99.5; Waveshaper
3 Trumpet; Al 99.5 272 939
5 700- Cone; 9.0 mm; AlSif2; Waveshaper 312 292 1120
7 Hetmi sub-cal; Copper; MPI-Plate
Table 4 CG-Depth of different designs
Table 3 Design charactensrtcs
Test results are to be compared best by means of the plotted borehole
profiles (Fig. 7). To measure borehole diameter as a function of depth
cylinders with different diameters at steps of 5 mm were pushed into
the borehole as deeply as possible, i.e. to the depth of the repective
borehole diameter. These measurements were converted into the
borehole plots.
275](https://image.slidesharecdn.com/a276170-221126090128-e06297b7/85/a276170-pdf-284-320.jpg)

![RESPONSIVE CHARACTERISTICS OF BURIED STRUCTURES SUBJECTED TO IMPULSIVE LOADINGS
Fang Qin
Nanjing Engineering Institute , Nanjing , PRC
ABSTRACT
The response of buried structures to impulsive on the deformation response is studied. The
loadings is determined by an approximate TDOF model is used to predict the effect and
method.The structure is modeled by a dimensionless deformation responses are presented
three-degree-of-freedom(TDOF) system. The two for nondimensional parametric variations.
exterior walls perpendicular to the blast
direction are modeled by lumped mass and
stiffness. The third DOF is the rigid body THREE-DEGREE-OF-FREEDOM MODEL
motion of the structure. The effect of rigid
body motion on the response of the structure is A buried box-shaped structure is subjected to an
considered and dimensionless responses are explosion located at a range Ro,from the nearest
predicted for nondimensional parametric surface. Three generic configurations are shown
variations. in Fig.(l).
The explosion produces a radially expanding shock
INTRODUCTION wave that propagates through the soil. The
stress wave encounters the nearest wall
Extensive research in the area of groundshock due first,which cause the wall deform downward.
to nuclear explosions has resulted in analysis Then ,as the stress wave envelops the structureit
methods which have been successful in predicting moves as a rigid body.
the responses of buried structures in simulation The fundamental basis for the analysis presented
tests. These problems are solved by using the in this paper lies in wave propagation theory and
numerical method,such as FEM,BEM etc, and the enforcement of appropriate conditions of
simplified analysis methods. Those studies show continuity of stress and motion at the interface.
that the deformation of the roof and bottom of the Formulation for this condition have been widely
structure is affected by the rigid body motion used by many other researchers successfully for
under the nuclear explosions.[l,2,3] The the case of nuclear explosions.
deformation of the roof and bottom of the Unfortunately,the free-field stress is not well
structure are usually neglected for simplicity in defined for non-nuclear groundshock problems and
determing the interaction load on structures and these are only limited test data available.
response of structures subjected to this Reference 7 provides a semi-empirical expression
interaction load is predicted. These methods for the free-field stress based on test data fre"'m
have been used with success for the case of the early 1970's. Considering the degree of
nuclear explosion, uncertainty in the definition of the free-field
Design procedures used for conventional weapons stress,one-dimensional wave propagation theory
effects are founded in methods developed for considering approximate treatment of the localized
designing against nuclear weapon threats, nature of the loadings, and lumped parameter
Current method for designing buried protective models are justified at this time in order to gain
structures to resist the effects of impulsive insight into physical behavior of these systems.
loadings due to conventional weapons use a The TDOF model is proposed in this paper. The
single-degree-of-freedom(SDOF) idealization of the two exterior wall perpendicular to the blast
structure. The stresses produced by the weapon, direction are modeled by lumped mass and
with or without reflection factors,are applied stiffness. It is assumed that the two exterior
directly to the structure. walls parallel to the blast direction have no
Simplified SDOF models are usually used to deformation and move as a rigid body.
examining the response of the exterior wall near Therefore,the system has three DOF. They are
the non-nuclear weapons explosion. In these the deformation of the near wall,W (t),the
studies the two principal response mode,the deformation of the far wall,W (t) and the rigid
deformation response and the rigid body response
are treated separately.J4,51 Reference 6 body motion of the structure,W (t).
studies the effect of deformation on the shock The interface pressures acting on the near wall
response of buried structures, and far wall are
In this paper,the effect of the rigid body motion
277](https://image.slidesharecdn.com/a276170-221126090128-e06297b7/85/a276170-pdf-286-320.jpg)
![introduced so that the results can be applied
Pn(t)l2p(t)-nc
n[W
0 (t)÷Wn(t) X (x,y)f (1) widely. Set
Pf(t) ftc f 0l(t)-Wt(t) Xf (x,y) ( 2)
Wn(t) Wn(t) /ns
where (*) indicates differentiation with respect -( * W (t) /W (13)
to time, fc is the equivalent acoustic impedance t /s
of the soil. X(x,y) is the mode of deformation W (t) /W
and subscript n and t represent the near and far 0 0 /s
wall separately. p(t) is the equivalent t - t /tr
free-field stress,namely
where W and W are the max-mum deformation of
Is
f
PE t/t t)t the near and far wall subjected to static load, Ps
r r ,respectively. Therefore,eqs. (4)-(6) may be
p(t)- (3) written as follows after introducing dimensionless
P0 exp(-(t-tr)/te) t"tr parameters.
in which t is atrival time of frew-field
a
2 - - - -
stross,presented by Ro/c and t is rise time,about d U /dticldW /dt+c2dWn/dt+c3dW /dt
0.1 t .(7) +c4W +c5W +c6wf +c7p (t-) (14)
Virtual displacement principle is used to
formulate the differential equations of motion of
the system. The equations of motion of the 2-n-d a
rigid body and the near and far walls are d w /dt-aldw /dt~a2dW /dt~a3dw /dt
+a4WU+a5W +a6Wf+a7p(t) (15)
U +C WOU 2p(t)/Mo-fn Cn/M0 k,. Wn+ ff cf /M k fWf
-k MnIo Wn +kif Hf/M (4) d W /dt-bldW /dt+b2dW /dt+b3dW /dt
In n 0 n I 1 0 f f 0 Wnf
S+2 D U +wUa2 =k [2p(t)/N -2D W W (5) +b4Wb+b0 Wf+b/p(t) (16)
n n n n n irn /n nO 0
where
Wýf2 Df Wf +w• Wf k(,f (2 Df W4 +1O) (61 cI=(2ktnMn/MoktnDn/
MO.V W.tr
+2ktf (Hf/M0 )ktif (( If/w'r )dW,.t,-
(c-n).)ntr]/s
where
c2-c3-c4-O
Di = e, c /2 M( n,)7) cS=k n(Mn/M0 ) (Wnt) 2/s
kImi ti /k mi (i=n,f) (8) C6=-kIf (Mf/M0) (uftrl 2(Wns/Wfs )/s
kt, = k1Xi(x,y) dF /F (i=n,f) (9) 2
Li' (Is c7=2 (MnNM )4W
nt r) (1/IfW n) /s
km, =
- x(x,y) dF /F (i=n,f) (10)
s=l-k (H /M)k -°k (M /M )k
t(nMnMU ln If f U tro
2
(A)i = tit/MW (i=n,f) (11) c 20 H /N +2 Df / M
C = ( cn + fcf) / M0 (12) Wfs/W2s=k mfMrA2/ 2
K = stiffness of the wall (i=n,f) Is nsc l -2k
i al--cik -2k
Imn IM
M ,Mn , Mf = mass per unit area of the total
structure, the near wall and far wall = n ntr
respectively.
a3=a4=0
SOLUTION OF THE DIFFERENTIAL EQUATIONS OF MOTION a5=-c5k imn-(nt r2
Eqs.(4)-(6) are ordinary differential equations of a6=-c6k
order two. Nondimensional parameters are IM
278](https://image.slidesharecdn.com/a276170-221126090128-e06297b7/85/a276170-pdf-287-320.jpg)

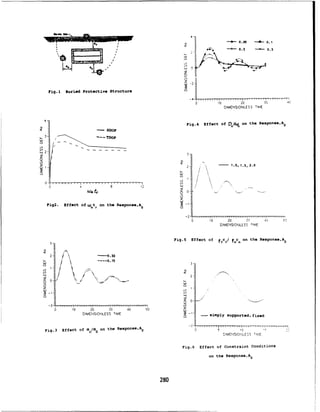


![method and then the differential equations are of saturated soil can't be determined. Assuming
discredited into nonlinear algebra equations. that the contents of the corresponding media of
Artificial viscosity is introduced into the saturated soil are a• ,a2 and a; under the
equations to improve the convergence property in pressure respectively,p is the density of
the finite element analysis. Many useful results saturated soil. We can obtain the following
are obtained with FEM. The comparisons of finite equations from Eq.(3) to Eq.(5)
-1
element solutions and difference equation ai = a (p/p0) k1 (6)
solutions are given to verify the effectiveness of .; ,' 2 iR; 0) - (7)
P2c
presented method. It lays the foundation for the 22
.; - C
3i22•0) ÷ 1 ]-k 3 (8)
study the dynamic behavior and related topic of p3 c2
saturated soil under explosive loading. P - 0 0 (a a 1)P + (a i.
0
P + (a .a P (9)
2. BASIC EQUATIONS OF SATURATED SOIL substitute Eq.(6),Eq.(7) and Eq.(8) into Eq.(9),
Assume that the contents of air, water and the equation of state of saturated soil is
_k-1 k2 (p-p0)-
particles of solid soil in a unit volume of p 00{ 1- -- P
k-pc- 1
0 0
1 c2 pc
saturated soil are a,, a2 and a3 respectively, k3(p-p0)+ -k -1
+2 _[ 2 + 3 } (10)
3 p3 c 3
PlP 2 and P 3 are the densities of the
The above equations of motion represent the
corresponding medium. c
1, c2 and c3 are voice
conservations of mass and momentum. In Euterian
speeds of the corresponding medium under the
description ,after neglecting the effect of shear
condition of initial pressure equals to .
stresses for one-dimensions: flow ,the equations
For p-p 0 ,the density of medium in saturated soil
of motion can be written as
is
a u 8u p = 11
P0=1P++" ? 3 (1) U
+ p x
a1+a +a3 =1 (2) up + a
u + P~lO x = 0 (12)
The equations of state for an individual medium of where x-spatial coordinates and t-time
saturated soil are initial conditions
P = P0 (P/P k, (air) (3) p(X,O).p0 (13)
2
P0p,
+ -P
2 "c 2 [(P/D k2 - 1 3 (water) (4) u(x,O).O" (14)
k
2
p(x,O)=po (15)
2 and boundary conditions
p I
PO + P3 c•
3 1(p/lp)k 3 - 1 ] (solid) (5)
k3 p(O,t)=f(t) (16)
where,k ,k and k3 are the specific entropy of the it is not convenient to solute for Eq.(ll) and
corresponding medium,2generally k31.4, k2=k3=3.0 Eq.(12) which are unsteady and nonlinear equations
.As tie compressibility of a individual medium of However, it is convenient to treat the
saturated soil is different from each other under propagation of plane wave in dense media in the
the pressure the content of a individual medium Lagrangian description. To get the equations of
283](https://image.slidesharecdn.com/a276170-221126090128-e06297b7/85/a276170-pdf-292-320.jpg)
![motion in the material coordinates, we introduce a explosive wave propagates in this media, the shock
change of coordinates, and set wave will produce. It is very difficult for
t =
t ,h ,
(xt)
t - t ,h f p dx-p u dt ,v-l/p (17) ordirary FEM, to treat the problem of shock wave.
(0,0)
(1T)The following relations can be obtained from The reason is that the shock wave front is a
above equations geometrical surface, physical variables are
8xh 8x a
a a
h x_ 1/v - - p u discontinues functions on this surface . In the
a___
P __ uE U a u
1/p x 8 h u 37= p u 3-7 sense of physics, the shock wave surface is not a
au au au
S- p u •,-• ÷ a"(18) geometrical surface but a surface with certain
17t 28u7-h~ + ;v
U 2 u a P 2 a v depth because of the effects of viscosity and
The change of density varying with the dispersion in the medium .Theoretically , if the
propagation distances is not great in the dense effects of artificial viscosity and dissipation
media where it contains a small amount of air are adequately introduced into the dynamic
.Therefore , the density can be approximately equations,above equations can be still used to
regarded as the function of time. that is solute the problem of shock wave.But the
0a(•19 thickness of shock wave surface is so small that
it is very difficult to choose adequate size of
Substitute Eq.(19) and above identities into
element in the practical calculation. Therefore,
Eq.(ll) and Eq.(12),we obtain
au + a 0 (20) the effects of viscosity and dispersion must be
-. + y•=o(0
a-t a h
a u a v enhanced .It requires some effects of dissipation
* 0 (21)
to extend the depth of shock wavefront ,this can
The initial conditions and boundary conditions are
be accomplished by introducing the even order
p(O) - p, (22)
)
0 deviation term into the dynamic equations. but,
u(0) - 0 (23)
the numerical oscillation should not appear. How
p(O) - p0 (24)
to dissipate the effects of artificial viscosity
p(0,t) = f(t) (25)
and dissipation is a problem needs further
From Eq.(21), for the specific volume v.1/p ,we
discussion
obtain
v1/p{)-k k
-I "(Fp- -k -1 Assume the artificial viscosity is q , and replace
v=l/P0 1 + a - 2 + 1 2
k
3 (-1 P 2
2 2 the variation p in Eq.(20) with p+q , the
k (p-p^) -k1
+ _3(- 2
+ 1]-3 ) (26) equations of motion can be written as
Assuming v-F(p),as the result of Eq.(19),F(p) is L--+ =a0 (27)
only the function of time. a u T-h
where, q= {J -h a and -y=a p c Ah
3.DYNAMIC EQUATIONS OF FINITE-ELEMENT 0 -a 0
(1). artificial viscosity in which,p is the density of saturated soil ,c is
It may be seen from Eq.(l0) that the saturated local voice speed , Ah is the size of element, a
soil is a nonlinear elastic media. When the is a constant.generally varying from 0.2 to 0.5
284](https://image.slidesharecdn.com/a276170-221126090128-e06297b7/85/a276170-pdf-293-320.jpg)
![Consider the following relationship are rewritten as
2 . * * * dhp dh
c dp/dp (28) u(t)J
1.hp, (t) I dh vu (t) jp p~~d
C 0 S C 0 (33
and the state equation (10), eq.(28) can be .- p (t)!*i* e+u(t)i i .
rewritten as uPt, '. dh- (t), p . dh - 0 (34)
-1 e e e
p -k k (p-p^) _k
1
k (p-p0 ) From Eq.(33) we have yu (t)•: 0 0
(a 1 (P/p 0 )-k 1 +a [2 2 + 1 1 2+aJ E("-0 e
P2
p 2 3
2 2 2 3 3 for the first element
S (-+k a k-(p-po1 -
-2(p/p) 1 2 2 0 --
O--I-.i) +k2
0 C
p 2c 2 22 -p2 M -f(t),'
1 2 21
+ 3 0-k
)
10 and for the other element
(29) -po (t,) .. 0
(p-p
0 ) (k to*
P2c-2 .)
3c3 Assume
For p-p0 ,we have AC=. f •d d
3 a.. 1/2 3
co
.(/ -L2) (3) i I
and . 2/k the Eq.(33) and Eq.(34) can be written as (note
andP 0=p Ic1 1
the change of footnotes)
(2) finite-element equations Ae C"e .
0 t) (3
u (t) - C - pe(t) + I a". ue(t) - f.(t) (35)
Introduce the following approximations into i 1
i j J i
.. u.(t) - A F (p) pe(t) - 0 (36)
Eq.(27) and Eq.(21) I,
(e) (Ce) f(t) (1 - 1) fC(t) 0 (i $ 1)
u u. M(t) •o(h)
i i F'(p) _ ve(t)/pe (t)
v ,, v'(t)R i(h) (0-1,2) } (31)
( t)
e After assembly of the condensed elements, the
p pi
p(t) Oei(h)
equations of motion take the form
(Pi is shape function ,and it satisfies the
Anm Um(t) - C m
P (t) + D UM(t) = f (t) (37)
following equation B mfl *n
+ 2 m Um(t) - An F (p) Pm(t) - 0 (38)
Because the specific volume of element ve) where
A - 3 B 13 'ýl '
doesn't vary with the distance , we have n. ii 4n im nM ij in jm
C~ ~ e ea
~ =~ 3
Cl e(h e (e) flu ij in im flif I) Iin JO
v.(t) •.(h) * vT(t) (.(h, + ,,(h,)]v '(t) " "' " -, °,
M(t) p vi
(h C
+ t = f (t) (n = 1) f (t) = 0 (n ; 1)
hence, v(t) v.(t)
in which,Ae is the Boolean matrix of the ,,e-
Substitute Eq.(31) into Eq.(27) and Eq.(21), apply
element
Galerkin method to dynamic equations ,and set
Consider the difference relationships
weight function wi = •.o(h) ,we obtain uk Uk+l- Uk .k pk+l p k
-U k p -pM
,e ()e e M
COM
i. (t)• • d h + t
p (t,;° • dh At At
Ue~et)
dh = 0 U ( - t I Uk P (1_0) pk,1+ t pk
ep m
1n i M m
ee d e e Set A' = A /at
e (t) q
dh v (t) dh =0 et Anm nm
By the partial integration methods ,and introduce and substitute above relations into Eq.(37) and
the boundary conditions , the equations of motion Eq.(38) the final equations of motion are
285](https://image.slidesharecdn.com/a276170-221126090128-e06297b7/85/a276170-pdf-294-320.jpg)


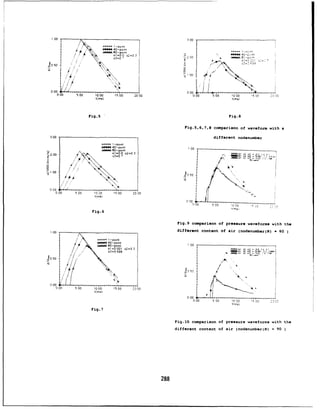


![6. Slavson. T. R., and Walker. R. E., "User's Guide
for Material Properties Database Search and 0 U E RY
V A 8 L E
Retrieval Program.* Evaluation Draft, Applied_____
Research Associates. Vicksburg, 145,September 1992; wis r1EVN larl f'00-.9 C3
prepared for US Army Engineer Waterways Experiment SITE ______LOCATION:_______
Station, Vicksburg, MS.I
15511UJ.w.Ejotat:
C: "TA-FLAS, S
0AlJ1.A0 CD
GENERAL
DESCRIPTION
OF MATERIALF
Table 1. Structure for MPROP database. 5011LASFIATO
MAM A0 0.0ENT
E to
Field field Nm. Type Description MET
DESIY ý o)t c00- my Mai TV:z-c 000 to r00
---- ---------
------- ------- ----------- ------- SPECIFIC
0000210:[- toRiM ] OEUOI AIR
V0IDS.
[-0 coE-0.0-0
* I so~r Character Link to SUItIS database
* 2 ZYUTtS
K Character Link to ZVO? database ON. OF SAIRat 5
ý .r0.001 V0ID MAT1{0-_0 t{qý
3 POW~i
N" Character Project now POM[Tr ý 0 E~iiJ LIOUID
LIMIT:
f 1to 0 0
* 4 TYCF- haracter Type of material:PLSILII:r04 o07 PATCTYNDXr_.0t= 1
- backfill NATCLeT
"U"-
undisturbed stimic va (ur. to=~ DEERMINISTIC
ORPOABILISTIC
* 5 5113 LJOC Character Site location
* A 135110 LI Character InsitosreW esentation of 4C to *.it,
poperties: "L - Live stress
"T" - total straes
7 LAY RM Numeric Layer number
8 USPI TOP Numeric Depth to top of Layer. meatrs
9 DuES SOT Numearic Depth to bot of Layer, meotes Figure 2. The Query Table Showing the Default Conditions
10 DEFTHUTGT Nlumeric Depth from top of layer to pto 1.
water table (positive down) (pin1(
* 11 WATtS FLAG Character Water table fleg:
"A**
- rAbove layer________________________________
"14"
- w4Twithin layer U ERAY T ABL E
o 12 SAT-FLAG Character 1002 saturation point fleag:
A. 5, or W as in 11
* 13 GEN DES M Character General description of materiel SERIES
KEY.(40 EVENTfr lvPEJpi
* 14 USCi clA;SS Character USCS classification SIT LOCATIUA
* is wATU7 COvT Numeric Water content. I ____________________________
* 16 WEI
-D7D Numeric Wet density. Mg/m'
o 17 DRY DEN *omric Dry density, MS/sP INSITUJilvsooata l:
* 1s sPzECIFIC..G Nummeric Specific gravity SA....J
* 19 P AIR VO-ID Numeric Percent air voids GENERAL
DESCRIPTION
OFMATERIAL
* 20 DEG SAT Numeric Degree of saturation. Za O.
CASSIFICATION: WATER
CONTENT: aidt Ej
o21 VOID RATIO Numermic Void ratio
o 22 P03051?! Numeric Porosity WETOENSITY: 0.0 r-00.0 SY DENS
ITY: r0.001 to r0.;
23 GRADU
-KY Character Keyword link to database SPCIFIC GRmviny
[-oo tq(ý PERCENT
AIRVOID&
[Or t.F0.0
* 24 ALL Numeric Liquid limit
* 25 APt. Numeric Plastic limit DES.OFSAO1.AATIOR
ý *E
F0.001 VOID
PATooxnj-0- t.Tý
* 26 A7PI: Numeric Plasticity index tylrY ý~Jo F-i7 LIQUID0
LIIT Fito .FO.
27 C&ll NOTE Character Note on compaction
* 28 SKIS7VII. Numeric Seismic velocity. m/s PLASTIC
LIMIT:
rF to 0.0- PLASTICITY
INDEX 0. o 0.0T7
* 29 DZT PROS Character Type of properties: uF-7ali'~ t I TIeo~I 0 *0S~
"D"
deterministicSESIVEOIY
-ot= DTRIITCRPOBILTC
"P"-
probabilistic -ECto #.lt,
30 TIMS FACT Numeric TX3 strength factor
31 PLC7TiES Character Keyword link to plot file database
Notes: 1. -means that this Field can be used in a
Query condition by MPQ. Figure 3. The Query Table Showing an Entry in the SERIES KEY Field
2. If TYPEBFU - "lU, then fields 6-12 (Option 1).
should be populated.
H PRO0P 0DAT AB9A SE U E RY PROGR
AA M
REPORT *A
Proloct MRCs
I ACKFILL
EFFECTS
ON0001
RPUSEO St.1E0 RE0WFOAEI
CONCRETE
SLABS
MP~aRO SITE
LOCATITON
sAIIEISIDER HmOLLOW1..
FIAT N0X0.
MY
MOTIES
seriss Key: EventKe:cmeaazOo0101'AIFU
Layer Mr.
LjJ 00th to TooE
6Uottom at Layer tel:000 27
MATERIALe opRIoywRteeoE
DToaAsBJ ./A GM goweld.Layer
IAOII I0T1I
OAAU 103St. 80os isye I Anoof Proewti TOTAL
G A IP O SMatera-W &MI
SPAVELLY
CL.AYDesiie f/c):go
GF~~~AD
MPPLOTS b~~~"ear
Can'tentfSI: 0S Oolts /d St4i]
GRADATIONl~sC~ PRT Specific -0,It,: .70SAir otisf-4.00- osvores ;
01Sawtiol5
DATA PLO
iLLM Void Awtlo: 00* Fro,. .10 eoý 03 d
Liui Lmi L10
1.1.1 3I. Plastic111:100
POEcity 100.
Rjj
FILl, PrOonrt 15 are: EOICEIIIIMZNST1Cý TXE StrengthFoctor: eN/Al
00 You wont Cira~tipo
Informat ion? /N>
Figure 1. Material Property Database General Structure. Figure 4. Report Screen.
292](https://image.slidesharecdn.com/a276170-221126090128-e06297b7/85/a276170-pdf-301-320.jpg)

![Effective Stress Constitutive Models for Saturated & Partially Saturated Soils
H.D. Zimmerman, Y.M. Ito, J.A. Carney
CaliforniaResearch& Technology, Titan Corporation,Chatsworth,CA
ABSTRACT approach in the modeling of saturated and partially
saturated geologic materials; 1) Reduced modeling
California Research & Technology (CRT) has effort and increased model fidelity, 2) Reduction of
supported the U.S. Army Engineer Waterways uncrý ,inty in modeled material response, 3)
Experiment Station (WES) In development and Extension of modeled response regime beyond
evaluation of material models and numerical regime of laboratory testing or other available data
simulation techniques for predicting the ground shock used in model fitting.
environment due to explosive-produced loading
conditions from buried conventional munitions. An EFFECTIVE STRESS CONSTITUTIVE MODEL
effective stress constitutive formulation is described
which is Intended for modeling the response of Geologic materials are generally multiphase
geologic materials (rocks and soils) subjected to materials, consisting of matter in solid, liquid, as well
explosive loading. This paper will discuss the as gaseous states. The solid portion of such a
advantages of employing such an approach in the multiphase material exists as a complex assemblage
modeling of saturated and partially saturated soils. of particles of various shapes and sizes forming a
Comparisons of model response for dry, partially porous skeleton. The pore volume in this skeleton is
saturated and fully saturated conditions and the occupied by a mixture of fluid and gases. 1
In.
effects of model response and the importance of performing the task of developing a constitutive
shear-volume coupling on calculated ground shock model for a multiphase geologic materials, it will be
will be presented. seen convenient to break the total stress tensor into
two components
BACKGROUND
Ot = ce + MU I]
Effective stress model formulations were
originally developed and implemented into CRT. where at is the total state of stress of the material, 2
numerical codes (Frederickson, Zimmerman, Carney, U is the pressure of the pore air/fluid, M is the matrix
1989) and validated against SRI International lab- equivalent of the Kronecker delta function, and ae is
scale saturated rock HE experiments (Zimmerman, termed the effective stress, a measure of the loads
Carney, & Ito, 1992). This constitutive model has carried by the skeleton. This relationship, first
been implemented intc the SABER/CWE-family of proposed in 1923 by Terzaghi implicitly defines the
large-strain finite element codes specifically term effective stress as employed herein.
designed for calculating ground shock from
conventional munitions (Akers & Stelter, 1991), Consider first the case of a porous material
(Zimmerman, Shimano, & Ito, 1992). loaded in drained conditions. In drained conditions,
the pore air and fluid are allowed to drain away,
This effective stress approach involves explicit thereby preventing the development of pore
consideration of the portions of the material stress pressure. In this case, loads are supported by the
carried by the porous soil or rock skeleton and by the solid skeleton alone via a complex state of
fluid/gas phase constituents. The effective stress is intergranular stresses. For a control volume
that portion of the material stress supported by the containing a statistically relevant number of
porous skeleton, and the portion supported by the
fluid/gas phase constituents is termed pore pressure. 1
Gas phase matter will hereafter be referred to simply as "air".
There are several advantages to employing such an 2
Compressive normal stresses are positive.
294](https://image.slidesharecdn.com/a276170-221126090128-e06297b7/85/a276170-pdf-303-320.jpg)
![particles, traction's supported by this very complex to be higher than the pore pressure. 1he remaining
structural system are characterized by the effective equilibrium relationship,
stress tensor alone.
Pa =Pf = U [5]
Since effective stress is expressed relative to a
volume of material consisting both of srlids and pore simply mandates that any air occupying the pore
space, the "average" state of stress in solid material space is in pressure equilibrium with pore fluid. The
is somewhat higher than the effective stress. The satisfaction of Eqs. [4b] and (5] is central to the
average state of stress of solids in the drained operation of the effective stress constitutive model in
material, as is assumed to be the numerical code.
Os=0e/(1-0) [21 The uncertainties in mechanical response of
saturated geologic materials are largely attributable
Nhere 4 is the (porosity) volume fraction of the to the uncertainty in response of the porous skeletons
material which is occupied by pore space. Note that since the behavior of the water/gas and solid mineral
this relationship assumes that the area fraction of constituents of geologic materials is quite well
pore space on any plane is equivalent to the volume understood. Because the effective stress approach
por spce n
ny lan i eqivaenttothevolme considers the role of the skeleton and the
fraction of the pore space, an assumption which consitens exlcle of the material
strictly holds only for isotropic materials. cnttet xlcty h oto ftemtra
response which is well understood is automatically
Next consider the case of a saturated porous included in the modeling.
material, loaded in undrained conditions. Under DEMONSTRATION OF MODEL
these conditions, control volume tractions are
supported by "partial" stress contributions from solid Use of the effective stress response requires
and pore fluid constituents as follows: development of three separate constitutive response
models, 1) the dry or drained skeleton, 2) the solid
at=as(1-0)+OMU [3] grain, and 3) the fluid behavior. Once the grain and
fluid behaviors are fit for a given type of material only
its drained response needs to be fit to provide a
Substituting Eq. [1] for at, the average state of stress complete description of the material's constitutive
of the solids in a saturated material in undrained moerspn. Wlldvoedcntuie
conditions is seen to have an additional contribution response
lelwater/gspad soidurin
fromthe ore
ressre.response laws for the water/gas and solid grain
from the pore pressure. (quartz) constituents, are used. No additional fitting
of solidor fluid/gas constituents is required to use the
as=W(e/1 -0)+MU [4a] effective stress model. After the drained response is
developed it can be used to predict material
response over all saturation ranges, from totally dry
The hydrostatic component of the solid stress is to partially saturated to fully saturated. All that is
required is the specification of air filled void or
Ps =Pe / (1-0)+U [4b] degree of saturation.
Where Ps and Pe are the solid and effective Total stress responses (under uniaxial strain)
pressures, respectively. As in the case of the of a 30.5% porous soil at three levels of airfilled void
drained material, the effective stress tensor is again (Oa=O, 5, & 30.5%) were calculated with effective
seen to be a measure of the loads carried by the stress theory (see Figure 1). At low pressures, dry
intergranular state of stress in the solid skeleton sand, Oa=3 0 .5O/o, is very hysteretic and relatively
expressed relative to the entire control volume of strong (i.e. it can support significant stress
material. deviators). For the partially saturated response, Oa
Equations [3] and [4] are the first two of three =5%, no pore pressure can develop, until all of the
relationships which together define the equilibrium air-filled porosity is crushed out (marked as
between the material constituents and the external saturation in the figure). Until saturation, all of the
tractions on a control volume. Physically, Eq. (4b] load is carried by the drained skeletal response. At
defines the extent which the intergranular state of saturation, almost all of the load is carried by the
stress causes the average pressure of solid material pore pressure, and the development of any
295](https://image.slidesharecdn.com/a276170-221126090128-e06297b7/85/a276170-pdf-304-320.jpg)


![Effects of Enhanced Constitutive Models on Calculated Free-Field Ground Shock
H.D. Zimmerman, Y.M. Ito, J.A. Carney
CaliforniaResearch & Technology, Titan Corporation,Chatsworth,CA
J.E. Windham
U.S. Army EngineerWaterways ExperimentStation, Vicksburg, MS
ABSTRACT loading, unloading and reloading. These speeds
strongly influence the interaction of the ground shock
California Research & Technology (CRT) has with interfaces (layers, free-surface and structures)
supported the U.S. Army Engineer Waterways and associated relief/reflected signals, and hence the
Experiment Station (WES) in development and attenuation of shocks. Hysteresis also determines
evaluation of material models and ru'merical simula- how much energy is absorbed in the form of waste
tion techniques for predicting the ground shock heat, (i.e. energy that no longer contributes to ground
environment due to subsurface detonations from shock propagation). Strength is an important factor
buried conventional weapons. This paper will in determining the total duration of the ground motion
discuss the development of an enhanced strain path and hence peak displacement. While the general
dependent hysteretic constitutive model for character of strain paths developed in ground shock
computational applications and hydrocode events is known (i.e. uniaxial strain during shock
simulations of an instrumented field event; DIPOLE loading followed by spherical divergence on unload),
FACADE 2 (a vertically oriented 1/3-scale MK-83 details of the strain path can become very
buried bomb containing 15.4 lb of C-4 detonated in complicated. Shear-volume coupled treatments are
high air-filled void sand). Comparisons of model thus crucial to modeling material hysteresis in a
response with and without path dependent hysteresis robust manner.
and the effects of model response on the calculated
ground shock will be presented. CONSTITUTIVE MODEL
An enhanced mathematical constitutive model
BACKGROUND formulation that is capable of capturing the dominant
physical process of strain path sensitive hysteresis
Results of recent laboratory material property has been developed. This model employs a strain
tests (Phillips,1991a) indicate significant shear- hardening yield surface and a strain path dependent
volume coupling for Socorro plaster sajid; showing plastic flow potential. Nonlinear three-invariant
that hysteresis is highly strain path dependent. Hybrid-Elastic-Plastic models of the type previously
Shear-volume coupling implies that the deviatoric developed (Zimmerman et al., 1987) were fit
stress state influences the hydrostatic state via consistent with the WES laboratory mechanical
dilation or shear-induced compaction. In the property tests [e.g. uniaxial strain compressibility
illustration (Figure 1) of strain path dependent (Phillips, 1991b) and biaxial strain unloading
hysteresis, Eis the strain, the subscripts 1, 2, 3 refer (Phillips, 1991a)]. At the time the original non-
to the principal directions, and v indicates the volume dilatant baseline model was developed (Zimmerman,
strain. This sand has been extensively employed as Carney, Ito, 1991), only uniaxial strain load unload
the backfill material in a number of recent data was availaole. As strain path dependent
instrumented conventional munitions field events and mechanical property data became available, model
has been the subject of laboratory mechanical enhancements in terms of shear-volume coupling and
property tests. strain hardening were implemented. The main model
parameters varied are given in Table 1, and
Key aspects of the material response that play represent a step-by-step developmental approach to
important roles in the physics of ground shock incorporate greater detail and improvements in both
propagation are material hysteresis and strength. the material constitutive relations and the numerical
Hysteresis controls the relative wave speed in simulation of ground shock.
305](https://image.slidesharecdn.com/a276170-221126090128-e06297b7/85/a276170-pdf-314-320.jpg)
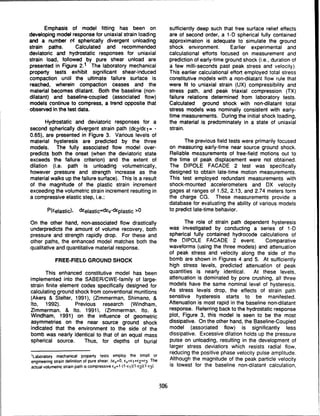


![HOW TO SELECT A DESIGN FRAGMENT FOR PROTECTIVE
STRUCTURE DESIGN WITH CONSISTENT RELIABILITY
Robert H. Sues and Lawrence A. Twisdale
Applied Research Associates, Inc., Raleigh, North Carolina 27615
Telephone: 919 876-0018
ABSTRACT considers the number of fragments that impact the
structure.This is a key feature of the method since the greater
In traditional, deterministic protective construction, the the number of impacting fragments, the greater the chance that
structure is designed to withstand the penetration effects of a fragments more lethal than the design fragment will hit the
single "design" fragment. We present here a reliability-based structure. The RBD framework is used herein to illustrate the
design (RBD) framework that can be used in the design process of developing and applying design charts and tables for
fragment selection process. The RBD methodology differs a Mk82 500-lb GP bomb threat for frag~nent penetration in
from the Confidence Level (CL) approach used in current concrete. The framework uses the fragment penetration
manuals in that the structure designed using the RBD method formulas given in the U.S. Air Force Protective Construction
will protect its contents with a known level of confidence. It Design Manual[Drake, et al., 19891, hereinafter referred to as
has been shown that the CL approach used in current manuals the PCDM. Research is underway to tabulate and generalize
does not directly relate to design reliability or confidence and results for a range of weapons of interest and to develop
in fact can sometimes be grossly conservative and sometimes validated penetration formulas, since the current formulas tend
grossly unconservative. The RBD framework is used herein to to significantly overpredict penetration depth (lethality) for
illustrate the process of developing and applying design charts high-speed fragments generated by modern weapons.
and tables for a MK82 500-lb GP bomb threat for fragment
penetration in concrete. 2. OVERVIEW OF RBD FRAMEWORK
1. INTRODUCTION The developmental framework for reliability-based
selection of a design fragment encompasses the important
In traditional, deterministic protective construction, the fragmentation variables (e.g., velocity, shape, impact angle and
structure is designed to withstand the penetration, perforation, orientation) as well as the number of fragments that strike the
and/or spall effects of a single "design" fragment, where the target. The framework accounts for the multivariate nature of
design fragment is characterized by a specified weight, initial penetration by transforming the problem variables into a single
velocity, and shape. Although current manuals recognize the load-effect called the fragment lethality variable. Using this
variability in fragment mass (via Mott's distribution), the transformation and the distributions of the underlying fragment
Confidence Level (CL) approach that is used to select a design variables, the probability distribution for the lethality variable
fragment does not directly relate to design reliability or is computed. Finally, the expected number of fragment hits on
confidence since it does not consider the number of impacting the structure is evaluated and the extreme value distribution for
fragments (which varies with standoff and target sire) and it the lethality variable is derived. The extreme value distribution
does not address the inherent variability in the velocity, shape, is the appropriate distribution for use in designing the structure
impact angle and orientation, and spatial distribution of the since it gives the probability that no fragments more lethal than
fragments generated by the cased explosive [Dass and the design fragment will hit the structure. Thus, the design
Twisdale, 1987]. In addition, fragment-structure interaction fragment is selected from the extreme value distribution for the
phenomenon can be highly uncertain, that is, fragment ricochet lethality variable. Design charts and tables can be developed
and fragment penetration. In fact, it can be shown that for a range of cases to aid in the selection of the design
structures designed to resist fragment perforation (or spall) fragment so that the designer need not perform any
using the current CL approach can sometimes be grossly probabilistic computations. Also, the probability that one or
conservative and sometimes grossly unconservative. more fragments that are more lethal than the design fragment
will hit the target (i.e., in addition to the probability that rno
We present here a framework that provides the basis for fragments more lethal than the design fragment impact the
developing reliability-based design (RBD) charts and tables structure) can be obtained in closed form. More details on the
that can be used in the design fragment selection process. With methodology are documeted in Twidsale, Sues, and Lavelle
these charts and tables the designer need not perform complex [19921.
fragmentation or probabilistic analyses. The RBD
methodology differs from the conventional approach in that the 3. RBD PROCEDURE
structure designed using the RBD method will protect its
contents with a known level of confidence. Specification of the Using the developmental framework a step-by-step design
design fragment in the RBD approach can consider the procedure has been developed. The steps in the design
variability in each of the fragmentation variables as well as procedure are illustrated inthe flow chart of Figure I.
how these variables combine to affect the lethality (load-effect)
of a particular fragment. Most importantly, the procedure
311](https://image.slidesharecdn.com/a276170-221126090128-e06297b7/85/a276170-pdf-320-320.jpg)

![From the design charts (Figure 4 or 5) obtain the fraction of
B non-ricochet fragments, sO/4
* for a section. The design charts
of Figures 4 and 5 have been developed for ricochet angles of
30 and 45 degrees, respectively; (3) The total number of non-
ricochet fragments impacting the section is now obtained by
A multiplying the fraction W/4xr by the total number of fragments
N, (Equation 1); (4) This procedure is repeated for each section
"Z
0 and the total number of non-ricochet fragments impacting the
Ck' ýýstructure is obtained by summing over each section.
D x Step 3. Step 3 is to select a trial design fragment and
Figure 3. Weapon Structure Idealization for Computing compute its lethality. Lethality is a measure of the penetration
Number of Non-Ricochet Hits for Spherical ability of a fragment and will be a function of several fragment
Spray Pattern. variables, such as fragment weight, velocity, shape, etc. Thus,
fragment lethality is specific to the fragment penetration theory
0.1.. being used. For example, based on the penetration formula for
concrete given in the PCDM, fragment lethality would be
J|;,-ut An,.e= 30 _0-g.1- defined as:
L =W
1
0
*4
VS1. (4)
0.01 where W/f is the fragment weight (ibs) and v, is the fragment
striking velocity (fps). Nose shape factor and fragment
diameter do not appear in the equation since the standard
"t<1. 3:3 fragment shape is assumed.
_ 0.001:• t-3 Use of the PCDM formula is a simple approximation since
30 I the fragment lethality should, theoretically, include all of the
.41 variables that affect the penetration ability of the fragment,
such as the fragment rotational velocity, impact orientation, etc.
F - In fact the PCDM formula is likely very conservative (i.e.,
overpredicts penetration) for the high velocity fragments
0.0001. generated by general purpose bombs.
1 10 100
S Step 4. The fourth step is to compute the non-exceedance
Figure 4. Percentage of Non-Ricochet Fragments probability for the design fragment lethality. This is the
Impacting Structure Section for a Spherical probability that no fragments with lethality greater than the
Spray Pattern (Non-Ricochet Angle = 30 design fragment will be generated by the bomb. The non-
Degrees-spray center opposite Structure exceedance probabilities can be obtained from tabulations for
CoDrer). specific weapons. The tabulations are made by propagating the
probability distributions of the fragment variables in the
lethality equation through the lethality equation (e.g., by
Monte-Carlo Simulation). For example, using the lethality
Ro",,,, -
rA 45D or.. equation given above (Equation 4) and using the Mott
distribution for the fragment weight (as recommended in the
C'% a1 (swa-n.-,a-,) PCDM)and a truncated lognormal distribution for the fragment
E velocity, preliminary non-exceedance probabilities for a Mk82
"LL t F"•/
b (StwxI "WgNare given in Table 1'. Research is underway to improve these
"" 0.01 • . . . .
o 'preliminary cdfs and to compute lethality distribution cdfs for
other weapons.
I - lSlep 5. Step 5 is to compute the expected number of lethal
E
t fragments, m,in the total fragment population:
t-
m = N, [1-FL (1)] (5)
, where Iis the lethality of the trial design fragment and FL (I) is
the non-exceedance probability obtained from a tabulation for
0.0001 -the threat weapon (e.g., Table l).
1 10 100
S
Figure 5. Percentage of Non-Ricochet Fragments
Impacting Structure Section for a Spherical t
The results should be taken as preliminary because of lack of data to
Spray Pattern (Non-Ricochet Angle = 45 validate Equation I for high velocity fragment penetrators and because of
Degrees- spray center opposite Structure limited data to establish both the distributions of fragment weight and
Corner). velocity and tlecir correlation. These non-exccedancc probabilities werc
obtained using the Monte-Carlo Simulation method.
313](https://image.slidesharecdn.com/a276170-221126090128-e06297b7/85/a276170-pdf-322-320.jpg)


![provides an exact solution yet avoids generating very large
numbers that would result in numerical overflow.
Stirling's factorial formula is given as:
n V
=i-2 n + 1/
2
e- (A-I)
Using this formula we can rewrite
Equation (A-I) as:
In [P (L,= <I)] = In P* = (N- m + I/2) In (N - M) + (A-2)
(N- n + 1/2) In (N- n)
- (N + 1/2) In N - (N- m - n + 1/2) In (N - m - n)
and finally, the probability given by Equation A- I is given as:
P(L,, <1) = ein PO (A-3)
Stirling's formula is highly accurate for
large numbers and becomes exact as n approaches infinity.
Even for factorials as small as 10, the error is less than I
percent.
An exact FORTRAN algorithm that
avoids generating very large numbers that would result in
numerical overflow is given below. It takes advantage of the
fact that, after dividing out common multiples in the numerator
and denominator, exactly m multiplications must be performed
in both the numerator and denominator. That is, after dividing
common multiples, Equation (A-1) becomes:
P(L,,, < 1)= (N - n) (N nn- 1)(N - n - 2).-.. (N - m - n +1
{N)(N - I)(N - 2)...(N -m + I)
=(N
n)(N -
n-)(N-n-21... (N - m+ -n
N N - N-2 A4)
The algorithm for evaluating the above
equation is:
A=N-n
B=N
C = 1.0
DO I= l,m
C = C * A/B
A =A -1
B=B-I
END DO
316](https://image.slidesharecdn.com/a276170-221126090128-e06297b7/85/a276170-pdf-325-320.jpg)
![Reliability-Based Safety Factors for Ground Shock Loads in Protective Construction
R. H. Sues, J. L. Drake, and L. A. Twisdale
Applied Research Associates, Inc., 6404 Falls of Neuse Rd.. Ste. 200, Raleigh, NC 27615
Telephone: (919) 876-0018
ABSTRACT
To develop survivable buried structure designs, we must where P, = peak pressure, psi;f = coupling factor for near-
first predict ground shock loads on the structure and then apply surface detonations; C1 = loading wave velocity, fps; R =
load factors to ensure an appropriate margin of safety. This distance to the explosion,ft; W = charge weight, lbs. V, = peak
paper presents such tabulated load factors as a function of particle velocity, fps; p, = mass density, lb-s2/ft4 n
design reliability (survivability) - the greater the design artic efvlcit; pdd
reliability the greater the load factor. Detail of the attenuation coefficient; and
methodology used to derive the load factors and for use in
making site-specific reliability-based predictions are also C, = max •kc +SV 0
given; along with a presentation of the ground shock database Ic (3)
used in the research.
where k = 0.06 for clay; k = 1.0 for sand; c is the seismic
1. INTRODUCTION velocity; S - I/ro for partially saturated soils; and S = 0.0 for
Ground shock loading is a highly variable conventional fully saturated soils (E, = irreversible volumetric compaction
weapons effect. This variability is due to the complex behind the wave front).
multiphase composition of geologic materials and their
inherent spatial variability. To develop survivable buried 3. RELIABILITY-BASED DESIGN PROCEDURE
structure designs, we must first characterize the uncertainty in
predicting free-field ground shock and then develop load The magnitude of the load factors, A, for reliability-based
factors to ensure an appropriate margin of safety. In this paper prediction of free-field ground shock depends on the variability
we analyze the sources of uncertainty in predicting ground in the geologic material at the site and the detail to which the
shock from a conventional weapons explosion and present site has been characterized. Thus, the load factors are site
reliability-based load factors for free field velocity and stress specific and should, strictly speaking, be computed on a case-
that can be used in protective design. The load factors have by-case basis. We present in the following a reliability-based
been derived for use with the ground shock prediction methods model that can be used to make site-specific predictions.
given in the Air Force Protective Construction Design Manual However, because most protective design situations fall in a
(Drake, et. al., 19891, hereinafter refered to as the PCDM. limited range of cases we are able to provide, at the conclusion,
generic load factors for typical cases. These generic factors are
To characterize ground shock prediction uncertainty, it is applicable for preliminary design. For final design of mission
important to consider and quantify both the model prediction critical structures we recommend that the site specific
error and the model parameter (i.e., geologic descriptors) prediction model be used.
uncertainties. Model prediction error has both a systematic
component and a random component. Model parameter The site-specific reliability-based peak free-field velocity
uncertainties have both prediction error and random and stress predictions are obtained, respectively as:
components. Uncertainties are quantified by analysis of
ground shock data. V, --
exp[E[In V o]
+ 0'(R ) , V.]
2. PCDM DETERMINISTIC GROUND SHOCK
PREDICTION MODEL Po, = exp[E [in Po.] + 01 (R)xOin PJ (5)
The PCDM prediction model for peak free-field velocity
and stress from bombs detonating on or within the soil near a where R is the desired reliability level, El I denotes expected
structure is given as (PCDMEquations (V-11) and (V- 10)): value (mean), a denotes standard deviation, and (Dis the
V, f " 160 • R.---.A" standard normal function. Values for the standard normal
WW
/3 function can be obtained from Table 1. Equations 4 and 5
assume that the free-field velocity and stress are lognormally
distributed. This is a good assumption since, as we will show
P"I- =f p. C1 . 160 . R below, the model prediction error is lognormally distributed
144 144 W (2) and dominates the total prediction uncertainty.
317](https://image.slidesharecdn.com/a276170-221126090128-e06297b7/85/a276170-pdf-326-320.jpg)
![TABLE 1. STANDARD NORMAL FUNCTION FOR by the distribution of the natura! log of the prediction enror
USE IN SITE-SPECIFIC FREE-FIELD ratio. The prediction error ratio, 4, is evaluated for each data
GROUND SHOCK RELIABILITY point as the ratio of the observed ground shock (velocity or
CALCULATION. stress) to the value given by the regression line. For linear
regression in the log-log space this is proportional to the
R 0" (R) regression residual. Table 2 shows the standard deviation of
the natural log of 4 for each soil type, for both the velocity and
0.05 -1.65
0.10 -1.28 stress data. The expected value of the natural log of 4 (not
shown) is 0 for all cases because the regression line is an
0.25 -0.67 unbiased model. The table also shows the results of the
0.50 0.00 hypothesis test for lognormality of
0.75 0.67
0.90 1.28 TABLE 2. VARIABILITY OF LOG-PREDICTION
0.95 1.65 ERROR RATIO (In [4J).a
The statistics in Equations 4 and 5 are the mean and Free-Field Velocity Free-Field Stress
standard deviation of the natural logarithm of the free-field
velocity and stress, respectively and are obtained as: Soil Tpe St. Devi. HypoRhesas St Dev Hypothesis:
o• Reject al, ReJect
E [In VoJ = E I[In + In 160 - E[n] In (R/WI
1 3
) (6) a. Dense Wet 0.32 No 0.48 No
Sand
- my=
o+[in (RwII3)I2
02, (7) b. Loose Wet 0.31 Marg. 0.28 No
Sand
c. Sandy Clay 0.33 No 0.45 No
E [In Po] = E [In p.1 + E [In C,I + E [iIn VJ - In 144 (8) &Loess
d. Dry Sand 0.17 No 0.36 No
0ý p.= c2n p. + 2 C,+
On
V. + 2 COV[lnpo, In CI ] (9) e. WetClay 0.08 No 0.39 No
f. Sand 0.15 No 0.04 No
(Varied
where COV[ ] denotes covariance, 4 is the model prediction Wet to
error random variable, and all other symbols are as defined for Dry)
Equations (1) and (2) earlier. The scaled range term R/Wh'3 is g. Wet Loess 0.32 No
treated as a deterministic quantity (i.e., specified threat), h. Shaley- -0.31 No
however it is straightforward to extend the approach to treat Clay, Clay-
this quantity probabilistically. Shale II _ I___
a In(ý) =Natural logarithm ofprediction error ratio.
4. MODEL PREDICTION ERROR = Observed Ground Shock
The database used for quantifying the model prediction Regression Model Prediction
error is a collection of both published and unpublished free- Since peak free-field stress is simply po x CI times free-
field velocity and stress measurements [Drake, et al., 1989!. field velocity, we use the free-field velocity data to quantify the
The data are shown in the plots of Figures I and 2. The filveoiyweuetere-edveotyaatouniyth
geologic conditions and shot names are shown on each plot. random component of the model prediction error. The larger
data scatter for free-field stress is due to greater sensitivity of
The model prediction error can have both a systematic and free-field stress to spatial variation of the geologic parameters
a random component. The systematic component is the bias in Po and Cl. Since this additional uncertainty is highly site
the model (i.e., a systematic under or over prediction at some specific, we will treat it as a parameter uncertainty.
range) and the random component is the unexplained variation
of measured ground shock about the prediction model (i.e., the There are three main contributors to the free-field velocity
scatter of the data). Since the prediction model is linear with model random prediction error (i.e., factors that are not
scaled range in the log-log space, the random component of the accounted for in the model): (I) bomb-to-bomb variability
model prediction error is the variability (or scatter) of the data (i.e., repeatability of experiments at a single site; (2) site-to-site
about the linear regression in the log-log space. This is pure differences for sites that fall into a single category (e.g., all dry
error that cannot be accounted for by systematic adjustment to sand sites are not the same); and (3) spatial variability of
the model. The systematic error is the difference in the velocity attenuation within a single soil type.' Not all sources
prediction and the linear regression. of uncertainty are adequately represented for each of the soil
types. For example, for case f in Table 2 we have only one
a. Random Component shot, so that bomb-to-bomb and site-to-site variability is not
represented. Hence, we estimate the random component of the
To quantify the random component of the model model prediction using only those cases wherein we have
prediction error, the data are grouped by soil type (i.e., groups
for which the same model parameters are used) and analyzed
by linear regression in log-log space. The data and the
regression lines are shown in Figures I and 2 for free-field 'Random measurement error can also add to the data scatter, however, we
velocity and free-field stress, respectively. The random have not attempted to remove the measurement error component in this
component of the model prediction error is now characterized analysis.
318](https://image.slidesharecdn.com/a276170-221126090128-e06297b7/85/a276170-pdf-327-320.jpg)