Download to read offline
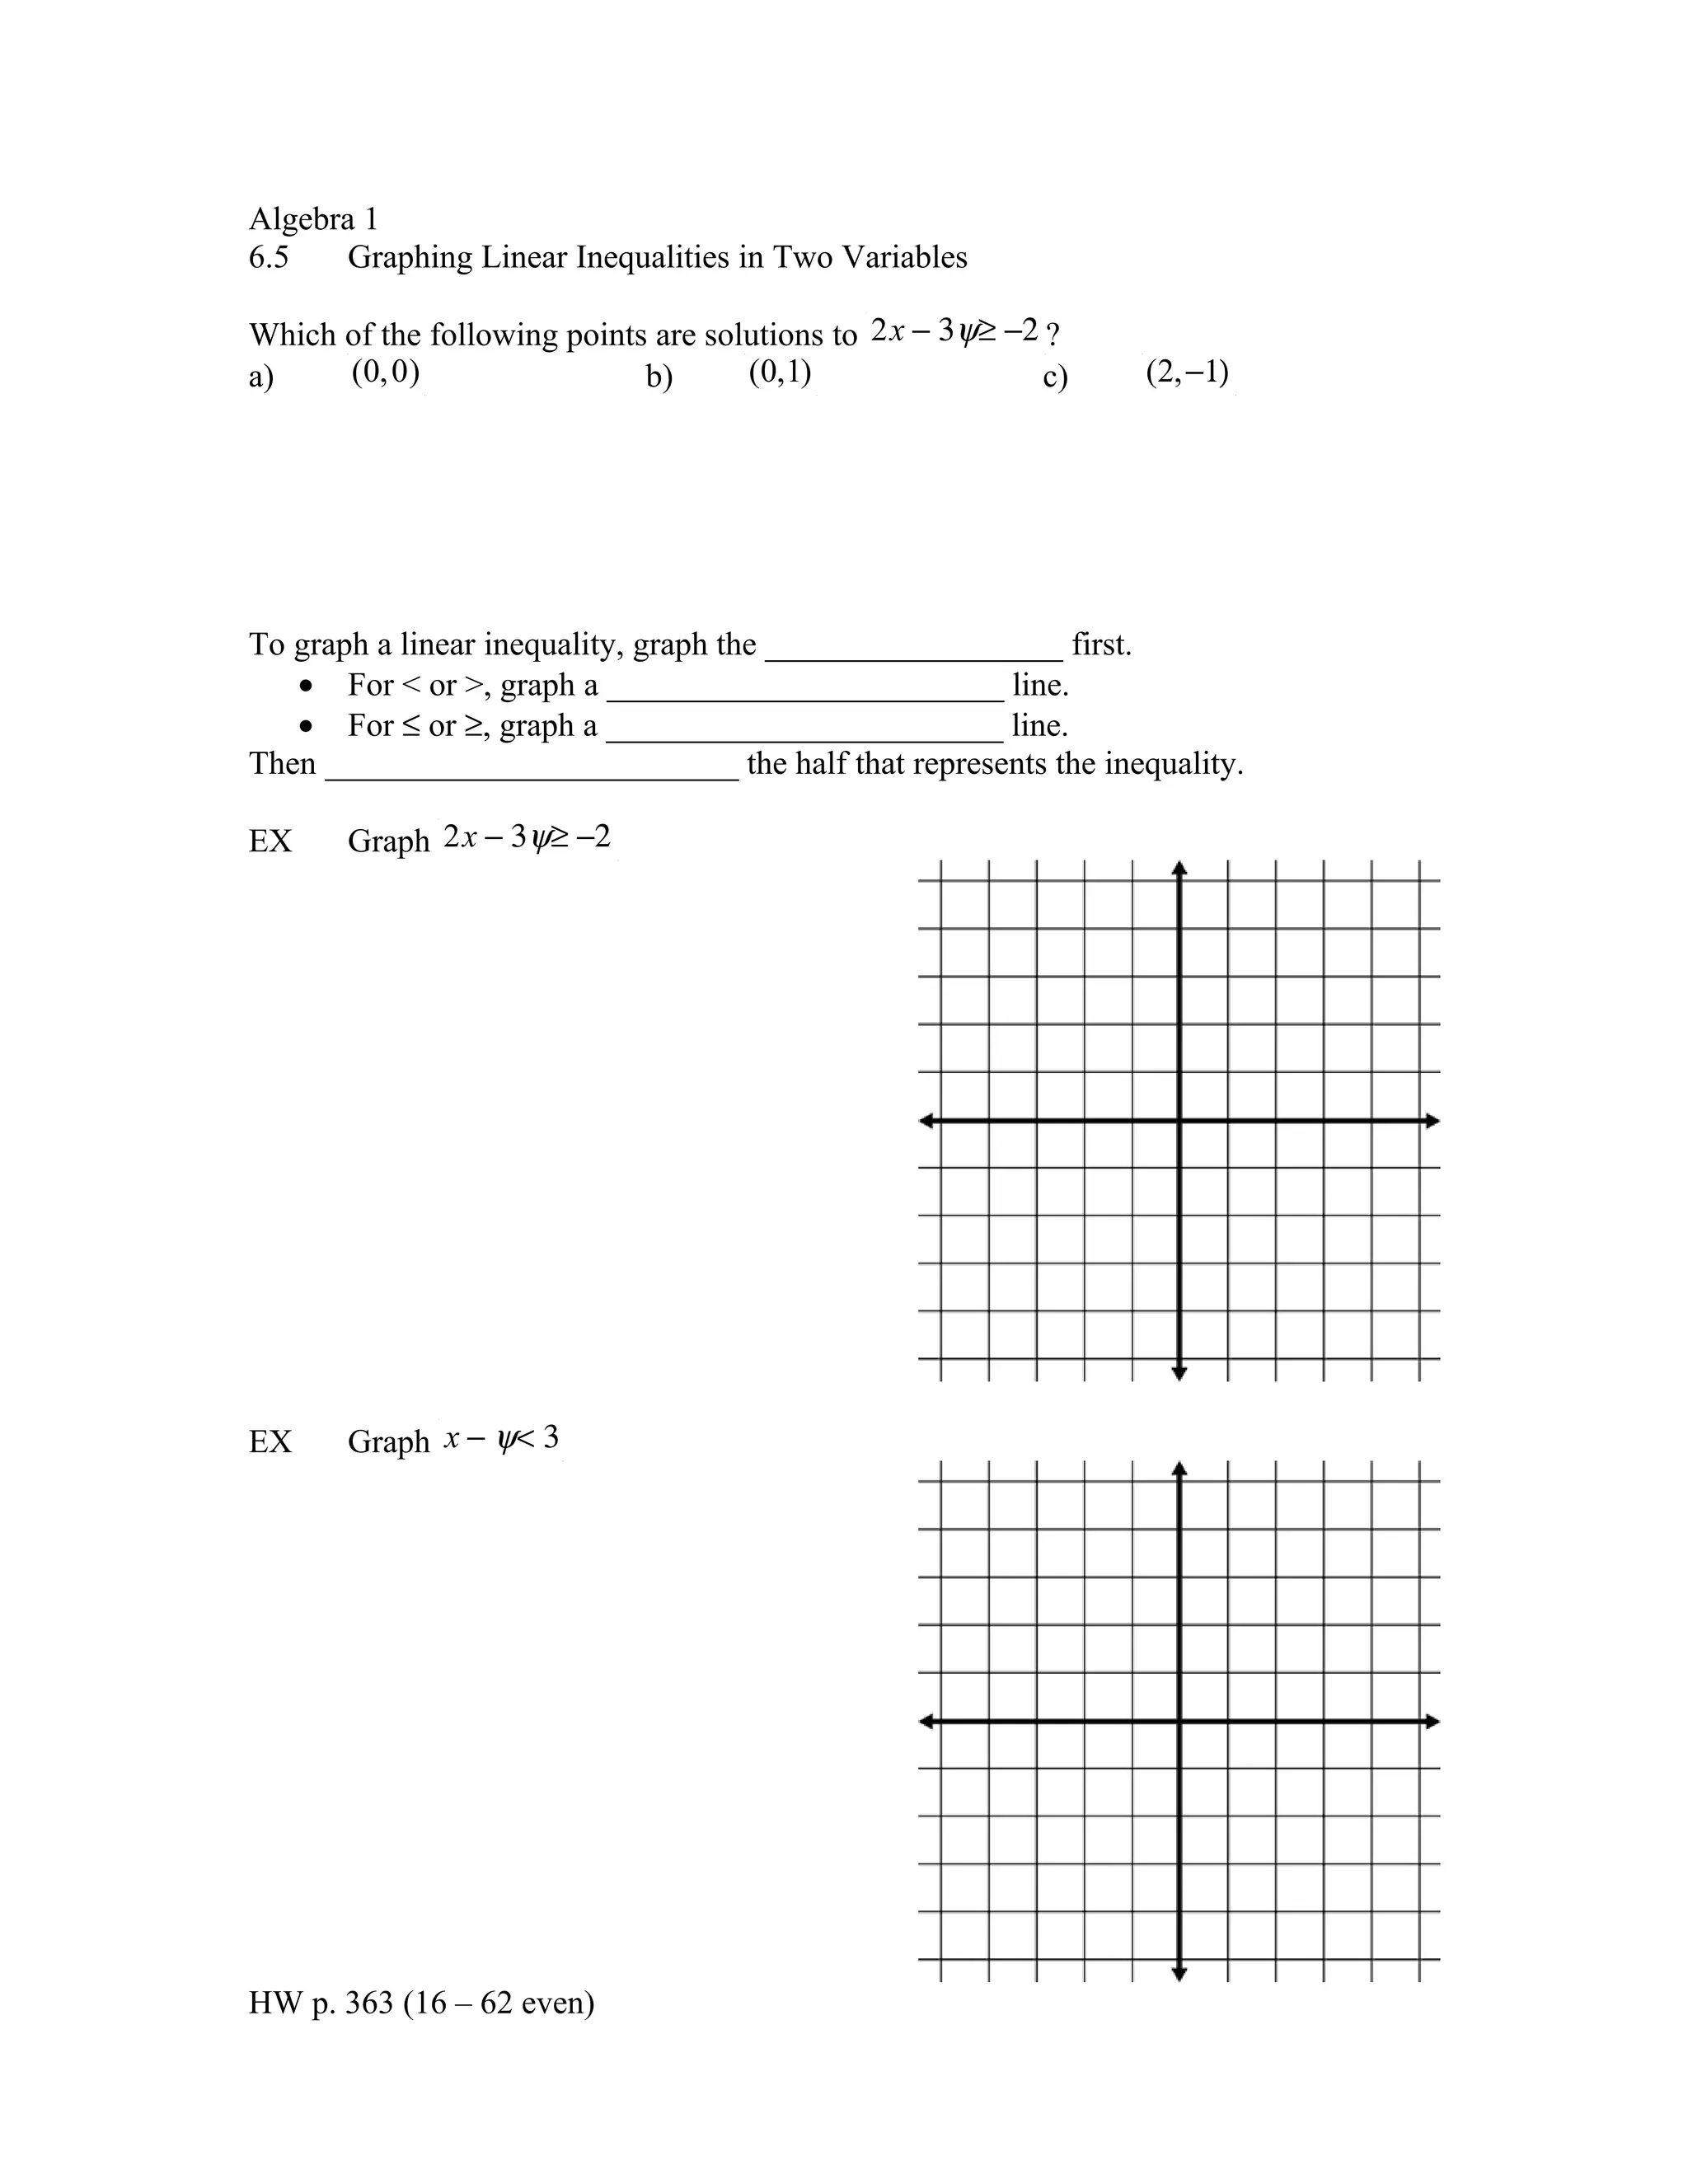
To graph a linear inequality in two variables: 1) Graph the corresponding linear equation first as a solid line. 2) For < or >, shade the half-plane on one side of the line. For ≤ or ≥, shade along the line and on one side. 3) Check the given points to see which satisfy the inequality - for the example 2x - 3y ≥ -2, only point (c) satisfies the inequality.