A Possible Proof for the Santa Fe Institute Conjecture
•
0 likes•430 views

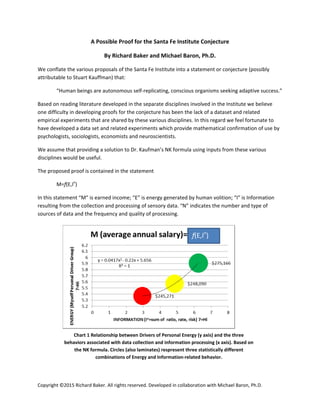
This document proposes a proof for the Santa Fe Institute conjecture that human beings are autonomous, self-replicating, conscious organisms seeking adaptive success. It presents data showing that earned income (M) can be expressed as a function of personal energy (E) and information processing (In). The data identifies three groups ("laminates") that differ in their combinations of E and In and demonstrate different levels of adaptive success over time. It argues this provides empirical evidence that could be useful across multiple disciplines in analyzing human behavior and adaptation.

Recommended
More Related Content
Similar to A Possible Proof for the Santa Fe Institute Conjecture
Similar to A Possible Proof for the Santa Fe Institute Conjecture (20)
A Possible Proof for the Santa Fe Institute Conjecture
- 2. Copyright ©2015 Richard Baker. All rights reserved. Developed in collaboration with Michael Baron, Ph.D. The rate of difference in behavior among the three laminates (Red, Yellow and Green) is equal to that rate of motion required in fluid dynamics to cause molecules in a fluid to separate into layers, thus creating a laminate structure in a fluid. We apply a formula (“NK formula”) developed by Kauffman to our formulation of In to demonstrate. ELEMENTS OF In RED Laminate YELLOW Laminate GREEN Laminate Ratio referential and abstract information to Iconic data .20 .30 .65 Rate 1.75 2.5 2.75 Risk 1.0 2.0 2.75 Total Horizontal axis 2.95 4.85 6.25 Vertical Axis Personal Driver Group “Myself” 5.37 5.57 5.91 Laminates as Mathematical and Social Groups The differences in behavior resulting from the differences in motives (Personal Drivers) cause the Laminates to function as Groups. The requirements to be in a mathematical Group are similar to the requirements to be in a social class. That is, one must adhere to the beliefs (motives) and mores of the group/Class in order to maintain membership. In this regard the original research collected data regarding preferences in those categories of expenditure (e.g., apparel, home furnishings, vacations and automobiles) that sociologists (such as Bourdieu) associate with indicators or social status. Laminates and Language Controlled experiments in email messaging showed a statistically different response rate among Laminates in the wording they would “open” and respond to. These differences in electronic messaging are consistent in the differences in print media preferences among Groups. For example members of the Green Laminate/Group are more likely to prefer content with more complex sentence structure and more varied vocabulary.