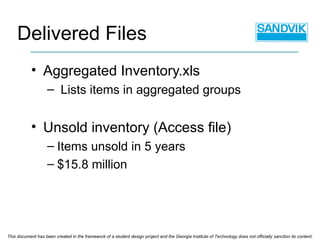
This document has been created in the framework of a student design project and the Georgia Institute of Technology does not officially sanction its content. Warehouse Network Design  Saila Balasubramanian Ryan Bechtel Linh Nguyen Rigan Patel Brad Sims Brian Turner Advisor:  Dr. Marc Goetschalckx Sponsor Contact:   Mr. Stan Boddy Aftermarket Processes  Manager – USA and Canada [email_address] (404) 589-3861 December 5, 2008
Overview Inventory cost problem Network redesign Data aggregation/analysis Model formulation Results Value Deliverables This document has been created in the framework of a student design project and the Georgia Institute of Technology does not officially sanction its content.
Senior Design This document has been created in the framework of a student design project and the Georgia Institute of Technology does not officially sanction its content. Semester-long Georgia Tech course Requirement to graduate Find client company Identify problem area(s) Design solution Using ISyE methodology About 1,000 hours of work, equivalent value Provide client with helpful product
$60 million of inventory (1.2 million items) Built through acquisitions Obsolete inventory Focus areas include Inventory management Low demand items Stock levels Problem Description This document has been created in the framework of a student design project and the Georgia Institute of Technology does not officially sanction its content.
Excess stock = higher holding costs Misallocated inventory  Proximity of inventory to customer Strategic stock: 18,500 SKUs 25% of total inventory value Average of 14,000 sales/yr for past 5 years Problem Description This document has been created in the framework of a student design project and the Georgia Institute of Technology does not officially sanction its content.
Problem Description This document has been created in the framework of a student design project and the Georgia Institute of Technology does not officially sanction its content.
This document has been created in the framework of a student design project and the Georgia Institute of Technology does not officially sanction its content.
Objectives This document has been created in the framework of a student design project and the Georgia Institute of Technology does not officially sanction its content. Minimize annual logistics cost Holding costs Transportation costs Improve customer service level Currently 62% Optimal stock quantities
Data collection Sandvik database Weight, price, demand, lead times Eliminate incomplete data Transportation costs Calculated shipping distances Estimated rate of $0.28 ton-mile Aggregation Data This document has been created in the framework of a student design project and the Georgia Institute of Technology does not officially sanction its content.
Started with 49,000 SKUs ($60 Million) 9,500 SKUs ($15.1 Million)  <5 sales/yr Three facets of aggregation Item Aggregation This document has been created in the framework of a student design project and the Georgia Institute of Technology does not officially sanction its content.
By price: Created 6 groups by log scale $10-$100, $100-$500, $500-$1,000, $1,000-$5,000, $5,000-$10,000, $10,000+ By weight: Created 4 groups by log scale 0-1, 1-10, 10-100, 100+ Kg Item Aggregation This document has been created in the framework of a student design project and the Georgia Institute of Technology does not officially sanction its content.
Grouped by number of items sold over past 5 years Increases model accuracy 1 to 2 same difference as 20 to 21, but huge difference in ratio Groups: 1-3, 4-8, 9-15,16-25 Aggregation by Demand This document has been created in the framework of a student design project and the Georgia Institute of Technology does not officially sanction its content.
Active customers 1,200 in region 2,650 active shipping locations Aggregation By location Zip-3 1,000 in US alone   Zip-2 187 aggregated customer groups Customer Aggregation This document has been created in the framework of a student design project and the Georgia Institute of Technology does not officially sanction its content.
This document has been created in the framework of a student design project and the Georgia Institute of Technology does not officially sanction its content.
96 aggregated item groups 22 blank 141: $10-$100, 100+ Kg, 1-3 demand  187 aggregated customers 90 in Canada 97 in the US Average 10 active locations per region Aggregation Summary This document has been created in the framework of a student design project and the Georgia Institute of Technology does not officially sanction its content.
Items sold up to 25 times in last 5 years Used sales history, customers, items Average order quantity/customer/item Item 111 ordered by customer 01 on average 0.2 times/yr Demand Calculation This document has been created in the framework of a student design project and the Georgia Institute of Technology does not officially sanction its content. Row Labels 111 112 113 114 121 122 123 01 0.2 0.222 0.72 0.2 0 0 0 02 0.2 0.267 0.8 0.22 0.2 0 0.2 03 0.257 0.229 0.257 0.291 0 0 0 04 0 0.2 0.2 0.2 0 0 0
Linear mathematical programming model Objective function   Minimize costs (holding, transportation) Decision variables Stock levels Demand allocation Constraints Demand  Customer service level Model Design This document has been created in the framework of a student design project and the Georgia Institute of Technology does not officially sanction its content.
One to one replenishment: (S-1,S) Demand follows Poisson distribution Slow occurring demand Demand met by multiple warehouses Predetermined service levels Know warehouse delivery capabilities Any unsatisfied demand is lost sales Assumptions This document has been created in the framework of a student design project and the Georgia Institute of Technology does not officially sanction its content.
Minimize Σ [(7%)(# of Items)(Item Value) (Stock Level) ] # of items in each item group Average value of each item group Stock level decision variable Σ  [(# of Customers)(# of Items)(Shipping Cost) (% Demand Allocated) ] # of Customers in each customer zone # of items in each item group Cost to ship from warehouse to customer Demand allocation decision variable  Objective function This document has been created in the framework of a student design project and the Georgia Institute of Technology does not officially sanction its content.
Service level per customer ≥  α All demand must be met Stock level can only take one value Constraints This document has been created in the framework of a student design project and the Georgia Institute of Technology does not officially sanction its content.
Total Cost: $2,458,261  Holding Cost: $2,109,450  Transportation Cost: $348,811  Results for  α =0.70  This document has been created in the framework of a student design project and the Georgia Institute of Technology does not officially sanction its content.   111 112 113 114 121 Brier Hill, PA 2         Olyphant, PA   1 1 1   Narvon, PA         1 Chateauguay, QC           Val d'Or, QC 2         Lively (Sudbury), ON           Timmins, ON           Yellowknife, NT           Creighton, SK           Laval, QC   1 1 1 2
This document has been created in the framework of a student design project and the Georgia Institute of Technology does not officially sanction its content. This document has been created in the framework of a student design project and the Georgia Institute of Technology does not officially sanction its content.
Results for  α =0.95  This document has been created in the framework of a student design project and the Georgia Institute of Technology does not officially sanction its content. Total Cost: $3,328,713 Holding Cost: $2,831,340  Transportation Cost: $497,373    111 112 113 114 121 Brier Hill, PA 3 1 1 1   Olyphant, PA     1     Narvon, PA         2 Chateauguay, QC           Val d'Or, QC 3         Lively (Sudbury), ON           Timmins, ON           Yellowknife, NT           Creighton, SK           Laval, QC   1 2 2 2
This document has been created in the framework of a student design project and the Georgia Institute of Technology does not officially sanction its content.
Sensitivity Analysis This document has been created in the framework of a student design project and the Georgia Institute of Technology does not officially sanction its content.
$15.8 million dollars of obsolete items Elimination recommended Reduced holding costs Possible salvage value Incomplete data files Weights/composition Inconsistent policies Salvage Value This document has been created in the framework of a student design project and the Georgia Institute of Technology does not officially sanction its content.
Current holding cost  7% of $30.9 million $2.16 million Estimated model holding cost $1.91 million Total savings $250,000 per year Value This document has been created in the framework of a student design project and the Georgia Institute of Technology does not officially sanction its content.
Calculated savings Stock levels Ordering policy Cost savings vs. service levels Sensitivity analysis Future objective changes Recommendation Report This document has been created in the framework of a student design project and the Georgia Institute of Technology does not officially sanction its content.
Model results.xls Service levels from .4 – 1.0, increments of .05 Sample for  α =.95 Delivered Files This document has been created in the framework of a student design project and the Georgia Institute of Technology does not officially sanction its content.   111 112 113 114 121 Brier Hill, PA 3 1 1 1   Olyphant, PA     1     Narvon, PA         2 Chateauguay, QC           Val d'Or, QC 3         Lively (Sudbury), ON           Timmins, ON           Yellowknife, NT           Creighton, SK           Laval, QC   1 2 2 2
Aggregated Inventory.xls Lists items in aggregated groups Unsold inventory (Access file) Items unsold in 5 years $15.8 million Delivered Files This document has been created in the framework of a student design project and the Georgia Institute of Technology does not officially sanction its content.
Found problem area Determined methodology Data collection and analysis Removed unnecessary data Customer and item aggregation Model formulation Results Sensitivity analysis Calculated value Summary This document has been created in the framework of a student design project and the Georgia Institute of Technology does not officially sanction its content.
Questions? This document has been created in the framework of a student design project and the Georgia Institute of Technology does not officially sanction its content.

Sandvik Mining And Construction Final Presentation

  • 1.
    This document hasbeen created in the framework of a student design project and the Georgia Institute of Technology does not officially sanction its content. Warehouse Network Design Saila Balasubramanian Ryan Bechtel Linh Nguyen Rigan Patel Brad Sims Brian Turner Advisor: Dr. Marc Goetschalckx Sponsor Contact: Mr. Stan Boddy Aftermarket Processes Manager – USA and Canada [email_address] (404) 589-3861 December 5, 2008
  • 2.
    Overview Inventory costproblem Network redesign Data aggregation/analysis Model formulation Results Value Deliverables This document has been created in the framework of a student design project and the Georgia Institute of Technology does not officially sanction its content.
  • 3.
    Senior Design Thisdocument has been created in the framework of a student design project and the Georgia Institute of Technology does not officially sanction its content. Semester-long Georgia Tech course Requirement to graduate Find client company Identify problem area(s) Design solution Using ISyE methodology About 1,000 hours of work, equivalent value Provide client with helpful product
  • 4.
    $60 million ofinventory (1.2 million items) Built through acquisitions Obsolete inventory Focus areas include Inventory management Low demand items Stock levels Problem Description This document has been created in the framework of a student design project and the Georgia Institute of Technology does not officially sanction its content.
  • 5.
    Excess stock =higher holding costs Misallocated inventory Proximity of inventory to customer Strategic stock: 18,500 SKUs 25% of total inventory value Average of 14,000 sales/yr for past 5 years Problem Description This document has been created in the framework of a student design project and the Georgia Institute of Technology does not officially sanction its content.
  • 6.
    Problem Description Thisdocument has been created in the framework of a student design project and the Georgia Institute of Technology does not officially sanction its content.
  • 7.
    This document hasbeen created in the framework of a student design project and the Georgia Institute of Technology does not officially sanction its content.
  • 8.
    Objectives This documenthas been created in the framework of a student design project and the Georgia Institute of Technology does not officially sanction its content. Minimize annual logistics cost Holding costs Transportation costs Improve customer service level Currently 62% Optimal stock quantities
  • 9.
    Data collection Sandvikdatabase Weight, price, demand, lead times Eliminate incomplete data Transportation costs Calculated shipping distances Estimated rate of $0.28 ton-mile Aggregation Data This document has been created in the framework of a student design project and the Georgia Institute of Technology does not officially sanction its content.
  • 10.
    Started with 49,000SKUs ($60 Million) 9,500 SKUs ($15.1 Million) <5 sales/yr Three facets of aggregation Item Aggregation This document has been created in the framework of a student design project and the Georgia Institute of Technology does not officially sanction its content.
  • 11.
    By price: Created6 groups by log scale $10-$100, $100-$500, $500-$1,000, $1,000-$5,000, $5,000-$10,000, $10,000+ By weight: Created 4 groups by log scale 0-1, 1-10, 10-100, 100+ Kg Item Aggregation This document has been created in the framework of a student design project and the Georgia Institute of Technology does not officially sanction its content.
  • 12.
    Grouped by numberof items sold over past 5 years Increases model accuracy 1 to 2 same difference as 20 to 21, but huge difference in ratio Groups: 1-3, 4-8, 9-15,16-25 Aggregation by Demand This document has been created in the framework of a student design project and the Georgia Institute of Technology does not officially sanction its content.
  • 13.
    Active customers 1,200in region 2,650 active shipping locations Aggregation By location Zip-3 1,000 in US alone Zip-2 187 aggregated customer groups Customer Aggregation This document has been created in the framework of a student design project and the Georgia Institute of Technology does not officially sanction its content.
  • 14.
    This document hasbeen created in the framework of a student design project and the Georgia Institute of Technology does not officially sanction its content.
  • 15.
    This document hasbeen created in the framework of a student design project and the Georgia Institute of Technology does not officially sanction its content.
  • 16.
    96 aggregated itemgroups 22 blank 141: $10-$100, 100+ Kg, 1-3 demand 187 aggregated customers 90 in Canada 97 in the US Average 10 active locations per region Aggregation Summary This document has been created in the framework of a student design project and the Georgia Institute of Technology does not officially sanction its content.
  • 17.
    Items sold upto 25 times in last 5 years Used sales history, customers, items Average order quantity/customer/item Item 111 ordered by customer 01 on average 0.2 times/yr Demand Calculation This document has been created in the framework of a student design project and the Georgia Institute of Technology does not officially sanction its content. Row Labels 111 112 113 114 121 122 123 01 0.2 0.222 0.72 0.2 0 0 0 02 0.2 0.267 0.8 0.22 0.2 0 0.2 03 0.257 0.229 0.257 0.291 0 0 0 04 0 0.2 0.2 0.2 0 0 0
  • 18.
    Linear mathematical programmingmodel Objective function Minimize costs (holding, transportation) Decision variables Stock levels Demand allocation Constraints Demand Customer service level Model Design This document has been created in the framework of a student design project and the Georgia Institute of Technology does not officially sanction its content.
  • 19.
    One to onereplenishment: (S-1,S) Demand follows Poisson distribution Slow occurring demand Demand met by multiple warehouses Predetermined service levels Know warehouse delivery capabilities Any unsatisfied demand is lost sales Assumptions This document has been created in the framework of a student design project and the Georgia Institute of Technology does not officially sanction its content.
  • 20.
    Minimize Σ [(7%)(#of Items)(Item Value) (Stock Level) ] # of items in each item group Average value of each item group Stock level decision variable Σ [(# of Customers)(# of Items)(Shipping Cost) (% Demand Allocated) ] # of Customers in each customer zone # of items in each item group Cost to ship from warehouse to customer Demand allocation decision variable Objective function This document has been created in the framework of a student design project and the Georgia Institute of Technology does not officially sanction its content.
  • 21.
    Service level percustomer ≥ α All demand must be met Stock level can only take one value Constraints This document has been created in the framework of a student design project and the Georgia Institute of Technology does not officially sanction its content.
  • 22.
    Total Cost: $2,458,261 Holding Cost: $2,109,450 Transportation Cost: $348,811 Results for α =0.70 This document has been created in the framework of a student design project and the Georgia Institute of Technology does not officially sanction its content.   111 112 113 114 121 Brier Hill, PA 2         Olyphant, PA   1 1 1   Narvon, PA         1 Chateauguay, QC           Val d'Or, QC 2         Lively (Sudbury), ON           Timmins, ON           Yellowknife, NT           Creighton, SK           Laval, QC   1 1 1 2
  • 23.
    This document hasbeen created in the framework of a student design project and the Georgia Institute of Technology does not officially sanction its content. This document has been created in the framework of a student design project and the Georgia Institute of Technology does not officially sanction its content.
  • 24.
    Results for α =0.95 This document has been created in the framework of a student design project and the Georgia Institute of Technology does not officially sanction its content. Total Cost: $3,328,713 Holding Cost: $2,831,340 Transportation Cost: $497,373   111 112 113 114 121 Brier Hill, PA 3 1 1 1   Olyphant, PA     1     Narvon, PA         2 Chateauguay, QC           Val d'Or, QC 3         Lively (Sudbury), ON           Timmins, ON           Yellowknife, NT           Creighton, SK           Laval, QC   1 2 2 2
  • 25.
    This document hasbeen created in the framework of a student design project and the Georgia Institute of Technology does not officially sanction its content.
  • 26.
    Sensitivity Analysis Thisdocument has been created in the framework of a student design project and the Georgia Institute of Technology does not officially sanction its content.
  • 27.
    $15.8 million dollarsof obsolete items Elimination recommended Reduced holding costs Possible salvage value Incomplete data files Weights/composition Inconsistent policies Salvage Value This document has been created in the framework of a student design project and the Georgia Institute of Technology does not officially sanction its content.
  • 28.
    Current holding cost 7% of $30.9 million $2.16 million Estimated model holding cost $1.91 million Total savings $250,000 per year Value This document has been created in the framework of a student design project and the Georgia Institute of Technology does not officially sanction its content.
  • 29.
    Calculated savings Stocklevels Ordering policy Cost savings vs. service levels Sensitivity analysis Future objective changes Recommendation Report This document has been created in the framework of a student design project and the Georgia Institute of Technology does not officially sanction its content.
  • 30.
    Model results.xls Servicelevels from .4 – 1.0, increments of .05 Sample for α =.95 Delivered Files This document has been created in the framework of a student design project and the Georgia Institute of Technology does not officially sanction its content.   111 112 113 114 121 Brier Hill, PA 3 1 1 1   Olyphant, PA     1     Narvon, PA         2 Chateauguay, QC           Val d'Or, QC 3         Lively (Sudbury), ON           Timmins, ON           Yellowknife, NT           Creighton, SK           Laval, QC   1 2 2 2
  • 31.
    Aggregated Inventory.xls Listsitems in aggregated groups Unsold inventory (Access file) Items unsold in 5 years $15.8 million Delivered Files This document has been created in the framework of a student design project and the Georgia Institute of Technology does not officially sanction its content.
  • 32.
    Found problem areaDetermined methodology Data collection and analysis Removed unnecessary data Customer and item aggregation Model formulation Results Sensitivity analysis Calculated value Summary This document has been created in the framework of a student design project and the Georgia Institute of Technology does not officially sanction its content.
  • 33.
    Questions? This documenthas been created in the framework of a student design project and the Georgia Institute of Technology does not officially sanction its content.