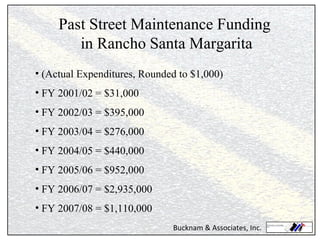
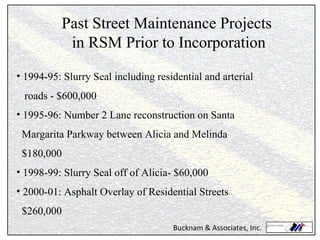
City of Rancho Santa Margarita PAVEMENT MANAGEMENT OVERVIEW October 22, 2008
Includes: Pavement Curb and Gutter Sidewalks Storm Drains Striping Does not Include: Trees Irrigation Utilities City’s Most Valuable Asset City of RSM Street System
Value of Pavement Alone (Replacement Cost) =  $120 million dollars. 18,000,000 x $6.50/sf Value of Entire Street System (Replacement Cost) exceeds  $200 million dollars. GASB 34 -  Requires Public Agencies to Report on the value of Infrastructure Assets What is it worth?
Types of Street Pavement Portland Cement Concrete  Asphalt Concrete (Majority of RSM pavement) Brick Pavers
Common Sources of Funding  For Street Maintenance Gas Tax Revenue ($850,000 in FY 08/09) Measure M Turnback ($551,554 in FY 08/09) Proposition 42 (County) ($166,840 in FY 08/09) Measure M GMA ($50,000 in FY 08/09) Total in FY 2008/09 = $__________
Funding Timelines For Street Maintenance Revenue Gas Tax Revenue (__ Years) Measure M Turnback (__ Years) Proposition 42 (County) (__ Years) Measure M GMA (__ Years)
Less Common Sources of Funding  For Street Maintenance Proposition 1B (State) – $799,000 in FY 07/08 Proposition 1B (County)  Measure M – AHRP – Overlays Only Assessment Districts Federal Grants (CDBG) – Overlays Only General Funds
Past Street Maintenance Funding in Rancho Santa Margarita (Actual Expenditures, Rounded to $1,000) FY 2001/02 = $31,000 FY 2002/03 = $395,000 FY 2003/04 = $276,000 FY 2004/05 = $440,000 FY 2005/06 = $952,000 FY 2006/07 = $2,935,000 FY 2007/08 = $1,110,000
Past Street Maintenance Projects in RSM Prior to Incorporation 1994-95: Slurry Seal including residential and arterial roads - $600,000 1995-96: Number 2 Lane reconstruction on Santa Margarita Parkway between Alicia and Melinda   $180,000 1998-99: Slurry Seal off of Alicia- $60,000 2000-01: Asphalt Overlay of Residential Streets   $260,000
Combination of Gas Tax, Measure M Turnback, and Proposition 42 7 years – Consistent with CIP Problems: Measure M Turnback is a sales tax, which is now decreasing.  Gas Tax revenues may decrease with more fuel efficient cars. Future Road Maintenance Revenues
A Tool to Answer Questions: What do I have? What condition is it in? What do I need to repair it? How much money do I need? When should I spend it? What if? What is a Pavement Management Program?
Advantages Less Expensive Internal Oversight (More Control) Disadvantages More Staff Need for Training Difficult to Focus on this function unless only function Less Qualified Expertise Potential Quality Control Issues May Need Capital Expenses In House PMP ?
Pavement Management Program Steps to Implementation of a PMP: Step 1:   Assessment of Existing Pavement Network Step 2:   Work History Updates Step 3: Pavement Inspections Step 4:   Data Input Step 5:   QA/QC Step 6:   Budgetary Analysis and Reporting Step 7:   GIS and Mapping
2008 Update of RSM PMP Assess previous City maintenance efforts and   incorporate data into the City’s MicroPAVER database Perform pavement condition surveys to generate a   Pavement Condition Index (PCI) for each pavement   section Develop Capital Improvement Program budget and   schedule based on maintenance zones, available   funding, current conditions and maintenance practices Submit Citywide CIP report to OCTA for Measure M   compliancy Link all MicroPAVER pavement data to the City’s GIS
MicroPAVER Currently being used by over 600 cities, counties   and airports This includes over 200 cities within California 23 cities in LA County; 22 cities in Orange County MicroPAVER’s PCI methodology is the only pavement   rating methodology recognized for rating road pavements MicroPAVER allows for the collection of 19 AC and   19 PCC distress types Three levels of severity can be collected for each   distress type Recently selected by OCTA for countywide use
Pavement Condition Index (PCI) The PCI is a condition rating that ranges from  0 to 100 Weighted average PCI = pavement section PCI * by its   area / by the total square footage of the specific   network or pavement area.
PCI = 100 Action    Do Nothing PCI = 100 Action    Do Nothing
PCI = 70 Action    Surface Treatment (Slurry) PCI = 70 Action    Surface Treatment (Slurry)
PCI = 50 Action    Structural Improvement (Overlay) PCI = 50 Action    Overlay
PCI < 20 Action    Reconstruction PCI < 20 Action    Reconstruction
City PMP / Network The City of RSM PMP includes: -  The Arterial/Collector road network consists of 8,187,808 SF   of pavement totaling 38.1 miles.  - The Residential/Industrial network 10,625,201 SF of   pavement totaling in 54.1 miles. - 558 pavement segments within its jurisdiction (18,813,009   square feet of pavement).  - 92.2 centerline miles of streets within the network.  The weighted average PCI for the City’s   Arterial/Collector road network is  74.6   The weighted average PCI for the City’s Residential   network is  77.9 The citywide weighted PCI is  76.5
RSM is above average Data from OCTA (2005) Trying to Achieve Countywide Uniformity (common PMP software) PCI Comparison to Other Cities
Current Conditions
Individual quantities show total mileage Current Conditions
Maintenance Zones – PCI’s
It is more cost effective to maintain a pavement segment in good condition over its useful life in comparison to letting it deteriorate to the point that it requires a major overlay or reconstruction   Pavement Life Cycle
Stop Gap (Crackfilling, Potholing) Slurry Seal Asphalt Concrete Overlay Rubberized Asphalt Concrete Overlay Complete Reconstruction Common Pavement Rehabilitation Strategies
Street Selection Criteria PMP Output based on PCI (A Planning Tool) Available Funding Conflicting City Capital Projects Outside Conflicting Projects (i.e. Developments or Utilities) New Information (changes) during construction
Maintenance Strategy Assignments $6.36/SF Reconstruction 0 - 20 $1.65/SF 1.6&quot; ARHM (Arterial) 21 - 55 $1.55/SF  2.0&quot; AC Overlay Mill & Cap (Residential)  21 - 65 Minimal Level of Service (70) $0.30/SF Slurry Seal 65 - 85 Varies by Activity Preventative, Stop Gap 80-100 Unit Cost Description PCI Range  All Streets
Maintenance zone programs create a proactive management program that generates a greater return on the revenue’s City’s invest which in turn allows for deferred overlay & reconstruction projects to be funded without major delay. Each residential street is surveyed every three years Residential/Industrial  Maintenance Zone Findings
Arterial PCI maintains at an average of 75 over the 7yr CIP This result is produced by spending an average of $618,000 per year Arterial Capital Improvement Program MAINTAIN CURRENT  ARTERIAL  WEIGHTED PCI
CIP – Maintain Current PCI Budget
Citywide residential PCI maintains at an average of 77 over the 7-yr CIP This result is produced by spending an average of $580,000 per year over the next seven years This budget model addresses every residential street within a maintenance zone each year Residential Capital Improvement Program MAINTAIN CURRENT  RESIDENTIAL  WEIGHTED PCI
CIP – Maintain Current PCI Budget
Comparison of All Budgets Maintain Citywide Average (76.5 PCI) Program = $1.2 Million / yr Maintain PCI of 70 Program = $900,000 / yr Constrained Program = $250,000 / yr 56.1 69.8 76.3 2014-15 59.4 71.1 76.6 2013-14 62.7 72 77.1 2012-13 66 73.4 76.8 2011-12 68.9 74.1 76.4 2010-11 71.7 74.8 76.1 2009-10 73.2 74.6 75.8 2008-09 76.5 76.5 76.5 Current Constrained Program Reach PCI of 70 Program Maintain Citywide Average Program Fiscal Year
Comparison of All Budgets Maintain Citywide Average (76.5 PCI) Program =  $1.2 Million / yr Maintain PCI of 70 Program =  $900,000 / yr Constrained Program =  $250,000 / yr
Citywide PCI is 76.5 The City’s maintenance zones, that were established in FY 2000, have  created a high level of condition throughout the City. Street maintenance funding needs to stay at a consistent level of $1.2 Million / yr over the next seven years to maintain the current citywide PCI level A proactive overlay program should be implemented to address deferred pavement sections throughout all current zones Continue to inspect the arterial/collector network every two years and the residential network every three years to build a stronger PMP Consider adjusting the residential maintenance zones based on the  pavement conditions, the identified funding levels in the near future and future Measure M2 funding Aggressively pursue grant funding from OCTA (M2) and State. Findings and Recommendations
Provides new wearing surface.  Extends pavement life.  Seals pavement.  Aesthetic Improvement.  Does not add structural integrity. Opportunity to change or refresh striping. What is the purpose of  Slurry Seal?
Types of Slurry Seal Type I:  Penetrates into finer cracks and seals better. Has lower  skid resistance and should not be used on grades steeper than about 5%.Does not fill in more substantial  cracking. Cleaner looking. Type II:  Better skid resistance and therefore safer for traffic  safety. Fills in larger defects. Some of the larger aggregate will ravel and collect in the gutters for a couple of months and will be tracked into cars and houses (aggressive sweeping needed at first). Should roll with a pneumatic tire roller at just the right time to lay down some of the sharp edges.
Fog Sealing  Chip Seals  Ultra Thin Whitetopping (UTW)  CIP Asphalt Recycling Other Pavement Rehabilitation  Strategies

Pavement 101 Presentation 10 17 08

  • 1.
    City of RanchoSanta Margarita PAVEMENT MANAGEMENT OVERVIEW October 22, 2008
  • 2.
    Includes: Pavement Curband Gutter Sidewalks Storm Drains Striping Does not Include: Trees Irrigation Utilities City’s Most Valuable Asset City of RSM Street System
  • 3.
    Value of PavementAlone (Replacement Cost) = $120 million dollars. 18,000,000 x $6.50/sf Value of Entire Street System (Replacement Cost) exceeds $200 million dollars. GASB 34 - Requires Public Agencies to Report on the value of Infrastructure Assets What is it worth?
  • 4.
    Types of StreetPavement Portland Cement Concrete Asphalt Concrete (Majority of RSM pavement) Brick Pavers
  • 5.
    Common Sources ofFunding For Street Maintenance Gas Tax Revenue ($850,000 in FY 08/09) Measure M Turnback ($551,554 in FY 08/09) Proposition 42 (County) ($166,840 in FY 08/09) Measure M GMA ($50,000 in FY 08/09) Total in FY 2008/09 = $__________
  • 6.
    Funding Timelines ForStreet Maintenance Revenue Gas Tax Revenue (__ Years) Measure M Turnback (__ Years) Proposition 42 (County) (__ Years) Measure M GMA (__ Years)
  • 7.
    Less Common Sourcesof Funding For Street Maintenance Proposition 1B (State) – $799,000 in FY 07/08 Proposition 1B (County) Measure M – AHRP – Overlays Only Assessment Districts Federal Grants (CDBG) – Overlays Only General Funds
  • 8.
    Past Street MaintenanceFunding in Rancho Santa Margarita (Actual Expenditures, Rounded to $1,000) FY 2001/02 = $31,000 FY 2002/03 = $395,000 FY 2003/04 = $276,000 FY 2004/05 = $440,000 FY 2005/06 = $952,000 FY 2006/07 = $2,935,000 FY 2007/08 = $1,110,000
  • 9.
    Past Street MaintenanceProjects in RSM Prior to Incorporation 1994-95: Slurry Seal including residential and arterial roads - $600,000 1995-96: Number 2 Lane reconstruction on Santa Margarita Parkway between Alicia and Melinda $180,000 1998-99: Slurry Seal off of Alicia- $60,000 2000-01: Asphalt Overlay of Residential Streets $260,000
  • 10.
    Combination of GasTax, Measure M Turnback, and Proposition 42 7 years – Consistent with CIP Problems: Measure M Turnback is a sales tax, which is now decreasing. Gas Tax revenues may decrease with more fuel efficient cars. Future Road Maintenance Revenues
  • 11.
    A Tool toAnswer Questions: What do I have? What condition is it in? What do I need to repair it? How much money do I need? When should I spend it? What if? What is a Pavement Management Program?
  • 12.
    Advantages Less ExpensiveInternal Oversight (More Control) Disadvantages More Staff Need for Training Difficult to Focus on this function unless only function Less Qualified Expertise Potential Quality Control Issues May Need Capital Expenses In House PMP ?
  • 13.
    Pavement Management ProgramSteps to Implementation of a PMP: Step 1: Assessment of Existing Pavement Network Step 2: Work History Updates Step 3: Pavement Inspections Step 4: Data Input Step 5: QA/QC Step 6: Budgetary Analysis and Reporting Step 7: GIS and Mapping
  • 14.
    2008 Update ofRSM PMP Assess previous City maintenance efforts and incorporate data into the City’s MicroPAVER database Perform pavement condition surveys to generate a Pavement Condition Index (PCI) for each pavement section Develop Capital Improvement Program budget and schedule based on maintenance zones, available funding, current conditions and maintenance practices Submit Citywide CIP report to OCTA for Measure M compliancy Link all MicroPAVER pavement data to the City’s GIS
  • 15.
    MicroPAVER Currently beingused by over 600 cities, counties and airports This includes over 200 cities within California 23 cities in LA County; 22 cities in Orange County MicroPAVER’s PCI methodology is the only pavement rating methodology recognized for rating road pavements MicroPAVER allows for the collection of 19 AC and 19 PCC distress types Three levels of severity can be collected for each distress type Recently selected by OCTA for countywide use
  • 16.
    Pavement Condition Index(PCI) The PCI is a condition rating that ranges from 0 to 100 Weighted average PCI = pavement section PCI * by its area / by the total square footage of the specific network or pavement area.
  • 17.
    PCI = 100Action  Do Nothing PCI = 100 Action  Do Nothing
  • 18.
    PCI = 70Action  Surface Treatment (Slurry) PCI = 70 Action  Surface Treatment (Slurry)
  • 19.
    PCI = 50Action  Structural Improvement (Overlay) PCI = 50 Action  Overlay
  • 20.
    PCI < 20Action  Reconstruction PCI < 20 Action  Reconstruction
  • 21.
    City PMP /Network The City of RSM PMP includes: - The Arterial/Collector road network consists of 8,187,808 SF of pavement totaling 38.1 miles. - The Residential/Industrial network 10,625,201 SF of pavement totaling in 54.1 miles. - 558 pavement segments within its jurisdiction (18,813,009 square feet of pavement). - 92.2 centerline miles of streets within the network. The weighted average PCI for the City’s Arterial/Collector road network is 74.6 The weighted average PCI for the City’s Residential network is 77.9 The citywide weighted PCI is 76.5
  • 22.
    RSM is aboveaverage Data from OCTA (2005) Trying to Achieve Countywide Uniformity (common PMP software) PCI Comparison to Other Cities
  • 23.
  • 24.
    Individual quantities showtotal mileage Current Conditions
  • 25.
  • 26.
    It is morecost effective to maintain a pavement segment in good condition over its useful life in comparison to letting it deteriorate to the point that it requires a major overlay or reconstruction Pavement Life Cycle
  • 27.
    Stop Gap (Crackfilling,Potholing) Slurry Seal Asphalt Concrete Overlay Rubberized Asphalt Concrete Overlay Complete Reconstruction Common Pavement Rehabilitation Strategies
  • 28.
    Street Selection CriteriaPMP Output based on PCI (A Planning Tool) Available Funding Conflicting City Capital Projects Outside Conflicting Projects (i.e. Developments or Utilities) New Information (changes) during construction
  • 29.
    Maintenance Strategy Assignments$6.36/SF Reconstruction 0 - 20 $1.65/SF 1.6&quot; ARHM (Arterial) 21 - 55 $1.55/SF 2.0&quot; AC Overlay Mill & Cap (Residential) 21 - 65 Minimal Level of Service (70) $0.30/SF Slurry Seal 65 - 85 Varies by Activity Preventative, Stop Gap 80-100 Unit Cost Description PCI Range All Streets
  • 30.
    Maintenance zone programscreate a proactive management program that generates a greater return on the revenue’s City’s invest which in turn allows for deferred overlay & reconstruction projects to be funded without major delay. Each residential street is surveyed every three years Residential/Industrial Maintenance Zone Findings
  • 31.
    Arterial PCI maintainsat an average of 75 over the 7yr CIP This result is produced by spending an average of $618,000 per year Arterial Capital Improvement Program MAINTAIN CURRENT ARTERIAL WEIGHTED PCI
  • 32.
    CIP – MaintainCurrent PCI Budget
  • 33.
    Citywide residential PCImaintains at an average of 77 over the 7-yr CIP This result is produced by spending an average of $580,000 per year over the next seven years This budget model addresses every residential street within a maintenance zone each year Residential Capital Improvement Program MAINTAIN CURRENT RESIDENTIAL WEIGHTED PCI
  • 34.
    CIP – MaintainCurrent PCI Budget
  • 35.
    Comparison of AllBudgets Maintain Citywide Average (76.5 PCI) Program = $1.2 Million / yr Maintain PCI of 70 Program = $900,000 / yr Constrained Program = $250,000 / yr 56.1 69.8 76.3 2014-15 59.4 71.1 76.6 2013-14 62.7 72 77.1 2012-13 66 73.4 76.8 2011-12 68.9 74.1 76.4 2010-11 71.7 74.8 76.1 2009-10 73.2 74.6 75.8 2008-09 76.5 76.5 76.5 Current Constrained Program Reach PCI of 70 Program Maintain Citywide Average Program Fiscal Year
  • 36.
    Comparison of AllBudgets Maintain Citywide Average (76.5 PCI) Program = $1.2 Million / yr Maintain PCI of 70 Program = $900,000 / yr Constrained Program = $250,000 / yr
  • 37.
    Citywide PCI is76.5 The City’s maintenance zones, that were established in FY 2000, have created a high level of condition throughout the City. Street maintenance funding needs to stay at a consistent level of $1.2 Million / yr over the next seven years to maintain the current citywide PCI level A proactive overlay program should be implemented to address deferred pavement sections throughout all current zones Continue to inspect the arterial/collector network every two years and the residential network every three years to build a stronger PMP Consider adjusting the residential maintenance zones based on the pavement conditions, the identified funding levels in the near future and future Measure M2 funding Aggressively pursue grant funding from OCTA (M2) and State. Findings and Recommendations
  • 38.
    Provides new wearingsurface. Extends pavement life. Seals pavement. Aesthetic Improvement. Does not add structural integrity. Opportunity to change or refresh striping. What is the purpose of Slurry Seal?
  • 39.
    Types of SlurrySeal Type I: Penetrates into finer cracks and seals better. Has lower skid resistance and should not be used on grades steeper than about 5%.Does not fill in more substantial cracking. Cleaner looking. Type II: Better skid resistance and therefore safer for traffic safety. Fills in larger defects. Some of the larger aggregate will ravel and collect in the gutters for a couple of months and will be tracked into cars and houses (aggressive sweeping needed at first). Should roll with a pneumatic tire roller at just the right time to lay down some of the sharp edges.
  • 40.
    Fog Sealing Chip Seals Ultra Thin Whitetopping (UTW) CIP Asphalt Recycling Other Pavement Rehabilitation Strategies