SlideShare a Scribd company logo
1 of 3
Download to read offline
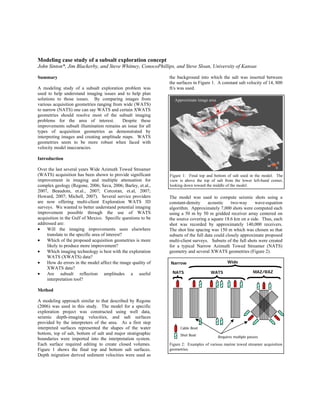
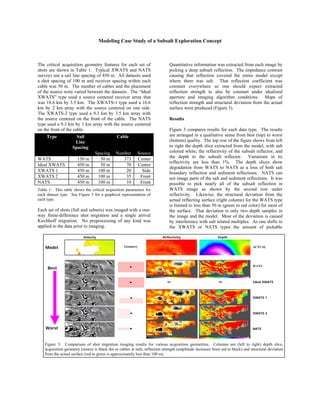
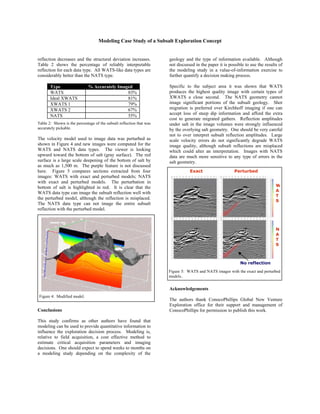
Modeling case study of a subsalt exploration concept
John Sinton*, Jim Blackerby, and Steve Whitney, ConocoPhillips, and Steve Sloan, University of Kansas

                                                              the background into which the salt was inserted between
Summary
                                                              the surfaces in Figure 1. A constant salt velocity of 14, 800
A modeling study of a subsalt exploration problem was         ft/s was used.
used to help understand imaging issues and to help plan
solutions to those issues. By comparing images from             Approximate image area
various acquisition geometries ranging from wide (WATS)
to narrow (NATS) one can say WATS and certain XWATS
geometries should resolve most of the subsalt imaging
problems for the area of interest.         Despite these
improvements subsalt illumination remains an issue for all
types of acquisition geometries as demonstrated by
interpreting images and creating amplitude maps. WATS
geometries seem to be more robust when faced with
velocity model inaccuracies.

Introduction

Over the last several years Wide Azimuth Towed Streamer
(WATS) acquisition has been shown to provide significant      Figure 1: Final top and bottom of salt used in the model. The
improvement in imaging and multiple attenuation for           view is above the top of salt from the lower left-hand corner,
complex geology (Regone, 2006; Sava, 2006; Barley, et.al.,    looking down toward the middle of the model.
2007, Beaudoin, et.al., 2007; Corcoran, et.al, 2007;
Howard, 2007; Michell, 2007). Several service providers       The model was used to compute seismic shots using a
are now offering multi-client Exploration WATS 3D             constant-density     acoustic     two-way     wave-equation
surveys. We wanted to better understand potential imaging     algorithm. Approximately 7,000 shots were computed each
improvement possible through the use of WATS                  using a 50 m by 50 m gridded receiver array centered on
acquisition in the Gulf of Mexico. Specific questions to be   the source covering a square 18.6 km on a side. Thus, each
addressed are:                                                shot was recorded by approximately 140,000 receivers.
•    Will the imaging improvements seen elsewhere             The shot line spacing was 150 m which was chosen so that
     translate to the specific area of interest?              subsets of the full data could closely approximate proposed
•    Which of the proposed acquisition geometries is more     multi-client surveys. Subsets of the full shots were created
     likely to produce more improvement?                      for a typical Narrow Azimuth Towed Streamer (NATS)
•                                                             geometry and several XWATS geometries (Figure 2).
     Which imaging technology is best with the exploration
     WATS (XWATS) data?
                                                                                              Wide
•                                                             Narrow
     How do errors in the model affect the image quality of
     XWATS data?
                                                                                                              MAZ/RAZ
                                                               NATS                  WATS
•    Are subsalt reflection amplitudes a useful
     interpretation tool?

Method

A modeling approach similar to that described by Regone
(2006) was used in this study. The model for a specific
exploration project was constructed using well data,
seismic depth-imaging velocities, and salt surfaces
provided by the interpreters of the area. As a first step
                                                                    Cable Boat
interpreted surfaces represented the shapes of the water
bottom, top of salt, bottom of salt and major stratigraphic         Shot Boat            Requires multiple passes
boundaries were imported into the interpretation system.
Each surface required editing to create closed volumes.       Figure 2: Examples of various marine towed streamer acquisition
                                                              geometries.
Figure 1 shows the final top and bottom salt surfaces.
Depth migration derived sediment velocities were used as
Modeling Case Study of a Subsalt Exploration Concept


The critical acquisition geometry features for each set of                     Quantitative information was extracted from each image by
shots are shown in Table 1. Typical XWATS and NATS                             picking a deep subsalt reflection. The impedance contrast
surveys use a sail line spacing of 450 m. All datasets used                    causing that reflection covered the entire model except
a shot spacing of 100 m and receiver spacing within each                       where there was salt. That reflection coefficient was
cable was 50 m. The number of cables and the placement                         constant everywhere so one should expect extracted
of the source were varied between the datasets. The “Ideal                     reflection strength to also be constant under idealized
XWATS” type used a source centered receiver array that                         aperture and imaging algorithm conditions. Maps of
was 18.6 km by 3.5 km. The XWATS-1 type used a 16.6                            reflection strength and structural deviation from the actual
km by 2 km array with the source centered on one side.                         surface were produced (Figure 3).
The XWATS-2 type used a 9.3 km by 3.5 km array with
the source centered on the front of the cable. The NATS                        Results
type used a 9.3 km by 1 km array with the source centered
on the front of the cable.                                                     Figure 3 compares results for each data type. The results
                                                                               are arranged in a qualitative sense from best (top) to worst
     Type             Sail               Cable
                                                                               (bottom) quality. The top row of the figure shows from left
                     Line
                                                                               to right the depth slice extracted from the model, with salt
                    Spacing
                                                                               colored white; the reflectivity of the subsalt reflector; and
                               Spacing Number Source
                                                                               the depth to the subsalt reflector. Variations in its
WATS                  150 m       50 m       373 Center
                                                                               reflectivity are less than 1%. The depth slices show
Ideal XWATS           450 m       50 m        70 Center
                                                                               degradation from WATS to NATS as a loss of both salt
XWATS 1               450 m      100 m        20       Side                    boundary reflection and sediment reflections. NATS can
XWATS 2               450 m      100 m        35      Front                    not image parts of the salt and sediment reflections. It was
NATS                  450 m      100 m        10      Front                    possible to pick nearly all of the subsalt reflection in
                                                                               WATS image as shown by the second row under
Table 1: This table shows the critical acquisition parameters for
                                                                               reflectivity. Likewise, the structural deviation from the
each dataset type. See Figure 3 for a graphical representation of
each type.                                                                     actual reflecting surface (right column) for the WATS type
                                                                               is limited to less than 50 m (green to red color) for most of
Each set of shots (full and subsets) was imaged with a one-                    the surface. That deviation is only two depth samples in
way finite-difference shot migration and a single arrival                      the image and the model. Most of the deviation is caused
Kirchhoff migration. No preprocessing of any kind was                          by interference with salt related multiples. As one shifts to
applied to the data prior to imaging.                                          the XWATS or NATS types the amount of pickable

                           Velocity                                        Reflectivity                      Depth


    Model                                           Geometry                                                                       ACTUAL
                                                                                                                               L
                                                                                                                  H


                                                                                                                                   WATS
     Best


                                                                                                                                   Ideal XWATS
                                                                              NA                             NA


                                                                                                                                   XWATS 1


                                                                                                                                   XWATS 2


    Worst                                                                                                                          NATS


    Figure 3: Comparison of shot migration imaging results for various acquisition geometries. Columns are (left to right) depth slice,
    acquisition geometry (source is black dot to cables in red), reflection strength (amplitude increases from red to black) and structural deviation
    from the actual surface (red to green is approximately less than 100 m).
Modeling Case Study of a Subsalt Exploration Concept


reflection decreases and the structural deviation increases.          geology and the type of information available. Although
Table 2 shows the percentage of reliably interpretable                not discussed in the paper it is possible to use the results of
reflection for each data type. All WATS-like data types are           the modeling study in a value-of-information exercise to
considerably better than the NATS type.                               further quantify a decision making process.

                                                                      Specific to the subject area it was shown that WATS
       Type                   % Accurately Imaged
                                                                      produces the highest quality image with certain types of
       WATS                                    83%
                                                                      XWATS a close second. The NATS geometry cannot
       Ideal XWATS                             81%
                                                                      image significant portions of the subsalt geology. Shot
       XWATS 1                                 79%
                                                                      migration is preferred over Kirchhoff imaging if one can
       XWATS 2                                 67%
                                                                      accept loss of steep dip information and afford the extra
       NATS                                    55%
                                                                      cost to generate migrated gathers. Reflection amplitudes
Table 2: Shown is the percentage of the subsalt reflection that was   under salt in the image volumes were strongly influenced
accurately pickable.                                                  by the overlying salt geometry. One should be very careful
                                                                      not to over interpret subsalt reflection amplitudes. Large
The velocity model used to image data was perturbed as                scale velocity errors do not significantly degrade WATS
shown in Figure 4 and new images were computed for the                image quality, although subsalt reflections are misplaced
WATS and NATS data types. The viewer is looking                       which could alter an interpretation. Images with NATS
upward toward the bottom of salt (gray surface). The red              data are much more sensitive to any type of errors in the
surface is a large scale deepening of the bottom of salt by           salt geometry.
as much as 1,500 m. The purple feature is not discussed
                                                                                 Exact                    Perturbed
here. Figure 5 compares sections extracted from four
images: WATS with exact and perturbed models; NATS
with exact and perturbed models. The perturbation in
                                                                                                                                 W
bottom of salt is highlighted in red. It is clear that the
                                                                                                                                 A
WATS data type can image the subsalt reflection well with
                                                                                                                                 T
the perturbed model, although the reflection is misplaced.
                                                                                                                                 S
The NATS data type can not image the entire subsalt
reflection with the perturbed model.


                                                                                                                                 N
                                                                                                                                 A
                                                                                                                                 T
                                                                                                                                 S


                                                                                                             No reflection
                                                                      Figure 5: WATS and NATS images with the exact and perturbed
                                                                      models..


                                                                      Acknowledgements
Figure 4: Modified model.
                                                                      The authors thank ConocoPhillips Global New Venture
                                                                      Exploration office for their support and management of
Conclusions                                                           ConocoPhillips for permission to publish this work.

This study confirms as other authors have found that
modeling can be used to provide quantitative information to
influence the exploration decision process. Modeling is,
relative to field acquisition, a cost effective method to
estimate critical acquisition parameters and imaging
decisions. One should expect to spend weeks to months on
a modeling study depending on the complexity of the

More Related Content

Similar to Modeling Case Study Of A Subsalt Exploration Concept

Lateral resolution and lithological interpretation of surface wave profi ling
Lateral resolution and lithological interpretation of surface wave profi lingLateral resolution and lithological interpretation of surface wave profi ling
Lateral resolution and lithological interpretation of surface wave profi lingAdam O'Neill
 
Arcis 2013 reservoir_bochure_
Arcis 2013 reservoir_bochure_Arcis 2013 reservoir_bochure_
Arcis 2013 reservoir_bochure_TGS
 
Survey Planning Leading Edge 102004 Andrew Long
Survey Planning Leading Edge 102004 Andrew LongSurvey Planning Leading Edge 102004 Andrew Long
Survey Planning Leading Edge 102004 Andrew LongAndrew Long
 
Delineating faults using multi-trace seismic attributes: Example from offshor...
Delineating faults using multi-trace seismic attributes: Example from offshor...Delineating faults using multi-trace seismic attributes: Example from offshor...
Delineating faults using multi-trace seismic attributes: Example from offshor...iosrjce
 
Improving Reservoir Simulation Modeling with Seismic Attributes
Improving Reservoir Simulation Modeling with Seismic AttributesImproving Reservoir Simulation Modeling with Seismic Attributes
Improving Reservoir Simulation Modeling with Seismic AttributesSociety of Petroleum Engineers
 
Improving Reservoir Simulation Modeling with Seismic Attributes
Improving Reservoir Simulation Modeling with Seismic Attributes Improving Reservoir Simulation Modeling with Seismic Attributes
Improving Reservoir Simulation Modeling with Seismic Attributes Society of Petroleum Engineers
 
PITFALLS IN 3-D SEISMIC INTERPRETATION
PITFALLS IN 3-D SEISMIC INTERPRETATION PITFALLS IN 3-D SEISMIC INTERPRETATION
PITFALLS IN 3-D SEISMIC INTERPRETATION Debabrata Majumder
 
TGS Arcis- Canada Curvature Attributes and Applications Poster
TGS Arcis- Canada Curvature Attributes and Applications PosterTGS Arcis- Canada Curvature Attributes and Applications Poster
TGS Arcis- Canada Curvature Attributes and Applications PosterTGS
 
Application of Seismic Reflection Surveys to Detect Massive Sulphide Deposits...
Application of Seismic Reflection Surveys to Detect Massive Sulphide Deposits...Application of Seismic Reflection Surveys to Detect Massive Sulphide Deposits...
Application of Seismic Reflection Surveys to Detect Massive Sulphide Deposits...iosrjce
 
Fracture prediction using low coverage seismic data in area of complicated st...
Fracture prediction using low coverage seismic data in area of complicated st...Fracture prediction using low coverage seismic data in area of complicated st...
Fracture prediction using low coverage seismic data in area of complicated st...Mario Prince
 
URBAN AREA PRODUCT SIMULATION FOR THE ENMAP HYPERSPECTRAL SENSOR.ppt
URBAN AREA PRODUCT SIMULATION FOR THE ENMAP HYPERSPECTRAL SENSOR.pptURBAN AREA PRODUCT SIMULATION FOR THE ENMAP HYPERSPECTRAL SENSOR.ppt
URBAN AREA PRODUCT SIMULATION FOR THE ENMAP HYPERSPECTRAL SENSOR.pptgrssieee
 
URBAN AREA PRODUCT SIMULATION FOR THE ENMAP HYPERSPECTRAL SENSOR.ppt
URBAN AREA PRODUCT SIMULATION FOR THE ENMAP HYPERSPECTRAL SENSOR.pptURBAN AREA PRODUCT SIMULATION FOR THE ENMAP HYPERSPECTRAL SENSOR.ppt
URBAN AREA PRODUCT SIMULATION FOR THE ENMAP HYPERSPECTRAL SENSOR.pptgrssieee
 
Broadband seismic to support hydrocarbon exploration on the UK Continental Sh...
Broadband seismic to support hydrocarbon exploration on the UK Continental Sh...Broadband seismic to support hydrocarbon exploration on the UK Continental Sh...
Broadband seismic to support hydrocarbon exploration on the UK Continental Sh...ssuserb20d17
 
Chapter 6 image quality in ct
Chapter 6 image quality in ct Chapter 6 image quality in ct
Chapter 6 image quality in ct Muntaser S.Ahmad
 
Recent Advances In MRI
Recent Advances In MRIRecent Advances In MRI
Recent Advances In MRIUpakar Paudel
 
1996 new application of classical x ray diffraction methods for epitaxial fil...
1996 new application of classical x ray diffraction methods for epitaxial fil...1996 new application of classical x ray diffraction methods for epitaxial fil...
1996 new application of classical x ray diffraction methods for epitaxial fil...pmloscholte
 
Seismic attributes
Seismic attributesSeismic attributes
Seismic attributeszaheehussain
 

Similar to Modeling Case Study Of A Subsalt Exploration Concept (20)

Lateral resolution and lithological interpretation of surface wave profi ling
Lateral resolution and lithological interpretation of surface wave profi lingLateral resolution and lithological interpretation of surface wave profi ling
Lateral resolution and lithological interpretation of surface wave profi ling
 
tle31050528.1
tle31050528.1tle31050528.1
tle31050528.1
 
Arcis 2013 reservoir_bochure_
Arcis 2013 reservoir_bochure_Arcis 2013 reservoir_bochure_
Arcis 2013 reservoir_bochure_
 
Survey Planning Leading Edge 102004 Andrew Long
Survey Planning Leading Edge 102004 Andrew LongSurvey Planning Leading Edge 102004 Andrew Long
Survey Planning Leading Edge 102004 Andrew Long
 
2014_SEG_poster
2014_SEG_poster2014_SEG_poster
2014_SEG_poster
 
Basalt Presentation
Basalt PresentationBasalt Presentation
Basalt Presentation
 
Delineating faults using multi-trace seismic attributes: Example from offshor...
Delineating faults using multi-trace seismic attributes: Example from offshor...Delineating faults using multi-trace seismic attributes: Example from offshor...
Delineating faults using multi-trace seismic attributes: Example from offshor...
 
Improving Reservoir Simulation Modeling with Seismic Attributes
Improving Reservoir Simulation Modeling with Seismic AttributesImproving Reservoir Simulation Modeling with Seismic Attributes
Improving Reservoir Simulation Modeling with Seismic Attributes
 
Improving Reservoir Simulation Modeling with Seismic Attributes
Improving Reservoir Simulation Modeling with Seismic Attributes Improving Reservoir Simulation Modeling with Seismic Attributes
Improving Reservoir Simulation Modeling with Seismic Attributes
 
PITFALLS IN 3-D SEISMIC INTERPRETATION
PITFALLS IN 3-D SEISMIC INTERPRETATION PITFALLS IN 3-D SEISMIC INTERPRETATION
PITFALLS IN 3-D SEISMIC INTERPRETATION
 
TGS Arcis- Canada Curvature Attributes and Applications Poster
TGS Arcis- Canada Curvature Attributes and Applications PosterTGS Arcis- Canada Curvature Attributes and Applications Poster
TGS Arcis- Canada Curvature Attributes and Applications Poster
 
Application of Seismic Reflection Surveys to Detect Massive Sulphide Deposits...
Application of Seismic Reflection Surveys to Detect Massive Sulphide Deposits...Application of Seismic Reflection Surveys to Detect Massive Sulphide Deposits...
Application of Seismic Reflection Surveys to Detect Massive Sulphide Deposits...
 
Fracture prediction using low coverage seismic data in area of complicated st...
Fracture prediction using low coverage seismic data in area of complicated st...Fracture prediction using low coverage seismic data in area of complicated st...
Fracture prediction using low coverage seismic data in area of complicated st...
 
URBAN AREA PRODUCT SIMULATION FOR THE ENMAP HYPERSPECTRAL SENSOR.ppt
URBAN AREA PRODUCT SIMULATION FOR THE ENMAP HYPERSPECTRAL SENSOR.pptURBAN AREA PRODUCT SIMULATION FOR THE ENMAP HYPERSPECTRAL SENSOR.ppt
URBAN AREA PRODUCT SIMULATION FOR THE ENMAP HYPERSPECTRAL SENSOR.ppt
 
URBAN AREA PRODUCT SIMULATION FOR THE ENMAP HYPERSPECTRAL SENSOR.ppt
URBAN AREA PRODUCT SIMULATION FOR THE ENMAP HYPERSPECTRAL SENSOR.pptURBAN AREA PRODUCT SIMULATION FOR THE ENMAP HYPERSPECTRAL SENSOR.ppt
URBAN AREA PRODUCT SIMULATION FOR THE ENMAP HYPERSPECTRAL SENSOR.ppt
 
Broadband seismic to support hydrocarbon exploration on the UK Continental Sh...
Broadband seismic to support hydrocarbon exploration on the UK Continental Sh...Broadband seismic to support hydrocarbon exploration on the UK Continental Sh...
Broadband seismic to support hydrocarbon exploration on the UK Continental Sh...
 
Chapter 6 image quality in ct
Chapter 6 image quality in ct Chapter 6 image quality in ct
Chapter 6 image quality in ct
 
Recent Advances In MRI
Recent Advances In MRIRecent Advances In MRI
Recent Advances In MRI
 
1996 new application of classical x ray diffraction methods for epitaxial fil...
1996 new application of classical x ray diffraction methods for epitaxial fil...1996 new application of classical x ray diffraction methods for epitaxial fil...
1996 new application of classical x ray diffraction methods for epitaxial fil...
 
Seismic attributes
Seismic attributesSeismic attributes
Seismic attributes
 

Recently uploaded

08448380779 Call Girls In Greater Kailash - I Women Seeking Men
08448380779 Call Girls In Greater Kailash - I Women Seeking Men08448380779 Call Girls In Greater Kailash - I Women Seeking Men
08448380779 Call Girls In Greater Kailash - I Women Seeking MenDelhi Call girls
 
WhatsApp 9892124323 ✓Call Girls In Kalyan ( Mumbai ) secure service
WhatsApp 9892124323 ✓Call Girls In Kalyan ( Mumbai ) secure serviceWhatsApp 9892124323 ✓Call Girls In Kalyan ( Mumbai ) secure service
WhatsApp 9892124323 ✓Call Girls In Kalyan ( Mumbai ) secure servicePooja Nehwal
 
Artificial intelligence in the post-deep learning era
Artificial intelligence in the post-deep learning eraArtificial intelligence in the post-deep learning era
Artificial intelligence in the post-deep learning eraDeakin University
 
Enhancing Worker Digital Experience: A Hands-on Workshop for Partners
Enhancing Worker Digital Experience: A Hands-on Workshop for PartnersEnhancing Worker Digital Experience: A Hands-on Workshop for Partners
Enhancing Worker Digital Experience: A Hands-on Workshop for PartnersThousandEyes
 
Advanced Test Driven-Development @ php[tek] 2024
Advanced Test Driven-Development @ php[tek] 2024Advanced Test Driven-Development @ php[tek] 2024
Advanced Test Driven-Development @ php[tek] 2024Scott Keck-Warren
 
Presentation on how to chat with PDF using ChatGPT code interpreter
Presentation on how to chat with PDF using ChatGPT code interpreterPresentation on how to chat with PDF using ChatGPT code interpreter
Presentation on how to chat with PDF using ChatGPT code interpreternaman860154
 
Making_way_through_DLL_hollowing_inspite_of_CFG_by_Debjeet Banerjee.pptx
Making_way_through_DLL_hollowing_inspite_of_CFG_by_Debjeet Banerjee.pptxMaking_way_through_DLL_hollowing_inspite_of_CFG_by_Debjeet Banerjee.pptx
Making_way_through_DLL_hollowing_inspite_of_CFG_by_Debjeet Banerjee.pptxnull - The Open Security Community
 
Transforming Data Streams with Kafka Connect: An Introduction to Single Messa...
Transforming Data Streams with Kafka Connect: An Introduction to Single Messa...Transforming Data Streams with Kafka Connect: An Introduction to Single Messa...
Transforming Data Streams with Kafka Connect: An Introduction to Single Messa...HostedbyConfluent
 
CloudStudio User manual (basic edition):
CloudStudio User manual (basic edition):CloudStudio User manual (basic edition):
CloudStudio User manual (basic edition):comworks
 
AI as an Interface for Commercial Buildings
AI as an Interface for Commercial BuildingsAI as an Interface for Commercial Buildings
AI as an Interface for Commercial BuildingsMemoori
 
The Codex of Business Writing Software for Real-World Solutions 2.pptx
The Codex of Business Writing Software for Real-World Solutions 2.pptxThe Codex of Business Writing Software for Real-World Solutions 2.pptx
The Codex of Business Writing Software for Real-World Solutions 2.pptxMalak Abu Hammad
 
Snow Chain-Integrated Tire for a Safe Drive on Winter Roads
Snow Chain-Integrated Tire for a Safe Drive on Winter RoadsSnow Chain-Integrated Tire for a Safe Drive on Winter Roads
Snow Chain-Integrated Tire for a Safe Drive on Winter RoadsHyundai Motor Group
 
How to convert PDF to text with Nanonets
How to convert PDF to text with NanonetsHow to convert PDF to text with Nanonets
How to convert PDF to text with Nanonetsnaman860154
 
Maximizing Board Effectiveness 2024 Webinar.pptx
Maximizing Board Effectiveness 2024 Webinar.pptxMaximizing Board Effectiveness 2024 Webinar.pptx
Maximizing Board Effectiveness 2024 Webinar.pptxOnBoard
 
How to Remove Document Management Hurdles with X-Docs?
How to Remove Document Management Hurdles with X-Docs?How to Remove Document Management Hurdles with X-Docs?
How to Remove Document Management Hurdles with X-Docs?XfilesPro
 
Beyond Boundaries: Leveraging No-Code Solutions for Industry Innovation
Beyond Boundaries: Leveraging No-Code Solutions for Industry InnovationBeyond Boundaries: Leveraging No-Code Solutions for Industry Innovation
Beyond Boundaries: Leveraging No-Code Solutions for Industry InnovationSafe Software
 
Neo4j - How KGs are shaping the future of Generative AI at AWS Summit London ...
Neo4j - How KGs are shaping the future of Generative AI at AWS Summit London ...Neo4j - How KGs are shaping the future of Generative AI at AWS Summit London ...
Neo4j - How KGs are shaping the future of Generative AI at AWS Summit London ...Neo4j
 
Pigging Solutions in Pet Food Manufacturing
Pigging Solutions in Pet Food ManufacturingPigging Solutions in Pet Food Manufacturing
Pigging Solutions in Pet Food ManufacturingPigging Solutions
 
SQL Database Design For Developers at php[tek] 2024
SQL Database Design For Developers at php[tek] 2024SQL Database Design For Developers at php[tek] 2024
SQL Database Design For Developers at php[tek] 2024Scott Keck-Warren
 

Recently uploaded (20)

08448380779 Call Girls In Greater Kailash - I Women Seeking Men
08448380779 Call Girls In Greater Kailash - I Women Seeking Men08448380779 Call Girls In Greater Kailash - I Women Seeking Men
08448380779 Call Girls In Greater Kailash - I Women Seeking Men
 
WhatsApp 9892124323 ✓Call Girls In Kalyan ( Mumbai ) secure service
WhatsApp 9892124323 ✓Call Girls In Kalyan ( Mumbai ) secure serviceWhatsApp 9892124323 ✓Call Girls In Kalyan ( Mumbai ) secure service
WhatsApp 9892124323 ✓Call Girls In Kalyan ( Mumbai ) secure service
 
Artificial intelligence in the post-deep learning era
Artificial intelligence in the post-deep learning eraArtificial intelligence in the post-deep learning era
Artificial intelligence in the post-deep learning era
 
Enhancing Worker Digital Experience: A Hands-on Workshop for Partners
Enhancing Worker Digital Experience: A Hands-on Workshop for PartnersEnhancing Worker Digital Experience: A Hands-on Workshop for Partners
Enhancing Worker Digital Experience: A Hands-on Workshop for Partners
 
Advanced Test Driven-Development @ php[tek] 2024
Advanced Test Driven-Development @ php[tek] 2024Advanced Test Driven-Development @ php[tek] 2024
Advanced Test Driven-Development @ php[tek] 2024
 
Presentation on how to chat with PDF using ChatGPT code interpreter
Presentation on how to chat with PDF using ChatGPT code interpreterPresentation on how to chat with PDF using ChatGPT code interpreter
Presentation on how to chat with PDF using ChatGPT code interpreter
 
Making_way_through_DLL_hollowing_inspite_of_CFG_by_Debjeet Banerjee.pptx
Making_way_through_DLL_hollowing_inspite_of_CFG_by_Debjeet Banerjee.pptxMaking_way_through_DLL_hollowing_inspite_of_CFG_by_Debjeet Banerjee.pptx
Making_way_through_DLL_hollowing_inspite_of_CFG_by_Debjeet Banerjee.pptx
 
Transforming Data Streams with Kafka Connect: An Introduction to Single Messa...
Transforming Data Streams with Kafka Connect: An Introduction to Single Messa...Transforming Data Streams with Kafka Connect: An Introduction to Single Messa...
Transforming Data Streams with Kafka Connect: An Introduction to Single Messa...
 
CloudStudio User manual (basic edition):
CloudStudio User manual (basic edition):CloudStudio User manual (basic edition):
CloudStudio User manual (basic edition):
 
AI as an Interface for Commercial Buildings
AI as an Interface for Commercial BuildingsAI as an Interface for Commercial Buildings
AI as an Interface for Commercial Buildings
 
The Codex of Business Writing Software for Real-World Solutions 2.pptx
The Codex of Business Writing Software for Real-World Solutions 2.pptxThe Codex of Business Writing Software for Real-World Solutions 2.pptx
The Codex of Business Writing Software for Real-World Solutions 2.pptx
 
Vulnerability_Management_GRC_by Sohang Sengupta.pptx
Vulnerability_Management_GRC_by Sohang Sengupta.pptxVulnerability_Management_GRC_by Sohang Sengupta.pptx
Vulnerability_Management_GRC_by Sohang Sengupta.pptx
 
Snow Chain-Integrated Tire for a Safe Drive on Winter Roads
Snow Chain-Integrated Tire for a Safe Drive on Winter RoadsSnow Chain-Integrated Tire for a Safe Drive on Winter Roads
Snow Chain-Integrated Tire for a Safe Drive on Winter Roads
 
How to convert PDF to text with Nanonets
How to convert PDF to text with NanonetsHow to convert PDF to text with Nanonets
How to convert PDF to text with Nanonets
 
Maximizing Board Effectiveness 2024 Webinar.pptx
Maximizing Board Effectiveness 2024 Webinar.pptxMaximizing Board Effectiveness 2024 Webinar.pptx
Maximizing Board Effectiveness 2024 Webinar.pptx
 
How to Remove Document Management Hurdles with X-Docs?
How to Remove Document Management Hurdles with X-Docs?How to Remove Document Management Hurdles with X-Docs?
How to Remove Document Management Hurdles with X-Docs?
 
Beyond Boundaries: Leveraging No-Code Solutions for Industry Innovation
Beyond Boundaries: Leveraging No-Code Solutions for Industry InnovationBeyond Boundaries: Leveraging No-Code Solutions for Industry Innovation
Beyond Boundaries: Leveraging No-Code Solutions for Industry Innovation
 
Neo4j - How KGs are shaping the future of Generative AI at AWS Summit London ...
Neo4j - How KGs are shaping the future of Generative AI at AWS Summit London ...Neo4j - How KGs are shaping the future of Generative AI at AWS Summit London ...
Neo4j - How KGs are shaping the future of Generative AI at AWS Summit London ...
 
Pigging Solutions in Pet Food Manufacturing
Pigging Solutions in Pet Food ManufacturingPigging Solutions in Pet Food Manufacturing
Pigging Solutions in Pet Food Manufacturing
 
SQL Database Design For Developers at php[tek] 2024
SQL Database Design For Developers at php[tek] 2024SQL Database Design For Developers at php[tek] 2024
SQL Database Design For Developers at php[tek] 2024
 

Modeling Case Study Of A Subsalt Exploration Concept

  • 1. Modeling case study of a subsalt exploration concept John Sinton*, Jim Blackerby, and Steve Whitney, ConocoPhillips, and Steve Sloan, University of Kansas the background into which the salt was inserted between Summary the surfaces in Figure 1. A constant salt velocity of 14, 800 A modeling study of a subsalt exploration problem was ft/s was used. used to help understand imaging issues and to help plan solutions to those issues. By comparing images from Approximate image area various acquisition geometries ranging from wide (WATS) to narrow (NATS) one can say WATS and certain XWATS geometries should resolve most of the subsalt imaging problems for the area of interest. Despite these improvements subsalt illumination remains an issue for all types of acquisition geometries as demonstrated by interpreting images and creating amplitude maps. WATS geometries seem to be more robust when faced with velocity model inaccuracies. Introduction Over the last several years Wide Azimuth Towed Streamer (WATS) acquisition has been shown to provide significant Figure 1: Final top and bottom of salt used in the model. The improvement in imaging and multiple attenuation for view is above the top of salt from the lower left-hand corner, complex geology (Regone, 2006; Sava, 2006; Barley, et.al., looking down toward the middle of the model. 2007, Beaudoin, et.al., 2007; Corcoran, et.al, 2007; Howard, 2007; Michell, 2007). Several service providers The model was used to compute seismic shots using a are now offering multi-client Exploration WATS 3D constant-density acoustic two-way wave-equation surveys. We wanted to better understand potential imaging algorithm. Approximately 7,000 shots were computed each improvement possible through the use of WATS using a 50 m by 50 m gridded receiver array centered on acquisition in the Gulf of Mexico. Specific questions to be the source covering a square 18.6 km on a side. Thus, each addressed are: shot was recorded by approximately 140,000 receivers. • Will the imaging improvements seen elsewhere The shot line spacing was 150 m which was chosen so that translate to the specific area of interest? subsets of the full data could closely approximate proposed • Which of the proposed acquisition geometries is more multi-client surveys. Subsets of the full shots were created likely to produce more improvement? for a typical Narrow Azimuth Towed Streamer (NATS) • geometry and several XWATS geometries (Figure 2). Which imaging technology is best with the exploration WATS (XWATS) data? Wide • Narrow How do errors in the model affect the image quality of XWATS data? MAZ/RAZ NATS WATS • Are subsalt reflection amplitudes a useful interpretation tool? Method A modeling approach similar to that described by Regone (2006) was used in this study. The model for a specific exploration project was constructed using well data, seismic depth-imaging velocities, and salt surfaces provided by the interpreters of the area. As a first step Cable Boat interpreted surfaces represented the shapes of the water bottom, top of salt, bottom of salt and major stratigraphic Shot Boat Requires multiple passes boundaries were imported into the interpretation system. Each surface required editing to create closed volumes. Figure 2: Examples of various marine towed streamer acquisition geometries. Figure 1 shows the final top and bottom salt surfaces. Depth migration derived sediment velocities were used as
  • 2. Modeling Case Study of a Subsalt Exploration Concept The critical acquisition geometry features for each set of Quantitative information was extracted from each image by shots are shown in Table 1. Typical XWATS and NATS picking a deep subsalt reflection. The impedance contrast surveys use a sail line spacing of 450 m. All datasets used causing that reflection covered the entire model except a shot spacing of 100 m and receiver spacing within each where there was salt. That reflection coefficient was cable was 50 m. The number of cables and the placement constant everywhere so one should expect extracted of the source were varied between the datasets. The “Ideal reflection strength to also be constant under idealized XWATS” type used a source centered receiver array that aperture and imaging algorithm conditions. Maps of was 18.6 km by 3.5 km. The XWATS-1 type used a 16.6 reflection strength and structural deviation from the actual km by 2 km array with the source centered on one side. surface were produced (Figure 3). The XWATS-2 type used a 9.3 km by 3.5 km array with the source centered on the front of the cable. The NATS Results type used a 9.3 km by 1 km array with the source centered on the front of the cable. Figure 3 compares results for each data type. The results are arranged in a qualitative sense from best (top) to worst Type Sail Cable (bottom) quality. The top row of the figure shows from left Line to right the depth slice extracted from the model, with salt Spacing colored white; the reflectivity of the subsalt reflector; and Spacing Number Source the depth to the subsalt reflector. Variations in its WATS 150 m 50 m 373 Center reflectivity are less than 1%. The depth slices show Ideal XWATS 450 m 50 m 70 Center degradation from WATS to NATS as a loss of both salt XWATS 1 450 m 100 m 20 Side boundary reflection and sediment reflections. NATS can XWATS 2 450 m 100 m 35 Front not image parts of the salt and sediment reflections. It was NATS 450 m 100 m 10 Front possible to pick nearly all of the subsalt reflection in WATS image as shown by the second row under Table 1: This table shows the critical acquisition parameters for reflectivity. Likewise, the structural deviation from the each dataset type. See Figure 3 for a graphical representation of each type. actual reflecting surface (right column) for the WATS type is limited to less than 50 m (green to red color) for most of Each set of shots (full and subsets) was imaged with a one- the surface. That deviation is only two depth samples in way finite-difference shot migration and a single arrival the image and the model. Most of the deviation is caused Kirchhoff migration. No preprocessing of any kind was by interference with salt related multiples. As one shifts to applied to the data prior to imaging. the XWATS or NATS types the amount of pickable Velocity Reflectivity Depth Model Geometry ACTUAL L H WATS Best Ideal XWATS NA NA XWATS 1 XWATS 2 Worst NATS Figure 3: Comparison of shot migration imaging results for various acquisition geometries. Columns are (left to right) depth slice, acquisition geometry (source is black dot to cables in red), reflection strength (amplitude increases from red to black) and structural deviation from the actual surface (red to green is approximately less than 100 m).
  • 3. Modeling Case Study of a Subsalt Exploration Concept reflection decreases and the structural deviation increases. geology and the type of information available. Although Table 2 shows the percentage of reliably interpretable not discussed in the paper it is possible to use the results of reflection for each data type. All WATS-like data types are the modeling study in a value-of-information exercise to considerably better than the NATS type. further quantify a decision making process. Specific to the subject area it was shown that WATS Type % Accurately Imaged produces the highest quality image with certain types of WATS 83% XWATS a close second. The NATS geometry cannot Ideal XWATS 81% image significant portions of the subsalt geology. Shot XWATS 1 79% migration is preferred over Kirchhoff imaging if one can XWATS 2 67% accept loss of steep dip information and afford the extra NATS 55% cost to generate migrated gathers. Reflection amplitudes Table 2: Shown is the percentage of the subsalt reflection that was under salt in the image volumes were strongly influenced accurately pickable. by the overlying salt geometry. One should be very careful not to over interpret subsalt reflection amplitudes. Large The velocity model used to image data was perturbed as scale velocity errors do not significantly degrade WATS shown in Figure 4 and new images were computed for the image quality, although subsalt reflections are misplaced WATS and NATS data types. The viewer is looking which could alter an interpretation. Images with NATS upward toward the bottom of salt (gray surface). The red data are much more sensitive to any type of errors in the surface is a large scale deepening of the bottom of salt by salt geometry. as much as 1,500 m. The purple feature is not discussed Exact Perturbed here. Figure 5 compares sections extracted from four images: WATS with exact and perturbed models; NATS with exact and perturbed models. The perturbation in W bottom of salt is highlighted in red. It is clear that the A WATS data type can image the subsalt reflection well with T the perturbed model, although the reflection is misplaced. S The NATS data type can not image the entire subsalt reflection with the perturbed model. N A T S No reflection Figure 5: WATS and NATS images with the exact and perturbed models.. Acknowledgements Figure 4: Modified model. The authors thank ConocoPhillips Global New Venture Exploration office for their support and management of Conclusions ConocoPhillips for permission to publish this work. This study confirms as other authors have found that modeling can be used to provide quantitative information to influence the exploration decision process. Modeling is, relative to field acquisition, a cost effective method to estimate critical acquisition parameters and imaging decisions. One should expect to spend weeks to months on a modeling study depending on the complexity of the