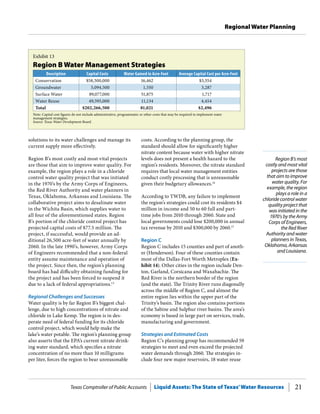
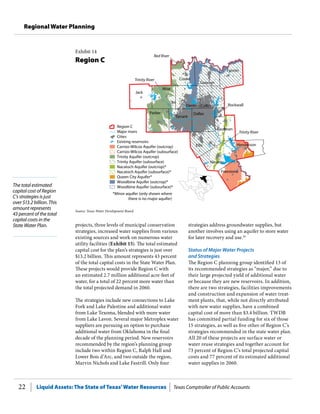
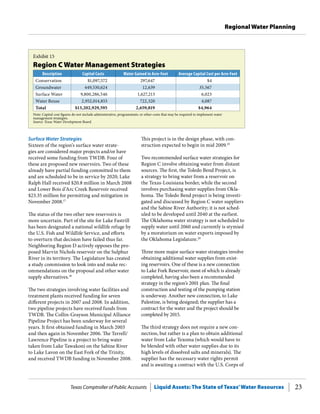
February 4, 2009
Ladies and Gentlemen:
As Texas’ chief fiscal officer, I am committed to creating an environment that encourages the Texas
economy to grow and thrive. One of my responsibilities is to analyze factors affecting the state’s
economy. Access to reliable sources of abundant clean water plays a key role in determining the future
success of Texas’ economy and the health of our citizens.
Our office presents the Liquid Assets: The State of Texas’ Water Resources, which discusses the current
and future water resources in Texas, the practical and policy barriers faced by local and state water
planners and the possible funding mechanisms that could be tapped to develop our water resources.
The report also provides information on the current status of water management strategies in the 16
water planning regions in the state. State and regional decision makers will be able to use this report
as a tool to drive sound and prudent water policy in the state.
This report evaluates the progress Texas is making in securing water resources for the future. Texas’
water resources are diverse and ever changing, since they are based upon climatic and demographic
fluctuations. Drought is an ever-present concern in many parts of the state, leading to pressure on our
water infrastructure. Texas’ population is growing at nearly twice the national rate and it is estimated
that by 2060 there will be more than 46 million people living in Texas, and the state will need ample
water supplies to serve them. According to the Texas Water Development Board demand for water will
increase 27 percent by 2060 and if demand is not met it could cost businesses and workers in the state
approximately $9.1 billion per year by 2010 and $98.4 billion per year by 2060.
Our economy always has and always will rely on clean and abundant water supplies. In addition, state
and local leaders must recognize that how they define ownership of groundwater could have enormous
economic consequences for property owners statewide. Important financial decisions have been based
on the belief by landowners that the water under their land is in fact their “property.” A change in this
system could have very significant and adverse financial consequences for individuals as well as for the
economic vitality of the state. Liquid Assets: The State of Texas’ Water Resources will help all Texas citizens
understand the importance of reliable water resources and what is being done now and in the future to
ensure those resources.
Our office stands ready to assist communities, businesses and lawmakers in their efforts to ensure our
state has the necessary water resources to continue our way of life. Together we can guarantee that Texas’
water resources remain plentiful for future generations.
Sincerely,
Susan Combs
Texas Comptroller of Public Accounts Liquid Assets: The State of Texas’Water Resources i
Table of Contents
Table of Contents
Introduction .  .  .  .  .  .  .  .  .  .  .  .  .  .  .  .  .  .  .  .  .  .  .  .  .  .  .  .  .  .  .  .  .  .  .  .  .  .  .  .  .  .  .  .  .  .  .  .  .  .  .  .  .  .  .  .  .  .  .  .  .  .  .  . 1
Water Supply and Demand in Texas . .  .  .  .  .  .  .  .  .  .  .  .  .  .  .  .  .  .  .  .  .  .  .  .  .  .  .  .  .  .  .  .  .  .  .  .  .  .  .  .  .  .  .  .  .  .  .  .  .  .  .  .  .  .  .  .  .  .  .  .  . 3
Demographics and Future Water Needs .  .  .  .  .  .  .  .  .  .  .  .  .  .  .  .  .  .  .  .  .  .  .  .  .  .  .  .  .  .  .  .  .  .  .  .  .  .  .  .  .  .  .  .  .  .  .  .  .  .  .  .  .  .  .  .  .  . 5
The Economic Consequences of Drought .  .  .  .  .  .  .  .  .  .  .  .  .  .  .  .  .  .  .  .  .  .  .  .  .  .  .  .  .  .  .  .  .  .  .  .  .  .  .  .  .  .  .  .  .  .  .  .  .  .  .  .  .  .  .  .  . 8
Regional Water Planning Process .  .  .  .  .  .  .  .  .  .  .  .  .  .  .  .  .  .  .  .  .  .  .  .  .  .  .  .  .  .  .  .  .  .  .  .  .  .  .  .  .  .  .  .  .  .  .  .  .  .  .  .  .  .  .  .  .  .  .  .  .  .  .  . 9
Conclusion  .  .  .  .  .  .  .  .  .  .  .  .  .  .  .  .  .  .  .  .  .  .  .  .  .  .  .  .  .  .  .  .  .  .  .  .  .  .  .  .  .  .  .  .  .  .  .  .  .  .  .  .  .  .  .  .  .  .  .  .  .  .  .  .  .  .  .  .  .  .  .  .  .  .  .  .  .  .  .  .  .  . 10
Regional Water Planning .  .  .  .  .  .  .  .  .  .  .  .  .  .  .  .  .  .  .  .  .  .  .  .  .  .  .  .  .  .  .  .  .  .  .  .  .  .  .  .  .  .  .  .  .  .  .  .  .  .  .  . 15
Water Management Strategies .  .  .  .  .  .  .  .  .  .  .  .  .  .  .  .  .  .  .  .  .  .  .  .  .  .  .  .  .  .  .  .  .  .  .  .  .  .  .  .  .  .  .  .  .  .  .  .  .  .  .  .  .  .  .  .  .  .  .  .  .  .  .  .  .  . 16
Conjunctive Use . .  .  .  .  .  .  .  .  .  .  .  .  .  .  .  .  .  .  .  .  .  .  .  .  .  .  .  .  .  .  .  .  .  .  .  .  .  .  .  .  .  .  .  .  .  .  .  .  .  .  .  .  .  .  .  .  .  .  .  .  .  .  .  .  .  .  .  .  .  .  .  .  . 16
Conservation  .  .  .  .  .  .  .  .  .  .  .  .  .  .  .  .  .  .  .  .  .  .  .  .  .  .  .  .  .  .  .  .  .  .  .  .  .  .  .  .  .  .  .  .  .  .  .  .  .  .  .  .  .  .  .  .  .  .  .  .  .  .  .  .  .  .  .  .  .  .  .  .  .  .  .  . 16
Desalination .  .  .  .  .  .  .  .  .  .  .  .  .  .  .  .  .  .  .  .  .  .  .  .  .  .  .  .  .  .  .  .  .  .  .  .  .  .  .  .  .  .  .  .  .  .  .  .  .  .  .  .  .  .  .  .  .  .  .  .  .  .  .  .  .  .  .  .  .  .  .  .  .  .  .  .  . 17
Groundwater  .  .  .  .  .  .  .  .  .  .  .  .  .  .  .  .  .  .  .  .  .  .  .  .  .  .  .  .  .  .  .  .  .  .  .  .  .  .  .  .  .  .  .  .  .  .  .  .  .  .  .  .  .  .  .  .  .  .  .  .  .  .  .  .  .  .  .  .  .  .  .  .  .  .  .  . 17
Surface Water  . .  .  .  .  .  .  .  .  .  .  .  .  .  .  .  .  .  .  .  .  .  .  .  .  .  .  .  .  .  .  .  .  .  .  .  .  .  .  .  .  .  .  .  .  .  .  .  .  .  .  .  .  .  .  .  .  .  .  .  .  .  .  .  .  .  .  .  .  .  .  .  .  .  .  . 18
Water Reuse  .  .  .  .  .  .  .  .  .  .  .  .  .  .  .  .  .  .  .  .  .  .  .  .  .  .  .  .  .  .  .  .  .  .  .  .  .  .  .  .  .  .  .  .  .  .  .  .  .  .  .  .  .  .  .  .  .  .  .  .  .  .  .  .  .  .  .  .  .  .  .  .  .  .  .  .  . 18
Regional Water Plans  .  .  .  .  .  .  .  .  .  .  .  .  .  .  .  .  .  .  .  .  .  .  .  .  .  .  .  .  .  .  .  .  .  .  .  .  .  .  .  .  .  .  .  .  .  .  .  .  .  .  .  .  .  .  .  .  .  .  .  .  .  .  .  .  .  .  .  .  .  .  .  .  . 18
Panhandle Region (A) . .  .  .  .  .  .  .  .  .  .  .  .  .  .  .  .  .  .  .  .  .  .  .  .  .  .  .  .  .  .  .  .  .  .  .  .  .  .  .  .  .  .  .  .  .  .  .  .  .  .  .  .  .  .  .  .  .  .  .  .  .  .  .  .  .  .  .  . 18
Region B . .  .  .  .  .  .  .  .  .  .  .  .  .  .  .  .  .  .  .  .  .  .  .  .  .  .  .  .  .  .  .  .  .  .  .  .  .  .  .  .  .  .  .  .  .  .  .  .  .  .  .  .  .  .  .  .  .  .  .  .  .  .  .  .  .  .  .  .  .  .  .  .  .  .  .  .  .  .  .  . 20
Region C  .  .  .  .  .  .  .  .  .  .  .  .  .  .  .  .  .  .  .  .  .  .  .  .  .  .  .  .  .  .  .  .  .  .  .  .  .  .  .  .  .  .  .  .  .  .  .  .  .  .  .  .  .  .  .  .  .  .  .  .  .  .  .  .  .  .  .  .  .  .  .  .  .  .  .  .  .  .  .  . 21
North East Texas Region (D) .  .  .  .  .  .  .  .  .  .  .  .  .  .  .  .  .  .  .  .  .  .  .  .  .  .  .  .  .  .  .  .  .  .  .  .  .  .  .  .  .  .  .  .  .  .  .  .  .  .  .  .  .  .  .  .  .  .  .  .  .  .  . 25
Far West Texas Region (E) .  .  .  .  .  .  .  .  .  .  .  .  .  .  .  .  .  .  .  .  .  .  .  .  .  .  .  .  .  .  .  .  .  .  .  .  .  .  .  .  .  .  .  .  .  .  .  .  .  .  .  .  .  .  .  .  .  .  .  .  .  .  .  .  . 26
Region F . .  .  .  .  .  .  .  .  .  .  .  .  .  .  .  .  .  .  .  .  .  .  .  .  .  .  .  .  .  .  .  .  .  .  .  .  .  .  .  .  .  .  .  .  .  .  .  .  .  .  .  .  .  .  .  .  .  .  .  .  .  .  .  .  .  .  .  .  .  .  .  .  .  .  .  .  .  .  .  . 28
Brazos Region (G)  .  .  .  .  .  .  .  .  .  .  .  .  .  .  .  .  .  .  .  .  .  .  .  .  .  .  .  .  .  .  .  .  .  .  .  .  .  .  .  .  .  .  .  .  .  .  .  .  .  .  .  .  .  .  .  .  .  .  .  .  .  .  .  .  .  .  .  .  .  .  .  . 30
Region H .  .  .  .  .  .  .  .  .  .  .  .  .  .  .  .  .  .  .  .  .  .  .  .  .  .  .  .  .  .  .  .  .  .  .  .  .  .  .  .  .  .  .  .  .  .  .  .  .  .  .  .  .  .  .  .  .  .  .  .  .  .  .  .  .  .  .  .  .  .  .  .  .  .  .  .  .  .  .  . 33
East Texas Region (I) . .  .  .  .  .  .  .  .  .  .  .  .  .  .  .  .  .  .  .  .  .  .  .  .  .  .  .  .  .  .  .  .  .  .  .  .  .  .  .  .  .  .  .  .  .  .  .  .  .  .  .  .  .  .  .  .  .  .  .  .  .  .  .  .  .  .  .  .  . 35
Plateau Region (J) . .  .  .  .  .  .  .  .  .  .  .  .  .  .  .  .  .  .  .  .  .  .  .  .  .  .  .  .  .  .  .  .  .  .  .  .  .  .  .  .  .  .  .  .  .  .  .  .  .  .  .  .  .  .  .  .  .  .  .  .  .  .  .  .  .  .  .  .  .  .  .  . 37
Lower Colorado Region (K)  .  .  .  .  .  .  .  .  .  .  .  .  .  .  .  .  .  .  .  .  .  .  .  .  .  .  .  .  .  .  .  .  .  .  .  .  .  .  .  .  .  .  .  .  .  .  .  .  .  .  .  .  .  .  .  .  .  .  .  .  .  .  . 38
South Central Texas Region (L) . .  .  .  .  .  .  .  .  .  .  .  .  .  .  .  .  .  .  .  .  .  .  .  .  .  .  .  .  .  .  .  .  .  .  .  .  .  .  .  .  .  .  .  .  .  .  .  .  .  .  .  .  .  .  .  .  .  .  .  . 41
Rio Grande Region (M)  .  .  .  .  .  .  .  .  .  .  .  .  .  .  .  .  .  .  .  .  .  .  .  .  .  .  .  .  .  .  .  .  .  .  .  .  .  .  .  .  .  .  .  .  .  .  .  .  .  .  .  .  .  .  .  .  .  .  .  .  .  .  .  .  .  .  . 43
Coastal Bend Region (N) .  .  .  .  .  .  .  .  .  .  .  .  .  .  .  .  .  .  .  .  .  .  .  .  .  .  .  .  .  .  .  .  .  .  .  .  .  .  .  .  .  .  .  .  .  .  .  .  .  .  .  .  .  .  .  .  .  .  .  .  .  .  .  .  .  . 45
Llano Estacado Region (O) . .  .  .  .  .  .  .  .  .  .  .  .  .  .  .  .  .  .  .  .  .  .  .  .  .  .  .  .  .  .  .  .  .  .  .  .  .  .  .  .  .  .  .  .  .  .  .  .  .  .  .  .  .  .  .  .  .  .  .  .  .  .  .  . 47
Lavaca Region (P) . .  .  .  .  .  .  .  .  .  .  .  .  .  .  .  .  .  .  .  .  .  .  .  .  .  .  .  .  .  .  .  .  .  .  .  .  .  .  .  .  .  .  .  .  .  .  .  .  .  .  .  .  .  .  .  .  .  .  .  .  .  .  .  .  .  .  .  .  .  .  .  . 48
State Water Plan: Issues and Funding . . . . . . . . . . . . . . . . . . . . . . . . . . . . . . . . . . . . . . . . 55
Reservoir Site Designation and Acquisition .  .  .  .  .  .  .  .  .  .  .  .  .  .  .  .  .  .  .  .  .  .  .  .  .  .  .  .  .  .  .  .  .  .  .  .  .  .  .  .  .  .  .  .  .  .  .  .  .  . 55
Interbasin Transfers of Surface Water  .  .  .  .  .  .  .  .  .  .  .  .  .  .  .  .  .  .  .  .  .  .  .  .  .  .  .  .  .  .  .  .  .  .  .  .  .  .  .  .  .  .  .  .  .  .  .  .  .  .  .  .  .  .  . 56
Groundwater Regulation in Texas . .  .  .  .  .  .  .  .  .  .  .  .  .  .  .  .  .  .  .  .  .  .  .  .  .  .  .  .  .  .  .  .  .  .  .  .  .  .  .  .  .  .  .  .  .  .  .  .  .  .  .  .  .  .  .  .  .  . 56
Environmental Water Needs .  .  .  .  .  .  .  .  .  .  .  .  .  .  .  .  .  .  .  .  .  .  .  .  .  .  .  .  .  .  .  .  .  .  .  .  .  .  .  .  .  .  .  .  .  .  .  .  .  .  .  .  .  .  .  .  .  .  .  .  .  .  . 57
Water Conservation . .  .  .  .  .  .  .  .  .  .  .  .  .  .  .  .  .  .  .  .  .  .  .  .  .  .  .  .  .  .  .  .  .  .  .  .  .  .  .  .  .  .  .  .  .  .  .  .  .  .  .  .  .  .  .  .  .  .  .  .  .  .  .  .  .  .  .  .  .  . 58
Expedited Amendment Process . .  .  .  .  .  .  .  .  .  .  .  .  .  .  .  .  .  .  .  .  .  .  .  .  .  .  .  .  .  .  .  .  .  .  .  .  .  .  .  .  .  .  .  .  .  .  .  .  .  .  .  .  .  .  .  .  .  .  .  . 58
Indirect Reuse  .  .  .  .  .  .  .  .  .  .  .  .  .  .  .  .  .  .  .  .  .  .  .  .  .  .  .  .  .  .  .  .  .  .  .  .  .  .  .  .  .  .  .  .  .  .  .  .  .  .  .  .  .  .  .  .  .  .  .  .  .  .  .  .  .  .  .  .  .  .  .  .  .  .  . 58
Liquid Assets: The State of Texas’Water Resources Texas Comptroller of Public Accountsii
Table of Contents
Financing Water Management Strategies  .  .  .  .  .  .  .  .  .  .  .  .  .  .  .  .  .  .  .  .  .  .  .  .  .  .  .  .  .  .  .  .  .  .  .  .  .  .  .  .  .  .  .  .  .  .  .  .  .  .  .  .  .  .  .  . 59
Current Water Project Financing .  .  .  .  .  .  .  .  .  .  .  .  .  .  .  .  .  .  .  .  .  .  .  .  .  .  .  .  .  .  .  .  .  .  .  .  .  .  .  .  .  .  .  .  .  .  .  .  .  .  .  .  .  .  .  .  .  .  . 59
Non-Self-Supporting GO Bond Programs . .  .  .  .  .  .  .  .  .  .  .  .  .  .  .  .  .  .  .  .  .  .  .  .  .  .  .  .  .  .  .  .  .  .  .  .  .  .  .  .  .  .  .  .  .  .  .  .  .  .  . 60
Self -Supporting Bond Programs  .  .  .  .  .  .  .  .  .  .  .  .  .  .  .  .  .  .  .  .  .  .  .  .  .  .  .  .  .  .  .  .  .  .  .  .  .  .  .  .  .  .  .  .  .  .  .  .  .  .  .  .  .  .  .  .  .  .  . 61
Federal Financial Assistance .  .  .  .  .  .  .  .  .  .  .  .  .  .  .  .  .  .  .  .  .  .  .  .  .  .  .  .  .  .  .  .  .  .  .  .  .  .  .  .  .  .  .  .  .  .  .  .  .  .  .  .  .  .  .  .  .  .  .  .  .  .  . 61
Proposed Revenue Sources . .  .  .  .  .  .  .  .  .  .  .  .  .  .  .  .  .  .  .  .  .  .  .  .  .  .  .  .  .  .  .  .  .  .  .  .  .  .  .  .  .  .  .  .  .  .  .  .  .  .  .  .  .  .  .  .  .  .  .  .  .  .  .  .  .  .  .  . 62
State Sales Tax Proposal .  .  .  .  .  .  .  .  .  .  .  .  .  .  .  .  .  .  .  .  .  .  .  .  .  .  .  .  .  .  .  .  .  .  .  .  .  .  .  .  .  .  .  .  .  .  .  .  .  .  .  .  .  .  .  .  .  .  .  .  .  .  .  .  .  .  . 63
Water Conservation and Development Fee Proposal  .  .  .  .  .  .  .  .  .  .  .  .  .  .  .  .  .  .  .  .  .  .  .  .  .  .  .  .  .  .  .  .  .  .  .  .  .  .  .  .  .  . 65
Water Rights Fee Proposal .  .  .  .  .  .  .  .  .  .  .  .  .  .  .  .  .  .  .  .  .  .  .  .  .  .  .  .  .  .  .  .  .  .  .  .  .  .  .  .  .  .  .  .  .  .  .  .  .  .  .  .  .  .  .  .  .  .  .  .  .  .  .  .  . 66
Water Connection Fee Proposal .  .  .  .  .  .  .  .  .  .  .  .  .  .  .  .  .  .  .  .  .  .  .  .  .  .  .  .  .  .  .  .  .  .  .  .  .  .  .  .  .  .  .  .  .  .  .  .  .  .  .  .  .  .  .  .  .  .  .  . 66
Sales Tax on Bottled Water Proposal .  .  .  .  .  .  .  .  .  .  .  .  .  .  .  .  .  .  .  .  .  .  .  .  .  .  .  .  .  .  .  .  .  .  .  .  .  .  .  .  .  .  .  .  .  .  .  .  .  .  .  .  .  .  .  . 67
Conclusion .  .  .  .  .  .  .  .  .  .  .  .  .  .  .  .  .  .  .  .  .  .  .  .  .  .  .  .  .  .  .  .  .  .  .  .  .  .  .  .  .  .  .  .  .  .  .  .  .  .  .  .  .  .  .  .  .  .  .  .  .  .  .  .  . 71
Conservation  .  .  .  .  .  .  .  .  .  .  .  .  .  .  .  .  .  .  .  .  .  .  .  .  .  .  .  .  .  .  .  .  .  .  .  .  .  .  .  .  .  .  .  .  .  .  .  .  .  .  .  .  .  .  .  .  .  .  .  .  .  .  .  .  .  .  .  .  .  .  .  .  .  .  .  .  .  .  .  . 72
Accountability .  .  .  .  .  .  .  .  .  .  .  .  .  .  .  .  .  .  .  .  .  .  .  .  .  .  .  .  .  .  .  .  .  .  .  .  .  .  .  .  .  .  .  .  .  .  .  .  .  .  .  .  .  .  .  .  .  .  .  .  .  .  .  .  .  .  .  .  .  .  .  .  .  .  .  .  .  .  . 72
Acknowledgements . .  .  .  .  .  .  .  .  .  .  .  .  .  .  .  .  .  .  .  .  .  .  .  .  .  .  .  .  .  .  .  .  .  .  .  .  .  .  .  .  .  .  .  .  .  .  .  .  .  .  .  .  .  .  .  . 73
Texas Comptroller of Public Accounts Liquid Assets: The State of Texas’Water Resources 1
Introduction
Each of the several
one- or two-year
droughts in Texas
in the past decade
has cost agricultural
producers and
businesses impacted
by them between $1
billion and $4 billion
annually.
Water is not only essential to life, it is essential
to our way of life. Moreover, it has no substitute.
Without it, our bodies won’t function, food
crops won’t grow, livestock and wildlife won’t
thrive, electricity can’t be generated, and indus-
tries and communities can’t grow.
The lack of water is costly. Each of the several
one- or two-year droughts in Texas in the past
decade has cost agricultural producers and
businesses impacted by them between $1 bil-
lion and $4 billion annually.1
The infamous
eight-year drought in the 1950s, the drought of
record against which all droughts in Texas are
measured, is estimated to have cost the Texas
economy about $3.5 billion in 2008 dollars each
year from 1950 to 1957.2
In 2002, an agency of the United Nations (U.N.)
estimated that 5 billion people in the world
would face severe water shortages by 2025 if
demand continues at current rates. The result-
ing effects of these shortages could be crop
failure, increased likelihood of disease and, in
the extreme, threatened stability of affected
governments.3
While Texas may avoid some of
the most severe consequences anticipated by
the U.N., water shortages in Texas could still
threaten the economy and public health of the
Lone Star State.
Historically, more people across the world
have lived in rural areas than urban ones, and
they depend on more diffuse sources of water.
By 2020, however, urban dwellers worldwide
will outnumber those living in rural areas.4
As
Introduction
Blanco River near Luckenbach, Texas.
Liquid Assets: The State of Texas’Water Resources Texas Comptroller of Public Accounts2
Introduction
Total statewide
demand for water
in Texas is projected
to grow 27 percent,
from nearly 17 million
acre-feet in 2000 to
21.6 million acre-feet
in 2060.
Without a significant, persistent climatologi-
cal change that brings increased moisture, this
growth is likely to mean that more people will
live with less water. Ensuring reliable water sup-
plies for the future, and balancing those supplies
appropriately between rural and urban areas,
and among agricultural, municipal, industrial
and electricity-generating users is the challenge
of our day.
To meet that challenge, Texas legislators estab-
lished a comprehensive water planning process
in 1997 which assesses current and future needs
in each of the state’s 16 Regional Water Planning
Groups (RWPGs), identifies potential solutions
people concentrate, so does their need for water,
making it increasingly difficult for communities
worldwide to provide sufficient amounts of water
for their residents.
Texans face the same challenges as the global
community. The state’s population is expected
to nearly double by 2060 and will also become
more urban.5
Total statewide demand for water
in Texas is projected to grow 27 percent, from
nearly 17 million acre-feet in 2000 to 21.6 mil-
lion acre-feet in 2060. From 2010 through 2060,
water supplies from existing sources are expect-
ed to decrease by 18 percent, from 17.9 million
acre-feet to 14.6 million acre-feet.6
Exhibit 1
Major Texas Aquifers
Sources: Texas Water Development Board.
Legend
Pecos Valley
Seymour
Gulf Coast
Carrizo - Wilcox (outcrop)
Carrizo - Wilcox (subcrop)
Hueco - Mesilla Bolson
Ogallala
Edwards - Trinity Plateau (outcrop)
Edwards - Trinity Plateau (subcrop)
Edwards BFZ (outcrop)
Edwards BFZ (subcrop)
(subcrop)
Trinity (outcrop)
Trinity
Texas Comptroller of Public Accounts Liquid Assets: The State of Texas’Water Resources 3
Introduction
The Texas Water
Development Board
estimates that
groundwater provides
59 percent of all
available fresh water in
the state, with surface
water providing the
nearly 40 percent,
and the remaining 1
percent coming from
both ground water and
surface water reuse
projects.
and estimates their cost, culminating in a State
Water Plan updated every five years.7
Liquid As-
sets: The State of Texas’ Water Resources evalu-
ates the progress that Texas has made toward
developing sustainable water supplies since
the issuance of the 2007 State Water Plan, with
particular emphasis on identifying policy and
funding barriers impeding that progress.
Water Supply and Demand in Texas
The Texas Water Development Board (TWDB),
the state agency responsible for providing “lead-
ership, planning, financial assistance, informa-
tion, and education for the conservation and
responsible development of water for Texas,” es-
timates that groundwater provides 59 percent of
all available fresh water in the state, with surface
water providing the nearly 40 percent, and the
remaining 1 percent coming from both ground
water and surface water reuse projects. Unfortu-
nately, both water sources are decreasing — the
former due to pumping in excess of recharge,
and the latter primarily because of sediment ac-
cumulation in reservoirs.8
Exhibits 1 and 2 show
the major aquifers and river basins in Texas.
Exhibit 2
Major River Basins of Texas
Source: Texas Water Development Board.
Liquid Assets: The State of Texas’Water Resources Texas Comptroller of Public Accounts4
Introduction
Exhibit 3
Estimated Per Capita Water Use, 2000-2060
40 Largest Texas Cities Ranked by Gallons Used Per Day Per Person in 2060
City 2000 2020 (est.) 2040 (est.) 2060 (est.)
Richardson 282 278 274 272
Dallas 262 262 257 256
Plano 256 253 250 249
Tyler 261 255 249 248
Midland 262 254 248 247
McKinney 220 244 242 242
Irving 220 223 218 217
Brownsville 229 221 217 216
College Station 225 217 213 212
Sugar Land 221 214 211 211
Fort Worth 215 207 203 202
Amarillo 256 201 201 201
Beaumont 216 209 203 201
Lubbock 181 202 196 195
Odessa 208 202 195 194
McAllen 205 197 193 192
Round Rock 201 194 191 191
Laredo 200 192 189 188
San Angelo 162 193 187 186
Waco 183 183 183 183
Carrollton 189 188 184 183
Denton 189 179 176 176
Arlington 165 179 175 174
El Paso 184 176 171 170
Lewisville 167 173 171 170
Austin 175 173 171 169
Wichita Falls 188 172 170 168
Killeen 132 179 174 167
Corpus Christi 179 171 166 165
Garland 159 160 156 155
Abilene 304 161 155 154
Mesquite 160 157 153 152
Houston 159 152 147 146
Harlingen 156 149 144 143
Grand Prairie 153 145 142 141
Bryan 147 140 135 134
San Antonio 147 139 135 134
Baytown 147 140 134 133
Longview 127 120 115 115
Pasadena 117 110 105 104
Average 195.2 189.1 185 183.9
Note: Water use projections from 2020 through 2060 rely on per capita use in 2000 as a baseline. According to TWDB, 2000 was a hot and dry
year when much of the state was experiencing a drought. Consequently, year 2000 water use tended to be relatively high across the state.
Source: Texas Water Development Board.
Texas Comptroller of Public Accounts Liquid Assets: The State of Texas’Water Resources 5
Introduction
The Texas population
will more than double
between 2000 and
2060, from 21 million
to 46 million people.
Based on current conditions, TWDB models
suggest existing groundwater supplies provide
8.5 million acre-feet. As the state’s major aqui-
fers are used increasingly for irrigation, mu-
nicipal and industrial use, TWDB projects a 32
percent decline in supply from 8.5 to 5.8 million
acre-feet by 2060.9
As of 2010, Texas is projected to have approxi-
mately 13.3 million acre-feet of total surface
water available during times of drought, al-
though some 20 million acre-feet are permitted
for consumption annually. According to TWDB,
only 9 million acre-feet of this amount can be
considered existing supply due to legal and other
constraints. By 2060, in periods of drought
surface water sources are expected to decrease 7
percent, from around 9 million acre-feet to 8.4
million acre-feet.10
This decline in supply will be
the result of reservoir sedimentation, a process
in which eroded sediments accumulate in reser-
voirs, eventually making the reservoirs shal-
lower. In 2060, the total amount of surface water
is projected to decrease to approximately 13.1
million acre-feet in non-drought conditions.11
While water supplies decrease, demand is
expected to increase due largely to population
growth. Per capita use among the 40 largest
cities in Texas in 2000 averaged just over 195
gallons per day per person, while conservation
recommendations aim to reduce demand by
1 percent annually to reach a future statewide
average of 140 gallons per capita per day.12
How-
ever, TWDB’s projections based on the 40 largest
Texas cities suggest that conservation efforts will
be far short of that mark. It should also be noted
that basic projections of per capita water use do
not take into account water conservation strate-
gies, which are anticipated for most cities in 15
of the 16 regions (Exhibit 3).13
In addition to conservation, increased efficiency
in delivery of water, especially for agricultural
uses, is critical to the future of Texas.
Demographics and Future
Water Needs
According to projections from TWDB and the
Texas State Data Center, the Texas population
will more than double between 2000 and 2060,
Exhibit 4
Texas Population Growth by Water
Planning Region, 2000-2060 (Projected)
0
50
100
150
200
250%
Percentgrowthinpopulation
Water Planning Region
A B C D E F G H I J K L M N O P Texas
52.0
9.8
149.1
72.3
116.6
25.1
105.4
124.7
46.6
79.5
139.7
110.4
209.5
63.7
21.5
3.3
118.5
Source: Texas Water Development Board.
F G
A
I
C
H
J
B
E
O
L
M
N
K
D
P
Liquid Assets: The State of Texas’Water Resources Texas Comptroller of Public Accounts6
Introduction
If new management
and conservation
strategies are not
implemented, water
shortages would
leave 85 percent of
the Texas population
in 2060 with
insufficient supplies.
to decrease from 17.9 million acre-feet in 2010
to 14.6 million acre-feet in 2060, an 18 percent
drop. The overall existing water supplies consist
of the amount that can be produced with cur-
rent permits, current contracts and the existing
infrastructure during droughts.15
Texas does not have enough water now to fulfill
all of its estimated future needs. If new man-
agement and conservation strategies are not
implemented, water needs will increase from 3.7
million acre-feet in 2010 to 8.8 million acre-feet
in 2060 (Exhibit 6). These water shortages would
leave 85 percent of the Texas population in 2060
with insufficient supplies.
Insufficient water supplies can harm the Texas
economy in a number of ways. According to
TWDB, “without water, farmers cannot ir-
rigate, refineries cannot produce gasoline, and
paper mills cannot make paper.” Economically,
insufficient water supplies could cost Texans $9.1
billion in 2010 and $98.4 billion in 2060. State
from 21 million to 46 million people. This growth
will vary widely across the state. Exhibit 4 shows
population growth across the 16 water planning
regions. Eight regions, which include most of
the state’s metropolitan areas, are expected to at
least double in population during this period. The
population in Region M, which includes Browns-
ville-Harlingen, Laredo and McAllen, is expected
to triple during this period.
Demand for water will not increase as rapidly as
population growth, largely due to decreases in
irrigation. Demand growth for water will come
from the municipal sector (which is made up
primarily of household and commercial uses),
doubling from 4 million acre-feet to 8.3 million
acre-feet (Exhibit 5). Water use for irrigation
is expected to decline from 10.2 to 8.6 million
acre-feet during this period due to more efficient
irrigation systems, reduced groundwater sup-
plies and transfer of water rights from agricul-
ture to municipal uses, according to TWDB.14
Overall existing water supplies are projected
San Antonio and the Edwards Aquifer: Striking a Groundwater Balance
Dependent upon the abundant Edwards Aquifer for more than a century, the growing city of San Antonio
and neighboring cities and rural areas have made a concerted effort in recent years to lessen their use of
water from the Edwards.
The Edwards Aquifer provides water to many people throughout the Hill Country, not just San Antonio. The
area has experienced tremendous growth in recent years, and water use has been apportioned carefully.
After many legal proceedings, the Edwards Aquifer Authority, operating since 1996 as a successor to the
Edwards Underground Water District established in 1949, was created to regulate water withdrawals from
the aquifer, protect endangered species and preserve the aquifer for future generations.17
Adding to the management issues of the Edwards are concerns with hydrogeology. Even though the
aquifer recharges readily, it cannot recharge without rain, sometimes a rare commodity in Central Texas.
Continued pumping from the Edwards has exacerbated droughts in previous years. San Antonio city
leaders realized that the city’s long-term viability could not be assured with a water source that fluctuated
dramatically. As a result, the city, the San Antonio Water System and others have focused on conserva-
tion and are considering obtaining rights to more reliable surface waters from the Lower Colorado River
Authority and the Guadalupe-Blanco River Authority.
San Antonio’s efforts to use water from outside its metropolitan area have had some interesting policy and
political consequences. In 1997, the “junior water rights provision” of Senate Bill 1 strongly limited future
efforts to export surface water from outside its basin of origin, a management tool known as interbasin
transfer, or IBT (see Section 3). At the same time, neighboring counties feared the city would pump and
export groundwater from their county, so several created groundwater conservation districts to restrict such
activity. Although the city continues to wean itself from the Edwards Aquifer, it faces several formidable
challenges in its pursuit of replacement water sources.
Texas Comptroller of Public Accounts Liquid Assets: The State of Texas’Water Resources 7
Introduction
Exhibit 5
Texas Projected Water Demand by Category, 2000-2060
0
2
4
6
8
10
12
2000 2010 2020 2030 2040 2050 2060
Sources: Texas Water Development Board.
Irrigation
Municipal
Manufacturing
Steam-electric
Livestock
Mining
Demand for Water (millions of acre-feet)
Exhibit 6
Texas ProjectedWater Needs inTimes of Drought, 2010-2060
Water needs (millions of acre-feet)
2010 2020 2030 2040 2050 2060
3.7
4.9
5.9
6.9
7.8
8.8
Sources: Texas Water Development Board.
0
2
4
6
8
10
Liquid Assets: The State of Texas’Water Resources Texas Comptroller of Public Accounts8
Introduction
A report published
in 1959 cited an
estimated cumulative
agricultural loss in
Texas from 1950 to
1956 to be in excess of
$3 billion per year in
2008 dollars.
during the mid- 1950s hit Texas particularly
hard.25
This one was called “the worst drought
in recorded history” by the former Texas Water
Commission.26
Today this drought of record is
used as a model for the worst-case scenario in
most regional and state water plans.
Climatologists studying tree rings and other
indicators of past rainfall have discovered that a
Dust Bowl-scale drought is likely once or twice
a century, continuing a 400-year-old pattern.
In the past 800 years, two North American
droughts of 20 to 25 years in length occurred.27
So not only are droughts likely to be frequent in
the future, they could also persist long enough
to cause severe socioeconomic repercussions.
Should global climate change reduce rainfall
and increases surface water evaporation as many
experts fear, the impact could be even worse.
While water planners throughout the state pre-
pare for a future drought of record, history has
demonstrated repeatedly that many droughts
end, rather ironically, with the appearance of
hurricanes, tropical storms and other flood
events.28
So, while we plan for too little water, we
must also plan for too much.
Drought losses are felt first, most often and most
severely in the agricultural sector. The economic
impact of the 1950s drought can be drawn indi-
rectly by studying meteorological or agricultural
production data of the time. A report by the Texas
Board of Water Engineers, published in 1959,
government could lose $466 million in tax rev-
enue in 2010 and up to $5.4 billion by 2060 due
to decreased business activity as a direct result of
insufficient supply.16
New management and conservation strategies
identified by the regional planning groups in the
State Water Plan could add 9 million acre-feet of
water supply by 2060. However, even with these
new water supplies, while some regions will
have their projected demands met, other regions
in Texas will have unmet needs because cost-
effective strategies to increase supply could not
be identified.22
The Economic Consequences
of Drought
The American Meteorological Society defines
drought as “a period of abnormally dry weather
sufficiently prolonged for the lack of water to
cause serious hydrologic imbalance in the affect-
ed area.”23
Droughts can be meteorological (less
than normal precipitation), agricultural (soil
moisture insufficient to grow crops), hydrologi-
cal (below normal surface and subsurface water
supplies) and/or socioeconomic (when water
shortages begin to affect daily life).24
Policymakers look to the “drought of record” as
a yardstick for estimating water needs during
future droughts. The first drought of record was
the Dust Bowl of the 1930s, which covered 70
percent of the U.S. An even more severe drought
Georgia’s Drought Crisis
Georgia has been experiencing a severe drought that has caused significant harm to that state’s economy.
In testimony before a Congressional field hearing in March 2008, the General of the area U.S. Corps of
Engineers stated that lakes in Georgia, Alabama and Florida were for the first time experiencing “negative
inflows,” meaning that “there was more water leaving the system through evaporation than was…coming
into the system” through rainfall.18
Water management in Georgia is very different than in Texas because the management of certain lake
waters include laws that require water releases to protect endangered species downstream in Alabama
and Florida. Business interests affiliated with West Point Lake in northwest Georgia estimated that dimin-
ished economic activity resulting from the low water level at West Point Lake cost between $800 million
and $1.1 billion for 2006-07.19
Of the state’s 159 counties, 40 were in moderate to extreme drought as of
October 2008.20
The cities of Atlanta, Athens, Augusta, Columbus and Macon are engaged in significant
water conservation efforts.21
Texas Comptroller of Public Accounts Liquid Assets: The State of Texas’Water Resources 9
Introduction
Regional Water Planning Process
According to TWDB, the goal of the water plan-
ning process is to ensure “that Texas will have
enough water in the future to sustain our cities
and rural communities, our farms and ranches,
our businesses and industries, and the environ-
ment.”31
Based on the state’s growing population
and vulnerability to drought, water planning in
Texas takes on an important dimension.
In 1997, the Texas Legislature enacted Senate Bill
1, which directed TWDB to designate the areas
for which regional water plans should be devel-
oped — in essence, creating 16 regional water
planning groups and established a water planning
process that occurs in 5-year increments and is
based on a 50-year planning horizon. Under the
bill, water planning in Texas is a collaborative,
statewide initiative. Texas uses a “bottom-up” ap-
proach to water planning rooted in local, consen-
sus-based decision-making. Each regional water
planning group includes members representing
various stakeholders, including agriculture,
cited an estimated cumulative agricultural loss in
Texas from 1950 to 1956 to be in excess of $3 bil-
lion,29
the equivalent of more than $24 billion, or
almost $3.5 billion annually, in 2008 dollars.30
Exhibit 7 shows the effect that the drought of
the 1950s had on net cash farm income in Texas,
which excludes most governmental sources of
income for farmers. Drought swept across the
state starting in 1950. Within three years annual
farm income decreased below 1949 levels and
remained low until the drought lifted. This indi-
cates that this severe drought had a pronounced
negative impact on the agricultural sector of the
Texas economy.
Data from Texas A&M University’s Department
of Agricultural Economics indicate that recent,
less severe droughts have had significant econom-
ic effects on the state’s agricultural sector. Exhibit
8 shows the estimated losses suffered by produc-
ers during several one-year droughts in the past
12 years. Losses of $1 billion or more occurred in
five separate years between 1996 and 2008.
Exhibit 7
Texas Farm Gross Cash Income Index 1949-1963
0.6
0.8
1.0
1.2
1.4
1.6
196319621961196019591958195719561955195419531952195119501949
Note: Annual values are indexed to 1949 dollars.
Sources: U.S. Bureau of Economic Analysis and Comptroller of Public Accounts.
(Drought of Record)
1.0 = $1 in 1949
Liquid Assets: The State of Texas’Water Resources Texas Comptroller of Public Accounts10
Introduction
Providing adequate
freshwater supplies
for the future is a
critical task that
Texas must confront
head-on.
efforts will have on local and statewide water
supplies. In addition, these entities also must
consider the impact their actions could have
on a landowner’s private property rights in the
water on or under their land, as well as any
potential economic impact.
The following sections will take a more in-depth
look at the challenges facing Texas regarding wa-
ter policy. Regional Water Planning of the report
reviews the challenges faced by each of the state’s
16 regional water planning groups, and provides
an update on the progress each group has made
in addressing its water needs.
State Water Plan: Issues and Funding looks at
several of the water policy issues that need to
be confronted to ensure that Texas has suffi-
cient water in the future. This includes a look at
various proposals to create a dedicated funding
mechanism for water projects and an examina-
tion of water infrastructure funding mecha-
nisms in other states.
industry, the environment, cities, water utilities,
power companies and other interests.32
Using data from the Texas State Data Center
and TWDB, each planning group evaluates
population, water demand and water supply
projections, along with potential strategies to
meet demands over a 50-year planning horizon.
After this process is complete, TWDB compiles
regional plans from each of the 16 areas into the
State Water Plan. These strategies and projects
are submitted to the Legislature, along with
policy recommendations needed to implement
the plan. After the plan is published, the plan-
ning process repeats. Exhibit 9 shows the water
planning regions in the state.
Conclusion
Providing adequate freshwater supplies for
the future is a critical task that Texas must
confront head-on. The needs are great and
varied, and meeting them will be both daunt-
ing and expensive. State and local water
management entities must evaluate the need
for developing new water resources while at the
same time determine what effect conservation
Exhibit 8
Texas Agriculture Producer Losses Due to Drought, 1996-2008
(in millions)
1996 1998 2000 2006 2008
$2,093 $2,103
$1,096
$4,100
$1,360
Sources: Texas A&M University.
0
1000
2000
3000
4000
$5000
Texas Comptroller of Public Accounts Liquid Assets: The State of Texas’Water Resources 11
Introduction
Endnotes
1
	 Blair Fannin, “2008 Texas Drought Losses Estimated
at $1.4 Billion,” AgNews: News and Public Affairs,
Texas A&M AgriLife, (September 8, 2008), p. 1, http://
agnews.tamu.edu/showstory.php?id=710. (Last visited
December 29, 2008.) ; Blair Fannin, “Texas Drought
Losses Estimated at $4.1 Billion,” AgNews: News
and Public Affairs, Texas A&M University System
Agriculture Program, (August 11, 2006), p. 1, http://
agnewsarchive.tamu.edu/dailynews/stories/DRGHT/
Aug1106a.htm. (Last visited December 29, 2008.)
2
	 Robert L. Lowry, Jr., Bulletin 5914: A Study of
Droughts in Texas (Austin, Texas: Texas Board of
Water Engineers, December 1959), p. 1; and U.S.
Bureau of Labor Statistics, “Inflation Calculator,”
http://data.bls.gov/cgi-bin/cpicalc.pl. (Last visited
December 29, 2008.)
3
	 International Atomic Energy Agency, “World Water
Day 2002: Water for Development,” p.1, http://
waterday2002.iaea.org/English/PressReleaseE.html.
(Last visited December 29, 2008.) (Press release.)
4
	 UNESCO, 2003 International Year of Freshwater,
“Water for Our Future: What Are the Trends?” pp.
2-3, http://www.wateryear2003.org/en/ev.php-
URL_ID=3697&URL_DO=DO_TOPIC&URL_
SECTION=201.html. (Last visited December 29,
2008.)
5
	 Texas Water Development Board, Water for Texas
2007 (Austin, Texas, January 2007), Volume II, pp.
120-121, http://www.twdb.state.tx.us/publications/
reports/State_Water_Plan/2007/2007StateWaterPlan/
CHAPTER%204_Final_112806.pdf. (Last visited
December 29, 2008.)
6
	 Texas Water Development Board, Water for
Texas 2007, Volume I, p. 2, http://www.twdb.
Exhibit 9
Water Planning Regions
Sources: Texas Water Development Board.
Region F
Brazos G
Panhandle (A)
East
Texas (I)
Region C
Region H
Plateau (J)
Region B
Far West
Texas (E)
Llano
Estacado (O)
South Central
Texas (L)
Rio
Grande
(M)
Coastal
Bend (N)
Lower
Colorado (K)
North
East
Texas (D)
Lavaca
(P)
Liquid Assets: The State of Texas’Water Resources Texas Comptroller of Public Accounts12
Introduction
state.tx.us/publications/reports/State_Water_
Plan/2007/2007StateWaterPlan/vol%201_FINAL%20
113006.pdf. (Last visited December 29, 2008.)
7
	 Texas Water Development Board, Water for Texas
2007, Volume II, pp. 115-116, http://www.twdb.
state.tx.us/publications/reports/State_Water_
Plan/2007/2007StateWaterPlan/CHAPTER%203%20
final_102806.pdf. (Last visited December 29, 2008).
8
	 Texas Water Development Board, “About the Texas
Water Development Board,” p. 1, http://www.twdb.
state.tx.us/about/aboutTWDBmain.asp. (Last visited
December 29, 2008); and Texas Water Development
Board, Water for Texas 2007, Volume II, p. 138,
http://www.twdb.state.tx.us/publications/reports/
State_Water_Plan/2007/2007StateWaterPlan/
CHAPTER%206%20FINAL_112906.pdf. (Last visited
December 29, 2008); and Texas Water Development
Board, Water for Texas 2007, Volume II, pp. 176,
222-224, http://www.twdb.state.tx.us/publications/
reports/State_Water_Plan/2007/2007StateWaterPlan/
CHAPTER%207%20FINAL_112906.pdf. (Last visited
December 29, 2008.)
9
	 Texas Water Development Board, Water for Texas
2007, Volume II, p. 176.
10
	 Texas Water Development Board, Water for Texas
2007, Volume II, p. 138.
11
	 Texas Water Development Board, Water for
Texas 2007, Volume II, p. 172. http://www.twdb.
state.tx.us/publications/reports/State_Water_
Plan/2007/2007StateWaterPlan/CHAPTER%206%20
FINAL_112906.pdf. (Last visited December 29, 2008.)
12
	 Texas Water Conservation Implementation Task
Force, Report to the 79th Legislature, (Austin, Texas:
Texas Water Development Board, November 2004),
pp. 14, 32-33, http://www.twdb.state.tx.us/assistance/
conservation/TaskForceDocs/WCITF_Leg_Report.
pdf. (Last visited December 29, 2008.)
13
	 Texas Water Development Board, Water for
Texas 2007, Volume II, p. 128, http://www.twdb.
state.tx.us/publications/reports/State_Water_
Plan/2007/2007StateWaterPlan/CHAPTER%204_
Final_112806.pdf. (Last visited December 29, 2008.)
14
	 Texas Water Development Board, Water for Texas
2007, Volume II, pp. 120-122. http://www.twdb.
state.tx.us/publications/reports/State_Water_
Plan/2007/2007StateWaterPlan/CHAPTER%204_
Final_112806.pdf. (Last visited December 29, 2008.)
15
	 Texas Water Development Board, Water for
Texas 2007, Volume I, p. 4. http://www.twdb.
state.tx.us/publications/reports/State_Water_
Plan/2007/2007StateWaterPlan/vol%201_FINAL%20
113006.pdf. (Last visited December 29, 2008.)
16
	 Texas Water Development Board, Water for
Texas 2007, Volume II, p. 246. http://www.twdb.
state.tx.us/publications/reports/State_Water_
Plan/2007/2007StateWaterPlan/CHAPTER%20
9_112806.indd.pdf. (Last visited December 29, 2008.)
17
	 Edwards Aquifer Authority, “EAA Act/Mission and
Goals,” p. 1, http://www.edwardsaquifer.org/pages/
eaaact.htm. (Last visited December 29, 2008.)
18
	 U.S. House of Representatives, Committee on Small
Business, Full Committee Field Hearing on the Impact
of the 2006-2007 Drought on Georgia’s Economy
(Washington, D.C.: U.S. Government Printing
Office, March 2008), p. 21, http://frwebgate.access.
gpo.gov/cgi-bin/getdoc.cgi?dbname=110_house_
hearings&docid=f:41331.pdf. (Last visited December
30, 2008.)
19
	 U.S. House of Representatives, Committee on Small
Business, Full Committee Field Hearing on the Impact
of the 2006-2007 Drought on Georgia’s Economy, p. 4.
20
	 David Emory Stooksbury, “Georgia’s Drought Gets
Worse in Dry September: Tropical Rain Relief Gone,”
Georgia Faces: News to Use About Georgia Family,
Agricultural, Consumer & Environmental Sciences
(October 1, 2008), pp. 1-2 , http://georgiafaces.caes.
uga.edu/storypage.cfm?storyid=3527. (Last visited
December 30, 2008.) ; and GeorgiaInfo, “Georgia
Counties Ranked by Area,” pp. 1-4, http://georgiainfo.
galileo.usg.edu/gacountiesbyarea.htm. (Last visited
December 30, 2008.)
21
	 David Emory Stooksbury, “Georgia’s Drought Gets
Worse in Dry September: Tropical Rain Relief Gone,”
p. 1.
22
	 Texas Water Development Board, Water for
Texas 2007, Volume I, pp. 5-7. http://www.twdb.
state.tx.us/publications/reports/State_Water_
Plan/2007/2007StateWaterPlan/vol%201_FINAL%20
113006.pdf. (Last visited December 30, 2008.)
23
	 American Meteorological Society, “Drought,”
in Glossary of Meteorology (Washington, D.C.,
2000), http://amsglossary.allenpress.com/glossary/
search?id=drought1. (Last visited December 30, 2008.)
24
	 National Weather Service Forecast Office, “What is
Meant by the Term Drought?” p. 1, http://www.wrh.
noaa.gov/fgz/science/drought.php?wfo=fgz. (Last
visited December 30, 2008.)
25
	 Sources vary in estimating the duration of the
drought of the 1950s. Some argue that the drought
began in 1949, not 1950, while others say it ended
in 1956, not 1957. Because droughts by their very
nature are transitory and do not affect every area of
the state equally, it is likely that all these dates are
accurate, depending upon locally available data. For
purposes of this report, the drought will be defined as
beginning in 1950 and ending in mid-1957 so that it
lasted a full seven years. All sources agree, however,
that the drought was most severe in 1956.
26
	 Texas Water Commission, Texas Drought: Its Recent
History (1931-1985) (Austin, Texas, September 1987),
p. 1.
27
	 Connie A. Woodhouse and David Rind, “A 2,000-Year
Record of Drought Variability in the Central United
States,” in History of Drought Variability in the Central
United States: Implications for the Future, United
States Global Change Research Program Seminar, 25
Texas Comptroller of Public Accounts Liquid Assets: The State of Texas’Water Resources 13
Introduction
January 1999, (Washington, D.C. 2003) p. 3, http://
www.usgcrp.gov/usgcrp/seminars/990120FO.html.
(Last visited December 30, 3008.)
28
	 Texas Water Commission, Texas Drought: Its Recent
History (1931-1985), p. 1.
29
	 Robert L. Lowry, Jr., Bulletin 5914: A Study of
Droughts in Texas, p. 1.
30
	 U.S. Bureau of Labor Statistics, “Inflation Calculator.”
31
	 Texas Water Development Board, Water for Texas
2007, Volume I, p. 2.
32
	 Texas Water Development Board, Water for Texas
2007, Volume II, pp. 2-4.
Liquid Assets: The State of Texas’Water Resources Texas Comptroller of Public Accounts14
Introduction
Texas Comptroller of Public Accounts Liquid Assets: The State of Texas’Water Resources 15
Regional Water Planning
Aerial view of dam in Canyon Lake, Texas.
The Texas Water Development Board’s
(TWDB’s) 2007 State Water Plan identifies 330
water management strategies from around the
state that could add about 9 million acre-feet an-
nually to the Texas water supply by 2060. Some
of these strategies require significant upfront
capital costs while others require users to pay
fees or provide incentives for users to change
their usage.
TWDB estimates that these projects — which
involve new reservoirs, desalination plants and
conveyance/distribution infrastructure conser-
vation measures and increased transfers between
river basins — would cost the state $30.7 billion
in current dollars by 2060. To put that figure in
perspective, the total fiscal 2008 state budget,
including federal funds, was $85.7 billion.
TWDB also estimates that the cost of not imple-
menting these strategies, assuming widespread
drought conditions, would be about $9.1 billion
in current dollars in 2010 and $98.4 billion in
2060. According to TWDB, if Texas fails to
implement the State Water Plan, drought in
2060 could mean that up to 85 percent of Texans
would not have enough water to sustain their
current levels of use during a report of drought
of record conditions.1
The economic impacts listed above are esti-
mates based on a variety of assumptions made
by TWDB and should only be considered as an
approximation of what these costs could be. To
generate the estimates above, TWDB assumed a
drought of record occurring in every part of the
state simultaneously. While not without prece-
dent, this is an unlikely proposition. The analysis
The 2007 State Water
Plan identifies 330
individual water
management
strategies from
around the state that
could add about
9 million acre-feet
annually to the Texas
water supply by 2060.
Liquid Assets: The State of Texas’Water Resources Texas Comptroller of Public Accounts16
Regional Water Planning
does not estimate the likelihood of a drought of
record occurring or discount costs based on the
likelihood of drought.
The analysis also assumes stability in water
usage patterns and does not consider the effect
that increasing costs for water during times of
shortage may have on water usage by commer-
cial, agricultural, residential and other users.
The model used by TWDB assumes that the
structure of the Texas economy will remain
constant over the next 50 years, and does not
predict migration of Texas citizens out of eco-
nomically inefficient industries.
Finally, the analysis assumes that economic
inputs such as labor move in “lockstep” with
changes in output. As acknowledged by TWDB,
however, there may be economic, contractual
and practical reasons why a business that was
negatively affected by drought likely would not
layoff its employees if the drought conditions
were expected to pass. Further, some employees
who are laid off likely would find jobs in other
sectors that were not harmed by drought, or
would find employment in different part of the
state. Thus, according to TWDB, “direct losses
for employment and secondary losses in sales
and employment should be considered an up-
per bound.”2
Water Management Strategies
Each of the more than 320 water management
strategies in the State Water Plan can be catego-
rized in one of six general areas: conjunctive use,
conservation, desalination, groundwater, surface
water and water reuse.
Conjunctive Use
Conjunctive use water management strategies
involve combining the use of groundwater and
surface water in a way that optimizes the ben-
efits of each. An example of conjunctive use is
when water providers use surface water as their
primary water supply and use groundwater only
to meet peak needs or to supplement supplies in
times of drought.
Conservation
Conservation generally involves the manage-
ment of existing water supplies to reduce de-
mand and increase efficiencies in use. The water
plan contains two key types of conservation:
municipal water conservation and irrigation
water conservation.
Municipal water conservation strategies attempt
to reduce water use in urban areas through a
variety of social or technological approaches.
Social approaches include changing water pric-
ing structures to encourage more efficient water
use and increasing awareness of the importance
of conservation through promotional and educa-
tional campaigns. Programs that explain water
bills, offer plant tours and school programs and
provide other educational and outreach activi-
ties have proven beneficial in increasing water
conservation. Technological approaches include
installing more efficient plumbing fixtures in
homes and businesses.
Specific municipal conservation strategies in
the 2007 State Water Plan include aggressive
water-wasting fixture replacement programs;
water-efficient landscaping codes; water loss and
leak detection programs; educational and public
awareness programs; rainwater harvesting; and
changes in water rate structures.
Irrigation water conservation involves increas-
ing the efficiency of water use in agricultural
operations. Approaches recommended in the
2007 water plan include:
•	 irrigation water use management, such as ir-
rigation scheduling, volumetric measurement
of water use, crop management (leaving suffi-
cient residue on the soil surface by eliminating
plowing to reduce wind and/or water erosion)
and on-farm irrigation water audits;
•	 land management systems, including furrow
dikes (small earthen dams), land leveling,
conversion from irrigated to dryland farming,
and brush control/management;
•	 on-farm delivery systems, such as lining of
farm ditches to catch rainfall and run off,
Texas Comptroller of Public Accounts Liquid Assets: The State of Texas’Water Resources 17
Regional Water Planning
In August 2007, Fort
Bliss and the City
of El Paso opened
the second largest
inland desalination
water plant in the
world. The Kay
Bailey Hutchison
Desalination Plant
produces 27.5
million gallons of
fresh water daily
using reverse
osmosis (RO).
thereby reducing water lost during transportation
or evaporation.
Desalination
Desalination is the process of converting salty
seawater or brackish (semi-saline) groundwater
into usable water.
Groundwater
Recommended water management strategies for
groundwater involve:
•	 drilling new wells and increasing pumping
from existing wells;
•	 temporarily overdrafting aquifers (that is
extracting more water than can be recharged),
during drought conditions to supplement
water supplies;
•	 expanding the capacity and number of water
treatment plants so that more groundwater
supplies can meet water quality standards; and
•	 supplementing water supplies in dry areas
with water from an area with a water surplus.
low-pressure sprinkler systems, drip/micro
irrigation systems; and
•	 water district delivery systems, including lin-
ing of district irrigation canals to reduce water
leakage and replacing irrigation district and
lateral canals with pipelines.
In addition to municipal and irrigation water
conservation, water consumption by manufac-
turing, mining and steam electrical generation
interests is a growing concern for the state. Some
regions have engaged in conservation efforts
in these areas, but such strategies tend to be
restricted to areas of the state with significant
concentrations of these industries.
Examples of conservation techniques used for
manufacturing, mining and steam electrical gen-
eration include using water that has a low mineral
content for cooling and stabilizing or minimiz-
ing variations in water levels to prevent the need
for large surges of water. For mining and steam
electrical generation, the primary conservation
technique is to develop more groundwater and
surface water supplies at or near the operation,
El Paso: New Water Sources
Nestled against the Rio Grande, the Franklin Mountains and the state of New Mexico in the Chihuahuan
Desert, the city of El Paso’s natural beauty has attracted settlers and tourists for centuries. But El Paso’s
location in the arid western part of the state creates a significant challenge — water supply.
El Paso receives an average of less than ten inches of rainfall annually, has no reservoirs and shares its
only surface water source — the Rio Grande — with both New Mexico and Mexico. As a result, the Rio
Grande is constrained by the U.S. Bureau of Reclamation and by an international treaty downstream.3
Just a few years ago, officials worried that El Paso would run out of water by 2020. However, aggressive
water conservation efforts coupled with the discovery of abundant, if brackish, groundwater in the
Hueco-Mesilla Bolson have provided the city with sufficient water supplies decades into the future.4
(“Bolson” means “basin”—the Hueco and Mesilla aquifers are separate aquifers that overlay each other
but have little interconnection.)5
In August 2007, Fort Bliss and the City of El Paso opened the second largest inland desalination water
plant in the world. The Kay Bailey Hutchison Desalination Plant produces 27.5 million gallons of fresh
water daily using reverse osmosis (RO). RO filters resemble thick rolls of wax paper through which
saline or semi-saline water is forced under high pressure, filtering out salt and other impurities. El Paso
Water Utilities estimates that about 83 percent of the brackish water put into the system is recovered as
potable water. The resulting concentrate is disposed of carefully in a disposal facility or underground
injection well.6
Liquid Assets: The State of Texas’Water Resources Texas Comptroller of Public Accounts18
Regional Water Planning
Even with full
implementation of
all these strategies,
Region A expects a
shortfall in irrigation
water of more than
300,000 acre-feet in
2060.
Panhandle Region (A)
Region A, also known as the Panhandle region,
consists of 21 counties and includes the cities of
Amarillo and Pampa (Exhibit 10). The region is
bisected by the Canadian River and gets nine-
tenths of its water from the Ogallala Aquifer.
Region A’s ten water management strategies are
focused mainly on conserving existing ground-
water supplies used by irrigators, developing
additional wells and encouraging voluntary
transfers among users.
The region also receives small amounts of water
from municipal and manufacturing conserva-
tion, water reuse projects and the Palo Duro Res-
ervoir. As such, its water management strategies
fall into four general categories: conservation,
desalination, groundwater and surface water
needs (Exhibit 11). Even with full implementa-
tion of all these strategies, the region expects
a shortfall in irrigation water of more than
300,000 acre-feet in 2060. Region A estimates its
management strategies will cost $562.4 million
through 2060.7
Surface Water
Surface water management strategies generally
consist of building new reservoirs; moving water
from one area to another through pipelines or
natural waterways; purchasing additional water
through contracts with major water providers;
obtaining additional water rights; and reallocat-
ing water in existing reser­voirs.
Water Reuse
Water reuse is simply the use of reclaimed water
— wastewater that has been treated to remove
solids and certain impurities, and then put to a
beneficial use. Such water can be used in irriga-
tion, cooling and washing.
Regional Water Plans
Each local planning group evaluates potentially
feasible water management strategies based on
its projected needs, and identifies the projects
needed to meet future water needs. TWDB
compiles plans from each of the state’s 16 regions
into the State Water Plan and submits the plan to
the Legislature, along with policy recommenda-
tions needed to implement it. A detailed look at
the cost and status of each region’s plan follows.
Cities
Hall
Dallam
Hartley
GrayOldham
Potter
Moore
Donley
Carson
Randall
Roberts
Wheeler
Hemphill
OchiltreeSherman Hansford Lipscomb
Armstrong
Hutchin-
son
Canadian River
Red River
Major rivers
Region A
Seymour Aquifer
Ogallala Aquifer
Existing reservoirs
Dockum Aquifer*
*Minor aquifer (only shown where
there is no major aquifer)
Child-
ress
Collings-
worth
Blaine Aquifer (subsurface)*
Blaine Aquifer (outcrop)*
Exhibit 10
Panhandle Region (A)
Source: Texas Water Development Board.
Texas Comptroller of Public Accounts Liquid Assets: The State of Texas’Water Resources 19
Regional Water Planning
The Panhandle region
shares an overriding
challenge with
Region O… Most of
the water supply for
both regions comes
from the Ogallala
Aquifer. This aquifer
is vast but recharges
very slowly, and its
water is being used
at an unsustainable
rate.
dents $384 million in income and 5,320 full- and
part-time jobs by 2010, and nearly $1.9 billion in
income and more than 30,000 jobs by 2060. In
addition, state and local governments could lose
$24 million in annual tax revenue by 2010 and
some $127 million by 2060.10
Regional Challenges and Successes
The Panhandle region shares an overriding chal-
lenge with Region O, the Llano Estacado region,
which borders it to the south; most of the water
supply for both regions comes from the Ogallala
Aquifer. This aquifer is vast but recharges very
slowly, and its water is being used at an unsus-
tainable rate. Unfortunately, the Panhandle
region’s planning group has been unable to
identify water management strategies that can
fully address the region’s water needs.
Given its dependence on the Ogallala, following
the region’s goal of depleting no more than 1.25
percent of its water supplies annually is difficult.
This is illustrated by the fact that one of its water
management strategies is “temporary overdraft,”
a strategy to use more than the recommended
annual amount of 1.25 percent, to meet the
needs of counties with inadequate supplies.
These two opposing objectives illustrate the
challenges that Region A faces in attempting to
balance present and future water requirements.
Several counties already lack sufficient water
supplies to meet their irrigation needs.
The Region A planning group notes that its report
represented a “worst-case” scenario which as-
sumes that, absent the strategies recommended in
the water plan, the region would take no actions
Status of Major Water Projects and Strategies
Region A’s conservation strategies are having only
limited success. Its strategies include municipal
conservation measures such as public aware-
ness programs and water audits; manufacturing
conservation efforts like using water with lower
mineral content; and irrigation conservation ef-
forts such as irrigation scheduling. The regional
water planning group has set a long-term goal to
deplete no more than 1.25 percent of the Ogallala
Aquifer’s water supplies per year. However, the
planning group reports that this restricted access
to the Ogallala Aquifer has made it difficult for
the region to produce adequate water supplies in
the short-term, and thus conservation measures
are having a limited positive impact. Even so,
the planning group estimates that its conserva-
tion strategies could save the region an estimated
288,476 acre-feet per year.8
Well development plans represent the region’s
most costly strategy. Costs to drill new ground-
water wells in Roberts County alone are esti-
mated at $164.3 million. Such cost estimates,
combined with the region’s limited ground-
water supplies, have made the board’s drilling
strategy difficult to implement thus far. The
region has, however, received a commitment of
nearly $23 million from the Texas Water De-
velopment Board to help fund new well drill-
ing in Potter County. Even with this strategy,
the region faces challenges in maintaining an
adequate water supply.9
According to TWDB, any failure to fully imple-
ment Region A’s strategies could cost area resi-
Exhibit 11
Panhandle Region (A) Water Management Strategies
Description Capital Costs Water Gained in Acre-Feet Average Capital Cost per Acre-Feet
Conservation $144,969,383 288,476 $503
Groundwater 343,380,400 117,220 2,929
Surface Water 72,265,600 3,750 19,271
Water Reuse 1,829,300 2,700 678
Total $562,444,683 412,146 $1,365
Note: Capital cost figures do not include administrative, programmatic or other costs that may be required to implement water
management strategies.
Source: Texas Water Development Board.
Liquid Assets: The State of Texas’Water Resources Texas Comptroller of Public Accounts20
Regional Water Planning
Region B’s 16 recommended water management
strategies include conservation, water reuse and
water quality improvements, as drought condi-
tions tend to produce high nitrate and chloride
concentrations in its water. Total capital costs for
all of Region B’s water management strategies
are estimated at just over $202.2 million.12
Al-
though the region’s water supplies will fall from
2010 to 2060, a projected decrease in demand
will allow the region to meet all its needs if its
recommended strategies are followed.
Region B’s strategies fall under four major cat-
egories: conservation, desalination, groundwater
and surface water (Exhibit 13).
Status of Water Project and Strategies
Region B’s planning group has recommended
four water conservation strategies, the largest
of which is a canal lining project that aims to
prevent water loss by improving the structural
integrity of irrigation canals. If fully imple-
mented, the canal lining project will save the
region an additional 15,700 acre-feet annually
by 2060. This project is long-term, as the region
plans to implement it by 2040. To meet more
immediate needs, however, Region B must find
to address shortages that might occur. Similarly,
the planning group observes that the shortage
estimates used in the report are fully cumulative.
For example, the planning group’s report assumes
that a shortage that is projected to begin in 2015
continues to exist through 2060. The planning
group also stated its estimates did not assume any
conversion to dryland farming. As the chairman
of the planning group said, “Some conversion to
dryland farming is already happening, and some
is returning to grass, too.”11
The Texas Panhandle has been part of the na-
tion’s breadbasket for many decades, thanks to
irrigation technology that converted dry grass-
lands to farmlands. How the region responds to
shrinking supplies of groundwater may be the
largest single factor in determining its future.
Region B
Region B is located in North Central Texas
and borders Oklahoma. The region consists
of 11 counties and contains a portion of three
major river basins. The area’s two major cities
are Wichita Falls and Vernon (Exhibit 12). Its
main industries include farming, ranching and
mineral production.
Clay
King
Cottle
Baylor
Archer
Wichita
Young
Cities
Red River
Major rivers
Region B
Trinity Aquifer (outcrop)
Seymour Aquifer
Existing reservoirs
Blaine Aquifer (subsurface)*
Blaine Aquifer (outcrop)*
Trinity Aquifer (subsurface)
*Minor aquifer (only shown where
there is no major aquifer)
Brazos River Trinity River
Wilbarger
Foard
Montague
Hardeman
Exhibit 12
Region B
Source: Texas Water Development Board.
Texas Comptroller of Public Accounts Liquid Assets: The State of Texas’Water Resources 21
Regional Water Planning
Region B’s most
costly and most vital
projects are those
that aim to improve
water quality. For
example, the region
plays a role in a
chloride control water
quality project that
was initiated in the
1970’s by the Army
Corps of Engineers,
the Red River
Authority and water
planners in Texas,
Oklahoma, Arkansas
and Louisiana.
costs. According to the planning group, the
standard should allow for significantly higher
nitrate content because water with higher nitrate
levels does not present a health hazard to the
region’s residents. Moreover, the nitrate standard
requires that local water management entities
conduct costly processing that is unreasonable
given their budgetary allowances.14
According to TWDB, any failure to implement
the region’s strategies could cost its residents $4
million in income and 50 to 60 full and part-
time jobs from 2010 through 2060. State and
local governments could lose $200,000 in annual
tax revenue by 2010 and $300,000 by 2060.15
Region C
Region C includes 15 counties and part of anoth-
er (Henderson). Four of these counties contain
most of the Dallas-Fort Worth Metroplex (Ex-
hibit 14). Other cities in the region include Den-
ton, Garland, Corsicana and Waxahachie. The
Red River is the northern border of the region
(and the state). The Trinity River runs diagonally
across the middle of Region C, and almost the
entire region lies within the upper part of the
Trinity’s basin. The region also contains portions
of the Sabine and Sulphur river basins. The area’s
economy is based in large part on services, trade,
manufacturing and government.
Strategies and Estimated Costs
Region C’s planning group has recommended 59
strategies to meet and even exceed the projected
water demands through 2060. The strategies in-
clude four new major reservoirs, 18 water reuse
solutions to its water challenges and manage its
current supply more effectively.
Region B’s most costly and most vital projects
are those that aim to improve water quality. For
example, the region plays a role in a chloride
control water quality project that was initiated
in the 1970’s by the Army Corps of Engineers,
the Red River Authority and water planners in
Texas, Oklahoma, Arkansas and Louisiana. The
collaborative project aims to desalinate water
in the Wichita Basin, which supplies water to
all four of the aforementioned states. Region
B’s portion of the chloride control project has
projected capital costs of $77.5 million. The
project, if successful, would provide an ad-
ditional 26,500 acre-feet of water annually by
2060. In the late 1990’s, however, Army Corps
of Engineers recommended that a non-federal
entity assume maintenance and operation of
the project. Since then, the region’s planning
board has had difficulty obtaining funding for
the project and has been forced to suspend it
due to a lack of federal appropriations.13
Regional Challenges and Successes
Water quality is by far Region B’s biggest chal-
lenge, due to high concentrations of nitrate and
chloride in Lake Kemp. The region is in des-
perate need of federal funding for its chloride
control project, which would help make the
lake’s water potable. The region’s planning group
also asserts that the EPA’s current nitrate drink-
ing water standard, which specifies a nitrate
concentration of no more than 10 milligrams
per liter, forces the region to bear unreasonable
Exhibit 13
Region B Water Management Strategies
Description Capital Costs Water Gained in Acre-Feet Average Capital Cost per Acre-Feet
Conservation $58,500,000 16,462 $3,554
Groundwater 5,094,500 1,550 3,287
Surface Water 89,077,000 51,875 1,717
Water Reuse 49,595,000 11,134 4,454
Total $202,266,500 81,021 $2,496
Note: Capital cost figures do not include administrative, programmatic or other costs that may be required to implement water
management strategies.
Source: Texas Water Development Board.
Liquid Assets: The State of Texas’Water Resources Texas Comptroller of Public Accounts22
Regional Water Planning
The total estimated
capital cost of Region
C’s strategies is just
over $13.2 billion. This
amount represents
43 percent of the total
capital costs in the
State Water Plan. strategies address groundwater supplies, but
another involves using an aquifer to store water
for later recovery and use.16
Status of Major Water Projects
and Strategies
The Region C planning group identified 13 of
its recommended strategies as “major,” due to
their large projected yield of additional water
or because they are new reservoirs. In addition,
there are two strategies, facilities improvements
and construction and expansion of water treat-
ment plants, that, while not directly attributed
with new water supplies, have a combined
capital cost of more than $3.4 billion. TWDB
has committed partial funding for six of those
15 strategies, as well as five other of Region C’s
strategies recommended in the state water plan.
All 20 of these projects are surface water or
water reuse strategies and together account for
73 percent of Region C’s total projected capital
costs and 77 percent of its estimated additional
water supplies in 2060.
projects, three levels of municipal conservation
strategies, increased water supplies from various
existing sources and work on numerous water
utility facilities (Exhibit 15). The total estimated
capital cost for the plan’s strategies is just over
$13.2 billion. This amount represents 43 percent
of the total capital costs in the State Water Plan.
These projects would provide Region C with
an estimated 2.7 million additional acre-feet of
water, for a total of 22 percent more water than
the total projected demand in 2060.
The strategies include new connections to Lake
Fork and Lake Palestine and additional water
from Lake Texoma, blended with more water
from Lake Lavon. Several major Metroplex water
suppliers are pursuing an option to purchase
additional water from Oklahoma in the final
decade of the planning period. New reservoirs
recommended by the region’s planning group
include two within Region C, Ralph Hall and
Lower Bois d’Arc, and two outside the region,
Marvin Nichols and Lake Fastrill. Only four
Exhibit 14
Region C
Ellis
Navarro
Jack
Parker
Collin
Cooke
Rockwall
Grayson
Tarrant
Dallas
Kaufman
Denton
Freestone
Fannin
Trinity River
Trinity River
Red River
*Minor aquifer (only shown where
there is no major aquifer)
Cities
Major rivers
Region C
Carrizo-Wilcox Aquifer (subsurface)
Carrizo-Wilcox Aquifer (outcrop)
Existing reservoirs
Nacatoch Aquifer (outcrop)*
Trinity Aquifer (subsurface)
Trinity Aquifer (outcrop)
Nacatoch Aquifer (subsurface)*
Queen City Aquifer*
Woodbine Aquifer (outcrop)*
Woodbine Aquifer (subsurface)*
Wise
Henderson
Source: Texas Water Development Board.
Texas Comptroller of Public Accounts Liquid Assets: The State of Texas’Water Resources 23
Regional Water Planning
This project is in the design phase, with con-
struction expected to begin in mid 2009.19
Two recommended surface water strategies for
Region C involve obtaining water from distant
sources. The first, the Toledo Bend Project, is
a strategy to bring water from a reservoir on
the Texas-Louisiana border, while the second
involves purchasing water supplies from Okla-
homa. The Toledo Bend project is being investi-
gated and discussed by Region C water suppliers
and the Sabine River Authority; it is not sched-
uled to be developed until 2040 at the earliest.
The Oklahoma water strategy is not scheduled to
supply water until 2060 and currently is stymied
by a moratorium on water exports imposed by
the Oklahoma Legislature.20
Three more major surface water strategies involve
obtaining additional water supplies from exist-
ing reservoirs. One of these is a new connection
to Lake Fork Reservoir, most of which is already
completed, having also been a recommended
strategy in the region’s 2001 plan. The final
construction and testing of the pumping station
is underway. Another new connection, to Lake
Palestine, is being designed; the supplier has a
contract for the water and the project should be
completed by 2015.
The third strategy does not require a new con-
nection, but rather is a plan to obtain additional
water from Lake Texoma (which would have to
be blended with other water supplies due to its
high levels of dissolved salts and minerals). The
supplier has the necessary water rights permit
and is awaiting a contract with the U.S. Corps of
Surface Water Strategies
Sixteen of the region’s surface water strate-
gies are considered major projects and/or have
received some funding from TWDB. Four of
these are proposed new reservoirs. Two of these
already have partial funding committed to them
and are scheduled to be in service by 2020; Lake
Ralph Hall received $20.8 million in March 2008
and Lower Bois d’Arc Creek Reservoir received
$23.35 million for permitting and mitigation in
November 2008.17
The status of the two other new reservoirs is
more uncertain. Part of the site for Lake Fastrill
has been designated a national wildlife refuge by
the U.S. Fish and Wildlife Service, and efforts
to overturn that decision have failed thus far.
Neighboring Region D actively opposes the pro-
posed Marvin Nichols reservoir on the Sulphur
River in its territory. The Legislature has created
a study commission to look into and make rec-
ommendations on the proposal and other water
supply alternatives.18
The two strategies involving water facilities and
treatment plants received funding for seven
different projects in 2007 and 2008. In addition,
two pipeline projects have received funds from
TWDB. The Collin-Grayson Municipal Alliance
Pipeline Project has been underway for several
years. It first obtained funding in March 2003
and then again in November 2006. The Terrell/
Lawrence Pipeline is a project to bring water
taken from Lake Tawakoni on the Sabine River
to Lake Lavon on the East Fork of the Trinity,
and received TWDB funding in November 2008.
Exhibit 15
Region C Water Management Strategies
Description Capital Costs Water Gained in Acre-Feet Average Capital Cost per Acre-Feet
Conservation $1,097,572 297,647 $4
Groundwater 449,530,624 12,639 35,567
Surface Water 9,800,286,546 1,627,213 6,023
Water Reuse 2,952,014,853 722,320 4,087
Total $13,202,929,595 2,659,819 $4,964
Note: Capital cost figures do not include administrative, programmatic or other costs that may be required to implement water
management strategies.
Source: Texas Water Development Board.
Liquid Assets: The State of Texas’Water Resources Texas Comptroller of Public Accounts24
Regional Water Planning
The rapid growth of
the Metroplex cities
within Region C poses
the biggest challenge
to its water planners.
Developing sufficient
water supplies for
the region is difficult,
time-consuming and
very expensive, as
demonstrated by the
recommended water
strategies.
the Trinity River; the water will be diverted
from the Trinity (the permit for which has been
granted to TRWD), piped into constructed
wetlands and then to the Richland-Chambers
and Cedar Creek reservoirs. The transmission
system and wetlands for Richland-Chambers
are completed; the Cedar Creek portion and
the “third pipeline” are in a later stage of the
project, scheduled for 2018.24
The last major reuse strategy in Region C is
very similar to the Richland-Chambers project
described above. The East Fork Reuse Proj-
ect will divert water from return flows to the
East Fork of the Trinity River; this project was
added to Region C’s 2001 plan by amendment
in 2005. The water will be piped to another
constructed wetlands for treatment and then
transferred to Lake Lavon. East Fork is nearing
completion and expected to begin delivering
water by the end of 2008.25
According to TWDB, if the strategies listed
above are not implemented, residents of Region
C could face losses of slightly more than $3
billion in income and 27,760 full and part time
jobs by 2010, and nearly $58.8 billion in income
and more than 691,000 jobs by 2060. In addi-
tion, state and local governments could lose $128
million in annual tax revenue by 2010 and more
than $2.5 billion by 2060.26
Regional Challenges and Successes
The rapid growth of the Metroplex cities within
Region C poses the biggest challenge to its water
planners. Developing sufficient water supplies
for the region is difficult, time-consuming and
very expensive, as demonstrated by the recom-
mended water strategies.
Most of the strategies in the 2006 regional plan,
as well as its 2001 predecessor, are being imple-
mented to some extent. Some of the proposed
projects, however, pose significant problems,
particularly the proposed Lake Fastrill reservoir
site to be located in a designated national wild-
life refuge, and the Marvin Nichols reservoir
site in Region D, which has specifically recom-
mended that the site not be included in the state
water plan.
Engineers for storing the water in Lake Texoma.
The project is scheduled to begin supplying
water by 2020.21
The last of the major surface strategies also
involves obtaining more water from an exist-
ing supply, in this case by raising the water level
and thus increasing the capacity in the Wright
Patman Reservoir. The water supplier plans to
build the transmission system to get the water to
Dallas by 2035 and shows the additional supply
in the region’s plan by 2040.22
Water Reuse Strategies
Region C’s plan contains three major reuse strat-
egies, two of which received some funding from
TWDB in 2008. In addition, a general reuse
strategy, “conveyance with infrastructure,” was
partially funded in 2007 and 2008. The funding
was designated for delivering reuse water to Fort
Worth supply facilities.
Dallas Water Utility (DWU) has multiple proj-
ects included within its reuse strategy, with a
total capital cost of nearly $455 million. One of
these is an indirect reuse project that would take
water from a DWU wastewater treatment plant
and pump it into an artificially constructed wet-
land. After the water is further cleaned through
filtering by the wetland, it will then be pumped
into Lake Ray Hubbard. This project was in the
region’s 2001 plan and is scheduled for 2012;
TWDB provided $16.6 million for it in 2008.
The wetland construction is already completed.
Another DWU project that received $30 million
from TWDB is the Cedar Crest Pipeline. This
direct reuse project is in operation, delivering
effluent for irrigation purposes (mostly on golf
courses); the 2008 funding was for pipeline con-
struction to take the water to more golf courses,
parks and possibly industrial plants.23
The other reuse strategy that received par-
tial funding from TWDB in 2008 is Tarrant
Regional Water District’s (TRWD) “Third
Pipeline and Reuse” project. This project was
in an experimental stage starting in the 1990s,
demonstrating the use of constructed wetlands
for water treatment, and is now is progressing
towards completion of stage one of the project.
It involves indirect reuse of return flows into
Texas Comptroller of Public Accounts Liquid Assets: The State of Texas’Water Resources 25
Regional Water Planning
industries are agriculture, oil and natural gas
production, forestry and power generation.
To meet the region’s projected water demands
in 2060, the Region D planning group recom-
mended seven water management strategies that
would provide 108,742 acre-feet of additional
water supply by 2060. The projected total capital
cost for these projects would be approximately
$32.5 million. The region’s water management
strategies fall into two general areas, groundwa-
ter and surface water (Exhibit 17).28
Status of Major Water Projects
and Strategies
The most costly strategy in Region D’s plan
involves new groundwater wells, many of them
being drilled by Crooked Creek Water Supply
Company over the Carrizo-Wilcox aquifer.
Some of these wells have already been com-
pleted. A project to drill two additional wells
in Wood County, for example, was completed
in 2008 at a cost of about $1.5 million. Other
projects are in progress and still others are in
the planning stages, with additional wells to be
drilled as needed.29
Other obstacles to Region C’s plan include state
restrictions on transfers of water between river
basins; difficulties in obtaining surface water
rights for smaller water suppliers that previously
relied on groundwater sources that are dimin-
ishing; and the high-costs of various anticipated
construction projects.
Even so, Region C has made significant progress
on several of its water management strategies.
Five water reuse projects have been permitted
and are projected to provide 540,000 acre-feet
of water annually to the region. In addition, six
new connections to existing supplies have been
completed, and a seventh is nearing completion.
These resources should bring 351,100 acre-feet of
new supplies to the region annually.”27
North East Texas Region (D)
Region D, also known as the North East Texas
region, comprises 19 counties as well as the
cities of Longview, Marshall, Greenville and
Texarkana (Exhibit 16). Large portions of the
Red, Cypress, Sulphur and Sabine river basins
and smaller portions of Trinity and Neches river
basins are located in the area. The region’s major
Exhibit 16
North East Texas Region (D)
Cities
Region D
Carrizo-Wilcox Aquifer (subsurface)
Carrizo-Wilcox Aquifer (outcrop)
Existing reservoirs
Nacatoch Aquifer (outcrop)*
Trinity Aquifer (subsurface)
Nacatoch Aquifer (subsurface)*
Queen City Aquifer*
Woodbine Aquifer (outcrop)*
Woodbine Aquifer (subsurface)*
Major rivers
Blossom Aquifer (outcrop)*
Blossom Aquifer (subsurface)*
*Minor aquifer (only shown where there is no major aquifer)
Cass
Hunt
Smith
BowieLamar
Wood
Harrison
Red River
Hopkins
Van Zandt
Upshur Marion
Delta
Rains
Morris
Franklin
Camp
Titus
Sulphur River
Red River
Cypress River
Sabine River
Neches River
Gregg
Source: Texas Water Development Board.
Liquid Assets: The State of Texas’Water Resources Texas Comptroller of Public Accounts26
Regional Water Planning
The most challenging
issue the region
faces, however,
is the potential
development of its
own surface water for
use by the much more
populous Region C.
Region D opposes
the development of
the Marvin Nichols
Reservoir as a water
management
strategy for Region C.
opposes the development of the Marvin Nichols
Reservoir as a water management strategy for
Region C.
According to the Region D water planning
group, Region C’s strategy to develop a reservoir
in Region D as a future water source does not
follow state law because it inadequately protects
the area’s water, agriculture and natural resourc-
es. In addition, Region D planners believe that
Region D’s concerns were overlooked by Region
C and TWDB alike through the inclusion of the
Marvin Nichols Reservoir water management
strategy in the State Water Plan.32
Far West Texas Region (E)
Region E, also known as the Far West region, is
located in West Texas adjacent to New Mexico
and Mexico. El Paso is located in the western
tip of the region, which includes seven coun-
ties situated within the Rio Grande River basin
(Exhibit 18). The region depends on a variety
of economic sectors, including agriculture,
agribusiness, manufacturing and tourism.
Ninety-six percent of the area’s residents live in
El Paso County, which has a population density
of 760 persons per square mile, compared to an
average density of 1.1 persons per square mile in
the other six counties.33
Strategies Used and Estimated Costs
Region E has developed 16 water management
strategies to meet its future needs. These are
expected to provide 166,097 acre-feet of water
annually by 2060 at a capital cost of $688.8 mil-
lion. The El Paso Water Utilities (EPWU) will
implement most of these strategies.
Region D has five surface water strategies to
obtain new surface water contracts and extend
and increase existing contracts. Most of these
strategies move water from Toledo Bend
Reservoir to Lake Tawakoni or Lake Fork in
Hunt County for agricultural needs. Region
D will establish new surface water contracts
as needed starting in 2010 and continuing
through 2050. Some new contract procure-
ment projects are already under way; Bright-
star-Salem Utility District recently obtained
a surface water contract from Sabine River
Authority that will provide 9,000 acre-feet of
water for the city of Marshall.30
According to TWDB, failure to implement
these strategies could cost residents of Region
D $135 million in income and 1,060 full- and
part-time jobs by 2010 and more than $320 mil-
lion in income and nearly 2,600 jobs by 2060.
State and local governments could lose $23 mil-
lion in annual tax revenue by 2010 and some
$50 million by 2060.31
Regional Challenges and Successes
Region D has significant water quality and
distribution problems. Due to high levels of
naturally occurring iron and manganese ore
deposits, groundwater in parts of the region
must be treated to remove these elements. In
addition, because the region’s is primarily rural
in nature there is very little water distribution
infrastructure. Building pipelines could be very
costly to obtain available surface water.
The most challenging issue the region faces,
however, is the potential development of its
own surface water for use by the much more
populous Region C. As noted above, Region D
Exhibit17
North East Texas Region (D) Water Management Strategies
Description Capital Costs Water Gained in Acre-Feet Average Capital Cost per Acre-Feet
Groundwater $27,764,102 7,806 $3,557
Surface Water 4,815,605 100,936 48
Total $32,579,707 108,742 $300
Note: Capital cost figures do not include administrative, programmatic or other costs that may be required to implement water
management strategies.
Source: Texas Water Development Board.
Texas Comptroller of Public Accounts Liquid Assets: The State of Texas’Water Resources 27
Regional Water Planning
another $172.4 million in capital costs. These
four strategies alone will create an additional
98,109 acre-feet of water annually by 2060.
EPWU’s conservation program, with an an-
nual operating cost of $4 million, is expected
to provide an additional 23,437 acre-feet per
year by 2060 (Exhibit 19).34
The majority of the capital cost, $502.7
million, will be used for pumping and treat-
ing additional groundwater from the Bone
Spring-Victorio Peak Aquifer near Dell City.
Other EPWU projects, such as the importa-
tion of water, the direct reuse of wastewater
effluent, and the increased use of surface
water from the Rio Grande will account for
Exhibit 18
Far West Texas Region (E)
Source: Texas Water Development Board.
Exhibit 19
Far West Texas Region (E) Water Management Strategies
Description Capital Costs Water Gained in Acre-Feet Average Capital Cost per Acre-Feet
Conservation $0 23,437 $0
Desalination 502,743,000 50,000 10,055
Groundwater 36,779,000 26,191 1,404
Surface Water 103,494,000 20,000 5,175
Water Reuse 45,842,000 18,109 2,531
Total $688,858,000 137,737 $5,001
Note: Capital cost figures do not include administrative, programmatic or other costs that may be required to implement water
management strategies.
Source: Texas Water Development Board.
Liquid Assets: The State of Texas’Water Resources Texas Comptroller of Public Accounts28
Regional Water Planning
Since 1993, El
Paso Water Utility
has operated an
aggressive water
conservation
program that
imposes restrictions
on residential
watering and
includes a rate
structure that
penalizes high
consumption.
Through such
conservation efforts,
El Paso’s daily water
use has decreased
from 200 gallons
per capita in 1990
to 151 in 2006. The
per capita goal for
the city is 140, which
would be the lowest
level of use among
Texas’ large cities.
goal for the city is 140, which would be the low-
est level of use among Texas’ large cities.42
EPWU’s Kay Bailey Hutchison Desalination
Plant, completed in 2007, is the world’s second
largest inland desalination plant, producing
27.5 million gallons of fresh water per day from
brackish groundwater supplies. The facility
has increased El Paso’s water production by 25
percent, and also includes a learning center,
groundwater wells, transmission pipelines and
storage and pumping facilities.43
Region F
Region F is located in the Edwards Plateau
in West Texas. It consists of 32 counties and
includes the cities of Midland, Odessa and San
Angelo (Exhibit 20). The Pecos River is located
in the West of the region and the Colorado River
is situated in the Northeast. A large portion of
Region F lies in the upper portion of the Colo-
rado River basin and the Pecos area of the Rio
Grande basin. The region’s major industries are
health care and social assistance, manufacturing
and oil and gas.
Strategies Used and Estimated Cost
In its 2007 water plan, Region F recommended
15 water management strategies at a projected
total capital cost of $557 million. The new man-
agement strategies would provide 239,250 acre-
feet of additional water by 2060, slightly more
than will be needed (Exhibit 21).
Region F could not, however, identify economi-
cally feasible strategies to meet some of its irriga-
tion needs or any of its steam-electric needs. The
region’s unmet needs include 115,523 acre-feet a
year for irrigation and 24,306 acre-feet annually
for steam-electric power generation in 2060.44
Status of Major Water Projects and Strategies
Because 78 percent of the region’s water comes
from groundwater, most of the region’s projects
are focused on reusing, cleaning and enhancing
these resources.45
Region F has been a leader in weather modifica-
tion (seeding clouds with rain-inducing chemi-
cals) and brush management for many years.
Areas within the region have been seeding prom-
Status of Major Water Projects
and Strategies
The region’s largest project involves pumping ad-
ditional groundwater from Bone Spring-Victorio
Peak Aquifer. The brackish water of this aquifer
does not meet municipal water quality stan-
dards, so most of the $502.7 million in costs are
for treating and desalinating the water.35
In 2003, EPWU purchased 28,000 acres of land,
a tract called Diablo Farms, which overlays the
Capitan Reef Aquifer. EPWU intends to convert
Diablo Farms into a well field. This project will
provide an estimated 10,000 additional acre-feet
annually by 2060.36
The Lower Valley Water
District has received $10.2 million in state funds
from TWDB to replace a water main as part of
this project.37
Drilling for the Diablo Farms project is
scheduled to begin in 2040. Like the Bone
Spring-Victorio Peak project, this is a long-
term strategy to meet future water demand
driven by regional population growth. Because
water demand has not been as high as projected
in the 2006 regional water plan, the region is
likely to push back the scheduled start dates for
the Diablo Farms and the Bone Spring-Victorio
Peak Aquifer projects.38
According to TWDB, if the strategies listed
above are not implemented, Region E residents
could lose $160 million in income and 4,570 full-
and part-time jobs by 2010, rising to nearly $1.1
billion in income and more than 13,000 jobs by
2060. In addition, state and local governments
could lose $8 million in annual tax revenue by
2010 and about $105 million by 2060.39
Regional Challenges and Successes
Since 1993, EPWU has operated an aggressive
water conservation program that imposes re-
strictions on residential watering and includes a
rate structure that penalizes high consumption.
The utility also offers several rebate programs
for replacing appliances and bathroom fixtures
with low-consumption units and using native
landscaping to reduce the need for irrigation.40
Through such conservation efforts, El Paso’s
daily water use has decreased from 200 gallons
per capita in 1990 to 151 in 2006.41
The per capita
Texas Comptroller of Public Accounts Liquid Assets: The State of Texas’Water Resources 29
Regional Water Planning
Region F has been
a leader in weather
modification
(seeding clouds
with rain-inducing
chemicals) and brush
management for
many years. Areas
within the region
have been seeding
promising cloud
formations since the
early 1970s.
more than the city could afford by itself. Eden is
working with TWDB to find funding.
Furthermore, San Angelo recently built a pipe-
line to its well field south of Melvin to supply it
with adequate water. The pipeline passes near
Eden and the city could link to it. Plans to do so
are still developing.48
According to TWDB, any failure to implement
Region F’s strategies could cost its residents
$475 million in income and 8,020 full- and
part-time jobs by 2010, and $962 million in
income and 15,600 jobs by 2060. In addition,
state and local governments could lose $35
ising cloud formations since the early 1970s.46
The North Concho River watershed was the site
of a state-funded brush management program in
the early 2000s to restore grassland and reduce
large areas of water-hogging juniper and mes-
quite trees, thus allowing rainfall to penetrate the
soil and flow into underground supplies.47
Both
technologies are included in the region’s plan to
enhance surface and groundwater supplies.
The Hickory Aquifer supplies the city of Eden
with sufficient fresh water, but the area’s low
number of wells has impeded the city’s ability
to access much of the aquifer’s supplies. Drilling
more wells could cost more than $1.5 million,
Exhibit 20
Region F
Pecos
Reeves
Crockett
Irion
Sutton
Upton
Kimble
Ward
Brown
Reagan
Coleman
Tom
Green
Mason
Crane
Concho
Schleicher
Sterling
Menard
McCulloch
Coke
Ector
Martin
Scurry
Runnels
Borden
Mitchell
Howard
Midland
WinklerLoving
Glasscock
Andrews
Colorado River
Pecos River
Cities
Major rivers
Region F
Edwards-Trinity (Plateau) Aquifer (outcrop)
Existing reservoirs
Capitan Reef Aquifer*
Pecos Valley Aquifer
Ogallala Aquifer
Trinity Aquifer (outcrop)
Trinity Aquifer (subsurface)
Dockum Aquifer (outcrop)*
Dockum Aquifer (subsurface)*
*Minor aquifer (only shown where there is no major aquifer)
Edwards-Trinity (High Plains) Aquifer*
Ellenburger-San Saba Aquifer (outcrop)*
Ellenburger-San Saba Aquifer (subsurface)*
Hickory Aquifer (outcrop)*
Hickory Aquifer (subsurface)*
Lipan Aquifer*
Marble Falls Aquifer*
Rustler Aquifer (outcrop)*
Rustler Aquifer (subsurface)*
Igneous Aquifer*
Source: Texas Water Development Board.
Liquid Assets: The State of Texas’Water Resources Texas Comptroller of Public Accounts30
Regional Water Planning
include Abilene, Bryan, College Station, Killeen,
Round Rock, Temple and Waco. More than 90
percent of the region is located within the Brazos
River Basin, which is also its primary water
source. Industries with the largest economic
impact on the region are service, manufacturing
and retail trade.
The Brazos Planning Group has recommended
a va­riety of management strategies that could
provide more water than it needs to meet fu­ture
needs. In all, these strategies would provide
736,032 acre-feet of additional water annually by
2060. The projected total capital cost for provid-
ing this additional water is just over $1 billion.
To achieve the water goals set forth by its plan-
ning group, Region G will implement strate-
gies in the areas of conservation, groundwater,
surface water and water reuse (Exhibit 23).51
Status of Major Water Projects
and Strategies
Region G’s conservation strategies would pro-
vide 6 percent of all water associated with its
strategies. The region has recommended water
conservation for every municipal water user
group that had both a need and a gallons-per-
capita-per-day use greater than 140 gallons.52
The region will meet with local and municipal
groups to develop timelines and reuse systems
and closely monitor well and reservoir levels.53
Region G also has several groundwater strate-
gies including building additional wells, water
treatment facilities and voluntary redistribution.
million in annual tax revenue by 2010 and $82
million by 2060.49
Regional Challenges and Successes
Region F faces challenges in meeting drink-
ing water standards as well as with disposing
of waste from desalination and radionuclide
treatment, which is, respectively, the removal of
salts and naturally-occurring, low level radio-
active particles from groundwater. A few small,
rural communities in the region rely solely on
water sources that exceed U.S. Environmental
Protection Agency (EPA) regulations on some
of these contaminants, but they cannot afford
expensive water treatment costs, nor do they
have clear guidance on how to dispose of the
residual waste. Some regional representatives
contend that the cost of treatment in order to
meet federal drinking water standards is not
justified by the health risks from the pres-
ence of radionuclide in the water. The region
therefore recommends that the TCEQ help
these communities receive exemptions from
EPA’s radionuclide regulations so that they
do not face either strict enforcement or costly
water treatment costs. Further, the region also
has recommended that TCEQ create rules for
disposing of radionuclide waste residuals so
that these communities can estimate treatment
costs more accurately.50
Brazos Region (G)
Region G, also known as the Brazos region,
stretches from Grimes County northwest to
Kent County and includes all or parts of 37
counties (Exhibit 22). Major cities in the region
Exhibit 21
Region F Water Management Strategies
Description Capital Costs Water Gained in Acre-Feet Average Capital Cost per Acre-Feet
Conservation $43,152,601 81,974 $526
Desalination 131,451,830 16,221 8,104
Groundwater 251,825,812 38,270 6,580
Surface Water 30,115,300 90,075 334
Water Reuse 100,889,000 12,710 7,938
Total $557,434,543 239,250 $2,330
Note: Capital cost figures do not include administrative, programmatic or other costs that may be required to implement water
management strategies.
Source: Texas Water Development Board.
Texas Comptroller of Public Accounts Liquid Assets: The State of Texas’Water Resources 31
Regional Water Planning
the population center along with the well field to
supply the residents.
Sweetwater plans to complete a study about wa-
ter levels and quality with information from the
surface water and the well field. The city’s waste-
water treatment plant, online since 2004, and
other infrastructure, including pipelines, will
be updated to supply the city with surface water
beginning 2009.54
If the study finds excessive
use from citizens using the well field before it
Region G, in partnership with TWDB, HDR
Engineering and the city of Sweetwater, began a
study in April 2008 to assess the water levels and
quality in the Champion Well Field. Sweetwa-
ter currently receives all of its water from these
wells. Lakes in the area, however, have returned
to full capacity after several years of drought so
the city can reduce its dependence on groundwa-
ter. Sweetwater would like to begin using surface
water taken from lakes located 30 miles from
Exhibit 22
Brazos Region (G)
Brazos River
Brazos River
Cities
Major rivers
Region G
Carrizo-Wilcox Aquifer (outcrop)
Carrizo-Wilcox Aquifer (subsurface)
Edwards (Balcones Fault Zone) Aquifer (outcrop)
Edwards (Balcones Fault Zone) Aquifer (subsurface)
Edwards-Trinity (Plateau) Aquifer
Gulf Coast Aquifer
Seymour Aquifer
Existing reservoirs
Blaine Aquifer (outcrop)*
Blaine Aquifer (subsurface)*
Brazos River Alluvium Aquifer*
Dockum Aquifer (outcrop)*
Dockum Aquifer (subsurface)*
Ellenburger-San Saba Aquifer (outcrop)*
Ellenburger-San Saba Aquifer (subsurface)*
Hickory Aquifer (outcrop)*
Marble Falls Aquifer*
Queen City Aquifer (outcrop)*
Queen City Aquifer (subsurface)*
Sparta Aquifer (outcrop)*
Sparta Aquifer (subsurface)*
Trinity Aquifer (outcrop)
Trinity Aquifer (subsurface)
*Minor aquifer (only shown
where there is no major aquifer)
Woodbine Aquifer (outcrop)*
Woodbine Aquifer (subsurface)*
Yegua-Jackson Aquifer*
Somervell
Haskell
Hill
Bell
Lee
Milam
FallsCoryell
Grimes
Williamson
McLennanHamilton
Limestone
Brazos
Robertson
Burleson
Lampasas
Washington
Erath
Kent
Knox
Jones
Nolan Taylor
Young
Fisher
Bosque
Eastland
Callahan
Stephens Palo Pinto
Stonewall
Comanche
JohnsonHood
Shackelford
Throck-
morton
Colorado River
Source: Texas Water Development Board.
Liquid Assets: The State of Texas’Water Resources Texas Comptroller of Public Accounts32
Regional Water Planning
Cedar Park, Leander
and Round Rock
all need additional
water in the future.
Rather than building
three water treatment
plants and excess
infrastructure, the
cities are building
one regional water
treatment plant and
pipes that connect
all of them together.
A $300 million loan
from TWDB will fund
the project.
themselves as the Brushy Creek Regional Author-
ity. The cities of Cedar Park, Leander and Round
Rock all need additional water in the future.
Rather than building three water treatment plants
and excess infrastructure, the cities are building
one regional water treatment plant and pipes that
connect all of them together. A $300 million loan
from TWDB will fund the majority of the project,
which will begin with improvements to the al-
ready present floating intake in Lake Travis, a raw
water line with water from the lake to the regional
water treatment plant in Cedar Park, and a treated
water line with take points for the communities.
Cedar Park has the most immediate need for
water at the present and will be online with the
water treatment plant in 2012. In the interim,
Round Rock will supply the city with water as
part of their partnership. The bulk of the work for
the project will be completed in the first phase,
which includes building of pipes and the water
treatment plant, at a cost of $180 million. Four
local engineering firms are on working on the
project, with the prospect for more consultants as
construction begins. Once the project is complet-
ed, other cities in the area, including Georgetown,
will be free to use local surface water supplies for
their own needs rather than sharing with Round
Rock, which will receive the bulk of its water from
the Lake Travis Regional Water System.57
Region G utilizes water reuse strategies with new
technology including pipes, discharge mecha-
nisms, and more efficient cleaning techniques
for irrigation and manufacturing purposes. The
can be replenished, the region may explore other
groundwater management strategies such as us-
ing supplies purchased from the city of Abilene,
other groundwater supplies, or an off-channel
alternative to Double Mountain Fork Reservoir.
Region G continues to work with other regions
to cultivate safe and sufficient water supplies.55
The Brazos Region plans include construction of
new reservoirs and enhancing existing reservoirs.
The region plans to identify specific small public
water systems where problems with organization
and resources might occur and study regionaliza-
tion. The Brazos Group hopes to create larger re-
gions that could share resources and pull together
with larger water utilities. When counties within
the region require more water than they have, the
regional groups can distribute water from lakes,
reservoirs and treatment plants needing water or
to other entities outside the region.
According to TWDB, Somervell County has
received $31 million in funding for a water
treatment plant, storage and transmission lines.
The Brazos River Authority received $22 mil-
lion to develop a strategy using groundwater to
firm up current supplies in Lake Granger, Palo
Pinto Water District recieved $8 million for the
acquisition of Lake Turkey Peak and the City of
Cleburne received nearly $4.8 million for devel-
opment of Lake Whitney.56
Three cities within Region G have joined to-
gether to complete the Lake Travis Regional
Water System management strategy representing
Exhibit 23
Brazos Region (G) Water Management Strategies
Description Capital Costs Water Gained in Acre-Feet Average Capital Cost per Acre-Feet
Conjunctive Use 303,288,000 54,390 5,576
Conservation $0 45,218 $0
Groundwater 86,713,541 41,075 2,111
Surface Water 582,639,746 513,621 1,134
Water Reuse 103,681,747 81,728 1,269
Total $1,076,323,034 736,032 $1,462
Note: Capital cost figures do not include administrative, programmatic or other costs that may be required to implement water
management strategies.
Source: Texas Water Development Board.
Texas Comptroller of Public Accounts Liquid Assets: The State of Texas’Water Resources 33
Regional Water Planning
more inclusive and there is much better com-
munication now between the planning group,
entities providing water and entities needing wa-
ter. This has led to greater understanding of the
water issues that the region faces in the future.
Specifically, the planning group indicated that
the long-term planning horizon for the region is
now 50 years, as opposed to previous planning
efforts where the region only evaluated 10- to
15-year water needs. Also, the region established
a formal method to communicate between
competing users for a common resource and
among regional water providers that manage the
resources. Lastly, grassroots-level water planning
with local stakeholders has created greater water
literacy on the part of more local people.60
Region H
Region H, located in eastern Texas, comprises
15 counties including the Houston metro-
politan area (Exhibit 24). The region includes
portions of the Trinity, San Jacinto and Brazos
river basins. Its predominant economic sector
is the petrochemical industry; the region is
area also plans to purchase water from providers
for irrigation. The region will monitor drought
conditions and purchase additional water as
needed, possibly from Region C. In partnership
with Region C, the region will develop a study
of the water supplies in Ellis County, Southwest
Dallas County, Southeast Tarrant County and
Johnson County to check on water levels for pos-
sible use in the Brazos Region during drought.
Once water levels are assessed, infrastructure
may be needed to serve the counties.58
According to TWDB, if Region G’s strategies are
not implemented, its residents could lose nearly
$1.1 billion in income and 19,260 full- and
part-time jobs by 2010, and nearly $2.8 billion in
income and more than 46,000 jobs by 2060. In
addition, state and local governments could lose
$39 million in annual tax revenue by 2010 and
about $141 million by 2060.59
Regional Challenges and Successes
According to the Brazos Planning Group, the
regional planning process has become much
Exhibit 24
Region H
Harris
Polk
Leon
Brazoria
Trinity
Walker
Austin
Waller
Chambers
Madison
San
Jacinto
Galveston
Trinity RiverSan Jacinto River
Brazos River
Cities
Major rivers
Region H
Carrizo-Wilcox Aquifer (subsurface)
Carrizo-Wilcox Aquifer (outcrop)
Existing reservoirs
Queen City Aquifer (outcrop)*
Queen City Aquifer (subsurface)*
Sparta Aquifer (outcrop)*
Sparta Aquifer (subsurface)*
Yegua-Jackson Aquifer*
Brazos River Alluvium Aquifer*
Gulf Coast Aquifer
*Minor aquifer (only shown where
there is no major aquifer)
Liberty
Fort
Bend
Montgomery
Source: Texas Water Development Board.
Liquid Assets: The State of Texas’Water Resources Texas Comptroller of Public Accounts34
Regional Water Planning
from TWDB’s State Participation Program to
fund future construction.62
The San Jacinto River Authority and the Cen-
tral Harris County Regional Water Authority
have received $21.5 million and $22.1 million
respectively for the planning, permitting and
infrastructure development to implement
surface water conversion programs.63
The
Region H Planning Group expects the North
Fort Bend Water Authority to apply for $145
million in Water Development Funds from
TWDB for the planning and construction of a
similar program.64
According to the TWDB, if the strategies
listed above are not implemented it could cost
residents of Region H $2.5 billion in income
and 27,970 full- and part-time jobs by 2010
and nearly $15.4 billion in income and about
188,000 jobs by 2060. In addition, state and
local governments could lose $133 million in
annual tax revenue by 2010 and nearly $1.2
billion by 2060.65
Regional Challenges and Successes
Region H faces the challenge of subsidence,
which is the settling or sinking of land caused by
excessive groundwater pumping. As a result, the
region is continuing to convert from groundwa-
ter to new surface water sources.66
The regional
planning group estimates that this conversion to
surface water will cost $1 billion between now
and 2020. The planning group anticipates that
local municipalities and water agencies will seek
responsible for two-thirds of the nation’s total
petrochemical production. Other significant
industries include medical services, tourism,
construction, banking, transportation, govern-
ment, fisheries and agriculture.
Strategies Used and Estimated Cost
The 23 strategies identified by Region H en-
compass $5.5 billion in capital costs and would
provide 1,300,639 acre-feet of water annually
by 2060. About half ($2.7 billion) of this cost is
for the city of Houston’s purchase of water from
the Trinity River Authority. Other costs include
the construction of a new desalination plant,
wastewater treatment plants, reservoirs and
pipelines, at a cost of $1.5 billion. The remain-
ing capital costs are primarily for the renewal of
existing water contracts or for new contracts for
additional water (Exhibit 25).61
Status of Major Water Projects
and Strategies
In fiscal 2008, Region H received $71.6 mil-
lion from the Water Infrastructure Fund from
TWDB to implement three strategies that cre-
ate or utilize more surface water. One of the
projects in Region H, the Luce Bayou Interba-
sin Project, has received $28 million in water
infrastructure funding from TWDB. This
project will provide 400 million gallons per
day to users in Harris, Fort Bend and Mont-
gomery counties. These funds will be used for
planning, permitting and design. The Region
H Planning Group anticipates $250 million
Exhibit 25
Region H Water Management Strategies
Description Capital Costs Water Gained in Acre-Feet Average Capital Cost per Acre-Feet
Conservation $615,740 178,868 $3
Desalination 255,699,000 28,000 9,132
Groundwater 173,153,800 90,993 1,903
Surface Water 4,774,598,260 836,913 5,705
Water Reuse 256,453,592 165,865 1,546
Total $5,460,520,392 1,300,639 $4,198
Note: Capital cost figures do not include administrative, programmatic or other costs that may be required to implement water
management strategies.
Source: Texas Water Development Board.
Texas Comptroller of Public Accounts Liquid Assets: The State of Texas’Water Resources 35
Regional Water Planning
Region H faces
the challenge of
subsidence, which
is the settling or
sinking of land
caused by excessive
groundwater
pumping. As a
result, the region is
continuing to convert
from groundwater
to new surface water
sources.
meet fu­ture needs. In all, the strategies would
provide 324,756 acre-feet of additional water
supply by 2060. The total projected capital cost
of providing additional water in the region ex-
ceeds $613.4 million. The region’s water manage-
ment strategies fall into four general categories:
conservation, groundwater, surface water and
water reuse (Exhibit 27).68
Status of Major Water Projects
and Strategies
The state has committed about $15.6 million for
the development costs of the Lake Columbia res-
ervoir, currently in the pre-construction phase.
Before starting construction, the project must
gain a 404 permit, a permit certifying that the
region meets governmental standards restricting
wastewater discharge into bodies of water, from
the U.S. Army Corps of Engineers. Project plan-
ners are working with the Angelina & Neches
state funds through the Water Infrastructure
Fund and State Participation Program to cover
part of the cost of conversion.67
East Texas Region (I)
Region I, also known as the East Texas region,
is located along the Louisiana border extending
between Beaumont, Tyler, and the Trinity River,
and comprises 20 counties (Exhibit 26). Large
portions of the Sabine and Neches rivers and a
smaller portion of the Trinity River are located
in the area. Major industries in the region in-
clude petrochemical, timber and agriculture.
Status of Major Water Projects
and Strategies
In order to meet the region’s projected water de-
mands in 2060, the East Texas Planning Group
recommended 19 water management strategies
that would provide more water than required to
Exhibit 26
East Texas Region (I)
Source: Texas Water Development Board.
Liquid Assets: The State of Texas’Water Resources Texas Comptroller of Public Accounts36
Regional Water Planning
In addition to these issues, the region’s chairman
identified solutions for two planning and regula-
tory issues. Water demand projections are based
on Texas State Data Center population projec-
tions in conjunction with TWDB. According
to the East Texas Region’s Chairman regional
planners must adhere to these projections even
if regional planners have better insight on lo-
cal population trends. Water planning could
improve if local consultants became responsible
for population projections. According to TWDB,
regional planners can amend population projec-
tions if they have more accurate demographic
data to support these charges.
Also, levels of water consumption used for
regional planning differ from levels specified
in TCEQ statutes. The region’s planning group
chairman prefers TCEQ levels, since they more
closely align with needs of the region during
a drought of record. These two levels could be
reconciled based on scientific criteria to create
one standard that accommodates both regional
planning and TCEQ needs. Funding presents
another obstacle for the region. To meet water
demand in the northern and southern areas, the
region must develop a costly water transporta-
tion infrastructure. In addition, rural areas of
the region lack the customer base to support
large water projects. The East Texas region’s
greatest success is the designation of Lake
Columbia as a unique reservoir site. Several
participants from the surrounding area of the
future reservoir site continue making progress
toward project construction.72
River Authority and a private consultant to re-
view comments and address all concerns related
to the 404 permit. The region will request an
additional $48 million from the state in January,
contingent on obtaining the 404 permit.69
According to the TWDB, if the strategies listed
above are not implemented it could cost resi-
dents of Region I $141 million in income and
1,860 full- and part-time jobs by 2010 and nearly
$1.7 billion in income and almost 23,000 jobs by
2060. In addition, state and local governments
could lose $17 million in annual tax revenue by
2010 and some $236 million by 2060.70
Regional Challenges and Successes
The East Texas region continues to face and over-
come challenges associated with water strategy
implementation. Designation of unique stream
segments presents a problem for the region as
water planners must balance future needs of land
rights owners with the interests of developers,
future public works projects and environmental
concerns. Regional planners also face challenges
associated with implementing environmental
flow, the amount of water necessary for a river,
estuary or other freshwater system to maintain
its health and productivity, mandates from Sen-
ate Bill 3. Environmental flow planners must
consider a range of competing interests, from
national security to economic development and
environmental welfare.71
For instance, efforts to
deepen and widen Sabine Lake require creative
ways of mitigating saltwater and brackish water
inflows from the Gulf of Mexico. Possible solu-
tions include pumping freshwater into the lake or
construction of marshes.
Exhibit 27
East Texas Region (I) Water Management Strategies
Description Capital Costs Water Gained in Acre-Feet Average Capital Cost per Acre-Feet
Conservation $0 1,916 $0
Groundwater 32,364,727 21,589 1,499
Surface Water 577,468,276 298,575 1,934
Water Reuse 3,601,700 2,676 1,346
Total $613,434,703 324,756 $1,889
Note: Capital cost figures do not include administrative, programmatic or other costs that may be required to implement water
management strategies.
Source: Texas Water Development Board.
Texas Comptroller of Public Accounts Liquid Assets: The State of Texas’Water Resources 37
Regional Water Planning
Eight of the 12 water management strategies in the
region deal with conservation efforts in Kerr and
Bandera counties and comprise just more than
10 percent, or 1,507 acre-feet, of the additional
water needed in the region by 2060. The capital
costs associated with these strategies is relatively
low, just $3,600, and the region has already begun
implementation of these strategies. Specifically, the
region is auditing municipal water use in Kerr and
Bandera counties to identify wasteful practices.
The region is educating the public about wasteful
practices and efficient use. In addition, the region
is making a concerted effort to conserve water used
for irrigation systems through more efficient crop
management, time sensitive irrigation schedules
and the use of low-pressure sprinkler systems.
Approximately half of the capital costs, $7.7 mil-
lion, will fund new groundwater wells in Kerr
and Bandera counties. These new groundwater
wells will provide more than one-third, or 5,672
acre-feet, of the additional water needed in the
region by 2060. This strategy is currently being
studied, with no plans implement it until at least
2010. The regional planning group is unclear
Plateau Region (J)
Region J, also known as the Plateau region, is
located on the southern edge of the Edwards
Plateau and consists of six counties (Exhibit 28).
The major cities in the area are Del Rio and Ker-
rville. The area extends from the Texas – Mexico
border eastward through the Texas Hill Coun-
try. Portions of the Guadalupe, Nueces, Colo-
rado, San Antonio and Rio Grande River Basins
are included in the area. The major industries in
the region are tourism, ranching, hunting and
government operations associated with Laughlin
Air Force Base in Del Rio.
Strategies Used and Estimated Costs
The Plateau Planning Group recommended 12
water management strategies for the region that
can be classified into three general categories:
conservation, groundwater and surface water.
The strategies recommended in the region have
a total capital cost of $14.4 million and would
result in an additional 14,869 acre-feet of water
supply available by 2060 (Exhibit 29).73
Exhibit 28
Plateau Region (J)
Val Verde Edwards
Kinney
Real
Rio Grande
Nueces River
Medina River
Guadalupe River
Cities
Major rivers
Region J
Edwards (Balcones Fault Zone) Aquifer (outcrop)
Edwards (Balcones Fault Zone) Aquifer (subsurface)
Edwards-Trinity (Plateau) Aquifer (outcrop)
Edwards-Trinity (Plateau) Aquifer (subsurface)
Trinity Aquifer
Ellenburger-San Saba Aquifer*
Hickory Aquifer*
Existing reservoirs
*Minor aquifer (only shown where
there is no major aquifer)
Kerr
Bandera
Source: Texas Water Development Board.
Liquid Assets: The State of Texas’Water Resources Texas Comptroller of Public Accounts38
Regional Water Planning
and part-time jobs by 2010 and nearly $9 million
in income and about 70 jobs could be lost by
2060. In addition, state and local governments
could lose $140,000 in annual tax revenue by
2010 and about $180,000 by 2060.76
Regional Challenges and Successes
The region needs better groundwa­ter modeling
to provide more accurate data to the regional and
sub-regional planning groups. Improved ground-
water modeling data would not only provide a
better picture of how much groundwater is avail-
able, it would also provide a better idea of seasonal
influxes in water needs due to tourists, hunters and
weekend home owners. Many residents are very
concerned about the possible export of the region’s
groundwater to neighboring regions.77
Lower Colorado Region (K)
Region K, also known as the Lower Colorado
region, begins in Mills and San Saba counties
in the Texas Hill Country and makes its way
southeastward toward the Gulf of Mexico.
The region serves much of the Hill Country,
including Llano, Fredericksburg, Austin and
Pflugerville, as well as Bay City and other
coastal communities (Exhibit 30). Agriculture,
government, manufacturing (primarily semi-
conductor and other technological industries),
retail and service industries are the region’s
economic mainstays.78
Strategies Used and Estimated Costs
Total capital costs for all of Region K’s water
management strategies are estimated at $358.2
million. The region’s water management strate-
gies are projected to produce 861,930 acre-feet by
at this point exactly how much groundwater is
available in the Edwards-Trinity Aquifer because
there are some concerns about the accuracy of
the current modeling system used by TWDB to
calculate the water resources in the aquifer. In
addition, the regional planning group has some
concerns about the demographic growth data
used for the area. Until the region can more ac-
curately project its future demographic changes,
as well as the available groundwater resources in
the area, these strategies will be on hold.
More than $6.5 million of the capital costs listed
in the region’s plan deal with increasing the City
of Kerrville’s water treatment capacity. By doing
so, the region will be able to increase the amount
of potable water available to the area by 2,240
acre-feet without any additional groundwater or
surface water contracts. As part of this strategy,
the city of Kerrville plans to increase the amount
of water that is treated from 5 million gallons per
day to 10 million gallons per day over the course
of five years, beginning at the end of 2007. Ker-
rville initiated the project in November of 2007
and has already expanded the water treatment
rate from 5 million gallons per day to 6 million
gallons per day.74
However, the region can also
foresee the need for additional surface water sup-
plies and has included in its plan a strategy to ob-
tain additional water from the Upper Guadalupe
River Authority (UGRA) in 2030, an additional
3,840 acre-feet, and by 2050, an additional 5,450
acre-feet, to meet its future needs75
According to the TWDB, if the strategies listed
above are not implemented, residents of Region
J stand to lose $6 million in income and 50 full-
Exhibit 29
Plateau Region (J) Water Management Strategies
Description Capital Costs Water Gained in Acre-Feet Average Capital Cost per Acre-Feet
Conservation $3,600 1,507 $2
Groundwater 7,718,000 5,672 1,361
Surface Water 6,650,000 7,690 865
Total $14,371,600 14,869 $967
Note: Four of the region’s conservation strategies do not have any acre-foot cost because they involve crop management and changing
irrigation schedules. These strategies can be implemented without any acre-foot cost to water users. Capital cost figures do not include
administrative, programmatic or other costs that may be required to implement water management strategies.
Source: Texas Water Development Board.
Texas Comptroller of Public Accounts Liquid Assets: The State of Texas’Water Resources 39
Regional Water Planning
Region K’s groundwater strategies, which
require the bulk of its capital costs, include
projects to maintain adequate groundwater
supplies through expansion of the Carrizo-
Wilcox and Trinity Aquifers, as well as other
aquifers throughout the region. Expansion of
the Carrizo-Wilcox is estimated at $13 million
and the Trinity Aquifer expansion project has
an estimated cost of $12.2 million. Overall, the
region’s groundwater projects are on target to
meet projected water demand levels.80
Region K is also working on a groundwater
strategy in partnership with the Fox Crossing
Water District to replace Lake Goldthwaite,
which could include freshwater and brackish
water from the Trinity and Hickory Aquifers
in Mills County and the Ellenburger-San Saba
Aquifer in Lampasas and Llano Counties.81
2060 and fall into four major categories of strate-
gies: conservation, groundwater, surface water,
and water reuse (Exhibit31).79
Status of Major Water Projects
and Strategies
Some strategies in the Lower Colorado Region
may be changed or substituted with a new strate-
gy based on the regional assessments. The Onion
Creek recharge strategy originally would build
two dams to provide water to Hays County. The
retained water would then be released as needed
to meet water needs downstream. However, the
recharge strategy will need revisions based on
reviews with the Barton Springs/Edwards Aqui-
fer Conservation District and City of Austin.
Once new strategy decisions have been made,
Region K will host at least one public meeting to
discuss them.
Exhibit 30
Lower Colorado Region (K)
Llano
Mills
Burnet
Hays
Gillespie
San Saba
Williamson
Blanco
Colorado River
Colorado River
Cities
Major rivers
Region K
Carrizo-Wilcox Aquifer (outcrop)
Carrizo-Wilcox Aquifer (subsurface)
Edwards (Balcones Fault Zone) Aquifer (outcrop)
Edwards (Balcones Fault Zone) Aquifer (subsurface)
Edwards-Trinity (Plateau) Aquifer
Gulf Coast Aquifer
Trinity Aquifer (outcrop)
Trinity Aquifer (subsurface)
Existing reservoirs
*Minor aquifer (only shown where
there is no major aquifer)
Travis
Wharton
Fayette
Colorado
Matagorda
Bastrop
Ellenburger-San Saba Aquifer (outcrop)*
Ellenburger-San Saba Aquifer (subsurface)*
Hickory Aquifer (outcrop)*
Hickory Aquifer (subsurface)*
Marble Falls Aquifer*
Queen City Aquifer (outcrop)*
Queen City Aquifer (subsurface)*
Sparta Aquifer (outcrop)*
Sparta Aquifer (subsurface)*
Yegua-Jackson Aquifer*
Source: Texas Water Development Board.
Liquid Assets: The State of Texas’Water Resources Texas Comptroller of Public Accounts40
Regional Water Planning
Population growth
in the Austin metro
region, surrounding
suburban districts,
and in the outlying
retirement
communities has
greatly altered the
population and water
needs estimates.
tered the population and water needs estimates.
Region K will work with local entities, TWDB
and others to produce new projections based on
findings within the area.
Cities and districts in Region K have indicated
that they know little of the conservation mea-
sures required of them. In response, the region
will re-evaluate conservation and drought con-
tingency strategies for each water user groups
(WUG). In addition, there will be a review of
significant climate changes to the area.
Because of the changes Region K will be making
to its water strategies, additional study is sug-
gested on water availability, quality and cost. Ad-
ditionally, the region will continue to encourage
public participation in the planning process.83
Finally, the region has repeatedly recommended
the following water segments be studied to po-
tentially identify them as ecologically unique: the
Barton Springs segment of the Edwards Aquifer,
Bull Creek, the Colorado River (including Gor-
man Creek and Shaws Bend), Cummins Creek,
the Llano River, the Pedernales River, Rocky
Creek and Hamilton Creek.84
Region K members
have indicated frustration with the lack of policy
action in response to their recommendations
for these studies. Until the Legislature makes a
decision, no further work will be performed on
studies on these areas.85
In addition the Lower Colorado River Authority
(LCRA) and San Antonio River System (SAWS)
are partnering on a project that will produce
150,000 acre feet of water in 2060 at a capital
cost of $21 million. This water management
strategy originates in Region K but will meet
water needs in both Region K and Region L. (For
more information on this project see LCRA/
SAWS Water Project on pages 41 and 42.)
Not all recommended strategies are being imple-
mented. For example, Region K’s recommended
strategy to desalinate brackish groundwater,
estimated at $96.5 million, is not being pursued.
Rather, municipalities are considering imple-
menting this strategy in the future. However, a
water reuse project for the city of Austin is cur-
rently under way and on target, and is projected
to provide the region with 33,537 additional
acre-feet per year by 2060.
According to the Texas Water Development
Board, if the strategies listed above are not
implemented, residents of Region K stand to lose
$335 million in income and 4,480 full- and part-
time jobs by 2010, and more than $4.3 billion in
income and nearly 50,000 jobs by 2060. In addi-
tion, state and local governments could lose $8
million in annual tax revenue by 2010 and about
$248 million by 2060.82
Regional Challenges and Successes
Population growth in the Austin metro region,
surrounding suburban districts, and in the
outlying retirement communities has greatly al-
Exhibit 31
Lower Colorado Region (K) Water Management Strategies
Description Capital Costs Water Gained in Acre-Feet Average Capital Cost per Acre-Feet
Conservation $2,903,692 194,315 $15
Desalination 96,537,717 29,568 3,265
Groundwater 65,445,175 95,742 684
Surface Water 15,227,525 398,215 38
Water Reuse 178,059,959 144,090 1,236
Total $358,174,068 861,930 $416
Note: Capital cost figures do not include administrative, programmatic or other costs that may be required to implement water
management strategies.
Source: Texas Water Development Board.
Texas Comptroller of Public Accounts Liquid Assets: The State of Texas’Water Resources 41
Regional Water Planning
cost for providing the additional water for the
region is more than $5.2 billion (Exhibit 33).87
Status of Major Water Projects
and Strategies
The Lower Colorado River Authority (LCRA)/San
Antonio River System (SAWS) Water Project has
the largest capital cost in Region L. The project is
expected to generate a capital cost of $2.1 million
and produce a gain in water by 150,000 acre-feet in
2060.88
On February 27, 2002, a definitive agree-
ment between SAWS and LCRA was established to
purchase up to 150,000 acre-feet per year of surface
water from the Lower Colorado River Basin. The
agreement was signed by LCRA and SAWS to
collaborate on the water supply project. The agree-
ment requires a six-year study period and then
project implementation can occur if the project
meets all legislative requirement and is financially,
technically and environmentally feasible.89
South Central Texas Region (L)
Region L, also known as the South Central
Texas region, stretches from the Gulf Coast in
Calhoun County and westward through South
Central Texas. The region comprises 21 coun-
ties and the cities of San Antonio, Victoria,
San Marcos and New Braunfels (Exhibit 32).
The area includes segments of nine rivers, the
Guadalupe Estuary and San Antonio Bay. The
Comal and San Marcos Springs, the two largest
springs in Texas, are located in the region. The
main economic sectors in the area are tourism,
medical, military, service, manufacturing and
retail trade.86
Strategies Used and Estimated Costs
The South Central Texas Water Planning Group
has recommended 26 water management strate-
gies to meet the water needs of 2060. In all, the
strategies would provide 732,779 acre-feet of ad-
ditional water supply. The projected total capital
Exhibit 32
South Central Texas Region (L)
Frio
Uvalde
Dimmit
Medina
Hays
Atascosa
Wilson
Refugio
Kendall
Caldwell
Calhoun
Nueces River
San Antonio River
Guadalupe River
Cities
Major rivers
Region L
Carrizo-Wilcox Aquifer (outcrop)
Carrizo-Wilcox Aquifer (subsurface)
Edwards (Balcones Fault Zone) Aquifer (outcrop)
Edwards (Balcones Fault Zone) Aquifer (subsurface)
Edwards-Trinity (Plateau) Aquifer
Gulf Coast Aquifer
Trinity Aquifer (outcrop)
Trinity Aquifer (subsurface)
Existing reservoirs
*Minor aquifer (only shown where
there is no major aquifer)
Queen City Aquifer (outcrop)*
Queen City Aquifer (subsurface)*
Sparta Aquifer (outcrop)*
Sparta Aquifer (subsurface)*
Yegua-Jackson Aquifer*
Ellenburger-San Saba Aquifer*
Hickory Aquifer*
Bexar
LaSalle
Zavala
Dewitt
Goliad
Victoria
Gonzales
Karnes
Comal
Guadalupe
Source: Texas Water Development Board.
Liquid Assets: The State of Texas’Water Resources Texas Comptroller of Public Accounts42
Regional Water Planning
Aquifer Recharge subcommittee’s familiarity with
developing better ways to recharge aquifers.94
The Regional Carrizo for Bexar County Supply
and Regional Carrizo for Schertz-Seguin Local
Government Corporation (SSLGC) strategies
have been experiencing impediments in pro-
ceeding with the project. The Regional Carrizo
for Bexar County Supply strategy is defined
as being a total of 62,588 acre-feet per year of
Carrizo groundwater from four well fields in
Gonzales, Wilson and Bexar Counties. The
groundwater is delivered to SAWS Twin Oaks
facility in southern Bexar County. The project
includes 98 miles of raw water pipeline, 37 miles
of treated water transmission pipeline, three raw
water pump stations and expansion of a water
treatment plant at Twin Oaks will accommodate
increase in water demand. 95
However, the project has been unable to proceed
due to contestation. The groundwater districts
do not want water in their region to be drawn
from the Carrizo and used in the City of San
Antonio. A mediation process between the Gon-
zales groundwater district and SAWS was held
last year, but no resolution was reached.96
The Regional Carrizo for SSLGC Project Expan-
sion is owned and operated by SSLGC and holds
permits to pump 12,200 acre-feet per year of
groundwater from Gonzales County’s Carrizo
Aquifer. Schertz and Seguin will be the primary
sites to receive the supply of water, and SSLGC
Currently, the LCRA/SAWS Water Project is
in the study phase, which started in mid-2004.
Specifically, “the majority of the field studies for
the off-channel storage facility and intake facili-
ties have been completed.”90
The study phase is
expected to be complete by mid-2009, and an
implementation plan will be developed by March
2015 once the project meets the requirements in
the Definitive Agreement.91
The studies in prog-
ress focus on issues such as climate change analy-
sis and underground water studies. In relation,
House Bill 1629 passed by the Texas Legislature in
2001 authorized the LCRA-SAWS Water Project
to proceed only in the case that it meets specific
requirements to protect the Lower Colorado River
basin. Therefore, the study is formed with an
emphasis on meeting criteria set by the bill prior
to devising a plan to implement the strategy.92
The Edwards Aquifer Recharge – type 2 project
has a capital cost of $367.2 million and is expected
to generate 21,577 acre-feet of water in 2060.93
Type 2 projects use recharge dams to catch water
in dry streams or creek beds so that it can seep
into an aquifer. Currently, studies are being con-
ducted on recharge, recirculation and the recov-
ery implementation program. The project has not
yet entered the design and implementation phase.
Presentations on previous recharge studies and
the Barton Springs recharge project were con-
ducted on October 16, 2008, and November 13,
2008. The presentations on the various recharge
projects are expected to enhance the Edwards
Exhibit 33
South Central Texas Region (L) Water Management Strategies
Description Capital Costs Water Gained in Acre-Feet Average Capital Cost per Acre-Feet
Conjunctive Use $2,481,042,000 177,177 $14,003
Conservation 0 109,927 0
Desalination 984,726,000 89,674 10,981
Groundwater 713,958,000 206,111 3,464
Surface Water 853,374,000 98,214 8,689
Water Reuse 189,308,000 51,676 3,663
Total $5,222,408,000 732,779 $7,127
Note: Capital cost figures do not include administrative, programmatic or other costs that may be required to implement water
management strategies.
Source: Texas Water Development Board.
Texas Comptroller of Public Accounts Liquid Assets: The State of Texas’Water Resources 43
Regional Water Planning
could lose $32 million in annual tax revenue by
2010 and about $335 million by 2060.100
Regional Challenges and Successes
One of the major problems in the region is the
lack of water for the growing population. There
are ongoing issues such as the exporting of
Carrizo-Wilcox Aquifer water from Gonzales
and Wilson counties, the potential of temporary
overdrafting of the Carrizo-Wilcox Aquifer, the
revised Lower Guadalupe Water Supply Project
and the over-reliance on the Edwards Aquifer.101
Rio Grande Region (M)
Region M, also known as the Rio Grande region,
is located along the southern tip of Texas and is
adjacent to Mexico. The region includes Maverick,
Webb, Zapata, Jim Hogg, Starr, Hidalgo, Willacy
and Cameron counties, as well as the major cities
of Laredo, Brownsville, Harlingen and McAllen
(Exhibit 34). Major economic drivers in the re-
gion include agriculture, trade, services, manu-
facturing and hydrocarbon production.102
has signed contracts to supply 400 acre-feet per
year of peaking water to the cities of Selma and
Universal City.97
Currently, the project has not
been able to move forward due to contestation.
Permit applications have been submitted to the
underground districts, but the next process is
being delayed by the contested case hearing.98
The SAWS Recycled Water Program is hoping to
reach additional customers by establishing north
and south interconnections between two main
legs of the current system and by extending
existing lines. SAWS is currently working with
legislative representatives in its area on possible
legislation for the 81st
Legislature to allow better
reuse of water.99
According to the TWDB, if the strategies listed
above are not implemented, residents of Region
L face losses of $664 million in income and
10,200 full- and part-time jobs by 2010, nearly
$5.5 billion in income and about 100,000 jobs by
2060. In addition, state and local governments
Exhibit 34
Rio Grande Region (M)
Webb
Starr
Hidalgo
Zapata
Maverick
Jim Hogg
Cameron
Willacy
Rio Grande
Cities
Major rivers
Region M
Carrizo-Wilcox Aquifer (outcrop)
Carrizo-Wilcox Aquifer (subsurface)
Gulf Coast Aquifer
Yegua-Jackson Aquifer*
Existing reservoirs
*Minor aquifer (only shown where
there is no major aquifer)
Source: Texas Water Development Board.
Liquid Assets: The State of Texas’Water Resources Texas Comptroller of Public Accounts44
Regional Water Planning
The long-term water
supply for Region
M will be available
through operation
of an on-channel
reservoir and
construction. The
project will be located
approximately four
miles southeast
of Brownsville
and will provide
opportunities for
water conservation
and management
improvement in the
lower Rio Grande.
gain of 7,902 acre-feet in 2060.107
The project has
completed a pilot study focusing on the technol-
ogy associated with seawater desalination. Cur-
rently, NRS Engineering is attempting to secure
funding to start the demonstration scale project,
which will answer questions not addressed in
the pilot study in developing and building a full
scale seawater desalination plant.108
The region is making a concerted effort to re-
duce water usage in rural areas through several
on-farm conservation strategies. Specifically,
the region is currently implementing meth-
ods such as low energy precision application
and metering to help reduce the amount of
water used on farms and ranches. In addition,
from 2007, manufacturing clothes washers are
required to be 35 percent more efficient than
current standards.109
The Brownsville Weir and Reservoir strategy
has a total capital cost of $66.5 million and is
expected to produce 20,643 acre-feet of water
in 2060.110
The project is set to capture and store
excess river flows as a consistent water supply
for lower Rio Grande Valley communities. The
water supply for the region will be available
through operation of an on-channel reservoir.
The project will be located approximately four
miles southeast of Brownsville and will provide
opportunities for water conservation and man-
agement improvement in the lower Rio Grande.
Currently, the Brownsville Public Utility Board
is collaborating with “the U.S. and Mexican
Sections of International Boundary and Water
Strategies Used and Estimated Costs
To meet projected water demands in 2060, the
Rio Grande Planning Group has assessed vari-
ous water management strategies and their costs.
The objective is to provide 807,587 acre-feet of
additional water supply by 2060. The projected
total capital cost is just more than $1 billion,
the fourth largest amount among all regions in
Texas. To achieve an increase of 601,127 acre-feet
of total water supply by 2060, the region will use
a number of strategies including conservation,
desalination, groundwater, surface water and
water reuse (Exhibit 35).103
Status of Major Water Projects
and Strategies
Brackish groundwater desalination has the larg-
est capital costs in Region M. Reverse osmosis
(RO) is the most common method used in de-
salination of brackish groundwater. A majority
of the current or proposed full-scale RO systems
will use drainage ditch discharge, which will
ultimately discharge into the Gulf of Mexico or
Laguna Madre.104
NRS Consulting Engineers has
completed the construction of seven regional
brackish groundwater facilities and there are
various brackish groundwater desalination proj-
ects in progress as well.105
Some of the regional
facilities under construction are in the Valley
municipal water district and City of Primera.
Plants are also being built for the North Alamo
Water Supply Corporation.106
The Seawater Desalination project will require
a capital cost of nearly $16 million and a water
Exhibit 35
Rio Grande Region (M) Water Management Strategies
Description Capital Costs Water Gained in Acre-Feet Average Capital Cost per Acre-Feet
Conservation $334,173,100 462,423 $723
Desalination 358,414,525 77,864 4,603
Groundwater 43,982,595 31,416 1,400
Surface Water 297,162,982 190,103 1,563
Water Reuse 52,389,226 45,781 1,144
Total $1,086,122,428 807,587 $1,345
Note: Capital cost figures do not include administrative, programmatic or other costs that may be required to implement water
management strategies.
Source: Texas Water Development Board.
Texas Comptroller of Public Accounts Liquid Assets: The State of Texas’Water Resources 45
Regional Water Planning
the required water under the treaty and no debt
currently existed, according to the International
Boundary and Water Commission, the interna-
tional body that manages the agreement.115
Overall, water supply in the region is scarce, and
more diversity in water sources is needed. Addi-
tionally, funds from TWDB and federal programs
for irrigation conservation have not been suffi-
ciently available causing difficulty in successfully
implementing irrigation conservation strategies.116
NRS Engineers on behalf of the Brownsville Pub-
lic Utility Board (PUB) has completed a seawater
desalination pilot study that will be published in
January of 2009. The purpose of the study is to
look at cost effective approaches in developing a
full scale seawater desalination plant.117
Coastal Bend Region (N)
Located in south Texas, Region N (also known as
the Coastal Bend region), covers 11 counties and
part of the Nueces River Basin and the Nueces
Estuary. The largest cities in the region are Cor-
pus Christi, Portland, Kingsville, Beeville, Alice
and Robstown (Exhibit 36).118
The largest regional
water provider, the City of Corpus Christi, sells
water to the South Texas Water Authority and
San Patricio Municipal Water District.119
The
Commissions, City of Matamoros, Tamaulipas
and Comision Nacional del Agua to develop bi-
national efforts to construct the Project on the
Rio Grande.”111
According to the TWDB, if the strategies
listed above are not implemented, residents
of Region M face losses of $164 million in
income and 3,610 full- and part-time jobs by
2010, and more than $2 billion in income and
nearly 26,900 jobs by 2060. In addition, state
and local governments could lose $5 million
in annual tax revenue by 2010 and about $76
million by 2060.112
Regional Challenges and Successes
There is concern for the reliability of Mexico’s
inflows into the International Amistad-Falcon
Reservoir system and the supply of water that is
needed for water rights downstream at points of
diversion and usage. Throughout the years, Mex-
ico has often accumulated water debts to the U.S.
in violation of the 1944 Treaty.113
In 1944, Mexico
and the US signed a treaty about waters of certain
international rivers, including the Colorado
River.114
The lack of surface water from Mexico
will decrease the supply available to sustain the
area’s immense population growth. As of Novem-
ber 2008, however, Mexico had delivered all of
Duval
Bee
Kenedy
Brooks
McMullen
Kleberg
Nueces
San Patricio Aransas
Nueces River
Cities
Major rivers
Region N
Carrizo-Wilcox Aquifer (subsurface)
Gulf Coast Aquifer
Yegua-Jackson Aquifer*
Existing reservoirs
*Minor aquifer (only shown where
there is no major aquifer)
Jim
Wells
Live
Oak
Source: Texas Water Development Board.
Exhibit 36
Coastal Bend Region (N)
Liquid Assets: The State of Texas’Water Resources Texas Comptroller of Public Accounts46
Regional Water Planning
Region N is working
with the U.S. Army
Corps of Engineers,
the adjoining South
Texas Region and
other agencies to
devise joint water
management
strategies. The region
has been successful
in planning for
water needs in the
region, with available
supplies projected to
meet water demands
through at least 2035.
now be redirected to other cost-effective water
management strategies. Continued study will
include the benefits of an off-channel reservoir,
a storage reservoir in a lowland area, to accu-
mulate additional water when supplies exceed
capacity. Because the off-channel storage would
be smaller and in a lowland area compared to
the lake, it would minimize evaporation. HDR
continues to assess the cost estimate and benefits
of this water management strategy.122
Groundwater supplies will be enhanced by a new
well field in western Refugio County over the
Gulf Coast Aquifer to provide water during peak
agricultural times.
According to the TWDB, if the strategies listed
above are not implemented, the region could lose
$22 million in income and 230 full- and part-
time jobs by 2010. By 2060, the cost could be
about $3.2 billion in income and nearly 36,800
jobs. In addition, state and local governments
could lose $3 million in annual tax revenue by
2010 and about $233 million by 2060.123
Regional Challenges and Successes
The region has been a leader in water planning
for years. For instance, the Mary Rhodes Pipe-
line was completed in 1998 to transport water
from Lake Texana to the City of Corpus Christi
via an interbasin transfer permit. The pipeline
can transport twice the volume of water under
current supply contracts.124
The region is work-
ing with the U.S. Army Corps of Engineers,
the adjoining South Texas Region and other
major industries in the region are service, govern-
ment, retail trade and petrochemical.
Strategies Used and Estimated Costs
Implementing the recommended water man-
agement strategies in the Coastal Bend Region
would provide an additional 149,496 acre-feet of
water in 2060 at a total capital cost of $789.5 mil-
lion, most of which would develop surface water
sources (Exhibit 37).120
Status of Major Water Projects
and Strategies
To enhance surface supplies, the City of Corpus
Christi is planning for a major seawater desalina-
tion plant to increase water for municipal users.
According to the City of Corpus Christi water
department, a feasibility study has been com-
pleted on the desalination project. At this time,
the project is not economically feasible and will
remain on hold until it becomes a necessity.121
The city also bought 35,000 acre-feet per year
from the Colorado River-based Garwood Irriga-
tion Company that will be used for irrigation, as
well as industrial and municipal purposes.
Currently, HDR Engineering Inc. is partnering
with the Nueces River Authority on a chan-
nel loss study on the surface and groundwater
moving between the Choke Canyon Reservoir
to Lake Corpus Christi. Data revealed that little
or no water is actually lost during transport
between the reservoir and the lake, eliminat-
ing the need to build the $105 million pipeline
detailed in the previous plan. The funds can
Exhibit 37
Coastal Bend Region (N) Water Management Strategies
Description Capital Costs Water Gained in Acre-Feet Average Capital Cost per Acre-Feet
Conservation $0 6,891 $0
Desalination 248,919,000 18,200 13,676
Groundwater 48,338,000 20,535 2,354
Surface Water 490,758,000 103,620 4,736
Water Reuse 1,500,000 250 6,000
Total $789,515,000 149,496 $5,281
Note: The conservation efforts for mining in Region N that contribute to the region’s overall water gain from conservation have highly
variable costs per acre-foot and were not included in the overall average cost per acre-foot for that category. Capital cost figures do not
include administrative, programmatic or other costs that may be required to implement water management strategies.
Source: Texas Water Development Board.
Texas Comptroller of Public Accounts Liquid Assets: The State of Texas’Water Resources 47
Regional Water Planning
Strategies Used and Estimated Costs
In order to meet the region’s projected water
demands in 2060, the Llano Estacado Planning
Group recommended 13 water management
strategies to address most future water needs. In
all, the strategies would provide 441,511 acre-feet
of additional water supply by 2060, with total
projected capital costs exceeding $818.6 million.
The region’s water management strategies fall into
four general categories: irrigation conservation,
groundwater development, brackish groundwater
desalination, and infrastructure connecting Lub-
bock to the Alan Henry reservoir (Exhibit 39).126
Status of Major Water Projects
and Strategies
The state has committed nearly $23 million
toward the construction of a pipeline from Lake
Alan Henry to the city of Lubbock. Currently,
the project is in the design and testing phase,
with completion of the pipeline scheduled for
2012. The project includes 50 miles of pipeline,
3 pumping stations, and a treatment plant for
distribution within the city of Lubbock.
agencies to devise joint water management
strategies. The Coastal Bend Region has been
successful in planning for water needs in the
region, with available supplies projected to
meet water demands through at least 2035.125
Llano Estacado Region (O)
Located in the Southern High Plains region of
the Texas Panhandle, Region O, also known as
the Llano Estacado region, includes 21 coun-
ties, bounded on the north by Deaf Smith
County, Motley and Dickens counties to the
east, Gaines and Dawson counties to the south,
and New Mexico on the western edge (Exhibit
38). Small portions of the Canadian, Red,
Brazos and Colorado rivers are located in the
area, although almost no surface water leaves
the region. Instead, surface water is captured
by nearly 14,000 playa basins, which are natural
water collecting pools. Major industries in the
region include livestock and cotton production.
Major cities in the region include Lubbock,
Brownfield, Plainview and Hereford.
Exhibit 38
Llano Estacado Region (O)
Hale
Gaines
Lynn
Lamb Floyd
Terry
Motley
Garza
Castro
Bailey
Deaf Smith
Crosby
Briscoe
Parmer
Hockley
Dickens
Swisher
Dawson
Lubbock
Yoakum
Cochran
Cities
Major rivers
Region O
Ogallala Aquifer
Seymour Aquifer
Blaine Aquifer*
Dockum Aquifer*
Edwards-Trinity (High Plains) Aquifer*
Existing reservoirs
*Minor aquifer (only shown where
there is no major aquifer)
Prairie Dog Town Fork
of the Red River
Colorado River
Source: Texas Water Development Board.
Liquid Assets: The State of Texas’Water Resources Texas Comptroller of Public Accounts48
Regional Water Planning
aquifer in 1995 and 2000, due to drought condi-
tions and unusually high demand. Furthermore,
some of the region’s counties assumed that up
to 80 percent of aquifer capacity in their area
will remain in storage through 2060, rather than
factoring into supply and demand estimates. The
region believes that water supply and demand
could be more accurately modeled using more
complete data. Also, the region recommends
a variety of conservation practices that would
contribute to recharge efforts, notably vegetation
control efforts in lake watershed districts, as well
as efforts to improve irrigation.129
Lavaca Region (P)
Region P, also known as the Lavaca Region,
comprises Jackson and Lavaca counties, as well
as the southwest portion of Wharton County.
The region contains the cities of Edna, El Campo
and Halletsville. The Lavaca River is the region’s
main source of surface water, while the Gulf
Coast Aquifer provides groundwater. Main
industries in the region include agribusiness,
mineral production, oil and gas production and
manufacturing (Exhibit 40).130
Strategies Used and Estimated Costs
The Lavaca region has only one strategy and
it falls under the groundwater category. The
strategy would provide 32,468 acre-feet of addi-
tional water supply by 2060, with no projected
capital costs.131
Region O also plans to amend the state water
plan with one major reduction and various addi-
tions. The region no longer plans to develop the
reservoir Canyon Lake 8 and is working with the
TWDB to remove the project. Instead, the City of
Lubbock plans to purchase and develop Post Res-
ervoir from the City of Post in exchange for water
rights. Infrastructure from the Lake Alan Henry
pipeline will transport and treat water from this
reservoir. Lubbock is also negotiating with the
Brazos River Authority to designate water from
playa basins as city water. This water would reach
Lubbock through the Lake Alan Henry pipeline
after a diversion from North Fork. The state plan
must be amended to include these additions.127
According to the TWDB, if the strategies listed
above are not implemented, the region could lose
$103 million in income and over 4,400 full- and
part-time jobs by 2010. By 2060, the cost could be
about $387 million in income and nearly 13,700
jobs. In addition, state and local governments
could lose $10 million in annual tax revenue by
2010 and about $32 million by 2060.128
Regional Challenges and Successes
Due to heavy reliance on groundwater from the
Ogallala Aquifer, the region’s main concern is
the accurate measurement of groundwater avail-
ability. New modeling of the Ogallala’s water
capacity suggests that the aquifer has greater
recharge capacity than was reported for pur-
poses of state and regional water planning. The
planning group claims that original modeling
was based on incomplete starting volumes of the
Exhibit 39
Llano Estacado Region (O) Water Management Strategies
Description Capital Costs Water Gained in Acre-Feet Average Capital Cost per Acre-Feet
Conservation $353,510,000 337,790 $1,047
Desalination 10,051,230 3,360 2,991
Groundwater 43,986,161 50,421 872
Reuse 29,746,680 2,240 13,280
Surface Water 381,336,000 47,700 7,995
Total $818,630,071 441,511 $1,854
Note: Capital cost figures do not include administrative, programmatic or other costs that may be required to implement water
management strategies.
Source: Texas Water Development Board.
Texas Comptroller of Public Accounts Liquid Assets: The State of Texas’Water Resources 49
Regional Water Planning
Regional Challenges and Successes
The Lavaca Region has 76,000 acres of irrigated
farmland, with three-fourths solely in rice produc-
tion. The planning group educates citizens on rice
returns and futures. The area is crucial to national
rice output. Any increase in production could
result in a higher demand for groundwater. The
region works to ensure adequate supply for rice
farming and has successfully developed its own
numbers and methodology to arrive at future plans
recognized by the TWDB. Regional planners say
they are prepared for drought conditions based on
past experience and future planning.134
Status of Major Water Projects
and Strategies
The Lavaca Region investigated several
drought-related strategies for the area. The
region’s original plan called for three separate
strategies. However, since the release of the
plan, the region has combined the two over-
drafting strategies from Jackson and Wharton
counties. Temporary overdrafting of the Gulf
Coast Aquifer, which was found to be economi-
cally feasible, could provide adequate water for
citizens and businesses. While the current im-
plementation schedule of the region’s strategy is
scheduled to begin in 2010 and provide 32,468
acre-feet by 2060 for agriculture, implementa-
tion on the project will not begin until drought
conditions exist (Exhibit 41).132
According to the TWDB, if the strategy listed
above is not implemented, Region P residents
face losses of $3 million in income and 120 full-
and part-time jobs from 2010 through 2060.
In addition, state and local governments could
lose $300,000 in tax annual revenue from 2010
through 2060.133
Lavaca
Wharton
Jackson
Lavaca River
Cities
Major rivers
Region P
Gulf Coast Aquifer
Existing reservoirs
Exhibit 41
Lavaca Region (P) Water Management Strategies
Description Capital Costs Water Gained in Acre-Feet Average Capital Cost per Acre-Feet
Groundwater $0 31,979 $0
Surface Water $0 489 0
Total $0 32,468 $0
Note: Capital cost figures do not include administrative, programmatic or other costs that may be required to implement water
management strategies.
Source: Texas Water Development Board.
Exhibit 40
Lavaca Region (P)
Liquid Assets: The State of Texas’Water Resources Texas Comptroller of Public Accounts50
Regional Water Planning
12
	 Texas Water Development Board, Water for Texas
2007, Volume II, p. 333.
13
	 Texas Water Development Board, Water for Texas
2007 (Austin, Texas, January 2007), Volume II, pp.
20-22, http://www.twdb.state.tx.us/publications/
reports/State_Water_Plan/2007/2007StateWaterPlan/
CHAPTER%202%20regional%20B%20
FINAL_113006.pdf. (Last visited December 31, 2008.)
14
	 Interview with Curtis Campbell, chairman, Region
B Water Planning Group, Wichita Falls, Texas,
November 5, 2008.
15
	 Texas Water Development Board, Water for Texas
2007, Volume II, p. 251.
16
	 Texas Water Development Board, Water for Texas
2007 (Austin, Texas, January 2007), Volume
II, pp. 25-30, 333, 335-337, http://www.twdb.
state.tx.us/publications/reports/State_Water_
Plan/2007/2007StateWaterPlan/CHAPTER%202_
Regional%20C%20FINAL_112706.pdf and http://
www.twdb.state.tx.us/publications/reports/State_
Water_Plan/2007/2007StateWaterPlan/APP%202.1_
final%20112906.pdf. (Last visited January 2, 2009.)
17
	 Data provided by Wendy Barron, team lead, Water
Supply & Strategy Analysis, Texas Water Development
Board, November 4, 2008; and Region C Water Planning
Group, 2006 Region C Water Plan: Executive Summary
(Grand Prairie, Texas, January 2006), p. ES-10, http://
www.twdb.state.tx.us/rwpg/2006_RWP/RegionC/
Executive%20Summary/EXECUTIVE_SUMMARY-
final.pdf. (Last visited December 31, 2008.)
18
	 Texas S.B. 3, 80th Leg., Reg. Session (2007), Section
4.04, “Study Commission on Region C Water Supply,”
pp. 86-89, http://www.capitol.state.tx.us/tlodocs/80R/
billtext/pdf/SB00003F.pdf. (Last visited January 1,
2009.)
19
	 Data provided by Wendy Barron, team lead, Water
Supply & Strategy Analysis, Texas Water Development
Board; and Interview with Mike Rickman, assistant
general manager, North Texas Municipal Water
District, Wylie, Texas, November 20, 2008.
20
	 Region C Water Planning Group, 2006 Region C Water
Plan (Grand Prairie, Texas, December 2005), pp.
4D.1-2, 4D.9, 4D.16-17, http://www.twdb.state.tx.us/
rwpg/2006_RWP/RegionC/Chapter%204/Chapter%20
4D-final.pdf. (Last visited January 1, 2009.)
21
	 Region C Water Planning Group, 2006 Region C
Water Plan (Grand Prairie, Texas, December 2005),
pp. 4D.17-18, 4D.13-14, http://www.twdb.state.
tx.us/rwpg/2006_RWP/RegionC/Chapter%204/
Chapter%204D-final.pdf. (Last visited January 1,
2009.) ; and Interview with Charlie Stringer, assistant
general manager, Dallas Water Utilities, Dallas, Texas,
November 21, 2008.
22
	 Region C Water Planning Group, 2006 Region C
Water Plan (Grand Prairie, Texas, December 2005),
pp. 4D.11-13, http://www.twdb.state.tx.us/rwpg/2006_
RWP/RegionC/Chapter%204/Chapter%204D-final.
pdf. (Last visited January 1, 2009.)
Endnotes
1
	 Texas Water Development Board, Water for Texas
2007 (Austin, Texas, January 2007), Volume II, p. 2,
http://www.twdb.state.tx.us/publications/reports/
State_Water_Plan/2007/2007StateWaterPlan/
CHAPTER%201%20FINAL%20113006.pdf. (Last
visited December 30, 2008.)
2
	 Region O Regional Water Planning Group, “Appendix
D: Overview of the Methodology Used by the
Texas Water Development Board to Estimate Social
and Economic Impacts of Not Meeting Projected
Water Needs,” in Texas Water Development Board
Preliminary Report to Region O RWPG (Austin, Texas,
August 8, 2000) pp. 8-9, www.twdb.state.tx.us/rwp/o/
Submitted_Files/Appendix/Appendix%20D.doc. (Last
visited December 30, 2008.)
3
	 Texas Water Development Board, Water for Texas
2007 (Austin, Texas, January 2007), Volume II, pp. 38
and 132, http://www.twdb.state.tx.us/publications/
reports/State_Water_Plan/2007/2007StateWaterPlan/
CHAPTER%202_REGIONAL%20E%20final_112706.
pdf and http://www.twdb.state.tx.us/publications/
reports/State_Water_Plan/2007/2007StateWaterPlan/
CHAPTER%205_final%20112906.pdf. (Last visited
December 30, 2008.)
4
	 Alicia A. Caldwell, “El Paso Desalination Plant Opens
with High Expectations,” The Associated Press State &
Local Wire (August 9, 2007), pp.1-2. (Nexis document.)
5
	 Texas Water Development Board, Water for Texas
2007 (Austin, Texas, January 2007), Volume II,
p. 201, http://www.twdb.state.tx.us/publications/
reports/State_Water_Plan/2007/2007StateWaterPlan/
CHAPTER%207%20FINAL_112906.pdf. (Last visited
December 30, 2008.)
6
	 El Paso Water Utilities, “Setting the Stage for the
Future,” pp. 1-3, http://www.epwu.org/water/desal_
info.html (Last visited December 30, 2008.)
7
	 Texas Water Development Board, Water for Texas
2007 (Austin, Texas, January 2007), Volume II, pp.
13-16, http://www.twdb.state.tx.us/publications/
reports/State_Water_Plan/2007/2007StateWaterPlan/
CHAPTER%202_REGIONAL%20A%20final_112906.
pdf. (Last visited December 30, 2008.)
8
	 Texas Water Development Board, Water for Texas
2007, Volume II, pp. 13-16.
9
	 Texas Water Development Board, Water for Texas
2007 (Austin, Texas, January 2007), Volume II, pp.
333-334, http://www.twdb.state.tx.us/publications/
reports/State_Water_Plan/2007/2007StateWaterPlan/
APP%202.1_final%20112906.pdf. (Last visited
December 30, 2008.)
10
	 Texas Water Development Board, Water for Texas 2007
(Austin, Texas, January 2007), Volume II, p. 251. http://
www.twdb.state.tx.us/publications/reports/State_
Water_Plan/2007/2007StateWaterPlan/CHAPTER%20
9_112806.indd.pdf. (Last visited December 30, 2008.)
11
	 Interview with C.E. Williams, chairman, Panhandle
Water Planning Group, Amarillo, Texas, November 4,
2008.
Texas Comptroller of Public Accounts Liquid Assets: The State of Texas’Water Resources 51
Regional Water Planning
40
	 Far West Texas Water Planning Group, Far West Texas
Water Plan (El Paso, Texas, January 2006), p. 4-14, http://
www.twdb.state.tx.us/rwpg/2006_RWP/RegionE/
Complete_Text.pdf. (Last visited January 1, 2009.)
41
	 Texas Water Development Board, “2006 Water Use
Survey Summary Estimates by City: Draft,” http://
www.twdb.state.tx.us/wrpi/wus/2006est/2006City.xls.
(Last visited January 1, 2009.) (Excel file.) ; and Far
West Texas Water Planning Group, Far West Texas
Water Plan, p. 4-14.
42
	 Far West Texas Water Planning Group, Far West
Texas Water Plan, p. 4-14.
43
	 El Paso Water Utilities, “Water: Setting the Stage for
the Future,” p. 1, http://www.epwu.org/water/desal_
info.html. (Last visited January 1, 2009.)
44
	 Texas Water Development Board, Water for Texas
2007 (Austin, Texas, January 2007), Volume II, pp.
43-46, http://www.twdb.state.tx.us/publications/
reports/State_Water_Plan/2007/2007StateWaterPlan/
CHAPTER%202_REGIONAL%20F_FINAL%20
112706.pdf. (Last visited January 1, 2009.)
45
	 Region F Water Planning Group, “Identification,
Evaluation, and Selection of Water Management
Strategies Based on Needs,” in Region F Water Plan
by Freese and Nichols, Inc., LBG-Guyton Associates,
Inc., and Alan Plummer Associates, Inc. (Big Spring,
Texas, January 2006), p. 4-1, http://www.twdb.state.
tx.us/rwpg/2006_RWP/RegionF/pdf/Region%20
F%20Chapter%204.pdf. (Last visited January 1, 2009.)
(Consultant’s report.)
46
	 Region F Water Planning Group, “Identification,
Evaluation, and Selection of Water Management
Strategies Based on Needs,” in Region F Water Plan
by Freese and Nichols, Inc., LBG-Guyton Associates,
Inc., and Alan Plummer Associates, Inc. (Big Spring,
Texas, January 2006), pp. 4-213-218, http://www.twdb.
state.tx.us/rwpg/2006_RWP/RegionF/pdf/Region%20
F%20Chapter%204.pdf. (Last visited January 1, 2009.)
(Consultant’s report.)
47
	 Region F Water Planning Group, “Identification,
Evaluation, and Selection of Water Management
Strategies Based on Needs,” in Region F Water Plan
by Freese and Nichols, Inc., LBG-Guyton Associates,
Inc., and Alan Plummer Associates, Inc. (Big Spring,
Texas, January 2006), pp. 4-218-228, http://www.twdb.
state.tx.us/rwpg/2006_RWP/RegionF/pdf/Region%20
F%20Chapter%204.pdf. (Last visited January 1, 2009.)
(Consultant’s report.)
48
	 Interview with Selena Hemmeter, city secretary and
administrator, City of Eden, Eden, Texas, November
20, 2008.
49
	 Texas Water Development Board, Water for Texas
2007, Volume II, p. 251.
50
	 Region F Water Planning Group, “Unique
Stream Segments/Reservoir Sites/Legislative
Recommendations,” in Region F Water Plan by Freese
and Nichols, Inc., LBG-Guyton Associates, Inc., and
Alan Plummer Associates, Inc. (Big Spring, Texas,
January 2006), pp. 8-13-14, http://www.twdb.state.
23
	 Data provided by Wendy Barron, team lead, Water
Supply & Strategy Analysis, Texas Water Development
Board; and Interview with Charlie Stringer, assistant
general manager, Dallas Water Utilities; and Interview
with Darrel Andrews, water quality manager,
Tarrant Regional Water District, Fort Worth, Texas,
November 18, 2008.
24
	 Data provided by Wendy Barron, team lead, Water
Supply & Strategy Analysis, Texas Water Development
Board; and Interview with Darrel Andrews, water
quality manager, Tarrant Regional Water District.
25
	 Interview with Mike Rickman, assistant general
manager, North Texas Municipal Water District.
26
	 Texas Water Development Board, Water for Texas
2007, Volume II, p. 251.
27
	 Letter from James M. Parks, chairman, Region C
Water Planning Group, October 13, 2008.
28
	 Texas Water Development Board, Water for Texas
2007 (Austin, Texas, January 2007), Volume II, p. 337,
http://www.twdb.state.tx.us/publications/reports/
State_Water_Plan/2007/2007StateWaterPlan/APP%20
2.1_final%20112906.pdf. (Last visited January 1, 2009.)
29
	 Interview with Stan Hayes, president, Hayes
Engineering, Longview, Texas, November 19, 2008.
30
	 Interview with Walt Sears, executive director, North
East Texas Regional Water Planning Group, Hughes
Springs, Texas, November 19, 2008.
31
	 Texas Water Development Board, Water for Texas
2007, Volume II, p. 251.
32
	 Interview with Jim Thompson, chairman, North
East Texas Regional Water Planning Group, Atlanta,
Texas, October 31, 2008.
33
	 Texas Water Development Board, Water for Texas
2007 (Austin, Texas, January 2007), Volume II, pp.
37-40, http://www.twdb.state.tx.us/publications/
reports/State_Water_Plan/2007/2007StateWaterPlan/
CHAPTER%202_REGIONAL%20E%20final_112706.
pdf. (Last visited January 1, 2009.)
34
	 Far West Texas Water Planning Group, Far West
Texas Water Plan (El Paso, Texas, January 2006), p.
4-10, http://www.twdb.state.tx.us/rwpg/2006_RWP/
RegionE/Complete_Text.pdf. (Last visited January 1,
2009.)
35
	 Texas Water Development Board, Water for Texas
2007, Volume II, pp. 337-338.
36
	 Far West Texas Water Planning Group, Far West
Texas Water Plan (El Paso, Texas, January 2006), p.
4-20, http://www.twdb.state.tx.us/rwpg/2006_RWP/
RegionE/Complete_Text.pdf. (Last visited January 1,
2009.)
37
	 Data provided by Stuart Norvell, manager,
Water Resources Planning Division, Texas Water
Development Board, Austin, Texas, November 19,
2008.
38
	 Interview with Bill Hutchison, manager, Water
Resources Division, El Paso Water Utilities, El Paso,
Texas, November 20, 2008.
39
	 Texas Water Development Board, Water for Texas
2007, Volume II, p. 251.
Liquid Assets: The State of Texas’Water Resources Texas Comptroller of Public Accounts52
Regional Water Planning
67
	 Letter from Mark Evans, vice-chair, Region H Water
Planning Group.
68
	 Texas Water Development Board, Water for Texas
2007 (Austin, Texas, January 2007), Volume II, pp.
61-66, http://www.twdb.state.tx.us/publications/
reports/State_Water_Plan/2007/2007StateWaterPlan/
CHAPTER%202_REGIONAL%20I_FINAL%20
112706.pdf. (Last visited January 2, 2009.)
69
	 Email communication from Kenneth Reneau, general
manager of the Angelina & Neches River Authority.
Lufkin, Texas, November 20, 2008.
70
	 Texas Water Development Board, Water for Texas
2007, Volume II, p. 251.
71
	 Interview with Kelley Holcomb, chair, East Texas
Region I Water Planning Group, Lufkin, Texas,
November 4, 2008.
72
	 Interview with Kelley Holcomb, chair, East Texas
Region I Water Planning Group.
73
	 Texas Water Development Board, Water for Texas
2007 (Austin, Texas, January 2007), Volume II, pp.
67-72, 342, http:// www.twdb.state.tx.us/publications/
reports/State_Water_Plan/2007/2007StateWaterPlan/
CHAPTER%202_REGIONAL%20J_FINAL_112706.
pdf. and http://www.twdb.state.tx.us/publications/
reports/State_Water_Plan/2007/2007StateWaterPlan/
APP%202.1_final%20112906.pdf. (Last visited
January 2, 2009.)
74
	 Interview with Charlie Hastings, director of Public
Works, City of Kerrville, Kerrville, Texas, November
20, 2008.
75
	 Interview with Johnathan Letz, Kerr County
commissioner and chairman of the Plateau Region J
Water Planning Group, Kerrville, Texas, November
13, 2008.
76
	 Texas Water Development Board, Water for Texas
2007, Volume II, p. 251.
77
	 Interview with Johnathan Letz, Kerr County
commissioner and chairman of the Plateau Region J
Water Planning Group.
78
	 Texas Water Development Board, Water for Texas
2007 (Austin, Texas, January 2007), Volume II,
p. 73, http://www.twdb.state.tx.us/publications/
reports/state_Water_Plan/2007/2007StateWaterPlan/
CHAPTER%202_REGIONAL%20K%20FINAL%20
112706.pdf. (Last visited January 2, 2009.)
79
	 Texas Water Development Board, Water for Texas
2007, Volume II, pp. 342-344.
80
	 Texas Water Development Board, Water for Texas
2007 (Austin, Texas, January, 2007), Volume II, pp.
73-78, http://www.twdb.state.tx.us/publications/
reports/State_Water_Plan/2007/2007StateWaterPlan/
CHAPTER%202_REGIONAL%20K%20FINAL%20
112706.pdf. (Last visited January 2, 2009.); and
interview with John Burke, chairman, Region K: The
Lower Colorado Water Planning Group, Bastrop,
Texas, November 19, 2008.
81
	 Lower Colorado Regional Water Planning Group,
Region K-2011 Plan, Draft Scope of Work: Lower
Colorado Regional Water Planning Area (Austin,
tx.us/rwpg/2006_RWP/RegionF/pdf/Region%20F%20
Chapters%205-10.pdf. (Last visited January 2, 2009.)
(Consultant’s report.); and Texas Water Development
Board, Water for Texas 2007, Volume II, pp. 43-48.
51
	 Texas Water Development Board, Water for Texas
2007 (Austin, Texas, January 2007), Volume II, pp.
49-52, http://www.twdb.state.tx.us/publications/
reports/State_Water_Plan/2007/2007StateWaterPlan/
CHAPTER%202%20regional%20G%20
FINAL_112806.pdf. (Last visited January 2, 2009.)
52
	 Texas Water Development Board, Water for Texas
2007, Volume II, p. 52.
53
	 Brazos G Regional Water Planning Group, “Exhibit
C: Scope of Work (Extracted from the TWDB / BRA
Final Contract signed 5/17/07),” pp. 1-2, http://www.
brazosgwater.org/fileadmin/brazosg_upload/2011_
brazosg_water_plan/Brazos_G_Scope_of_Work_
approved_051707.pdf. (Last visited January 2, 2009.)
54
	 Interview with Eddie Brown, city manager, City of
Sweetwater, Sweetwater, Texas, November 20, 2008.
55
	 Brazos G Regional Water Planning Group, “Exhibit
C: Scope of Work (Extracted from the TWDB / BRA
Final Contract signed 5/17/07),” pp. 3-5, http://www.
brazosgwater.org/fileadmin/brazosg_upload/2011_
brazosg_water_plan/Brazos_G_Scope_of_Work_
approved_051707.pdf. (Last visited January 2, 2009.)
56
	 Data provided by Wendy Barron, team lead, Water
Supply & Strategy Analysis, Texas Water Development
Board.
57
	 Interview with Michael Thane, utilities director, City of
Round Rock, Round Rock, Texas, November 20, 2008.
58
	 Brazos G Regional Water Planning Group, “Exhibit
C: Scope of Work (Extracted from the TWDB / BRA
Final Contract signed 5/17/07),” pp. 5-7.
59
	 Texas Water Development Board, Water for Texas
2007, Volume II, p. 251.
60
	 Email communication from Trey Buzbee,
administrative assistant, Brazos G Regional Water
Planning Group, Waco, Texas, October 20, 2008.
61
	 Texas Water Development Board, Water for Texas
2007 (Austin, Texas, January 2007) Volume II, pp.
55-60, http://www.twdb.state.tx.us/publications/
reports/State_Water_Plan/2007/2007StateWaterPlan/
CHAPTER%202_REGIONAL%20H_FINAL%20
112706.pdf. and pp. 340-341, http://www.twdb.
state.tx.us/publications/reports/State_Water_
Plan/2007/2007StateWaterPlan/APP%202.1_final%20
112906.pdf. (Last visited January 2, 2009.)
62
	 Letter from Mark Evans, vice-chair, Region H Water
Planning Group, October 24, 2008.
63
	 Data provided by Stuart Norvell, manager,
Water Resources Planning Division, Texas Water
Development Board.
64
	 Letter from Mark Evans, vice-chair, Region H Water
Planning Group.
65
	 Texas Water Development Board, Water for Texas
2007, Volume II, p. 251.
66
	 Texas Water Development Board, Water for Texas
2007, Volume II, p. 58.
Texas Comptroller of Public Accounts Liquid Assets: The State of Texas’Water Resources 53
Regional Water Planning
Volume II, p. 4C.14-0, http://www.regionltexas.org/
documents/2006rwp/vol2/Section_4C.14Regional_
Carrizo_to_Bexar_County.pdf. (Last visited January
3, 2009.) (Consultant’s report.)
96
	 Interview with Donovan Burton, manager of
Legislative Affairs, San Antonio Water Supply, San
Antonio, Texas, November 20, 2008.
97
	 South Central Texas Regional Water Planning Group
with San Antonio River Authority, South Central Texas
Regional Water Planning Area: 2006 Regional Water
Plan, by HDR Engineering, Inc., Margaret Dalthorp,
Paul Price Associates, Inc., and John Folk-Williams, Sr.
(Austin, Texas, January 2006), Volume II, p. 4C.15-1,
http://www.regionltexas.org/documents/2006rwp/vol2/
Section_4C.15Regional_Carrizo_for%20SSLGC.pdf.
(Last visited January 3, 2009.) (Consultant’s report.)
98
	 Interview with Alan Cockerell, general manager,
Schertz-Seguin Local Government Corporation,
Seguin, Texas, November 20, 2008.
99
	 Interview with Donovan Burton, manager of
Legislative Affairs, San Antonio Water System.
100
	Texas Water Development Board, Water for Texas
2007, Volume II, p. 251.
101
	Texas Water Development Board, Water for Texas
2007 (Austin, Texas, January 2007) Volume II, p. 82,
http://www.twdb.state.tx.us/publications/reports/
State_Water_Plan/2007/2007StateWaterPlan/
CHAPTER%202_REGIONAL%20L%20FINAL%20
112706.pdf. (Last visited January 3, 2009.)
102
	Texas Water Development Board, Water for Texas
2007 (Austin, Texas, January 2007) Volume II, p. 85,
http://www.twdb.state.tx.us/publications/reports/
State_Water_Plan/2007/2007StateWaterPlan/
CHAPTER%202_REGIONAL%20M_FINAL%20
112706.pdf. (Last visited January 3, 2009.)
103
	Texas Water Development Board, Water for Texas
2007 (Austin, Texas, January 2007) Volume II, p. 88,
http://www.twdb.state.tx.us/publications/reports/
State_Water_Plan/2007/2007StateWaterPlan/
CHAPTER%202_REGIONAL%20M_FINAL%20
112706.pdf. (Last visited January 3, 2009.)
104
	Rio Grande Regional Water Planning Group,
Region M Regional Water Plan, by NRS Consulting
Engineers, R.J. Brandes Company, LBG-Guyton
Associates, Fernandez Group, Inc., Texas Agricultural
Experiment Station, and Texas Cooperative Extension
(Harlingen, Texas, January 2006), pp. 4-53-54,
http://www.riograndewaterplan.org/downloads/
waterplan2006/ch04-identevalselect.pdf. (Last visited
January 3, 2009.) (Consultant’s report.)
105
	Interview with Jake White, director of Special
Projects, NRS Consulting Engineers, Harlingen,
Texas, November 20, 2008.
106
	Interview with Bill Norris, principal engineer, NRS
Consulting Engineers, Harlingen, Texas, November
24, 2008.
107
	Texas Water Development Board, Water for Texas
2007 (Austin, Texas, January 2007) Volume II, p. 346,
http://www.twdb.state.tx.us/publications/reports/
Texas), http://www.regionk.org/RegionK_2011Plan_
DraftSOW.pdf. (Last visited January 2, 2009.)
82
	 Texas Water Development Board, Water for Texas
2007, Volume II, p. 251.
83
	 Lower Colorado Regional Water Planning Group,
Region K-2011 Plan, Draft Scope of Work: Lower
Colorado Regional Water Planning Area.
84
	 Lower Colorado Regional Water Planning Group,
2006 Region “K” Water Plan for the Lower Colorado
Regional Water Planning Group with assistance from
Turner Collie & Braden, Alan Plummer Associates,
Inc., and Group Solutions RJW (Austin, Texas,
January 2006), p. 8-19, http://www.twdb.state.tx.us/
rwpg/2006_RWP/RegionK/Chapter%208.pdf. (Last
visited January 3, 2009.)
85
	 Lower Colorado Regional Water Planning Group,
Region K-2011 Plan, Draft Scope of Work: Lower
Colorado Regional Water Planning Area.
86
	 Texas Water Development Board, Water for Texas
2007 (Austin, Texas, January 2007), Volume II,
p. 79, http://www.twdb.state.tx.us/publications/
reports/State_Water_Plan/2007/2007StateWaterPlan/
CHAPTER%202_REGIONAL%20L%20FINAL%20
112706.pdf. (Last visited January 3, 2009.)
87
	 Texas Water Development Board, Water for Texas
2007 (Austin, Texas, January 2007), Volume II,
p. 80, http://www.twdb.state.tx.us/publications/
reports/State_Water_Plan/2007/2007StateWaterPlan/
CHAPTER%202_REGIONAL%20L%20FINAL%20
112706.pdf. (Last visited January 3, 2009.)
88
	 Texas Water Development Board, Water for Texas
2007, p. 344.
89
	 Lower Colorado River Authority, “Contractual
Agreement”, http://www.lcra.org/lswp/overview/
agreement.html. (Last visited January 3, 2009.)
90
	 Lower Colorado River Authority, LCRA-SAWS Water
Project Quarterly Status Report (Austin, Texas, 1st
Quarter 2008), p. 1, http://www.lcra.org/library/
media/public/docs/lswp/1st_Qtr_2008_Report.pdf.
(Last visited January 3, 2009.)
91
	 Lower Colorado River Authority, LCRA-SAWS Water
Project Quarterly Status Report.
92
	 Interview with Joe Rippole, project manager,
San Antonio Water Systems, San Antonio, Texas,
November 6, 2008.
93
	 Texas Water Development Board, Water for Texas 2007
(Austin, Texas, January 2007), Volume II, p. 345, http://
http://www.twdb.state.tx.us/publications/reports/
State_Water_Plan/2007/2007StateWaterPlan/APP%20
2.1_final%20112906.pdf. (Last visited January 3, 2009.)
94
	 Email communication from Rick Illgner, coordinator
of Intergovernmental Affairs, Edwards Aquifer
Authority, San Antonio, Texas, November 20, 2008.
95
	 South Central Texas Regional Water Planning Group
with San Antonio River Authority, South Central
Texas Regional Water Planning Area: 2006 Regional
Water Plan, by HDR Engineering, Inc., Margaret
Dalthorp, Paul Price Associates, Inc., and John
Folk-Williams, Sr., (Austin, Texas, January 2006),
Liquid Assets: The State of Texas’Water Resources Texas Comptroller of Public Accounts54
Regional Water Planning
com/13/38/1/default.aspx?projectID=805. (Last visited
January 5, 2009.)
123
	Texas Water Development Board, Water for Texas
2007, Volume II, p. 252.
124
	Coastal Bend Regional Water Planning Group, Nueces
River Authority, and HDR Engineering, Inc., 2011
Regional Water Plan: Study 1 Evaluation of Additional
Potential Regional Water Supplies for Delivery through
the Mary Rhodes Pipeline, Including Gulf Coast
Groundwater and Garwood Project, DRAFT (Corpus
Christi, Texas, November 2008), p. 1, http://www.
nueces-ra.org/CP/RWPG/pdfs/1.pdf. (Last visited
January 5, 2009.) (Consultant’s report.)
125
	Letter from Rocky Freund, staff, Coastal Bend
Regional Water Planning Group and Nueces River
Authority, November 4, 2008.
126
	Texas Water Development Board, Water for Texas
2007 (Austin, Texas, January 2007), Volume II, pp.
97-100, http://www.twdb.state.tx.us/publications/
reports/State_Water_Plan/2007/2007StateWaterPlan/
CHAPTER%202_REGIONAL%20O%20final%20
112706.pdf. (Last visited January 5, 2009.)
127
	Interview with Aubrey Spear, director of Water
Utilities, City of Lubbock, Lubbock, Texas, November
19, 2008.
128
	Texas Water Development Board, Water for Texas
2007, Volume II, p. 252.
129
	Llano Estacado Regional Water Planning Group,
Llano Estacado Regional Water Plan: Executive
Summary, by HDR Engineering, Inc. (Lubbock, Texas,
January 2006), pp. ES-23-27, http://www.llanoplan.
org/May%202006%20REVISED%20LERWPG%20
Plan/4%20-%20Region%20O%20Executive%20
Summary%20Final%202006%20Plan.pdf. (Last
visited January 5, 2009.) (Consultant’s report.)
130
	Texas Water Development Board, Water for Texas
2007 (Austin, Texas, January 2007), Volume II,
p. 103, http://www.twdb.state.tx.us/publications/
reports/State_Water_Plan/2007/2007StateWaterPlan/
CHAPTER%202_REGIONAL%20P_final%20112706.
pdf. (Last visited January 5, 2009.)
131
	Texas Water Development Board, Water for Texas
2007 (Austin, Texas, January 2007), Volume II, pp.
104-108, http://www.twdb.state.tx.us/publications/
reports/State_Water_Plan/2007/2007StateWaterPlan/
CHAPTER%202_REGIONAL%20P_final%20112706.
pdf. (Last visited January 5, 2009).
132
	Texas Water Development Board, Water for Texas
2007, Volume II, pp. 104-108.
133
	Texas Water Development Board, Water for Texas
2007, Volume II, p. 252.
134
	Interview with Patrick Brozowski, general manager,
Lavaca-Navidad River Authority, Edna, Texas,
November 6, 2008.
State_Water_Plan/2007/2007StateWaterPlan/APP%20
2.1_final%20112906.pdf. (Last visited January 3, 2009.)
108
	Interview with Jake White, director of Special
Projects, NRS Consulting Engineers.
109
	Rio Grande Regional Water Planning Group,
Region M Regional Water Plan, by NRS Consulting
Engineers, R.J. Brandes Company, LBG-Guyton
Associates, Fernandez Group, Inc., Texas Agricultural
Experiment Station, and Texas Cooperative Extension
(Harlingen, Texas, January 2006), pp. 4-24-25, 4-43,
http://www.riograndewaterplan.org/downloads/
waterplan2006/ch04-identevalselect.pdf. (Last visited
January 3, 2009.) (Consultant’s report.)
110
	Texas Water Development Board, Water for Texas
2007, Volume II, p.346.
111
	Email from Jaime Estrada, Brownsville Public Utility
Board, Brownsville, Texas, November 24, 2008.
112
	Texas Water Development Board, Water for Texas 2007
(Austin, Texas, January 2007) Volume II, p. 252, http://
www.twdb.state.tx.us/publications/reports/State_
Water_Plan/2007/2007StateWaterPlan/CHAPTER%20
9_112806.indd.pdf. (Last visited January 3, 2009.)
113
	Texas Water Development Board, Water for Texas
2007, Volume II, p. 88.
114
	Colorado State University, Colorado Water Resources
Research Institute and The Water Center, “Mexican
Treaty (1944),” http://waterknowledge.colostate.
edu/1944_mex.htm. (Last visited January 3, 2009.)
115
	International Boundary and Water Commission,
“Status Report of Rio Grande Water Deliveries by
Mexico,” (El Paso, Texas, November 22, 2008).
116
	Interview with Jake White, director of Special
Projects, NRS Consulting Engineers, Harlingen,
Texas, November 4, 2008.
117
	Interview with Jake White, director of Special Projects,
NRS Consulting Engineers, Harlingen, Texas,
November 4, 2008; and interview with Bill Norris,
principal engineer, NRS Consulting Engineers.
118
	Texas Water Development Board, Water for Texas
2007 (Austin, Texas, January 2007), Volume II,
p. 91, http://www.twdb.state.tx.us/publications/
reports/State_Water_Plan/2007/2007StateWaterPlan/
CHAPTER%202_REGIONAL%20N%20_final%20
112706.pdf. (Last visited January 3, 2009.)
119
	Coastal Bend Regional Water Planning Group,
Coastal Bend (Region N) Regional Water Plan:
Executive Summary by Nueces River Authority and
HDR Engineering, Inc. (Corpus Christi, Texas,
January 2001), p. ES-5, http://www.twdb.state.tx.us/
rwp/N/PDFs/N_Executive%20Summary.pdf. (Last
visited January 3, 2009.) (Consultant’s report.)
120
	Texas Water Development Board, Water for Texas
2007, Volume II, pp. 91- 92.
121
	Interview with Mark Van Vleck, deputy water
director, City of Corpus Christi, Corpus Christi,
Texas, November 21, 2008.
122
	HDR Engineering, Inc., “Coastal Bend (Region N)
Regional Water Supply Plan,” pp. 1-2, http://hdrinc.
Texas Comptroller of Public Accounts Liquid Assets: The State of Texas’Water Resources 55
State Water Plan: Issues and Funding
ties in East Texas, preventing the construction
of Fastrill reservoir, a water supply project which
had been sought by the city of Dallas.2
This des-
ignation is being appealed.
Acquisition and protection of future sites is
also an issue. To address this, the Texas Water
Development Board (TWDB) controls the Stor-
age Acquisition Fund for projects related to the
acquisition and development of water storage.3
In 2007, the 80th Legislature enacted Senate Bill
3. Among its provisions, the bill designated 19
sites identified in the State Water Plan as having
unique value for the construction of a dam and
reservoir, a designation that will expire in 2015
unless an affirmative vote for a project is made
by the project sponsor, such as the governing
body of a city. Although the bill did not initiate
reservoir construction, it did lay the ground-
In addition to the strategies identified by water
planning regions, the 2007 Texas State Water
Plan highlighted several policy issues to be
addressed in implementing the plan. Some of
the recommendations were enacted by the 80th
Legislature in 2007, while others have not yet
been addressed.
Reservoir Site Designation and Acquisition
Development and construction of new reservoirs
remains an ongoing policy issue. An important
factor in preserving future reservoir sites for
construction is proper designation by the Legis-
lature. Actions by federal, state or local govern-
ments to protect ecosystems in or near reservoir
sites can sometimes impede development.1
For
example, in 2006 the U.S. Fish and Wildlife
Service designated a federal wildlife refuge on
25,000 acres in Anderson and Cherokee coun-
State Water Plan: Issues
and Funding
Cotton fields near Lubbock, Texas
Liquid Assets: The State of Texas’Water Resources Texas Comptroller of Public Accounts56
State Water Plan: Issues and Funding
Rivers need a base
level of flow to
preserve the fragile
ecosystems that
surround them.
Coastal bays and
estuaries need
freshwater inflows
to maintain the
delicate balance
between freshwater
and seawater that
sustains wildlife and
supports shrimping,
fishing, recreation,
and other coastal
industries.
Groundwater Regulation in Texas
For more than a century, Texas’ groundwater has
been governed under the “rule of capture,” a te-
net based in English common law that considers
groundwater to be a privately owned resource.
Thus in Texas groundwater is treated differently
from surface water, which is publicly owned and
requires a permit for use.
Under the rule of capture, as adopted by the
Texas Supreme Court in 1904, a Texas land-
owner may pump a virtually unlimited amount
of groundwater from below his or her land.7
The court has established only limited excep-
tions to this rule, requiring that the water be put
to a beneficial use; that a landowner may not
withdraw water to maliciously injure a neighbor;
and that a landowner cannot cause subsidence
to a neighbor’s land as a result of groundwater
withdrawals.8
Since adopting the rule of capture, Texas
courts have deferred to the Legislature regard-
ing groundwater regulation. In 1997, Senate
Bill 1 took a major step toward altering the
state’s approach to groundwater regulation by
strengthening the role of groundwater conserva-
tion districts, specifying that these districts are
the preferred method for managing the state’s
groundwater.9
Groundwater districts can be created by local
voters or through legislation. At this writing,
Texas has 95 groundwater districts.10
These
districts can regulate well spacing and may limit
groundwater production.
In some areas, more than one groundwater
district manages land over a single aquifer. In
these cases, groundwater districts must work
together under the framework of a “groundwater
management area” that encompasses the aquifer.
Districts in a groundwater management area
collaborate to ensure that groundwater with-
drawals are consistent with their plans for the
aquifer.
Parts of the state that are without a groundwater
district, however, remain governed by the rule
of capture. Because groundwater is less highly
regulated than surface water, water marketers
work for it by designating these sites. To address
concerns over the controversial Marvin Nichols
reservoir planned along the Sulphur River in
Red River and Titus Counties, a study com-
mission will examine water needs in Region C
(Dallas-Fort Worth) and recommend, no later
than December 1, 2010, whether Marvin Nichols
should remain designated as a reservoir site.4
Reservoir designation and construction are con-
troversial issues. Development can conflict with
the interests of local landowners whose property
would be flooded, and environmental concerns
such as habitat loss, diminished downstream
flows and pollution have also led to opposition.
Interbasin Transfers of Surface Water
Interbasin transfer of surface water is the practice
of moving surface water from one river basin
to another. This provides an important source
of regional water supply for some, and has been
used to meet water demand shortages in various
regions. Current state laws, however, substantially
restrict the free flow of interbasin transfers.
Prior to the passage of Senate Bill 1 in the 75th
Legislative Session (1997), interbasin transfers
were significantly more accessible. With Senate
Bill 1, the state adopted the “junior water rights
provision.” This regulation requires any water
right that transfers surface water from one river
basin to another to be reclassified as “junior.”
This reclassification means that senior water
rights allowing the transfer of surface water
outside the basin become junior to other water
rights within the basin. For this reason intra-
basin water rights have priority over interba-
sin rights. In drought years when there is not
enough surface water to satisfy all water rights,
junior interbasin rights may not be satisfied.5
Since the passage of Senate Bill 1, only two inter-
basin transfers have been authorized. Opponents
argue that the Legislature should repeal the
1997 provisions to restore the volume of inter-
basin transfers and facilitate free flows of water
throughout the state.6
Others point out that the
process can harm agricultural or historic users
in the originating river basin and that these us-
ers have a right to be protected.
Texas Comptroller of Public Accounts Liquid Assets: The State of Texas’Water Resources 57
State Water Plan: Issues and Funding
Conservation
initiatives will help
supply nearly 23
percent of the state’s
water requirements
by 2060.
Environmental Water Needs
Environmental concerns regarding water alloca-
tion are a crucial part of state water planning.
Rivers need a base level of flow to preserve the
fragile ecosystems that surround them. Coastal
bays and estuaries need freshwater inflows to
maintain the delicate balance between fresh-
water and seawater that sustains wildlife and
supports shrimping, fishing, recreation, and
other coastal industries. It is important for
state officials to have accurate information on
environmental flow requirements when they
issue permits for municipal, industrial and ag-
ricultural uses. And water rights applicants and
permit holders need reliable information from
the state to plan adequately for environmental
issues. Although state agencies have studied
environmental inflow needs since 1977, until
recently the results were not widely accepted or
incorporated into the water right permitting and
planning process.11
In 2007, Senate Bill 3 passed by the legislature
included a process to determine the environ-
mental needs of Texas rivers, bays and estuaries.
This process incorporates a bottom-up planning
approach, where basin stakeholder committees
and expert science teams submit environmental
recommendations to the Environmental Flows
Advisory Group and the Texas Commission on
Environmental Quality (TCEQ), which then
develops environmental flow standards. These
flow standards are developed to inform water
rights applicants of water to be set aside for the
environmental protection of rivers, bays and
estuary ecosystems.12
Currently, two river basin/bay stakeholder
committees are active: the Sabine and Neches
Rivers/Sabine Lake Bay Stakeholder Commit-
tee and the Trinity and San Jacinto Rivers/
Galveston Bay Stakeholders Committee. These
committees have appointed experts to gather
research on environmental flow needs specific
to these river and bay systems. TCEQ is sched-
uled to adopt environmental flow standards
for these regions by May 2011. As specified by
Senate Bill 3, the remaining river basin and
bay systems will begin their planning process
in the coming months and all will be active by
June 2010.13
In addition, the Environmental
have become increasingly interested in ground-
water resources as an option for meeting grow-
ing demand.
In recent months, several important court rul-
ings have highlighted the contentious nature of
groundwater regulation in Texas. In Guitar Hold-
ing Co. L.P. v. Hudspeth County Underground
Water Conservation Dist. No. 1, et al. (December
2007), the Texas Supreme Court found that when
using historic usage to permit groundwater
withdrawals, a district must consider not only the
amount of water historically permitted to a land-
owner, but also the purpose for which the water
had been used. According to the court, “because
transferring water out of the district is a new use,
it cannot be preserved or ‘grandfathered.’” The net
effect of the court’s ruling was to level the playing
field for landowners in the Hudspeth County Un-
derground Water Conservation District, mean-
ing that landowners who do not have a history of
irrigating now have a right to export water that is
equal to those who have historically drawn from
the aquifer, and both must apply for a new permit
on an equal basis.
Two recent rulings by the Fourth Court of Ap-
peals in San Antonio clarified the status of a
landowner’s ownership right to groundwater. In
February 2008, the court ruled in City of Del Rio
v. Clayton Sam Colt Hamilton Trust that ground-
water is the property of a landowner whether or
not it has yet been captured by the landowner. In
August 2008, the Fourth Court of Appeals ruled
in Edwards Aquifer Authority v. Day that a land-
owner has a vested ownership right in ground-
water, potentially opening the door to compen-
sation for landowners if a groundwater district
restricts their ability to withdraw groundwater
from their property.
These recent court rulings have affirmed the
state’s long-held position on ownership of
private property, as codified in 1995 by SB 14,
the Private Real Property Rights Act, authored
by Senator Teel Bivins and then-Representative
Susan Combs. Groundwater is the property of
the owner of the land overlying the aquifer, and
efforts to interfere with this right could result in
both uncertainty of ownership and enormous
economic consequences for our state.
Liquid Assets: The State of Texas’Water Resources Texas Comptroller of Public Accounts58
State Water Plan: Issues and Funding
Major challenges
affecting each
water region include
decreased federal
assistance, the
competition for
funding by non-water
infrastructure needs
and time necessary
to complete water
projects.
those plans or a waiver from TWDB and from
the appropriate regional water planning group.
The amendment process can be costly and dif-
ficult, requiring such actions as a 60-day notice
and comment period; notices to municipalities
and river authorities; notices published in local
newspapers; and public hearings and comments.
To streamline this process, TWDB has recom-
mended an expedited process for projects that
would not result in over-allocation of water
resources, was not a reservoir project and would
not significantly impact environmental flows.
This proposed process would require a two-week
public notice of an entity’s intent to amend the
water plans, followed by a public meeting in
which the planning group must consider any
public comment before amending the plan.17
The
agency claims that this recommendation would
significantly accelerate the amendment process
and afford economically disadvantaged areas
more opportunities.
Indirect Reuse
Indirect reuse occurs when wastewater treat-
ment plants discharge water into a stream and
that water is diverted and reused by the same
permit holder downstream creating, in effect, a
closed loop system. Under current law, indirect
reuse requires a “bed and banks” permit that
authorizes a water rights holder to transmit
water in a watercourse. This is contrasted with
direct reuse, in which water is sent directly from
a treatment plant to a location where it is used
again without reentering the river or stream.
Conflicts have arisen over indirect reuse because
downstream users argue that discharged water
falls under the “first come, first served” doctrine
of “prior appropriation.” Prior appropriation al-
lows the water rights holder with the most senior
permit full use of his or her permitted amount
before the next most senior permit holder can
exercise his or her use. Under this doctrine, any
entity interested in reusing water that had been
discharged into a river would have to apply for
another, more junior permit in order to use
that water. Proponents of indirect reuse believe
that they should be allowed to reuse discharged
effluent downstream in order to meet growing
demand for water.
Flows Advisory Group, which will ultimately
recommend environmental flow set-aside levels
to TCEQ, was appointed by the governor, in
December 2007.14
This group has met several
times, as has the Environmental Flows Science
Advisory Committee, which advises the Envi-
ronmental Flows Advisory Group on technical
and scientific questions.
Water Conservation
Water conservation is an integral part of the
Texas Water Plan. Conservation initiatives will
help supply nearly 23 percent of the state’s water
requirements by 2060. The 78th Legislature
established a Water Conservation Implementa-
tion Task Force that developed best practices for
regional water planners to enhance conservation
efforts statewide. The task force made 25 recom-
mendations for conservation initiatives at the
state level.
Examples of these recommendations included
efforts to raise water conservation awareness,
tying state water funding to water conservation
requirements, grants to fund innovations in
water conservation, and the establishment of a
water management resource library. Of the 25
statewide recommendations made by the task
force, three need continued funding for existing
programs, eight require new or additional fund-
ing and 13 require legislation and, in most cases,
additional funding.15
In addition to these measures, in 2007 the
80th
Legislature established a statewide water
conservation public awareness program and
required public utilities serving at least 3,300
water utility connections to develop a water
conservation plan. The Legislature also estab-
lished the Water Conservation Advisory Coun-
cil, to provide guidance on water conservation
issues.16
Expedited Amendment Process
To qualify for state funding assistance, Texas
law requires that water supply projects are
consistent with the state and regional plans, and
receive surface water right permits from TCEQ.
If a project does not conform to the state water
plan and to the regional water plan, the project’s
applicant must seek either an amendment to
Texas Comptroller of Public Accounts Liquid Assets: The State of Texas’Water Resources 59
State Water Plan: Issues and Funding
Through the State
Participation
Program (SPP), TWDB
provides loans to
local governments
for the construction
of water facilities
where local funding
is inadequate and the
entity cannot assume
the necessary debt.
subsequently updated this number to $2.4 bil-
lion. In the summer of 2008 TWDB completed
a new infrastructure finance survey and the
agency now estimates that the state will need to
provide $16.6 billion by 2060.19
Current Water Project Financing
Water projects in Texas are funded by state
and local sources. For the past four years, state
funding has made up approximately 2 percent
of total water project funding in Texas. In fiscal
2008, TWDB provided $137.9 million, which
was 3 percent of the total debt issued in Texas
for water projects.20
Texas’ primary funding mechanism has been
the issuance of general obligation (GO) bonds
backed by the state. TWDB has authority to
issue $4.9 billion in GO bonds. As of August 31,
2008, the agency had issued $2.5 billion in GO
bonds with a remaining $2.4 billion in issuance
authority.21
Although TWDB has constitutional
authority to issue the bonds, the agency depends
upon the Legislature to make an appropriation
for debt service (interest and principal pay-
ments) on any non-self supporting bonds issued.
Therefore, debt service amounts appropriated
by the Legislature affect the amount that TWDB
can issue in GO bonds each biennium.
The 80th
Legislature authorized TWDB to issue
$874.8 million in non-self-supporting GO bonds
with debt service payments of $39.8 million for
fiscal 2008 and $70.9 million for fiscal 2009.22
The majority of these debt service amounts will
be paid from general revenue. Of the bonds
authorized for issuance during the 2008-09 bi-
ennium, $762.8 million will be used for projects
in the State Water Plan.23
TWDB provides grants and loans to local
entities for funding the planning, design and
construction of water and wastewater proj-
ects. Grants are provided primarily through
the Economically Distressed Areas Program
(EDAP), while loans are provided through the
State Participation Program, the Water Infra-
structure Fund (WIF), the Clean Water State
Revolving Fund, and the Drinking Water State
Revolving Fund. Typically, the proceeds from
GO bond issuances are used to provide loans
Ultimately, many water users believe that the
Legislature should clarify water rights accord-
ingly. Potential issues that could be addressed
include: the uniform status of water that is de-
rived from different sources; whether water from
future or existing sources is treated uniformly;
who can obtain indirect reuse rights; and envi-
ronmental protection in reuse permitting.18
Financing Water Management
Strategies
The 2007 State Water Plan’s total price tag is
$30.7 billion, which represents capital costs asso-
ciated with supplying water to regional systems.
Capital costs do not include funds for water
distribution within a water supplier’s service
area, forcing suppliers to shoulder a variety of
investment strategies to meet water needs.
Major challenges affecting each water re-
gion include decreased federal assistance,
the competition for funding by non-water
infrastructure needs and time necessary to
complete water projects. Local water groups
are receiving less federal support for infra-
structure, and are feeling the pinch of higher
real interest rates, water scarcity, and rising
energy costs, which all erode spending power
on water projects. Additionally, water projects
must compete with other infrastructure needs
brought about by population growth, such as
roads and schools.
The length of time needed for large water proj-
ect construction prevents many local groups
from implementing projects without state help.
Current legal and regulatory barriers require
10 years for planning, and local sponsors are
reluctant to approve projects with little short-
term benefit. Economically disadvantaged areas
cannot raise necessary capital without sufficient
income from residents, adding another barrier
to water development without state assistance.
Of the $30.7 billion cost of proposed projects
in the 2007 state water plan, municipalities and
other jurisdictions indicate that the state will
need to provide $2.1 billion by 2060. State funds
would aid in initiating essential, large scale
projects in communities across the state. TWDB
Liquid Assets: The State of Texas’Water Resources Texas Comptroller of Public Accounts60
State Water Plan: Issues and Funding
ing programs, proceeds from the sale of bonds are
used to make loans to communities. Repayments
from the communities are then deposited to the
particular program fund. These repayments are
insufficient to pay all the debt service required
and general revenue pays the remaining amount
required to pay debt service.
Non-Self-Supporting GO Bond Programs
Through the State Participation Program (SPP),
TWDB provides loans to local governments for
the construction of water facilities where local
funding is inadequate and the entity cannot
assume the necessary debt. To ensure that the
project is built with enough capacity to serve fu-
ture growth, TWDB will defer repayment of the
loan until an adequate customer base has been
established. In exchange, TWDB may acquire
an ownership interest in the water rights or co-
ownership in the facility or property.24
TWDB
continues to pay the debt service amounts on
the original GO bond issuance while local enti-
ties repay the entire loan amount on a deferred
timetable. TWDB is authorized to issue $326.1
million in bond authority during the 2008-09
biennium with $276.1 million to be used for
projects in the State Water Plan.25
EDAP provides loans and grants in economically
distressed areas where water or wastewater sys-
tems are inadequate and the financial resources to
provide services are insufficient. Qualifying sys-
tems include colonias on the Texas-Mexico border
and unincorporated areas across the state. Eligible
projects are in areas where the median household
income is less than 75 percent of the median state
household income. In 1991, voters approved $250
million in bonds for the EDAP program and in
2007 approved an additional $250 million. By
the end of fiscal 2007, $238 million had been
issued.26
Out of the authorized issuance of $99.5
million in the 2008-09 biennium, $37.5 million is
for projects identified in the State Water Plan. By
using GO bond proceeds and federal funds in the
Colonia Wastewater Treatment Assistance Pro-
gram, TWDB has provided $570.9 million to 103
projects in 24 counties, affecting 328,069 residents
in 676 colonias.27
WIF was created in 2001 for making grants and
low-interest loans to communities for water
to local entities that in turn pledge to pay
back the loans. Local entities apply for state
financial assistance when they cannot assume
enough debt for a project or if they can obtain
more favorable terms from a state program.
Loans are available to a variety of entities and
political subdivisions including:
•	 cities;
•	 counties;
•	 river authorities;
•	 special law districts;
•	 water improvement districts;
•	 water control and improvement districts;
•	 irrigation districts;
•	 groundwater districts; and
•	 nonprofit water supply corporations.
Some of TWDB’s loan programs offer local
entities the option of deferred payments or a
repayment rate below market rates. Deferring
payments after the completion of a project lets
local entities build the required customer base
to generate enough revenue to repay the loan.
TWDB also offers loans below the market rate
to encourage local entities to begin crucial water
projects for the region. In the case of deferred
loans, from the State Participation Fund, the
state recovers all of the principal and interest.
Under the Water Infrastructure Fund, the dif-
ference between TWDB’s cost for debt service
and the amount paid back by the local entities
represents a cost to the state.
TWDB administers both self-supporting and
non-self-supporting GO bond programs. In self-
supporting programs, such as the Water Develop-
ment Fund, proceeds are used to make loans to
communities and loan repayments are used to
pay debt service on these bonds and make addi-
tional loans. Repayments by local entities are then
deposited to the same fund for debt service pay-
ments and additional loans. In non-self-support-
Texas Comptroller of Public Accounts Liquid Assets: The State of Texas’Water Resources 61
State Water Plan: Issues and Funding
Water state revolving funds. Through this initia-
tive, TWDB can make one loan to a municipality
for multiple water projects. TWDB funds the 20
percent federally required state match for the
Clean and the Drinking Water state revolving
funds primarily by using bond proceeds amounts
from the Water Development Fund II.33
Rural political subdivisions that include mu-
nicipalities and water districts with a population
under 10,000 and counties where no urban area
has a population more than 50,000 qualify for
Rural Water Assistance Fund loans. The pro-
gram issues Alternative Minimum Tax (AMT)
bonds through the state’s private activity bond
program and under DFUND authority. The
AMT bond allow TWDB to offer loans at rates
below taxable market rates to non-profit water
supply corporations. Another benefit to the pro-
gram is that construction purchases by nonprofit
water supply corporations may receive a sales tax
exemption.34
Since the program’s inception in
2001, $104.8 million has been committed to 34
rural communities through the program.35
Federal Financial Assistance
TWDB operates two revolving loan funds that
receive federal capitalization grants. The Clean
Water State Revolving Fund (CWSRF) was
established in 1988 in compliance with the Clean
Water Act and the Drinking Water State Revolv-
ing Fund (DWSRF) established in 1997 in compli-
ance with the Safe Water Drinking Act.36
Each of
these funds receives a federal grant and the state
must provide a match of 20 percent of the federal
amount. The state matching amount is provided
by bonds issued through the Water Development
Fund. CWSRF program funds are used as col-
lateral to issue CWSRF revenue bonds to leverage
the program. By leveraging the federal and state
match amounts, TWDB is able to make more and
larger loans than would be possible using only the
amounts in the funds. Repayment of the loan is
made by the local entity and these amounts are
deposited in the respective fund and used to pay
debt service and secure additional bond issu-
ances. TWBD provides these loans at rates of 1
percent to 4 percent below market rates.37
The CWSRF provides loans to political subdivi-
sions (except nonprofit water supply corpora-
projects, but it did not receive any appropria-
tions until 2007. Currently, TWDB can issue
$449.3 million in GO bonds for funding projects
in the State Water Plan.28
Bond proceeds are
used to make loans at a subsidized interest rate
of 2 percent below the cost for TWDB and no
less than zero percent. Since the state offers local
entities loans at a lower rate than the state is pay-
ing for the debt service, general revenue is used
to make up the difference. To advance projects
that have significant planning and design stages,
locals may defer repayment for up to 10 years or
until end of construction for the project.29
TWDB has constitutional authority to issue up
to $200 million in GO bonds for the Agricultur-
al Water Conservation Fund (AWCF). Through
the AWCF, TWDB can provide grants to state
agencies and political subdivisions for conserva-
tion activities and the purchase and installation
of metering devices for irrigation use. Loans
are available for projects such as converting ir-
rigated land to dryland farming, more efficient
use of precipitation and brush control activities.
Local banks and credit systems also can apply to
this program for funds. Through linked depos-
its, banks or farm credit associations are able
to offer a lower rate for loans to individuals.30
In exchange, the lender pays a less-than-market
interest rate on state funds deposited with the
lender. To date, TWDB has loaned $35.2 million
to political subdivisions, individuals, and local
lending institutions through the AWCF.31
Self -Supporting Bond Programs
The Water Development Fund I was established
in 1957 when voters approved a constitutional
amendment authorizing $200 million in GO
bonds for water projects. In 1997, a new Water
Development Fund II was established to update
the process used to loan and distribute funds.32
This constitutionally dedicated fund provides
most of TWDB’s authority to issue GO bonds
for such programs as the SPP, EDAP, WIF and
RWAF. The Water Development Fund program
offers TWDB flexibility as a wide array of water
projects are eligible for funding. The self-support-
ing component of the Water Development Fund
provides loans to entities that need state assis-
tance, are unable to wait for federal funds, and
are ineligible for either the Clean or the Drinking
Liquid Assets: The State of Texas’Water Resources Texas Comptroller of Public Accounts62
State Water Plan: Issues and Funding
mechanism exists. Debt service on non-self-
supporting general obligation bonds is paid with
general revenue from state taxes.
The Water Development Board has identi-
fied $2.4 billion in state funding that will be
needed to support $30.7 billion in local projects
identified in the State Water Plan. Texas needs
a funding system for water projects that pro-
vides a link between these water development
projects and end users. The Texas Legislature is
actively exploring the options that are available
for funding water projects and may act on the
issue in the 2009 legislative session. Although
no funding mechanism has been adopted so far,
policymakers have considered several propos-
als. Most recently, the Joint Committee on State
Water Funding has held hearings considering
several options.
Funding proposals presented by TWDB and the
Joint Committee on State Water Funding include:
•	 a state sales tax increase;
•	 a water conservation and development fee;
•	 a water rights fee;
•	 a water connection fee; and
•	 a sales tax on bottled water.
Research has shown that the following criteria
represent ideal principles by which to evaluate
water project funding proposals:
1.	Adequacy: The financing mechanism should
be sufficient to cover identified costs without
excessively burdening those who pay the fees.
2.	Balance: The burden for funding water proj-
ects should be spread among all water user
groups in relative proportion to each group’s
demand for water, and no group should be
favored.
3.	Specificity: Funds that are raised should be
used for water development projects and not
diverted for other budgetary obligations.
tions) for wastewater treatment facilities and
pollution projects that address compliance with
the federal Clean Water Act. In addition to
providing loans to political subdivisions, banks
or farm credit associations may apply for linked
deposits to make loans for nonpoint source
pollution control projects.38
TWDB has received
$3.0 billion in federal capitalization grants as of
2007 and has provided $5.2 billion in loans to
local entities.39
Loans provided through the DWSRF ensure
public drinking water systems comply with the
federal Safe Drinking Water Act regulations
and the State Water Plan. In addition to political
subdivisions, nonprofit water supply corpora-
tions, privately owned water systems, and state
agencies are also eligible for funding. Loans can
be used for water supply infrastructure upgrades,
compliance with federal health standards and
the purchase of land or easements in order to
prevent contamination of a drinking system water
source.40
TWDB has received $685.2 million in
federal capitalization grants as of 2007 and has
provided $971 million in loans to local entities.41
Proposed Revenue Sources
By adopting a statewide planning process to
identify and pursue water development proj-
ects, the State of Texas has established water
infrastructure as an important public priority.
However, Texas also has many other impor-
tant spending priorities. In coming years, as
the Texas population expands, public demand
for services provided by state government will
grow. State expenditures on health care, public
education, higher education, public safety and
transportation infrastructure will continue to
exert pressure on the state’s budget. In addi-
tion, given the relatively high levels of property
and sales taxation in Texas, it is questionable
whether these sources will be available for addi-
tional funding. Thus, a dedicated funding source
for those projects may need to be established to
ensure steady progress toward adequate future
water supplies.
Since 1997, the Legislature has considered
establishing a dedicated funding mechanism for
water programs. Currently, however, no such
Texas Comptroller of Public Accounts Liquid Assets: The State of Texas’Water Resources 63
State Water Plan: Issues and Funding
in proportion to the water that they consume. As-
suming an industrial exemption, revenue would
decline to an estimated $220.1 million in fiscal
2008 and $242.8 million in fiscal 2011. This is
based on estimated taxable retail sales of water and
sewer services of $3.5 billion in fiscal 2008 and $3.9
billion in fiscal 2011. The sales tax on water services
accounts for 60 percent of the total water/sewer
sales tax revenue, with wastewater service account-
ing for the rest. By applying the 6.25 percent state
sales tax to water sales, the average monthly water/
sewer bill would increase by approximately $1.66
per month for residential customers and approxi-
mately $10.51 for commercial customers.44
Proponents of this approach argue that this op-
tion generates substantial revenue and would be
easy to administer. These amounts could be used
to replace general revenue funds for the payment
of debt service. Annual amounts for debt service
associated with the State Water Plan are expected
to increase significantly, but annual revenues
generated from this sales tax would exceed that
amount. Sales tax revenue could also be used
to supplant a portion of GO bond proceeds in
the future, providing a savings to the state by
avoiding debt service costs. In addition, a tax
on water sales would discourage water waste, as
taxes increased with increases in water use, which
could further be discouraged if higher levels of
water use were priced at marginally higher rates.
The regressive aspect of this approach would be
minimized by providing an allowance for a base
level of residential use that would go untaxed.
Critics point out that although this tax is a small
portion of a user’s residential water bill, sales tax-
es are regressive, meaning that their burden falls
more heavily on lower-income taxpayers than
on higher-income taxpayers. Some critics think
it would be unfair for industrial users to get an
exemption while residents and other commercial
users pay the tax. In addition, some argue that it
would be problematic for the tax to be a function
of both consumption and the price for water that
is charged by a utility, rather than exclusively
basing it on water use. Finally, unless the revenue
stream was established as a dedicated fund, these
amounts would be credited to the General Rev-
enue Fund (as is most sales tax) and could be used
to pay for other government programs.
4.	Equity: The plan should be sensitive to water
users’ ability to pay, since a certain level of
water consumption is nondiscretionary and
essential for every individual’s health. No plan
should unduly burden individuals who might
have difficulty paying for it.
5.	Efficiency: The plan should be easy to admin-
ister, comply with and understand. Such a
plan also should avoid distorting economic
activity by favoring certain user groups or
creating incentives favoring certain types of
water projects.
6.	Conservation: The financing system should be
consistent with the goal of water conservation
and discourage inefficient uses.
Policymakers should strive to find the appropriate
balance among these criteria.
State Sales Tax Proposal
Under this proposal, the state sales tax rate of 6.25
percent would apply to currently exempt retail
sales of water or sewer services by public water
supply systems. In addition to a state sales tax,
local governments could apply a local tax on retail
water sales. Typical exemptions include govern-
ment entities, education, charitable and nonprofit
organizations and chambers of commerce. Resi-
dential users would also receive a fixed monthly
exemption to account for basic water needs.
Assuming an exemption for the first 5,000 gallons
of household residential use per month, state rev-
enues generated from a sales tax on both water and
sewer services would be an estimated $243.2 mil-
lion in fiscal 2008, increasing to $266.6 million in
fiscal 2011. This estimate is based on taxable retail
sales of water and sewer services of $3.9 billion in
fiscal 2008 and $4.3 billion in fiscal 2011.42
In 2003,
average per person-per month water use ranged
from approximately 3,750 gallons in Killeen to ap-
proximately 8,250 in Richardson.43
Taxing industrial users would have been exempt.
Industrial users have argued that they should be
exempt from this tax because they are taxed on
their final product. They point out that manufac-
turers’ inputs typically are exempt from sales tax.
Others argue that industrial users should be taxed
Liquid Assets: The State of Texas’Water Resources Texas Comptroller of Public Accounts64
State Water Plan: Issues and Funding
Water Funding Mechanisms in Other States
Because of high costs associated with building water infrastructure, many states issue GO or revenue bonds
to pay for large water projects. States use additional funding mechanisms to support water quality, conser-
vation and some infrastructure projects.46
Arizona
Arizona levies a 5 percent transaction privilege tax on the gross sales or income derived by an entity that
furnishes water, including cities and municipalities. The delivery of water by federal or state government
entities is exempt generally. The state exempts bottled water (other than water delivered by a retailer to an
office or business) and governmental entities. Residential and commercial users pay a water quality fee of
$0.0065 per 1,000 gallons of water. The state uses this fee for water quality improvement projects. The state
also collects a storm water fee of 50 cents on each utility account.
Arkansas
Arkansas applies a 6 percent state sales tax on residential, commercial and industrial water sales. Large users
of water are assessed an annual water use fee in the amount of $10 per registered-surface water diversion
and $10 per registered well. The state funds water conservation programs using these fees.47
California
In California, water rights holders pay an annual fee of 3 cents per acre-foot of “authorized” water.
Kansas
Kansas assesses a water protection fee of 3 cents per 1,000 gallons of water on the following: 1) water sold
at retail by public water supply systems; 2) water appropriated for industrial use; and 3) water appropriated
for stock watering. The state charges an inspection fee on each ton of fertilizer offered for sale and deposits
$1.40 per ton to the State Water Plan Fund. The state deposits $100 of each pesticide registration fee to the
State Water Plan Fund. Kansas also assesses a Clean Water Drinking fee of 3 cents per 1,000 gallons of retail
water sold by a public water supply system. The state deposits 95 percent of this in the State Water Plan
Fund, using 85 percent of this amount for the renovation and protection of lakes and 15 percent for techni-
cal assistance for public water supply systems.48
Louisiana
Louisiana applies a 3.8 percent sales tax on water sales to commercial and industrial users. While individual
residential consumers are exempt, sales where one meter applies to several residential units, multi-family
rentals for example, are subject to the tax.
Michigan
Michigan assesses an annual water use fee on community water supply systems ranging from $372 to
$124,791, depending on the number of people served by the water system.49
The state also charges non-
community water suppliers a fee. Facilities with wells serving primarily transient populations, including
campgrounds, rest stops, motels and restaurants, are assessed an annual fee of $104. Larger, non-communi-
ty water systems, such as schools and businesses, that serve the same 25 or more persons on a routine basis,
are assessed $442 per year. The state uses the fees to administer Michigan’s Clean Drinking Water Act.
Nebraska
Nebraska levies a 5.5 percent sales tax on amounts paid for through sewer and water services. The state
exempts water used for agricultural irrigation and manufacturing.
Texas Comptroller of Public Accounts Liquid Assets: The State of Texas’Water Resources 65
State Water Plan: Issues and Funding
in fiscal 2008 and 557.5 million in fiscal 2011.53
Residential users would see an estimated 48
cents per month average increase to their water
bill while commercial customers would see a
$4.66 monthly increase.54
A change in the number of exempted residential
gallons would increase revenue for both the sales
tax proposal and the water conservation fee pro-
posal. Reducing the number of gallons exempted
by 1,000 would increase average annual revenue
amounts by $17.9 million for the sales tax and $9
million for the water conservation fee revenue,
based on fiscal 2008. This also would result in
a corresponding increase in the monthly water/
sewer bill of residential customers of an average
of 20 cents for the sales tax and 10 cents for the
water conservation fee.
Supporters claim that this option would gener-
ate sufficient revenue to replace general revenue
funds for expected annual debt service payments
associated with the State Water Plan for all but a
few years. In the future, these revenues could also
supplant some GO bond financing, depending on
debt service demands. This fee is a small portion
of the average monthly water bill and provides a
residential exemption for basic water uses. The
fee and exemption could also be changed based
on estimated future needs. While costs may be
Water Conservation and
Development Fee Proposal
Legislation introduced, but not passed, in the
79th Legislature in 2005 would have established a
water conservation and development fee of $0.13
per 1,000 gallons used by consumers each month.
The fee would have been collected by public water
supply systems, remitted to the Comptroller and
deposited to the Water Infrastructure Fund.
The first 5,000 gallons of water used by a residen-
tial customer each month would not be subject
to the fee. Exemptions from the fee would have
included governmental entities, educational,
charitable and nonprofit organizations, and
chambers of commerce, and could be expanded
to include industrial users.45
Using this structure, estimated revenue would be
$127.3 million in fiscal 2008 increasing to $130.0
million in fiscal year 2011. This is based on a tax-
able amount of 978.8 billion gallons in fiscal 2008
and 1 trillion gallons in 2011 of residential, com-
mercial, industrial and irrigation usages.52
Assuming exemption for industrial uses (as
under the previous sales tax exemption), revenue
would decrease by 44 percent to $70.7 million in
fiscal 2008 and $72.5 million in fiscal 2011. Tax-
able gallons for this estimate are 543.8 million
Water Funding Mechanisms in Other States (continued)
Minnesota
Minnesota taxes commercial and industrial water sales at a rate of 7 percent. The state exempts housing
authorities, non profits, governmental entities and ice manufacturers. Water permit holders pay a $140
minimum water use fee and a per million gallon fee based on the amount of water appropriated (or used).
Maximum allowable fees range from $750 for an agricultural irrigation permit to $250,000 for cities with
populations of more 100,000.50
Oregon
Oregon charges a fee for water right transfers, permit amendments and exchanges. Water rights users
are assessed a minimum fee of $200 or $400 depending on the intended use. The state also charges a
fee based on the flow of water measured in cubic feet per second. These fees range from $80 to $200 per
cubic feet per second, depending on use.51
Tennessee
The state assesses a 7 percent sales tax on residential and commercial water utility accounts and a 1 per-
cent rate on water sold to manufacturers.
Liquid Assets: The State of Texas’Water Resources Texas Comptroller of Public Accounts66
State Water Plan: Issues and Funding
fee would apply to 7,090 municipal, industrial,
irrigation, and mining water rights holders with
an estimated 32.9 million acre-feet of authorized
water. Water rights for hydroelectric, recreation,
storage and environmental needs would be
exempt. Average annual costs to water rights
holders would increase approximately $10,906
for municipal permit holders and $44,421 for
industrial permit holders. Costs to irrigation and
mining permit holders would be significantly
less, at $1,148 and $1,413 respectively.57
Increas-
ing revenue from this fee would depend upon
increased permitting or raising the fee amount.
Supporters say that this proposal could be used
to supplant some general revenue for debt service
payments. Although some of the costs to munici-
pal and industrial holders would be passed to resi-
dential users, it would not be overly burdensome.
This option generates the least amount of rev-
enue and it may not provide enough money to
cover the needs that have been identified.
Water Connection Fee Proposal
A water connection, or “tap fee,” would place
a monthly charge on each water connection in
the state. Applying a $1 monthly fee on residen-
tial, commercial, irrigation and industrial users
would generate an estimated $94.6 million in
fiscal 2008, and increase to $97.3 million in fiscal
2011. This estimate is based on 7.9 million con-
nections in fiscal 2008 and 8.1 million in fiscal
2011.58
Residential connections could account
for 93.5 percent of the total revenue.
This option would generate slightly more rev-
enue than what is required for annual 2008-
09 debt service payments. The residential bill
charge is slightly less than the sales tax and is a
small portion of the water/sewage bill, meaning
that it would not be a burdensome levy.
Critics argue that this fee is not tied to water
usage, includes no conservation component
and is regressive. Residential customers would
be the primary contributor of the fee since they
make up over 90 percent of water connections in
Texas, even though they account for only about
48 percent of water usage.
passed on to the consumer, this plan would allow
for more accurate pricing of water resources,
improving efficiency in the market for this scarce
resource. Construction of water infrastructure
will pose a significant cost. From the standpoint
of economic efficiency it would be most appropri-
ate if those costs were accounted for in the goods
that require expanded water supplies.
On the other hand, critics point out that with
industrial exemption, the fee would raise insuf-
ficient funds, while industrial users would bear a
heavy burden without an exemption. Although
designed as a conservation measure, increased
usage costs residential customers very little.
Business interests suggest that it would be unfair
for low-use residential customers to avoid pay-
ing any fee while industrial users account for
the largest share. There is the possibility that
industrial users would pass on additional costs
to the consumer, potentially reducing demand
for some products.
Water Rights Fee Proposal
Surface water in Texas is owned by the state of
Texas and requires a permit for use. The Texas
Commission for Environmental Quality (TCEQ)
administers water rights based on the principle
of “prior appropriation,” which, in effect, means
“first come, first served.” A water rights holder
could be anyone from an individual landowner
to a manufacturing firm, to a municipal water
utility that provides water service to thousands
of households.55
Currently, TCEQ collects an annual fee from
water rights holders based on acre-feet of water
rights held. In the case of municipal, industrial,
agricultural or mining users, the fee is 22 cents
per acre-foot up to 20,000 acre-feet, and 8 cents
per acre-foot above 20,000 acre-feet. However,
many of these entities are exempt under statute
if they are paying the Water Quality Fee. As a
result, revenues for this fee are low ($416,483 in
fiscal 2006).56
The intent of the fee is to defray
TCEQ’s costs associated with the water rights
permitting program.
Assessing a fee of $1.50 per acre-foot of autho-
rized water on water rights holders would gener-
ate an estimated $49.3 million annually. The
Texas Comptroller of Public Accounts Liquid Assets: The State of Texas’Water Resources 67
State Water Plan: Issues and Funding
increased significantly in the past few years,
providing the possibility of steady revenue
growth. Bottled water consumption is typically
discretionary, as consumers could purchase
other tax-exempt products or drink tap water. In
rural areas where tap water is not available, tax
exemptions could be structured to avoid taxa-
tion of drinking water.
Critics say this fee would not be related to water
usage, and bottled water suppliers and consum-
ers likely would object to being singled out. This
tax would include no conservation component
and would likely be regressive.
Exhibit 42 shows the potential results of the
funding mechanisms listed above. Fiscal impact
numbers for the proposed funding mechanisms
were generated by TWDB with help from TCEQ
and the Comptroller’s office.
Sales Tax on Bottled Water Proposal
Removal of the state sales tax exemption for
bottled water is estimated to generate $78 mil-
lion of state sales tax revenue in fiscal 2008 to
$101.8 million in fiscal 2011. This estimate is
based on Texas bottled water sales of $1.2 billion
and $1.6 billion, respectively. The 6.25 percent
sales tax would apply to bottled water sold at
retail (including gallons or larger), carbonated
or seltzer water and cooler water delivered to
homes and offices. Local sales and use taxes also
would apply. Water delivered by tanker truck
to residential wells or cisterns and water sold at
community dispensers would be exempt from
the sales tax.59
As proposed, the bottled water fee would not
generate enough revenue supplant all general
revenue for debt service payments. Propo-
nents argue, however, that bottled water sales
Exhibit 42
Proposed Funding Mechanisms
Proposed Revenue Sources Fiscal 2008 Fiscal 2011
State Sales Tax $243,270,000 $266,579,375
State Sales Tax, industrial exemption $220,112,500 $242,837,500
Water Conservation and Development Fee $127,250,019 $130,001,766
Water Conservation and Development , industrial exemption $70,695,486 $72,479,123
Water Rights Fee $49,339,946 $49,339,946
Water Connection Fee $94,573,104 $97,280,928
Sales Tax on Bottled Water $78,000,000 $101,750,000
Source: Texas Water Development Board. and Texas Comptroller of Public Accounts
Liquid Assets: The State of Texas’Water Resources Texas Comptroller of Public Accounts68
State Water Plan: Issues and Funding
17
	 Texas Water Development Board, Water for Texas
2007 (Austin, Texas, January 2007), Volume I, pp.
23-24, http://www.twdb.state.tx.us/publications/
reports/State_Water_Plan/2007/2007StateWaterPlan/
vol%201_FINAL%20113006.pdf. (Last visited January
6, 2009.)
18
	 Texas Water Development Board, Water for Texas
2007, Volume I, pp. 24-25.
19
	 Texas Water Development Board, Water for Texas
2007, (Austin, Texas, January 2007), Volume I, pp.
8-10, http://www.twdb.state.tx.us/publications/
reports/State_Water_Plan/2007/2007StateWaterPlan/
vol%201_FINAL%20113006.pdf. (Last visited January
6, 2009.)
20
	 E-mail communication from Piper Montemayor, Debt
and Portfolio manager, Texas Water Development
Board, November 19, 2008.
21
	 Unpublished FY 2008 annual report from Piper
Montemayor, Debt and Portfolio manager, Texas
Water Development Board to Robert C. Kline,
executive director, Texas Bond Review Board,
September 18, 2008.
22
	 E-mail communication from Stuart Norvell, manager,
Water Planning Research and Analysis, Texas Water
Development Board, September 22, 2008; and data
provided by Texas Water Development Board, “Non-
Self Supporting General Obligation Water Bonds as
of June 2008,” (Excel file); and Texas H.B. 1, p. VI-60,
80th Leg., Reg. Sess. (2007).
23
	 Texas Legislative Budget Board, Fiscal Size-Up: 2008-
09 Biennium (Austin, Texas, March 2008), p. 368,
http://www.lbb.state.tx.us/Fiscal_Size-up/Fiscal%20
Size-up%202008-09.pdf. (Last visited January 6,
2009.)
24
	 Texas Water Development Board, “State
Participation,” pp. 1-4, http://www.twdb.state.
tx.us/assistance/financial/fin_infrastructure/
StateParticipation.asp. (Last visited January 6,
2009.); and Texas Water Development Board, “Water
Infrastructure Fund Loan Program,” pp. 1-2, http://
www.twdb.state.tx.us/assistance/financial/fin_
infrastructure/WIF.asp. (Last visited January 6, 2009.)
25
	 Texas Legislative Budget Board, Fiscal Size-Up: 2008-
09 Biennium (Austin, Texas, March 2008), p. 370,
http://www.lbb.state.tx.us/Fiscal_Size-up/Fiscal%20
Size-up%202008-09.pdf. (Last visited January 6,
2009.)
26
	 E-mail communication from Piper Montemayor, Debt
and Portfolio manager, Texas Water Development
Board, October 9, 2008; and data provided by Texas
Water Development Board, “Project Financial
Assistance Programs.”
27
	 Texas Legislative Budget Board, Fiscal Size-Up: 2008-
09 Biennium (Austin, Texas, March 2008), p. 370;
and Texas Water Development Board, Economically
Distressed Areas Program: Counties with EDAP
Projects in Progress or Completed: 24 (Austin, Texas,
August 31, 2008), p. 3, http://www.twdb.state.tx.us/
Endnotes
1
	 Texas Water Development Board, Water for Texas
2007 (Austin, Texas, January 2007), Volume I, p. 13.
http://www.twdb.state.tx.us/publications/reports/
State_Water_Plan/2007/2007StateWaterPlan/
vol%201_FINAL%20113006.pdf. (Last visited January
5, 2009.)
2
	 Rudolf Bush, “Judge Blocks Dallas Plans for Fastrill
Reservoir in East Texas,” Dallas Morning News (July
1, 2008), http://www.dallasnews.com/sharedcontent/
dws/news/localnews/stories/070208dnmetreservoir.3f
c13e6.html. (Last visited January 6, 2009.)
3
	 Texas Water Development Board, Water for Texas
2007, Volume I, pp. 11-16. (Last visited January 5,
2009.)
4
	 Texas House of Representatives, House Research
Organization, Major Issues of the 80th Legislature,
Regular Session (Austin, Texas, July 17, 2007), p. 57,
http://www.hro.house.state.tx.us/focus/major80.pdf.
(Last visited January 6, 2009.)
5
	 Greg Bowen, “Water Issues Volatile,” The Victoria
Advocate (January 17, 2005).
6
	 Texas Water Development Board, Water for Texas
2007, Volume I, pp. 16-17.
7
	 Houston & Texas Central Railroad Company v. W. A.
East, 98 Tex. 146, 81 S.W. 279, 1904 Tex. LEXIS 228
(1908).
8
	 Texas House of Representatives, House Research
Organization, “Groundwater Management Issues
in Texas,” by Tedd Holladay (Austin, Texas, June 6,
2006), pp. 2-3, http://www.hro.house.state.tx.us/focus/
groundwater79-14.pdf (Last visited on January 26, 2009.)
9
	 Tex. Water Code §36.0015 (Vernon 1997 & Supp.
2001).
10
	 Texas Water Development Board, “GCD Facts,” p. 1,
http://www.twdb.state.tx.us/gwrd/gcd/facts.htm. (Last
visited January 26, 2009.)
11
	 Texas Water Development Board, Water for Texas
2007, Volume I, pp. 17-19.
12
	 Texas House of Representatives, House Research
Organization, Major Issues of the 80th Legislature,
Regular Session (Austin, Texas, July 17, 2007), p. 58,
http://www.hro.house.state.tx.us/focus/major80.pdf.
(Last visited January 6, 2009.)
13
	 Texas Commission on Environmental Quality,
“Revised Environmental Flows Timeline-SB3/HB3
Revised Schedule,” http://www.tceq.state.tx.us/
permitting/water_supply/water_rights/eflows/group.
html. (Last visited January 6, 2009.)
14
	 Texas Office of the Governor, “Gov. Perry Names Two
to Environmental Flows Advisory Group,” p. 1, http://
governor.state.tx.us/news/appointment/2701. (Last
visited January 6, 2009.)
15
	 Texas Water Development Board, Water for Texas
2007, Volume I, pp. 19-21.
16
	 Texas House of Representatives, House Research
Organization, Major Issues of the 80th Legislature,
Regular Session, p. 57.
Texas Comptroller of Public Accounts Liquid Assets: The State of Texas’Water Resources 69
State Water Plan: Issues and Funding
publications/reports/Colonias/status.pdf. (Last visited
January 6, 2009.)
28
	 Texas H.B. 1, p. VI-60, 80th Leg., Reg. Sess. (2007).
29
	 Texas Water Development Board, “Water
Infrastructure Fund Loan Program,” pp. 1-2.
30
	 Texas Water Development Fund, “Agricultural Water
Conservation Loan Program,” p. 1, http://www.twdb.
state.tx.us/assistance/financial/fin_infrastructure/
awcfund.asp. (Last visited January 6, 2009.)
31
	 E-mail communication from Piper Montemayor, Debt
and Portfolio manager, Texas Water Development
Board, October 9, 2008; and data provided by Texas
Water Development Board, “Project Financial
Assistance Programs.”
32
	 E-mail communication from Piper Montemayor, Debt
and Portfolio manager, Texas Water Development
Board, October 9, 2008; and data provided by Texas
Water Development Board, “Project Financial
Assistance Programs.”
33
	 E-mail communication from Piper Montemayor, Debt
and Portfolio Manager, Texas Water Development
Board, October 9, 2008; and data provided by Texas
Water Development Board, “Project Financial
Assistance Programs.”
34
	 Texas Water Development Fund, “Rural Water
Assistance Fund (RWAF) Program,” pp. 1-2,
http://www.twdb.state.tx.us/assistance/financial/
fin_infrastructure/RWAF.asp. (Last visited January 7,
2009.)
35
	 E-mail communication from Piper Montemayor, Debt
and Portfolio Manager, Texas Water Development
Board, October 9, 2008; and data provided by Texas
Water Development Board, “Project Financial
Assistance Programs.”
36
	 Texas Legislative Budget Board, Fiscal Size-Up: 2008-
09 Biennium, p. 368.
37
	 E-mail communication from Piper Montemayor, Debt
and Portfolio Manager, Texas Water Development
Board, October 9, 2008; and data provided by Texas
Water Development Board, “Project Financial
Assistance Programs.”
38
	 E-mail communication from Piper Montemayor, Debt
and Portfolio Manager, Texas Water Development
Board, October 9, 2008; and data provided by Texas
Water Development Board, “Project Financial
Assistance Programs.”
39
	 U.S. Environmental Protection Agency, “Clean Water
SRF Federal Capitalization Grants, by Federal Fiscal
Year of Award, by State,” p. 2, http://www.epa.gov/
owm/cwfinance/cwsrf/cwnims/pdf/capfedst.pdf.
(Last visited January 7, 2009.); and data provided
by Texas Water Development Board, “Texas Water
Development Board Program Summary as of August
31, 2008.” (Excel file.)
40
	 Texas Water Development Board, “Drinking Water
State Revolving Fund (DWSRF) Loan Program,”
p. 2, http://www.twdb.state.tx.us/assistance/financial/
fin_infrastructure/dwsrf.asp. (Last visited January 7,
2009.)
41
	 U.S. Environmental Protection Agency, “DWSRF
Annual Allotments by Fiscal Year,” http://www.epa.
gov/safewater/dwsrf/allotments/funding_dwsrf_
allotments.html. (Last visited January 7, 2009.) ; and
e-mail communication from Piper Montemayor,
October 23, 2008; and information provided by Texas
Water Development Board, “10.14.08 LBB chart for
Water Primer,” (Excel file) with Texas Comptroller’s
Office calculations.
42
	 E-mail communication from Stuart Norvell,
manager, Water Planning Research and Analysis,
Texas Water Development Board, October 8, 2008;
and Texas Water Development Board, “Table 1:
Potential Revenues Generated from a Sales Tax on
Retail Water Service Provided by Community Public
Water Suppliers in Texas ($ millions)” and “Table 2:
Potential Revenues Generated from a Sales Tax on
Retail Sewer Service Provided by Community Public
Water Suppliers in Texas ($ millions)” with Texas
Comptroller’s Office calculations.
43
	 Texas Water Development Board, Water for Texas
2007, Volume II, p. 128 with Texas Comptroller’s
Office calculations.
44
	 E-mail communication from Stuart Norvell,
manager, Water Planning Research and Analysis,
Texas Water Development Board, September 22,
2008; and Texas Water Development Board, Potential
Revenue Sources for Funding Texas Water Programs
(Austin, Texas, May 11, 2008), pp. 3-7; and “Table 1:
Potential Revenues Generated from a Sales Tax on
Retail Water Service Provided by Community Public
Water Suppliers in Texas ($ millions)” and “Table 2:
Potential Revenues Generated from a Sales Tax on
Retail Sewer Service Provided by Community Public
Water Suppliers in Texas ($ millions)” with Texas
Comptroller’s Office calculations.
45
	 Texas S.B. 3, 79th Leg., Reg. Sess. (2005).
46
	 Texas Water Development Board, Potential Revenue
Sources for Funding Texas Water Programs, pp. 14-19,
with Texas Comptroller’s Office calculations.
47
	 University of Arkansas, Division of Agriculture,
Public Policy Center, Partners in Protecting Arkansas’
Waterbodies (Little Rock, Arkansas, 2008), http://
www.uaex.edu/Other_Areas/publications/PDF/
FSPPC103.pdf. (Last visited January 7, 2009.)
48
	 Kansas Legislative Research Department, Agriculture
and Natural Resources: B-3 State Water Plan Fund,
Kansas Water Authority, and State Water Plan
(Topeka, Kansas, 2008), pp. 1-2, http://skyways.
lib.ks.us/ksleg/KLRD/Publications/2008Briefs/B-
3StateWaterPlanFund.pdf. (Last visited January 7,
2009.)
49
	 Michigan Department of Environmental Quality,
“Fee Schedule Community Water Systems,” and
“Questions and Answers to Explain Michigan
Public Water Supply Annual Fees,” http://www.
michigan.gov/documents/deq/deq-wd-water-fos-tsu-
CWSAnnualFee_247740_7.pdf. (Last visited January
7, 2009.)
Liquid Assets: The State of Texas’Water Resources Texas Comptroller of Public Accounts70
State Water Plan: Issues and Funding
50
	 Minnesota Department of Natural Resources, “Water
Use Fee Rates,” http://www.dnr.state.mn.us/waters/
watermgmt_section/appropriations/feerates.html.
(Last visited January 7, 2009.)
51
	 State of Oregon, Water Resources Department, “Fee
Schedule as of July 1, 2007,” pp. 4-5, http://www1.wrd.
state.or.us/pdfs/fees2007.pdf. (Last visited October 20,
2008.)
52
	 E-mail communication from Stuart Norvell, manager,
Water Planning Research and Analysis, Texas
Water Development Board, October 8, 2008; and
data provided by Texas Water Development Board,
“Table 5: Potential Revenues Generated from a Water
Conservation and Development Fee as Proposed
Under Senate Bill 3 of the 79th Texas Legislature
($millions).”
53
	 E-mail communication from Stuart Norvell, manager,
Water Planning Research and Analysis, Texas Water
Development Board, September 22, 2008; and Texas
Water Development Board, Potential Revenue Sources
for Funding Texas Water Programs, pp. 8-9, with Texas
Comptroller’s Office calculations.
54
	 Texas Water Development Board, Potential Revenue
Sources for Funding Texas Water Programs, pp. 8-9.
55
	 Texas Commission on Environmental Quality,
“Water Rights: Am I Regulated?” , http://www.tceq.
state.tx.us/permitting/water_supply/water_rights/
wr_amiregulated.html. (Last visited January 7, 2009.)
56
	 Texas Legislative Budget Board, Agency Fee Survey
2006 (Austin, Texas, 2008), p. 408, http://www.
lbb.state.tx.us/Other_Pubs?Agency_Fee%20
Survey_2006_0107.pdf. (Last visited January 7, 2009.)
57
	 Texas Water Development Board, Potential Revenue
Sources for Funding Texas Water Programs, p. 10.
58
	 Texas Water Development Board, Potential Revenue
Sources for Funding Texas Water Programs, p. 11.
59
	 Texas Water Development Board, Potential Revenue
Sources for Funding Texas Water Programs, p. 12.
Texas Comptroller of Public Accounts Liquid Assets: The State of Texas’Water Resources 71
Conclusion
•	 adequacy — the financing mechanism should
be sufficient to cover identified costs without
excessively burdening those who pay the fees.
•	 equity — the financial burden of water proj-
ects should be spread among all water user
groups in proportion to their demand for
water. It should not favor certain user groups
or projects.
•	 specificity — funds raised for water develop-
ment projects should not be diverted for other
budgetary obligations.
•	 affordability — the plan should be sensitive to
water users’ ability to pay, since a certain level
of water consumption is nondiscretionary and
essential for every Texan’s health. No plan
Given Texas’ growing population, the develop-
ment and protection of our water resources is
one of the most pressing long-term issues fac-
ing lawmakers. Ensuring clean and dependable
water supplies will be essential to protect the
health of Texas citizens and the strength of the
state’s economy.
With the 1997 initiation of the regional water
planning process, Texas took an important step
toward coordinating the water needs of com-
munities across the state. This role will continue
and may become more prominent as policymak-
ers consider dedicated funding for community
water projects.
In evaluating proposals for water project fund-
ing, policymakers should seek the appropriate
balance among these criteria:
Conclusion
Lady Bird Lake in Austin, Texas
Liquid Assets: The State of Texas’Water Resources Texas Comptroller of Public Accounts72
Conclusion
should unduly burden individuals who might
have difficulty paying for it.
•	 simplicity — the plan should be easy to ad-
minister, understand and follow.
•	 conservation — the financing system should
be consistent with the goal of water conserva-
tion and discourage inefficient usage.
If Texas state government continues moving
toward greater involvement in financing water
projects, a dedicated funding source for water
projects may prove useful. However, with this
more active state role in regional water planning,
policymakers will increasingly look to ensure
that the water planning process effectively serves
the interests of all Texas citizens.
To do so, two key issues should be explored
further.
Conservation
Conservation is often cited as the first goal of
any water development plan, since it is the most
cost-effective and sustainable water manage-
ment strategy. One concern is the varying levels
of conservation effort made by municipalities
across the state. Several cities have already made
extensive and successful efforts to reduce their
water use, while others plan to rely on increased
conservation measures to meet growing demand
in the future.
Accountability
Another concern identified by the review team
was the manner in which different regional wa-
ter planning groups are required to report their
water needs. The “bottom-up” approach current-
ly employed in Texas allows communities and
regions to develop their own estimates for future
water needs and project recommendations.
While this system has many benefits, including
the ability for local stakeholders to determine
the direction of water policy decisions that will
affect their communities, it may encourage re-
gions to include marginal projects in their plans.
Many water development projects are extremely
expensive, and some projects such as reservoirs
can have substantial environmental and social
consequences. Policymakers may want to con-
sider strengthening oversight and accountability
measures to ensure that they fund only those
projects that are truly necessary.
Regional water planning will play an important
role in the future of the Lone Star State. Start-
ing with the passage of SB 1 in 1997, policy-
makers in Texas have shown a willingness to
confront this challenging issue head-on. Since
the passage of SB 1, Texas has taken many steps
to ensure that citizens, businesses and agri-
cultural producers have enough water to serve
their needs, while safeguarding environmental
needs of our rivers, bays and estuaries. The
coming years will require continued attention
to this issue, to ensure that all Texans have ac-
cess to the water they need to thrive.
Texas Comptroller of Public Accounts Liquid Assets: The State of Texas’Water Resources 73
Acknowledgements
Acknowledgements
Darrel Andrews, Tarrant Regional Water District
Carl Anderson, Texas A&M University
Carolyn L. Brittin, Texas Water Development Board
Eddie Brown, City of Sweetwater, TX
Patrick Brzozowski, Lavaca-Navidad River Authority (Region P)
John Burke, Lower Colorado Regional Water Planning Group
Donovan Burton, San Antonio Water System
Trey Buzbee, Region G Water Planning Group
Curtis Campbell, Region B Water Planning Group
Teddy Carter, Texas Senate Natural Resources Committee
Alan Cockrell, Schertz-Seguin Local Government Corporation
Jaime Estrada, Brownsville Public Utility Board
Genoveva Gomez, Brownsville Public Utility Board
Robert Gulley, Edwards Aquifer Restoration Implementation Plan
Charlie Hastings, City of Kerrville, TX
Stan Hayes, Hayes Engineering
Celena Hemmeter, City of Eden, TX
Myron Hess, National Wildlife Federation
Kelley Holcomb, East Texas Water Region
Bill Hutchison, El Paso Water Utilitiy
Rick Illgner, Edwards Aquifer Authority
Glenn Jarvis, Rio Grande Water Planning Group
Mary E. Kelly, Environmental Defense
Ken Kramer, Lone Star Chapter of the Sierra Club
Johnathan Letz, Region J Water Planning Group
Con Mims, South Central Texas Regional Water Planning Group
Piper Montemayor, Texas Water Development Board
Bill Mullican, Texas Water Development Board
Bill Norris, NRS Consulting Engineers
Stuart D. Norvell, Texas Water Development Board
James M. Parks, Region C Water Planning Group
Kenneth Reneau, Angelina & Neches River Authority
Mike Rickman, North Texas Municipal Water District
Joe Rippole, San Antonio Water System
Walt Sears, Region D Water Planning Group
Aubrey Spear, Lubbock Water Utilities
Charlie Stringer, Dallas Water Utilities
Michael Thane, City of Round Rock
Jim Thompson, Region D Water Planning Group
Jeff Walker, Texas Water Development Board
J. Kevin Ward, Texas Water Development Board
Jake White, NRS Consulting Engineers
C.E. Williams, Panhandle Water Planning Group
96-1360-LiquidAssets

96-1360-LiquidAssets

  • 1.
    February 4, 2009 Ladiesand Gentlemen: As Texas’ chief fiscal officer, I am committed to creating an environment that encourages the Texas economy to grow and thrive. One of my responsibilities is to analyze factors affecting the state’s economy. Access to reliable sources of abundant clean water plays a key role in determining the future success of Texas’ economy and the health of our citizens. Our office presents the Liquid Assets: The State of Texas’ Water Resources, which discusses the current and future water resources in Texas, the practical and policy barriers faced by local and state water planners and the possible funding mechanisms that could be tapped to develop our water resources. The report also provides information on the current status of water management strategies in the 16 water planning regions in the state. State and regional decision makers will be able to use this report as a tool to drive sound and prudent water policy in the state. This report evaluates the progress Texas is making in securing water resources for the future. Texas’ water resources are diverse and ever changing, since they are based upon climatic and demographic fluctuations. Drought is an ever-present concern in many parts of the state, leading to pressure on our water infrastructure. Texas’ population is growing at nearly twice the national rate and it is estimated that by 2060 there will be more than 46 million people living in Texas, and the state will need ample water supplies to serve them. According to the Texas Water Development Board demand for water will increase 27 percent by 2060 and if demand is not met it could cost businesses and workers in the state approximately $9.1 billion per year by 2010 and $98.4 billion per year by 2060. Our economy always has and always will rely on clean and abundant water supplies. In addition, state and local leaders must recognize that how they define ownership of groundwater could have enormous economic consequences for property owners statewide. Important financial decisions have been based on the belief by landowners that the water under their land is in fact their “property.” A change in this system could have very significant and adverse financial consequences for individuals as well as for the economic vitality of the state. Liquid Assets: The State of Texas’ Water Resources will help all Texas citizens understand the importance of reliable water resources and what is being done now and in the future to ensure those resources. Our office stands ready to assist communities, businesses and lawmakers in their efforts to ensure our state has the necessary water resources to continue our way of life. Together we can guarantee that Texas’ water resources remain plentiful for future generations. Sincerely, Susan Combs
  • 3.
    Texas Comptroller ofPublic Accounts Liquid Assets: The State of Texas’Water Resources i Table of Contents Table of Contents Introduction . . . . . . . . . . . . . . . . . . . . . . . . . . . . . . . . . . . . . . . . . . . . . . . . . . . . . . . . . . . . . . . . 1 Water Supply and Demand in Texas . . . . . . . . . . . . . . . . . . . . . . . . . . . . . . . . . . . . . . . . . . . . . . . . . . . . . . . . . . . . . . 3 Demographics and Future Water Needs . . . . . . . . . . . . . . . . . . . . . . . . . . . . . . . . . . . . . . . . . . . . . . . . . . . . . . . . . . 5 The Economic Consequences of Drought . . . . . . . . . . . . . . . . . . . . . . . . . . . . . . . . . . . . . . . . . . . . . . . . . . . . . . . . . 8 Regional Water Planning Process . . . . . . . . . . . . . . . . . . . . . . . . . . . . . . . . . . . . . . . . . . . . . . . . . . . . . . . . . . . . . . . . 9 Conclusion . . . . . . . . . . . . . . . . . . . . . . . . . . . . . . . . . . . . . . . . . . . . . . . . . . . . . . . . . . . . . . . . . . . . . . . . . . . . . . . . . . 10 Regional Water Planning . . . . . . . . . . . . . . . . . . . . . . . . . . . . . . . . . . . . . . . . . . . . . . . . . . . . 15 Water Management Strategies . . . . . . . . . . . . . . . . . . . . . . . . . . . . . . . . . . . . . . . . . . . . . . . . . . . . . . . . . . . . . . . . . . 16 Conjunctive Use . . . . . . . . . . . . . . . . . . . . . . . . . . . . . . . . . . . . . . . . . . . . . . . . . . . . . . . . . . . . . . . . . . . . . . . . . . 16 Conservation . . . . . . . . . . . . . . . . . . . . . . . . . . . . . . . . . . . . . . . . . . . . . . . . . . . . . . . . . . . . . . . . . . . . . . . . . . . . 16 Desalination . . . . . . . . . . . . . . . . . . . . . . . . . . . . . . . . . . . . . . . . . . . . . . . . . . . . . . . . . . . . . . . . . . . . . . . . . . . . . 17 Groundwater . . . . . . . . . . . . . . . . . . . . . . . . . . . . . . . . . . . . . . . . . . . . . . . . . . . . . . . . . . . . . . . . . . . . . . . . . . . . 17 Surface Water . . . . . . . . . . . . . . . . . . . . . . . . . . . . . . . . . . . . . . . . . . . . . . . . . . . . . . . . . . . . . . . . . . . . . . . . . . . . 18 Water Reuse . . . . . . . . . . . . . . . . . . . . . . . . . . . . . . . . . . . . . . . . . . . . . . . . . . . . . . . . . . . . . . . . . . . . . . . . . . . . . 18 Regional Water Plans . . . . . . . . . . . . . . . . . . . . . . . . . . . . . . . . . . . . . . . . . . . . . . . . . . . . . . . . . . . . . . . . . . . . . . . . . 18 Panhandle Region (A) . . . . . . . . . . . . . . . . . . . . . . . . . . . . . . . . . . . . . . . . . . . . . . . . . . . . . . . . . . . . . . . . . . . . . 18 Region B . . . . . . . . . . . . . . . . . . . . . . . . . . . . . . . . . . . . . . . . . . . . . . . . . . . . . . . . . . . . . . . . . . . . . . . . . . . . . . . . . 20 Region C . . . . . . . . . . . . . . . . . . . . . . . . . . . . . . . . . . . . . . . . . . . . . . . . . . . . . . . . . . . . . . . . . . . . . . . . . . . . . . . . 21 North East Texas Region (D) . . . . . . . . . . . . . . . . . . . . . . . . . . . . . . . . . . . . . . . . . . . . . . . . . . . . . . . . . . . . . . . 25 Far West Texas Region (E) . . . . . . . . . . . . . . . . . . . . . . . . . . . . . . . . . . . . . . . . . . . . . . . . . . . . . . . . . . . . . . . . . 26 Region F . . . . . . . . . . . . . . . . . . . . . . . . . . . . . . . . . . . . . . . . . . . . . . . . . . . . . . . . . . . . . . . . . . . . . . . . . . . . . . . . . 28 Brazos Region (G) . . . . . . . . . . . . . . . . . . . . . . . . . . . . . . . . . . . . . . . . . . . . . . . . . . . . . . . . . . . . . . . . . . . . . . . . 30 Region H . . . . . . . . . . . . . . . . . . . . . . . . . . . . . . . . . . . . . . . . . . . . . . . . . . . . . . . . . . . . . . . . . . . . . . . . . . . . . . . . 33 East Texas Region (I) . . . . . . . . . . . . . . . . . . . . . . . . . . . . . . . . . . . . . . . . . . . . . . . . . . . . . . . . . . . . . . . . . . . . . . 35 Plateau Region (J) . . . . . . . . . . . . . . . . . . . . . . . . . . . . . . . . . . . . . . . . . . . . . . . . . . . . . . . . . . . . . . . . . . . . . . . . . 37 Lower Colorado Region (K) . . . . . . . . . . . . . . . . . . . . . . . . . . . . . . . . . . . . . . . . . . . . . . . . . . . . . . . . . . . . . . . 38 South Central Texas Region (L) . . . . . . . . . . . . . . . . . . . . . . . . . . . . . . . . . . . . . . . . . . . . . . . . . . . . . . . . . . . . . 41 Rio Grande Region (M) . . . . . . . . . . . . . . . . . . . . . . . . . . . . . . . . . . . . . . . . . . . . . . . . . . . . . . . . . . . . . . . . . . . 43 Coastal Bend Region (N) . . . . . . . . . . . . . . . . . . . . . . . . . . . . . . . . . . . . . . . . . . . . . . . . . . . . . . . . . . . . . . . . . . 45 Llano Estacado Region (O) . . . . . . . . . . . . . . . . . . . . . . . . . . . . . . . . . . . . . . . . . . . . . . . . . . . . . . . . . . . . . . . . . 47 Lavaca Region (P) . . . . . . . . . . . . . . . . . . . . . . . . . . . . . . . . . . . . . . . . . . . . . . . . . . . . . . . . . . . . . . . . . . . . . . . . . 48 State Water Plan: Issues and Funding . . . . . . . . . . . . . . . . . . . . . . . . . . . . . . . . . . . . . . . . 55 Reservoir Site Designation and Acquisition . . . . . . . . . . . . . . . . . . . . . . . . . . . . . . . . . . . . . . . . . . . . . . . . . . 55 Interbasin Transfers of Surface Water . . . . . . . . . . . . . . . . . . . . . . . . . . . . . . . . . . . . . . . . . . . . . . . . . . . . . . . 56 Groundwater Regulation in Texas . . . . . . . . . . . . . . . . . . . . . . . . . . . . . . . . . . . . . . . . . . . . . . . . . . . . . . . . . . . 56 Environmental Water Needs . . . . . . . . . . . . . . . . . . . . . . . . . . . . . . . . . . . . . . . . . . . . . . . . . . . . . . . . . . . . . . . 57 Water Conservation . . . . . . . . . . . . . . . . . . . . . . . . . . . . . . . . . . . . . . . . . . . . . . . . . . . . . . . . . . . . . . . . . . . . . . . 58 Expedited Amendment Process . . . . . . . . . . . . . . . . . . . . . . . . . . . . . . . . . . . . . . . . . . . . . . . . . . . . . . . . . . . . . 58 Indirect Reuse . . . . . . . . . . . . . . . . . . . . . . . . . . . . . . . . . . . . . . . . . . . . . . . . . . . . . . . . . . . . . . . . . . . . . . . . . . . 58
  • 4.
    Liquid Assets: TheState of Texas’Water Resources Texas Comptroller of Public Accountsii Table of Contents Financing Water Management Strategies . . . . . . . . . . . . . . . . . . . . . . . . . . . . . . . . . . . . . . . . . . . . . . . . . . . . . . . . 59 Current Water Project Financing . . . . . . . . . . . . . . . . . . . . . . . . . . . . . . . . . . . . . . . . . . . . . . . . . . . . . . . . . . . 59 Non-Self-Supporting GO Bond Programs . . . . . . . . . . . . . . . . . . . . . . . . . . . . . . . . . . . . . . . . . . . . . . . . . . . . 60 Self -Supporting Bond Programs . . . . . . . . . . . . . . . . . . . . . . . . . . . . . . . . . . . . . . . . . . . . . . . . . . . . . . . . . . . 61 Federal Financial Assistance . . . . . . . . . . . . . . . . . . . . . . . . . . . . . . . . . . . . . . . . . . . . . . . . . . . . . . . . . . . . . . . 61 Proposed Revenue Sources . . . . . . . . . . . . . . . . . . . . . . . . . . . . . . . . . . . . . . . . . . . . . . . . . . . . . . . . . . . . . . . . . . . . . 62 State Sales Tax Proposal . . . . . . . . . . . . . . . . . . . . . . . . . . . . . . . . . . . . . . . . . . . . . . . . . . . . . . . . . . . . . . . . . . . 63 Water Conservation and Development Fee Proposal . . . . . . . . . . . . . . . . . . . . . . . . . . . . . . . . . . . . . . . . . . 65 Water Rights Fee Proposal . . . . . . . . . . . . . . . . . . . . . . . . . . . . . . . . . . . . . . . . . . . . . . . . . . . . . . . . . . . . . . . . . 66 Water Connection Fee Proposal . . . . . . . . . . . . . . . . . . . . . . . . . . . . . . . . . . . . . . . . . . . . . . . . . . . . . . . . . . . . 66 Sales Tax on Bottled Water Proposal . . . . . . . . . . . . . . . . . . . . . . . . . . . . . . . . . . . . . . . . . . . . . . . . . . . . . . . . 67 Conclusion . . . . . . . . . . . . . . . . . . . . . . . . . . . . . . . . . . . . . . . . . . . . . . . . . . . . . . . . . . . . . . . . . 71 Conservation . . . . . . . . . . . . . . . . . . . . . . . . . . . . . . . . . . . . . . . . . . . . . . . . . . . . . . . . . . . . . . . . . . . . . . . . . . . . . . . . 72 Accountability . . . . . . . . . . . . . . . . . . . . . . . . . . . . . . . . . . . . . . . . . . . . . . . . . . . . . . . . . . . . . . . . . . . . . . . . . . . . . . . 72 Acknowledgements . . . . . . . . . . . . . . . . . . . . . . . . . . . . . . . . . . . . . . . . . . . . . . . . . . . . . . . . . 73
  • 5.
    Texas Comptroller ofPublic Accounts Liquid Assets: The State of Texas’Water Resources 1 Introduction Each of the several one- or two-year droughts in Texas in the past decade has cost agricultural producers and businesses impacted by them between $1 billion and $4 billion annually. Water is not only essential to life, it is essential to our way of life. Moreover, it has no substitute. Without it, our bodies won’t function, food crops won’t grow, livestock and wildlife won’t thrive, electricity can’t be generated, and indus- tries and communities can’t grow. The lack of water is costly. Each of the several one- or two-year droughts in Texas in the past decade has cost agricultural producers and businesses impacted by them between $1 bil- lion and $4 billion annually.1 The infamous eight-year drought in the 1950s, the drought of record against which all droughts in Texas are measured, is estimated to have cost the Texas economy about $3.5 billion in 2008 dollars each year from 1950 to 1957.2 In 2002, an agency of the United Nations (U.N.) estimated that 5 billion people in the world would face severe water shortages by 2025 if demand continues at current rates. The result- ing effects of these shortages could be crop failure, increased likelihood of disease and, in the extreme, threatened stability of affected governments.3 While Texas may avoid some of the most severe consequences anticipated by the U.N., water shortages in Texas could still threaten the economy and public health of the Lone Star State. Historically, more people across the world have lived in rural areas than urban ones, and they depend on more diffuse sources of water. By 2020, however, urban dwellers worldwide will outnumber those living in rural areas.4 As Introduction Blanco River near Luckenbach, Texas.
  • 6.
    Liquid Assets: TheState of Texas’Water Resources Texas Comptroller of Public Accounts2 Introduction Total statewide demand for water in Texas is projected to grow 27 percent, from nearly 17 million acre-feet in 2000 to 21.6 million acre-feet in 2060. Without a significant, persistent climatologi- cal change that brings increased moisture, this growth is likely to mean that more people will live with less water. Ensuring reliable water sup- plies for the future, and balancing those supplies appropriately between rural and urban areas, and among agricultural, municipal, industrial and electricity-generating users is the challenge of our day. To meet that challenge, Texas legislators estab- lished a comprehensive water planning process in 1997 which assesses current and future needs in each of the state’s 16 Regional Water Planning Groups (RWPGs), identifies potential solutions people concentrate, so does their need for water, making it increasingly difficult for communities worldwide to provide sufficient amounts of water for their residents. Texans face the same challenges as the global community. The state’s population is expected to nearly double by 2060 and will also become more urban.5 Total statewide demand for water in Texas is projected to grow 27 percent, from nearly 17 million acre-feet in 2000 to 21.6 mil- lion acre-feet in 2060. From 2010 through 2060, water supplies from existing sources are expect- ed to decrease by 18 percent, from 17.9 million acre-feet to 14.6 million acre-feet.6 Exhibit 1 Major Texas Aquifers Sources: Texas Water Development Board. Legend Pecos Valley Seymour Gulf Coast Carrizo - Wilcox (outcrop) Carrizo - Wilcox (subcrop) Hueco - Mesilla Bolson Ogallala Edwards - Trinity Plateau (outcrop) Edwards - Trinity Plateau (subcrop) Edwards BFZ (outcrop) Edwards BFZ (subcrop) (subcrop) Trinity (outcrop) Trinity
  • 7.
    Texas Comptroller ofPublic Accounts Liquid Assets: The State of Texas’Water Resources 3 Introduction The Texas Water Development Board estimates that groundwater provides 59 percent of all available fresh water in the state, with surface water providing the nearly 40 percent, and the remaining 1 percent coming from both ground water and surface water reuse projects. and estimates their cost, culminating in a State Water Plan updated every five years.7 Liquid As- sets: The State of Texas’ Water Resources evalu- ates the progress that Texas has made toward developing sustainable water supplies since the issuance of the 2007 State Water Plan, with particular emphasis on identifying policy and funding barriers impeding that progress. Water Supply and Demand in Texas The Texas Water Development Board (TWDB), the state agency responsible for providing “lead- ership, planning, financial assistance, informa- tion, and education for the conservation and responsible development of water for Texas,” es- timates that groundwater provides 59 percent of all available fresh water in the state, with surface water providing the nearly 40 percent, and the remaining 1 percent coming from both ground water and surface water reuse projects. Unfortu- nately, both water sources are decreasing — the former due to pumping in excess of recharge, and the latter primarily because of sediment ac- cumulation in reservoirs.8 Exhibits 1 and 2 show the major aquifers and river basins in Texas. Exhibit 2 Major River Basins of Texas Source: Texas Water Development Board.
  • 8.
    Liquid Assets: TheState of Texas’Water Resources Texas Comptroller of Public Accounts4 Introduction Exhibit 3 Estimated Per Capita Water Use, 2000-2060 40 Largest Texas Cities Ranked by Gallons Used Per Day Per Person in 2060 City 2000 2020 (est.) 2040 (est.) 2060 (est.) Richardson 282 278 274 272 Dallas 262 262 257 256 Plano 256 253 250 249 Tyler 261 255 249 248 Midland 262 254 248 247 McKinney 220 244 242 242 Irving 220 223 218 217 Brownsville 229 221 217 216 College Station 225 217 213 212 Sugar Land 221 214 211 211 Fort Worth 215 207 203 202 Amarillo 256 201 201 201 Beaumont 216 209 203 201 Lubbock 181 202 196 195 Odessa 208 202 195 194 McAllen 205 197 193 192 Round Rock 201 194 191 191 Laredo 200 192 189 188 San Angelo 162 193 187 186 Waco 183 183 183 183 Carrollton 189 188 184 183 Denton 189 179 176 176 Arlington 165 179 175 174 El Paso 184 176 171 170 Lewisville 167 173 171 170 Austin 175 173 171 169 Wichita Falls 188 172 170 168 Killeen 132 179 174 167 Corpus Christi 179 171 166 165 Garland 159 160 156 155 Abilene 304 161 155 154 Mesquite 160 157 153 152 Houston 159 152 147 146 Harlingen 156 149 144 143 Grand Prairie 153 145 142 141 Bryan 147 140 135 134 San Antonio 147 139 135 134 Baytown 147 140 134 133 Longview 127 120 115 115 Pasadena 117 110 105 104 Average 195.2 189.1 185 183.9 Note: Water use projections from 2020 through 2060 rely on per capita use in 2000 as a baseline. According to TWDB, 2000 was a hot and dry year when much of the state was experiencing a drought. Consequently, year 2000 water use tended to be relatively high across the state. Source: Texas Water Development Board.
  • 9.
    Texas Comptroller ofPublic Accounts Liquid Assets: The State of Texas’Water Resources 5 Introduction The Texas population will more than double between 2000 and 2060, from 21 million to 46 million people. Based on current conditions, TWDB models suggest existing groundwater supplies provide 8.5 million acre-feet. As the state’s major aqui- fers are used increasingly for irrigation, mu- nicipal and industrial use, TWDB projects a 32 percent decline in supply from 8.5 to 5.8 million acre-feet by 2060.9 As of 2010, Texas is projected to have approxi- mately 13.3 million acre-feet of total surface water available during times of drought, al- though some 20 million acre-feet are permitted for consumption annually. According to TWDB, only 9 million acre-feet of this amount can be considered existing supply due to legal and other constraints. By 2060, in periods of drought surface water sources are expected to decrease 7 percent, from around 9 million acre-feet to 8.4 million acre-feet.10 This decline in supply will be the result of reservoir sedimentation, a process in which eroded sediments accumulate in reser- voirs, eventually making the reservoirs shal- lower. In 2060, the total amount of surface water is projected to decrease to approximately 13.1 million acre-feet in non-drought conditions.11 While water supplies decrease, demand is expected to increase due largely to population growth. Per capita use among the 40 largest cities in Texas in 2000 averaged just over 195 gallons per day per person, while conservation recommendations aim to reduce demand by 1 percent annually to reach a future statewide average of 140 gallons per capita per day.12 How- ever, TWDB’s projections based on the 40 largest Texas cities suggest that conservation efforts will be far short of that mark. It should also be noted that basic projections of per capita water use do not take into account water conservation strate- gies, which are anticipated for most cities in 15 of the 16 regions (Exhibit 3).13 In addition to conservation, increased efficiency in delivery of water, especially for agricultural uses, is critical to the future of Texas. Demographics and Future Water Needs According to projections from TWDB and the Texas State Data Center, the Texas population will more than double between 2000 and 2060, Exhibit 4 Texas Population Growth by Water Planning Region, 2000-2060 (Projected) 0 50 100 150 200 250% Percentgrowthinpopulation Water Planning Region A B C D E F G H I J K L M N O P Texas 52.0 9.8 149.1 72.3 116.6 25.1 105.4 124.7 46.6 79.5 139.7 110.4 209.5 63.7 21.5 3.3 118.5 Source: Texas Water Development Board. F G A I C H J B E O L M N K D P
  • 10.
    Liquid Assets: TheState of Texas’Water Resources Texas Comptroller of Public Accounts6 Introduction If new management and conservation strategies are not implemented, water shortages would leave 85 percent of the Texas population in 2060 with insufficient supplies. to decrease from 17.9 million acre-feet in 2010 to 14.6 million acre-feet in 2060, an 18 percent drop. The overall existing water supplies consist of the amount that can be produced with cur- rent permits, current contracts and the existing infrastructure during droughts.15 Texas does not have enough water now to fulfill all of its estimated future needs. If new man- agement and conservation strategies are not implemented, water needs will increase from 3.7 million acre-feet in 2010 to 8.8 million acre-feet in 2060 (Exhibit 6). These water shortages would leave 85 percent of the Texas population in 2060 with insufficient supplies. Insufficient water supplies can harm the Texas economy in a number of ways. According to TWDB, “without water, farmers cannot ir- rigate, refineries cannot produce gasoline, and paper mills cannot make paper.” Economically, insufficient water supplies could cost Texans $9.1 billion in 2010 and $98.4 billion in 2060. State from 21 million to 46 million people. This growth will vary widely across the state. Exhibit 4 shows population growth across the 16 water planning regions. Eight regions, which include most of the state’s metropolitan areas, are expected to at least double in population during this period. The population in Region M, which includes Browns- ville-Harlingen, Laredo and McAllen, is expected to triple during this period. Demand for water will not increase as rapidly as population growth, largely due to decreases in irrigation. Demand growth for water will come from the municipal sector (which is made up primarily of household and commercial uses), doubling from 4 million acre-feet to 8.3 million acre-feet (Exhibit 5). Water use for irrigation is expected to decline from 10.2 to 8.6 million acre-feet during this period due to more efficient irrigation systems, reduced groundwater sup- plies and transfer of water rights from agricul- ture to municipal uses, according to TWDB.14 Overall existing water supplies are projected San Antonio and the Edwards Aquifer: Striking a Groundwater Balance Dependent upon the abundant Edwards Aquifer for more than a century, the growing city of San Antonio and neighboring cities and rural areas have made a concerted effort in recent years to lessen their use of water from the Edwards. The Edwards Aquifer provides water to many people throughout the Hill Country, not just San Antonio. The area has experienced tremendous growth in recent years, and water use has been apportioned carefully. After many legal proceedings, the Edwards Aquifer Authority, operating since 1996 as a successor to the Edwards Underground Water District established in 1949, was created to regulate water withdrawals from the aquifer, protect endangered species and preserve the aquifer for future generations.17 Adding to the management issues of the Edwards are concerns with hydrogeology. Even though the aquifer recharges readily, it cannot recharge without rain, sometimes a rare commodity in Central Texas. Continued pumping from the Edwards has exacerbated droughts in previous years. San Antonio city leaders realized that the city’s long-term viability could not be assured with a water source that fluctuated dramatically. As a result, the city, the San Antonio Water System and others have focused on conserva- tion and are considering obtaining rights to more reliable surface waters from the Lower Colorado River Authority and the Guadalupe-Blanco River Authority. San Antonio’s efforts to use water from outside its metropolitan area have had some interesting policy and political consequences. In 1997, the “junior water rights provision” of Senate Bill 1 strongly limited future efforts to export surface water from outside its basin of origin, a management tool known as interbasin transfer, or IBT (see Section 3). At the same time, neighboring counties feared the city would pump and export groundwater from their county, so several created groundwater conservation districts to restrict such activity. Although the city continues to wean itself from the Edwards Aquifer, it faces several formidable challenges in its pursuit of replacement water sources.
  • 11.
    Texas Comptroller ofPublic Accounts Liquid Assets: The State of Texas’Water Resources 7 Introduction Exhibit 5 Texas Projected Water Demand by Category, 2000-2060 0 2 4 6 8 10 12 2000 2010 2020 2030 2040 2050 2060 Sources: Texas Water Development Board. Irrigation Municipal Manufacturing Steam-electric Livestock Mining Demand for Water (millions of acre-feet) Exhibit 6 Texas ProjectedWater Needs inTimes of Drought, 2010-2060 Water needs (millions of acre-feet) 2010 2020 2030 2040 2050 2060 3.7 4.9 5.9 6.9 7.8 8.8 Sources: Texas Water Development Board. 0 2 4 6 8 10
  • 12.
    Liquid Assets: TheState of Texas’Water Resources Texas Comptroller of Public Accounts8 Introduction A report published in 1959 cited an estimated cumulative agricultural loss in Texas from 1950 to 1956 to be in excess of $3 billion per year in 2008 dollars. during the mid- 1950s hit Texas particularly hard.25 This one was called “the worst drought in recorded history” by the former Texas Water Commission.26 Today this drought of record is used as a model for the worst-case scenario in most regional and state water plans. Climatologists studying tree rings and other indicators of past rainfall have discovered that a Dust Bowl-scale drought is likely once or twice a century, continuing a 400-year-old pattern. In the past 800 years, two North American droughts of 20 to 25 years in length occurred.27 So not only are droughts likely to be frequent in the future, they could also persist long enough to cause severe socioeconomic repercussions. Should global climate change reduce rainfall and increases surface water evaporation as many experts fear, the impact could be even worse. While water planners throughout the state pre- pare for a future drought of record, history has demonstrated repeatedly that many droughts end, rather ironically, with the appearance of hurricanes, tropical storms and other flood events.28 So, while we plan for too little water, we must also plan for too much. Drought losses are felt first, most often and most severely in the agricultural sector. The economic impact of the 1950s drought can be drawn indi- rectly by studying meteorological or agricultural production data of the time. A report by the Texas Board of Water Engineers, published in 1959, government could lose $466 million in tax rev- enue in 2010 and up to $5.4 billion by 2060 due to decreased business activity as a direct result of insufficient supply.16 New management and conservation strategies identified by the regional planning groups in the State Water Plan could add 9 million acre-feet of water supply by 2060. However, even with these new water supplies, while some regions will have their projected demands met, other regions in Texas will have unmet needs because cost- effective strategies to increase supply could not be identified.22 The Economic Consequences of Drought The American Meteorological Society defines drought as “a period of abnormally dry weather sufficiently prolonged for the lack of water to cause serious hydrologic imbalance in the affect- ed area.”23 Droughts can be meteorological (less than normal precipitation), agricultural (soil moisture insufficient to grow crops), hydrologi- cal (below normal surface and subsurface water supplies) and/or socioeconomic (when water shortages begin to affect daily life).24 Policymakers look to the “drought of record” as a yardstick for estimating water needs during future droughts. The first drought of record was the Dust Bowl of the 1930s, which covered 70 percent of the U.S. An even more severe drought Georgia’s Drought Crisis Georgia has been experiencing a severe drought that has caused significant harm to that state’s economy. In testimony before a Congressional field hearing in March 2008, the General of the area U.S. Corps of Engineers stated that lakes in Georgia, Alabama and Florida were for the first time experiencing “negative inflows,” meaning that “there was more water leaving the system through evaporation than was…coming into the system” through rainfall.18 Water management in Georgia is very different than in Texas because the management of certain lake waters include laws that require water releases to protect endangered species downstream in Alabama and Florida. Business interests affiliated with West Point Lake in northwest Georgia estimated that dimin- ished economic activity resulting from the low water level at West Point Lake cost between $800 million and $1.1 billion for 2006-07.19 Of the state’s 159 counties, 40 were in moderate to extreme drought as of October 2008.20 The cities of Atlanta, Athens, Augusta, Columbus and Macon are engaged in significant water conservation efforts.21
  • 13.
    Texas Comptroller ofPublic Accounts Liquid Assets: The State of Texas’Water Resources 9 Introduction Regional Water Planning Process According to TWDB, the goal of the water plan- ning process is to ensure “that Texas will have enough water in the future to sustain our cities and rural communities, our farms and ranches, our businesses and industries, and the environ- ment.”31 Based on the state’s growing population and vulnerability to drought, water planning in Texas takes on an important dimension. In 1997, the Texas Legislature enacted Senate Bill 1, which directed TWDB to designate the areas for which regional water plans should be devel- oped — in essence, creating 16 regional water planning groups and established a water planning process that occurs in 5-year increments and is based on a 50-year planning horizon. Under the bill, water planning in Texas is a collaborative, statewide initiative. Texas uses a “bottom-up” ap- proach to water planning rooted in local, consen- sus-based decision-making. Each regional water planning group includes members representing various stakeholders, including agriculture, cited an estimated cumulative agricultural loss in Texas from 1950 to 1956 to be in excess of $3 bil- lion,29 the equivalent of more than $24 billion, or almost $3.5 billion annually, in 2008 dollars.30 Exhibit 7 shows the effect that the drought of the 1950s had on net cash farm income in Texas, which excludes most governmental sources of income for farmers. Drought swept across the state starting in 1950. Within three years annual farm income decreased below 1949 levels and remained low until the drought lifted. This indi- cates that this severe drought had a pronounced negative impact on the agricultural sector of the Texas economy. Data from Texas A&M University’s Department of Agricultural Economics indicate that recent, less severe droughts have had significant econom- ic effects on the state’s agricultural sector. Exhibit 8 shows the estimated losses suffered by produc- ers during several one-year droughts in the past 12 years. Losses of $1 billion or more occurred in five separate years between 1996 and 2008. Exhibit 7 Texas Farm Gross Cash Income Index 1949-1963 0.6 0.8 1.0 1.2 1.4 1.6 196319621961196019591958195719561955195419531952195119501949 Note: Annual values are indexed to 1949 dollars. Sources: U.S. Bureau of Economic Analysis and Comptroller of Public Accounts. (Drought of Record) 1.0 = $1 in 1949
  • 14.
    Liquid Assets: TheState of Texas’Water Resources Texas Comptroller of Public Accounts10 Introduction Providing adequate freshwater supplies for the future is a critical task that Texas must confront head-on. efforts will have on local and statewide water supplies. In addition, these entities also must consider the impact their actions could have on a landowner’s private property rights in the water on or under their land, as well as any potential economic impact. The following sections will take a more in-depth look at the challenges facing Texas regarding wa- ter policy. Regional Water Planning of the report reviews the challenges faced by each of the state’s 16 regional water planning groups, and provides an update on the progress each group has made in addressing its water needs. State Water Plan: Issues and Funding looks at several of the water policy issues that need to be confronted to ensure that Texas has suffi- cient water in the future. This includes a look at various proposals to create a dedicated funding mechanism for water projects and an examina- tion of water infrastructure funding mecha- nisms in other states. industry, the environment, cities, water utilities, power companies and other interests.32 Using data from the Texas State Data Center and TWDB, each planning group evaluates population, water demand and water supply projections, along with potential strategies to meet demands over a 50-year planning horizon. After this process is complete, TWDB compiles regional plans from each of the 16 areas into the State Water Plan. These strategies and projects are submitted to the Legislature, along with policy recommendations needed to implement the plan. After the plan is published, the plan- ning process repeats. Exhibit 9 shows the water planning regions in the state. Conclusion Providing adequate freshwater supplies for the future is a critical task that Texas must confront head-on. The needs are great and varied, and meeting them will be both daunt- ing and expensive. State and local water management entities must evaluate the need for developing new water resources while at the same time determine what effect conservation Exhibit 8 Texas Agriculture Producer Losses Due to Drought, 1996-2008 (in millions) 1996 1998 2000 2006 2008 $2,093 $2,103 $1,096 $4,100 $1,360 Sources: Texas A&M University. 0 1000 2000 3000 4000 $5000
  • 15.
    Texas Comptroller ofPublic Accounts Liquid Assets: The State of Texas’Water Resources 11 Introduction Endnotes 1 Blair Fannin, “2008 Texas Drought Losses Estimated at $1.4 Billion,” AgNews: News and Public Affairs, Texas A&M AgriLife, (September 8, 2008), p. 1, http:// agnews.tamu.edu/showstory.php?id=710. (Last visited December 29, 2008.) ; Blair Fannin, “Texas Drought Losses Estimated at $4.1 Billion,” AgNews: News and Public Affairs, Texas A&M University System Agriculture Program, (August 11, 2006), p. 1, http:// agnewsarchive.tamu.edu/dailynews/stories/DRGHT/ Aug1106a.htm. (Last visited December 29, 2008.) 2 Robert L. Lowry, Jr., Bulletin 5914: A Study of Droughts in Texas (Austin, Texas: Texas Board of Water Engineers, December 1959), p. 1; and U.S. Bureau of Labor Statistics, “Inflation Calculator,” http://data.bls.gov/cgi-bin/cpicalc.pl. (Last visited December 29, 2008.) 3 International Atomic Energy Agency, “World Water Day 2002: Water for Development,” p.1, http:// waterday2002.iaea.org/English/PressReleaseE.html. (Last visited December 29, 2008.) (Press release.) 4 UNESCO, 2003 International Year of Freshwater, “Water for Our Future: What Are the Trends?” pp. 2-3, http://www.wateryear2003.org/en/ev.php- URL_ID=3697&URL_DO=DO_TOPIC&URL_ SECTION=201.html. (Last visited December 29, 2008.) 5 Texas Water Development Board, Water for Texas 2007 (Austin, Texas, January 2007), Volume II, pp. 120-121, http://www.twdb.state.tx.us/publications/ reports/State_Water_Plan/2007/2007StateWaterPlan/ CHAPTER%204_Final_112806.pdf. (Last visited December 29, 2008.) 6 Texas Water Development Board, Water for Texas 2007, Volume I, p. 2, http://www.twdb. Exhibit 9 Water Planning Regions Sources: Texas Water Development Board. Region F Brazos G Panhandle (A) East Texas (I) Region C Region H Plateau (J) Region B Far West Texas (E) Llano Estacado (O) South Central Texas (L) Rio Grande (M) Coastal Bend (N) Lower Colorado (K) North East Texas (D) Lavaca (P)
  • 16.
    Liquid Assets: TheState of Texas’Water Resources Texas Comptroller of Public Accounts12 Introduction state.tx.us/publications/reports/State_Water_ Plan/2007/2007StateWaterPlan/vol%201_FINAL%20 113006.pdf. (Last visited December 29, 2008.) 7 Texas Water Development Board, Water for Texas 2007, Volume II, pp. 115-116, http://www.twdb. state.tx.us/publications/reports/State_Water_ Plan/2007/2007StateWaterPlan/CHAPTER%203%20 final_102806.pdf. (Last visited December 29, 2008). 8 Texas Water Development Board, “About the Texas Water Development Board,” p. 1, http://www.twdb. state.tx.us/about/aboutTWDBmain.asp. (Last visited December 29, 2008); and Texas Water Development Board, Water for Texas 2007, Volume II, p. 138, http://www.twdb.state.tx.us/publications/reports/ State_Water_Plan/2007/2007StateWaterPlan/ CHAPTER%206%20FINAL_112906.pdf. (Last visited December 29, 2008); and Texas Water Development Board, Water for Texas 2007, Volume II, pp. 176, 222-224, http://www.twdb.state.tx.us/publications/ reports/State_Water_Plan/2007/2007StateWaterPlan/ CHAPTER%207%20FINAL_112906.pdf. (Last visited December 29, 2008.) 9 Texas Water Development Board, Water for Texas 2007, Volume II, p. 176. 10 Texas Water Development Board, Water for Texas 2007, Volume II, p. 138. 11 Texas Water Development Board, Water for Texas 2007, Volume II, p. 172. http://www.twdb. state.tx.us/publications/reports/State_Water_ Plan/2007/2007StateWaterPlan/CHAPTER%206%20 FINAL_112906.pdf. (Last visited December 29, 2008.) 12 Texas Water Conservation Implementation Task Force, Report to the 79th Legislature, (Austin, Texas: Texas Water Development Board, November 2004), pp. 14, 32-33, http://www.twdb.state.tx.us/assistance/ conservation/TaskForceDocs/WCITF_Leg_Report. pdf. (Last visited December 29, 2008.) 13 Texas Water Development Board, Water for Texas 2007, Volume II, p. 128, http://www.twdb. state.tx.us/publications/reports/State_Water_ Plan/2007/2007StateWaterPlan/CHAPTER%204_ Final_112806.pdf. (Last visited December 29, 2008.) 14 Texas Water Development Board, Water for Texas 2007, Volume II, pp. 120-122. http://www.twdb. state.tx.us/publications/reports/State_Water_ Plan/2007/2007StateWaterPlan/CHAPTER%204_ Final_112806.pdf. (Last visited December 29, 2008.) 15 Texas Water Development Board, Water for Texas 2007, Volume I, p. 4. http://www.twdb. state.tx.us/publications/reports/State_Water_ Plan/2007/2007StateWaterPlan/vol%201_FINAL%20 113006.pdf. (Last visited December 29, 2008.) 16 Texas Water Development Board, Water for Texas 2007, Volume II, p. 246. http://www.twdb. state.tx.us/publications/reports/State_Water_ Plan/2007/2007StateWaterPlan/CHAPTER%20 9_112806.indd.pdf. (Last visited December 29, 2008.) 17 Edwards Aquifer Authority, “EAA Act/Mission and Goals,” p. 1, http://www.edwardsaquifer.org/pages/ eaaact.htm. (Last visited December 29, 2008.) 18 U.S. House of Representatives, Committee on Small Business, Full Committee Field Hearing on the Impact of the 2006-2007 Drought on Georgia’s Economy (Washington, D.C.: U.S. Government Printing Office, March 2008), p. 21, http://frwebgate.access. gpo.gov/cgi-bin/getdoc.cgi?dbname=110_house_ hearings&docid=f:41331.pdf. (Last visited December 30, 2008.) 19 U.S. House of Representatives, Committee on Small Business, Full Committee Field Hearing on the Impact of the 2006-2007 Drought on Georgia’s Economy, p. 4. 20 David Emory Stooksbury, “Georgia’s Drought Gets Worse in Dry September: Tropical Rain Relief Gone,” Georgia Faces: News to Use About Georgia Family, Agricultural, Consumer & Environmental Sciences (October 1, 2008), pp. 1-2 , http://georgiafaces.caes. uga.edu/storypage.cfm?storyid=3527. (Last visited December 30, 2008.) ; and GeorgiaInfo, “Georgia Counties Ranked by Area,” pp. 1-4, http://georgiainfo. galileo.usg.edu/gacountiesbyarea.htm. (Last visited December 30, 2008.) 21 David Emory Stooksbury, “Georgia’s Drought Gets Worse in Dry September: Tropical Rain Relief Gone,” p. 1. 22 Texas Water Development Board, Water for Texas 2007, Volume I, pp. 5-7. http://www.twdb. state.tx.us/publications/reports/State_Water_ Plan/2007/2007StateWaterPlan/vol%201_FINAL%20 113006.pdf. (Last visited December 30, 2008.) 23 American Meteorological Society, “Drought,” in Glossary of Meteorology (Washington, D.C., 2000), http://amsglossary.allenpress.com/glossary/ search?id=drought1. (Last visited December 30, 2008.) 24 National Weather Service Forecast Office, “What is Meant by the Term Drought?” p. 1, http://www.wrh. noaa.gov/fgz/science/drought.php?wfo=fgz. (Last visited December 30, 2008.) 25 Sources vary in estimating the duration of the drought of the 1950s. Some argue that the drought began in 1949, not 1950, while others say it ended in 1956, not 1957. Because droughts by their very nature are transitory and do not affect every area of the state equally, it is likely that all these dates are accurate, depending upon locally available data. For purposes of this report, the drought will be defined as beginning in 1950 and ending in mid-1957 so that it lasted a full seven years. All sources agree, however, that the drought was most severe in 1956. 26 Texas Water Commission, Texas Drought: Its Recent History (1931-1985) (Austin, Texas, September 1987), p. 1. 27 Connie A. Woodhouse and David Rind, “A 2,000-Year Record of Drought Variability in the Central United States,” in History of Drought Variability in the Central United States: Implications for the Future, United States Global Change Research Program Seminar, 25
  • 17.
    Texas Comptroller ofPublic Accounts Liquid Assets: The State of Texas’Water Resources 13 Introduction January 1999, (Washington, D.C. 2003) p. 3, http:// www.usgcrp.gov/usgcrp/seminars/990120FO.html. (Last visited December 30, 3008.) 28 Texas Water Commission, Texas Drought: Its Recent History (1931-1985), p. 1. 29 Robert L. Lowry, Jr., Bulletin 5914: A Study of Droughts in Texas, p. 1. 30 U.S. Bureau of Labor Statistics, “Inflation Calculator.” 31 Texas Water Development Board, Water for Texas 2007, Volume I, p. 2. 32 Texas Water Development Board, Water for Texas 2007, Volume II, pp. 2-4.
  • 18.
    Liquid Assets: TheState of Texas’Water Resources Texas Comptroller of Public Accounts14 Introduction
  • 19.
    Texas Comptroller ofPublic Accounts Liquid Assets: The State of Texas’Water Resources 15 Regional Water Planning Regional Water Planning Aerial view of dam in Canyon Lake, Texas. The Texas Water Development Board’s (TWDB’s) 2007 State Water Plan identifies 330 water management strategies from around the state that could add about 9 million acre-feet an- nually to the Texas water supply by 2060. Some of these strategies require significant upfront capital costs while others require users to pay fees or provide incentives for users to change their usage. TWDB estimates that these projects — which involve new reservoirs, desalination plants and conveyance/distribution infrastructure conser- vation measures and increased transfers between river basins — would cost the state $30.7 billion in current dollars by 2060. To put that figure in perspective, the total fiscal 2008 state budget, including federal funds, was $85.7 billion. TWDB also estimates that the cost of not imple- menting these strategies, assuming widespread drought conditions, would be about $9.1 billion in current dollars in 2010 and $98.4 billion in 2060. According to TWDB, if Texas fails to implement the State Water Plan, drought in 2060 could mean that up to 85 percent of Texans would not have enough water to sustain their current levels of use during a report of drought of record conditions.1 The economic impacts listed above are esti- mates based on a variety of assumptions made by TWDB and should only be considered as an approximation of what these costs could be. To generate the estimates above, TWDB assumed a drought of record occurring in every part of the state simultaneously. While not without prece- dent, this is an unlikely proposition. The analysis The 2007 State Water Plan identifies 330 individual water management strategies from around the state that could add about 9 million acre-feet annually to the Texas water supply by 2060.
  • 20.
    Liquid Assets: TheState of Texas’Water Resources Texas Comptroller of Public Accounts16 Regional Water Planning does not estimate the likelihood of a drought of record occurring or discount costs based on the likelihood of drought. The analysis also assumes stability in water usage patterns and does not consider the effect that increasing costs for water during times of shortage may have on water usage by commer- cial, agricultural, residential and other users. The model used by TWDB assumes that the structure of the Texas economy will remain constant over the next 50 years, and does not predict migration of Texas citizens out of eco- nomically inefficient industries. Finally, the analysis assumes that economic inputs such as labor move in “lockstep” with changes in output. As acknowledged by TWDB, however, there may be economic, contractual and practical reasons why a business that was negatively affected by drought likely would not layoff its employees if the drought conditions were expected to pass. Further, some employees who are laid off likely would find jobs in other sectors that were not harmed by drought, or would find employment in different part of the state. Thus, according to TWDB, “direct losses for employment and secondary losses in sales and employment should be considered an up- per bound.”2 Water Management Strategies Each of the more than 320 water management strategies in the State Water Plan can be catego- rized in one of six general areas: conjunctive use, conservation, desalination, groundwater, surface water and water reuse. Conjunctive Use Conjunctive use water management strategies involve combining the use of groundwater and surface water in a way that optimizes the ben- efits of each. An example of conjunctive use is when water providers use surface water as their primary water supply and use groundwater only to meet peak needs or to supplement supplies in times of drought. Conservation Conservation generally involves the manage- ment of existing water supplies to reduce de- mand and increase efficiencies in use. The water plan contains two key types of conservation: municipal water conservation and irrigation water conservation. Municipal water conservation strategies attempt to reduce water use in urban areas through a variety of social or technological approaches. Social approaches include changing water pric- ing structures to encourage more efficient water use and increasing awareness of the importance of conservation through promotional and educa- tional campaigns. Programs that explain water bills, offer plant tours and school programs and provide other educational and outreach activi- ties have proven beneficial in increasing water conservation. Technological approaches include installing more efficient plumbing fixtures in homes and businesses. Specific municipal conservation strategies in the 2007 State Water Plan include aggressive water-wasting fixture replacement programs; water-efficient landscaping codes; water loss and leak detection programs; educational and public awareness programs; rainwater harvesting; and changes in water rate structures. Irrigation water conservation involves increas- ing the efficiency of water use in agricultural operations. Approaches recommended in the 2007 water plan include: • irrigation water use management, such as ir- rigation scheduling, volumetric measurement of water use, crop management (leaving suffi- cient residue on the soil surface by eliminating plowing to reduce wind and/or water erosion) and on-farm irrigation water audits; • land management systems, including furrow dikes (small earthen dams), land leveling, conversion from irrigated to dryland farming, and brush control/management; • on-farm delivery systems, such as lining of farm ditches to catch rainfall and run off,
  • 21.
    Texas Comptroller ofPublic Accounts Liquid Assets: The State of Texas’Water Resources 17 Regional Water Planning In August 2007, Fort Bliss and the City of El Paso opened the second largest inland desalination water plant in the world. The Kay Bailey Hutchison Desalination Plant produces 27.5 million gallons of fresh water daily using reverse osmosis (RO). thereby reducing water lost during transportation or evaporation. Desalination Desalination is the process of converting salty seawater or brackish (semi-saline) groundwater into usable water. Groundwater Recommended water management strategies for groundwater involve: • drilling new wells and increasing pumping from existing wells; • temporarily overdrafting aquifers (that is extracting more water than can be recharged), during drought conditions to supplement water supplies; • expanding the capacity and number of water treatment plants so that more groundwater supplies can meet water quality standards; and • supplementing water supplies in dry areas with water from an area with a water surplus. low-pressure sprinkler systems, drip/micro irrigation systems; and • water district delivery systems, including lin- ing of district irrigation canals to reduce water leakage and replacing irrigation district and lateral canals with pipelines. In addition to municipal and irrigation water conservation, water consumption by manufac- turing, mining and steam electrical generation interests is a growing concern for the state. Some regions have engaged in conservation efforts in these areas, but such strategies tend to be restricted to areas of the state with significant concentrations of these industries. Examples of conservation techniques used for manufacturing, mining and steam electrical gen- eration include using water that has a low mineral content for cooling and stabilizing or minimiz- ing variations in water levels to prevent the need for large surges of water. For mining and steam electrical generation, the primary conservation technique is to develop more groundwater and surface water supplies at or near the operation, El Paso: New Water Sources Nestled against the Rio Grande, the Franklin Mountains and the state of New Mexico in the Chihuahuan Desert, the city of El Paso’s natural beauty has attracted settlers and tourists for centuries. But El Paso’s location in the arid western part of the state creates a significant challenge — water supply. El Paso receives an average of less than ten inches of rainfall annually, has no reservoirs and shares its only surface water source — the Rio Grande — with both New Mexico and Mexico. As a result, the Rio Grande is constrained by the U.S. Bureau of Reclamation and by an international treaty downstream.3 Just a few years ago, officials worried that El Paso would run out of water by 2020. However, aggressive water conservation efforts coupled with the discovery of abundant, if brackish, groundwater in the Hueco-Mesilla Bolson have provided the city with sufficient water supplies decades into the future.4 (“Bolson” means “basin”—the Hueco and Mesilla aquifers are separate aquifers that overlay each other but have little interconnection.)5 In August 2007, Fort Bliss and the City of El Paso opened the second largest inland desalination water plant in the world. The Kay Bailey Hutchison Desalination Plant produces 27.5 million gallons of fresh water daily using reverse osmosis (RO). RO filters resemble thick rolls of wax paper through which saline or semi-saline water is forced under high pressure, filtering out salt and other impurities. El Paso Water Utilities estimates that about 83 percent of the brackish water put into the system is recovered as potable water. The resulting concentrate is disposed of carefully in a disposal facility or underground injection well.6
  • 22.
    Liquid Assets: TheState of Texas’Water Resources Texas Comptroller of Public Accounts18 Regional Water Planning Even with full implementation of all these strategies, Region A expects a shortfall in irrigation water of more than 300,000 acre-feet in 2060. Panhandle Region (A) Region A, also known as the Panhandle region, consists of 21 counties and includes the cities of Amarillo and Pampa (Exhibit 10). The region is bisected by the Canadian River and gets nine- tenths of its water from the Ogallala Aquifer. Region A’s ten water management strategies are focused mainly on conserving existing ground- water supplies used by irrigators, developing additional wells and encouraging voluntary transfers among users. The region also receives small amounts of water from municipal and manufacturing conserva- tion, water reuse projects and the Palo Duro Res- ervoir. As such, its water management strategies fall into four general categories: conservation, desalination, groundwater and surface water needs (Exhibit 11). Even with full implementa- tion of all these strategies, the region expects a shortfall in irrigation water of more than 300,000 acre-feet in 2060. Region A estimates its management strategies will cost $562.4 million through 2060.7 Surface Water Surface water management strategies generally consist of building new reservoirs; moving water from one area to another through pipelines or natural waterways; purchasing additional water through contracts with major water providers; obtaining additional water rights; and reallocat- ing water in existing reser­voirs. Water Reuse Water reuse is simply the use of reclaimed water — wastewater that has been treated to remove solids and certain impurities, and then put to a beneficial use. Such water can be used in irriga- tion, cooling and washing. Regional Water Plans Each local planning group evaluates potentially feasible water management strategies based on its projected needs, and identifies the projects needed to meet future water needs. TWDB compiles plans from each of the state’s 16 regions into the State Water Plan and submits the plan to the Legislature, along with policy recommenda- tions needed to implement it. A detailed look at the cost and status of each region’s plan follows. Cities Hall Dallam Hartley GrayOldham Potter Moore Donley Carson Randall Roberts Wheeler Hemphill OchiltreeSherman Hansford Lipscomb Armstrong Hutchin- son Canadian River Red River Major rivers Region A Seymour Aquifer Ogallala Aquifer Existing reservoirs Dockum Aquifer* *Minor aquifer (only shown where there is no major aquifer) Child- ress Collings- worth Blaine Aquifer (subsurface)* Blaine Aquifer (outcrop)* Exhibit 10 Panhandle Region (A) Source: Texas Water Development Board.
  • 23.
    Texas Comptroller ofPublic Accounts Liquid Assets: The State of Texas’Water Resources 19 Regional Water Planning The Panhandle region shares an overriding challenge with Region O… Most of the water supply for both regions comes from the Ogallala Aquifer. This aquifer is vast but recharges very slowly, and its water is being used at an unsustainable rate. dents $384 million in income and 5,320 full- and part-time jobs by 2010, and nearly $1.9 billion in income and more than 30,000 jobs by 2060. In addition, state and local governments could lose $24 million in annual tax revenue by 2010 and some $127 million by 2060.10 Regional Challenges and Successes The Panhandle region shares an overriding chal- lenge with Region O, the Llano Estacado region, which borders it to the south; most of the water supply for both regions comes from the Ogallala Aquifer. This aquifer is vast but recharges very slowly, and its water is being used at an unsus- tainable rate. Unfortunately, the Panhandle region’s planning group has been unable to identify water management strategies that can fully address the region’s water needs. Given its dependence on the Ogallala, following the region’s goal of depleting no more than 1.25 percent of its water supplies annually is difficult. This is illustrated by the fact that one of its water management strategies is “temporary overdraft,” a strategy to use more than the recommended annual amount of 1.25 percent, to meet the needs of counties with inadequate supplies. These two opposing objectives illustrate the challenges that Region A faces in attempting to balance present and future water requirements. Several counties already lack sufficient water supplies to meet their irrigation needs. The Region A planning group notes that its report represented a “worst-case” scenario which as- sumes that, absent the strategies recommended in the water plan, the region would take no actions Status of Major Water Projects and Strategies Region A’s conservation strategies are having only limited success. Its strategies include municipal conservation measures such as public aware- ness programs and water audits; manufacturing conservation efforts like using water with lower mineral content; and irrigation conservation ef- forts such as irrigation scheduling. The regional water planning group has set a long-term goal to deplete no more than 1.25 percent of the Ogallala Aquifer’s water supplies per year. However, the planning group reports that this restricted access to the Ogallala Aquifer has made it difficult for the region to produce adequate water supplies in the short-term, and thus conservation measures are having a limited positive impact. Even so, the planning group estimates that its conserva- tion strategies could save the region an estimated 288,476 acre-feet per year.8 Well development plans represent the region’s most costly strategy. Costs to drill new ground- water wells in Roberts County alone are esti- mated at $164.3 million. Such cost estimates, combined with the region’s limited ground- water supplies, have made the board’s drilling strategy difficult to implement thus far. The region has, however, received a commitment of nearly $23 million from the Texas Water De- velopment Board to help fund new well drill- ing in Potter County. Even with this strategy, the region faces challenges in maintaining an adequate water supply.9 According to TWDB, any failure to fully imple- ment Region A’s strategies could cost area resi- Exhibit 11 Panhandle Region (A) Water Management Strategies Description Capital Costs Water Gained in Acre-Feet Average Capital Cost per Acre-Feet Conservation $144,969,383 288,476 $503 Groundwater 343,380,400 117,220 2,929 Surface Water 72,265,600 3,750 19,271 Water Reuse 1,829,300 2,700 678 Total $562,444,683 412,146 $1,365 Note: Capital cost figures do not include administrative, programmatic or other costs that may be required to implement water management strategies. Source: Texas Water Development Board.
  • 24.
    Liquid Assets: TheState of Texas’Water Resources Texas Comptroller of Public Accounts20 Regional Water Planning Region B’s 16 recommended water management strategies include conservation, water reuse and water quality improvements, as drought condi- tions tend to produce high nitrate and chloride concentrations in its water. Total capital costs for all of Region B’s water management strategies are estimated at just over $202.2 million.12 Al- though the region’s water supplies will fall from 2010 to 2060, a projected decrease in demand will allow the region to meet all its needs if its recommended strategies are followed. Region B’s strategies fall under four major cat- egories: conservation, desalination, groundwater and surface water (Exhibit 13). Status of Water Project and Strategies Region B’s planning group has recommended four water conservation strategies, the largest of which is a canal lining project that aims to prevent water loss by improving the structural integrity of irrigation canals. If fully imple- mented, the canal lining project will save the region an additional 15,700 acre-feet annually by 2060. This project is long-term, as the region plans to implement it by 2040. To meet more immediate needs, however, Region B must find to address shortages that might occur. Similarly, the planning group observes that the shortage estimates used in the report are fully cumulative. For example, the planning group’s report assumes that a shortage that is projected to begin in 2015 continues to exist through 2060. The planning group also stated its estimates did not assume any conversion to dryland farming. As the chairman of the planning group said, “Some conversion to dryland farming is already happening, and some is returning to grass, too.”11 The Texas Panhandle has been part of the na- tion’s breadbasket for many decades, thanks to irrigation technology that converted dry grass- lands to farmlands. How the region responds to shrinking supplies of groundwater may be the largest single factor in determining its future. Region B Region B is located in North Central Texas and borders Oklahoma. The region consists of 11 counties and contains a portion of three major river basins. The area’s two major cities are Wichita Falls and Vernon (Exhibit 12). Its main industries include farming, ranching and mineral production. Clay King Cottle Baylor Archer Wichita Young Cities Red River Major rivers Region B Trinity Aquifer (outcrop) Seymour Aquifer Existing reservoirs Blaine Aquifer (subsurface)* Blaine Aquifer (outcrop)* Trinity Aquifer (subsurface) *Minor aquifer (only shown where there is no major aquifer) Brazos River Trinity River Wilbarger Foard Montague Hardeman Exhibit 12 Region B Source: Texas Water Development Board.
  • 25.
    Texas Comptroller ofPublic Accounts Liquid Assets: The State of Texas’Water Resources 21 Regional Water Planning Region B’s most costly and most vital projects are those that aim to improve water quality. For example, the region plays a role in a chloride control water quality project that was initiated in the 1970’s by the Army Corps of Engineers, the Red River Authority and water planners in Texas, Oklahoma, Arkansas and Louisiana. costs. According to the planning group, the standard should allow for significantly higher nitrate content because water with higher nitrate levels does not present a health hazard to the region’s residents. Moreover, the nitrate standard requires that local water management entities conduct costly processing that is unreasonable given their budgetary allowances.14 According to TWDB, any failure to implement the region’s strategies could cost its residents $4 million in income and 50 to 60 full and part- time jobs from 2010 through 2060. State and local governments could lose $200,000 in annual tax revenue by 2010 and $300,000 by 2060.15 Region C Region C includes 15 counties and part of anoth- er (Henderson). Four of these counties contain most of the Dallas-Fort Worth Metroplex (Ex- hibit 14). Other cities in the region include Den- ton, Garland, Corsicana and Waxahachie. The Red River is the northern border of the region (and the state). The Trinity River runs diagonally across the middle of Region C, and almost the entire region lies within the upper part of the Trinity’s basin. The region also contains portions of the Sabine and Sulphur river basins. The area’s economy is based in large part on services, trade, manufacturing and government. Strategies and Estimated Costs Region C’s planning group has recommended 59 strategies to meet and even exceed the projected water demands through 2060. The strategies in- clude four new major reservoirs, 18 water reuse solutions to its water challenges and manage its current supply more effectively. Region B’s most costly and most vital projects are those that aim to improve water quality. For example, the region plays a role in a chloride control water quality project that was initiated in the 1970’s by the Army Corps of Engineers, the Red River Authority and water planners in Texas, Oklahoma, Arkansas and Louisiana. The collaborative project aims to desalinate water in the Wichita Basin, which supplies water to all four of the aforementioned states. Region B’s portion of the chloride control project has projected capital costs of $77.5 million. The project, if successful, would provide an ad- ditional 26,500 acre-feet of water annually by 2060. In the late 1990’s, however, Army Corps of Engineers recommended that a non-federal entity assume maintenance and operation of the project. Since then, the region’s planning board has had difficulty obtaining funding for the project and has been forced to suspend it due to a lack of federal appropriations.13 Regional Challenges and Successes Water quality is by far Region B’s biggest chal- lenge, due to high concentrations of nitrate and chloride in Lake Kemp. The region is in des- perate need of federal funding for its chloride control project, which would help make the lake’s water potable. The region’s planning group also asserts that the EPA’s current nitrate drink- ing water standard, which specifies a nitrate concentration of no more than 10 milligrams per liter, forces the region to bear unreasonable Exhibit 13 Region B Water Management Strategies Description Capital Costs Water Gained in Acre-Feet Average Capital Cost per Acre-Feet Conservation $58,500,000 16,462 $3,554 Groundwater 5,094,500 1,550 3,287 Surface Water 89,077,000 51,875 1,717 Water Reuse 49,595,000 11,134 4,454 Total $202,266,500 81,021 $2,496 Note: Capital cost figures do not include administrative, programmatic or other costs that may be required to implement water management strategies. Source: Texas Water Development Board.
  • 26.
    Liquid Assets: TheState of Texas’Water Resources Texas Comptroller of Public Accounts22 Regional Water Planning The total estimated capital cost of Region C’s strategies is just over $13.2 billion. This amount represents 43 percent of the total capital costs in the State Water Plan. strategies address groundwater supplies, but another involves using an aquifer to store water for later recovery and use.16 Status of Major Water Projects and Strategies The Region C planning group identified 13 of its recommended strategies as “major,” due to their large projected yield of additional water or because they are new reservoirs. In addition, there are two strategies, facilities improvements and construction and expansion of water treat- ment plants, that, while not directly attributed with new water supplies, have a combined capital cost of more than $3.4 billion. TWDB has committed partial funding for six of those 15 strategies, as well as five other of Region C’s strategies recommended in the state water plan. All 20 of these projects are surface water or water reuse strategies and together account for 73 percent of Region C’s total projected capital costs and 77 percent of its estimated additional water supplies in 2060. projects, three levels of municipal conservation strategies, increased water supplies from various existing sources and work on numerous water utility facilities (Exhibit 15). The total estimated capital cost for the plan’s strategies is just over $13.2 billion. This amount represents 43 percent of the total capital costs in the State Water Plan. These projects would provide Region C with an estimated 2.7 million additional acre-feet of water, for a total of 22 percent more water than the total projected demand in 2060. The strategies include new connections to Lake Fork and Lake Palestine and additional water from Lake Texoma, blended with more water from Lake Lavon. Several major Metroplex water suppliers are pursuing an option to purchase additional water from Oklahoma in the final decade of the planning period. New reservoirs recommended by the region’s planning group include two within Region C, Ralph Hall and Lower Bois d’Arc, and two outside the region, Marvin Nichols and Lake Fastrill. Only four Exhibit 14 Region C Ellis Navarro Jack Parker Collin Cooke Rockwall Grayson Tarrant Dallas Kaufman Denton Freestone Fannin Trinity River Trinity River Red River *Minor aquifer (only shown where there is no major aquifer) Cities Major rivers Region C Carrizo-Wilcox Aquifer (subsurface) Carrizo-Wilcox Aquifer (outcrop) Existing reservoirs Nacatoch Aquifer (outcrop)* Trinity Aquifer (subsurface) Trinity Aquifer (outcrop) Nacatoch Aquifer (subsurface)* Queen City Aquifer* Woodbine Aquifer (outcrop)* Woodbine Aquifer (subsurface)* Wise Henderson Source: Texas Water Development Board.
  • 27.
    Texas Comptroller ofPublic Accounts Liquid Assets: The State of Texas’Water Resources 23 Regional Water Planning This project is in the design phase, with con- struction expected to begin in mid 2009.19 Two recommended surface water strategies for Region C involve obtaining water from distant sources. The first, the Toledo Bend Project, is a strategy to bring water from a reservoir on the Texas-Louisiana border, while the second involves purchasing water supplies from Okla- homa. The Toledo Bend project is being investi- gated and discussed by Region C water suppliers and the Sabine River Authority; it is not sched- uled to be developed until 2040 at the earliest. The Oklahoma water strategy is not scheduled to supply water until 2060 and currently is stymied by a moratorium on water exports imposed by the Oklahoma Legislature.20 Three more major surface water strategies involve obtaining additional water supplies from exist- ing reservoirs. One of these is a new connection to Lake Fork Reservoir, most of which is already completed, having also been a recommended strategy in the region’s 2001 plan. The final construction and testing of the pumping station is underway. Another new connection, to Lake Palestine, is being designed; the supplier has a contract for the water and the project should be completed by 2015. The third strategy does not require a new con- nection, but rather is a plan to obtain additional water from Lake Texoma (which would have to be blended with other water supplies due to its high levels of dissolved salts and minerals). The supplier has the necessary water rights permit and is awaiting a contract with the U.S. Corps of Surface Water Strategies Sixteen of the region’s surface water strate- gies are considered major projects and/or have received some funding from TWDB. Four of these are proposed new reservoirs. Two of these already have partial funding committed to them and are scheduled to be in service by 2020; Lake Ralph Hall received $20.8 million in March 2008 and Lower Bois d’Arc Creek Reservoir received $23.35 million for permitting and mitigation in November 2008.17 The status of the two other new reservoirs is more uncertain. Part of the site for Lake Fastrill has been designated a national wildlife refuge by the U.S. Fish and Wildlife Service, and efforts to overturn that decision have failed thus far. Neighboring Region D actively opposes the pro- posed Marvin Nichols reservoir on the Sulphur River in its territory. The Legislature has created a study commission to look into and make rec- ommendations on the proposal and other water supply alternatives.18 The two strategies involving water facilities and treatment plants received funding for seven different projects in 2007 and 2008. In addition, two pipeline projects have received funds from TWDB. The Collin-Grayson Municipal Alliance Pipeline Project has been underway for several years. It first obtained funding in March 2003 and then again in November 2006. The Terrell/ Lawrence Pipeline is a project to bring water taken from Lake Tawakoni on the Sabine River to Lake Lavon on the East Fork of the Trinity, and received TWDB funding in November 2008. Exhibit 15 Region C Water Management Strategies Description Capital Costs Water Gained in Acre-Feet Average Capital Cost per Acre-Feet Conservation $1,097,572 297,647 $4 Groundwater 449,530,624 12,639 35,567 Surface Water 9,800,286,546 1,627,213 6,023 Water Reuse 2,952,014,853 722,320 4,087 Total $13,202,929,595 2,659,819 $4,964 Note: Capital cost figures do not include administrative, programmatic or other costs that may be required to implement water management strategies. Source: Texas Water Development Board.
  • 28.
    Liquid Assets: TheState of Texas’Water Resources Texas Comptroller of Public Accounts24 Regional Water Planning The rapid growth of the Metroplex cities within Region C poses the biggest challenge to its water planners. Developing sufficient water supplies for the region is difficult, time-consuming and very expensive, as demonstrated by the recommended water strategies. the Trinity River; the water will be diverted from the Trinity (the permit for which has been granted to TRWD), piped into constructed wetlands and then to the Richland-Chambers and Cedar Creek reservoirs. The transmission system and wetlands for Richland-Chambers are completed; the Cedar Creek portion and the “third pipeline” are in a later stage of the project, scheduled for 2018.24 The last major reuse strategy in Region C is very similar to the Richland-Chambers project described above. The East Fork Reuse Proj- ect will divert water from return flows to the East Fork of the Trinity River; this project was added to Region C’s 2001 plan by amendment in 2005. The water will be piped to another constructed wetlands for treatment and then transferred to Lake Lavon. East Fork is nearing completion and expected to begin delivering water by the end of 2008.25 According to TWDB, if the strategies listed above are not implemented, residents of Region C could face losses of slightly more than $3 billion in income and 27,760 full and part time jobs by 2010, and nearly $58.8 billion in income and more than 691,000 jobs by 2060. In addi- tion, state and local governments could lose $128 million in annual tax revenue by 2010 and more than $2.5 billion by 2060.26 Regional Challenges and Successes The rapid growth of the Metroplex cities within Region C poses the biggest challenge to its water planners. Developing sufficient water supplies for the region is difficult, time-consuming and very expensive, as demonstrated by the recom- mended water strategies. Most of the strategies in the 2006 regional plan, as well as its 2001 predecessor, are being imple- mented to some extent. Some of the proposed projects, however, pose significant problems, particularly the proposed Lake Fastrill reservoir site to be located in a designated national wild- life refuge, and the Marvin Nichols reservoir site in Region D, which has specifically recom- mended that the site not be included in the state water plan. Engineers for storing the water in Lake Texoma. The project is scheduled to begin supplying water by 2020.21 The last of the major surface strategies also involves obtaining more water from an exist- ing supply, in this case by raising the water level and thus increasing the capacity in the Wright Patman Reservoir. The water supplier plans to build the transmission system to get the water to Dallas by 2035 and shows the additional supply in the region’s plan by 2040.22 Water Reuse Strategies Region C’s plan contains three major reuse strat- egies, two of which received some funding from TWDB in 2008. In addition, a general reuse strategy, “conveyance with infrastructure,” was partially funded in 2007 and 2008. The funding was designated for delivering reuse water to Fort Worth supply facilities. Dallas Water Utility (DWU) has multiple proj- ects included within its reuse strategy, with a total capital cost of nearly $455 million. One of these is an indirect reuse project that would take water from a DWU wastewater treatment plant and pump it into an artificially constructed wet- land. After the water is further cleaned through filtering by the wetland, it will then be pumped into Lake Ray Hubbard. This project was in the region’s 2001 plan and is scheduled for 2012; TWDB provided $16.6 million for it in 2008. The wetland construction is already completed. Another DWU project that received $30 million from TWDB is the Cedar Crest Pipeline. This direct reuse project is in operation, delivering effluent for irrigation purposes (mostly on golf courses); the 2008 funding was for pipeline con- struction to take the water to more golf courses, parks and possibly industrial plants.23 The other reuse strategy that received par- tial funding from TWDB in 2008 is Tarrant Regional Water District’s (TRWD) “Third Pipeline and Reuse” project. This project was in an experimental stage starting in the 1990s, demonstrating the use of constructed wetlands for water treatment, and is now is progressing towards completion of stage one of the project. It involves indirect reuse of return flows into
  • 29.
    Texas Comptroller ofPublic Accounts Liquid Assets: The State of Texas’Water Resources 25 Regional Water Planning industries are agriculture, oil and natural gas production, forestry and power generation. To meet the region’s projected water demands in 2060, the Region D planning group recom- mended seven water management strategies that would provide 108,742 acre-feet of additional water supply by 2060. The projected total capital cost for these projects would be approximately $32.5 million. The region’s water management strategies fall into two general areas, groundwa- ter and surface water (Exhibit 17).28 Status of Major Water Projects and Strategies The most costly strategy in Region D’s plan involves new groundwater wells, many of them being drilled by Crooked Creek Water Supply Company over the Carrizo-Wilcox aquifer. Some of these wells have already been com- pleted. A project to drill two additional wells in Wood County, for example, was completed in 2008 at a cost of about $1.5 million. Other projects are in progress and still others are in the planning stages, with additional wells to be drilled as needed.29 Other obstacles to Region C’s plan include state restrictions on transfers of water between river basins; difficulties in obtaining surface water rights for smaller water suppliers that previously relied on groundwater sources that are dimin- ishing; and the high-costs of various anticipated construction projects. Even so, Region C has made significant progress on several of its water management strategies. Five water reuse projects have been permitted and are projected to provide 540,000 acre-feet of water annually to the region. In addition, six new connections to existing supplies have been completed, and a seventh is nearing completion. These resources should bring 351,100 acre-feet of new supplies to the region annually.”27 North East Texas Region (D) Region D, also known as the North East Texas region, comprises 19 counties as well as the cities of Longview, Marshall, Greenville and Texarkana (Exhibit 16). Large portions of the Red, Cypress, Sulphur and Sabine river basins and smaller portions of Trinity and Neches river basins are located in the area. The region’s major Exhibit 16 North East Texas Region (D) Cities Region D Carrizo-Wilcox Aquifer (subsurface) Carrizo-Wilcox Aquifer (outcrop) Existing reservoirs Nacatoch Aquifer (outcrop)* Trinity Aquifer (subsurface) Nacatoch Aquifer (subsurface)* Queen City Aquifer* Woodbine Aquifer (outcrop)* Woodbine Aquifer (subsurface)* Major rivers Blossom Aquifer (outcrop)* Blossom Aquifer (subsurface)* *Minor aquifer (only shown where there is no major aquifer) Cass Hunt Smith BowieLamar Wood Harrison Red River Hopkins Van Zandt Upshur Marion Delta Rains Morris Franklin Camp Titus Sulphur River Red River Cypress River Sabine River Neches River Gregg Source: Texas Water Development Board.
  • 30.
    Liquid Assets: TheState of Texas’Water Resources Texas Comptroller of Public Accounts26 Regional Water Planning The most challenging issue the region faces, however, is the potential development of its own surface water for use by the much more populous Region C. Region D opposes the development of the Marvin Nichols Reservoir as a water management strategy for Region C. opposes the development of the Marvin Nichols Reservoir as a water management strategy for Region C. According to the Region D water planning group, Region C’s strategy to develop a reservoir in Region D as a future water source does not follow state law because it inadequately protects the area’s water, agriculture and natural resourc- es. In addition, Region D planners believe that Region D’s concerns were overlooked by Region C and TWDB alike through the inclusion of the Marvin Nichols Reservoir water management strategy in the State Water Plan.32 Far West Texas Region (E) Region E, also known as the Far West region, is located in West Texas adjacent to New Mexico and Mexico. El Paso is located in the western tip of the region, which includes seven coun- ties situated within the Rio Grande River basin (Exhibit 18). The region depends on a variety of economic sectors, including agriculture, agribusiness, manufacturing and tourism. Ninety-six percent of the area’s residents live in El Paso County, which has a population density of 760 persons per square mile, compared to an average density of 1.1 persons per square mile in the other six counties.33 Strategies Used and Estimated Costs Region E has developed 16 water management strategies to meet its future needs. These are expected to provide 166,097 acre-feet of water annually by 2060 at a capital cost of $688.8 mil- lion. The El Paso Water Utilities (EPWU) will implement most of these strategies. Region D has five surface water strategies to obtain new surface water contracts and extend and increase existing contracts. Most of these strategies move water from Toledo Bend Reservoir to Lake Tawakoni or Lake Fork in Hunt County for agricultural needs. Region D will establish new surface water contracts as needed starting in 2010 and continuing through 2050. Some new contract procure- ment projects are already under way; Bright- star-Salem Utility District recently obtained a surface water contract from Sabine River Authority that will provide 9,000 acre-feet of water for the city of Marshall.30 According to TWDB, failure to implement these strategies could cost residents of Region D $135 million in income and 1,060 full- and part-time jobs by 2010 and more than $320 mil- lion in income and nearly 2,600 jobs by 2060. State and local governments could lose $23 mil- lion in annual tax revenue by 2010 and some $50 million by 2060.31 Regional Challenges and Successes Region D has significant water quality and distribution problems. Due to high levels of naturally occurring iron and manganese ore deposits, groundwater in parts of the region must be treated to remove these elements. In addition, because the region’s is primarily rural in nature there is very little water distribution infrastructure. Building pipelines could be very costly to obtain available surface water. The most challenging issue the region faces, however, is the potential development of its own surface water for use by the much more populous Region C. As noted above, Region D Exhibit17 North East Texas Region (D) Water Management Strategies Description Capital Costs Water Gained in Acre-Feet Average Capital Cost per Acre-Feet Groundwater $27,764,102 7,806 $3,557 Surface Water 4,815,605 100,936 48 Total $32,579,707 108,742 $300 Note: Capital cost figures do not include administrative, programmatic or other costs that may be required to implement water management strategies. Source: Texas Water Development Board.
  • 31.
    Texas Comptroller ofPublic Accounts Liquid Assets: The State of Texas’Water Resources 27 Regional Water Planning another $172.4 million in capital costs. These four strategies alone will create an additional 98,109 acre-feet of water annually by 2060. EPWU’s conservation program, with an an- nual operating cost of $4 million, is expected to provide an additional 23,437 acre-feet per year by 2060 (Exhibit 19).34 The majority of the capital cost, $502.7 million, will be used for pumping and treat- ing additional groundwater from the Bone Spring-Victorio Peak Aquifer near Dell City. Other EPWU projects, such as the importa- tion of water, the direct reuse of wastewater effluent, and the increased use of surface water from the Rio Grande will account for Exhibit 18 Far West Texas Region (E) Source: Texas Water Development Board. Exhibit 19 Far West Texas Region (E) Water Management Strategies Description Capital Costs Water Gained in Acre-Feet Average Capital Cost per Acre-Feet Conservation $0 23,437 $0 Desalination 502,743,000 50,000 10,055 Groundwater 36,779,000 26,191 1,404 Surface Water 103,494,000 20,000 5,175 Water Reuse 45,842,000 18,109 2,531 Total $688,858,000 137,737 $5,001 Note: Capital cost figures do not include administrative, programmatic or other costs that may be required to implement water management strategies. Source: Texas Water Development Board.
  • 32.
    Liquid Assets: TheState of Texas’Water Resources Texas Comptroller of Public Accounts28 Regional Water Planning Since 1993, El Paso Water Utility has operated an aggressive water conservation program that imposes restrictions on residential watering and includes a rate structure that penalizes high consumption. Through such conservation efforts, El Paso’s daily water use has decreased from 200 gallons per capita in 1990 to 151 in 2006. The per capita goal for the city is 140, which would be the lowest level of use among Texas’ large cities. goal for the city is 140, which would be the low- est level of use among Texas’ large cities.42 EPWU’s Kay Bailey Hutchison Desalination Plant, completed in 2007, is the world’s second largest inland desalination plant, producing 27.5 million gallons of fresh water per day from brackish groundwater supplies. The facility has increased El Paso’s water production by 25 percent, and also includes a learning center, groundwater wells, transmission pipelines and storage and pumping facilities.43 Region F Region F is located in the Edwards Plateau in West Texas. It consists of 32 counties and includes the cities of Midland, Odessa and San Angelo (Exhibit 20). The Pecos River is located in the West of the region and the Colorado River is situated in the Northeast. A large portion of Region F lies in the upper portion of the Colo- rado River basin and the Pecos area of the Rio Grande basin. The region’s major industries are health care and social assistance, manufacturing and oil and gas. Strategies Used and Estimated Cost In its 2007 water plan, Region F recommended 15 water management strategies at a projected total capital cost of $557 million. The new man- agement strategies would provide 239,250 acre- feet of additional water by 2060, slightly more than will be needed (Exhibit 21). Region F could not, however, identify economi- cally feasible strategies to meet some of its irriga- tion needs or any of its steam-electric needs. The region’s unmet needs include 115,523 acre-feet a year for irrigation and 24,306 acre-feet annually for steam-electric power generation in 2060.44 Status of Major Water Projects and Strategies Because 78 percent of the region’s water comes from groundwater, most of the region’s projects are focused on reusing, cleaning and enhancing these resources.45 Region F has been a leader in weather modifica- tion (seeding clouds with rain-inducing chemi- cals) and brush management for many years. Areas within the region have been seeding prom- Status of Major Water Projects and Strategies The region’s largest project involves pumping ad- ditional groundwater from Bone Spring-Victorio Peak Aquifer. The brackish water of this aquifer does not meet municipal water quality stan- dards, so most of the $502.7 million in costs are for treating and desalinating the water.35 In 2003, EPWU purchased 28,000 acres of land, a tract called Diablo Farms, which overlays the Capitan Reef Aquifer. EPWU intends to convert Diablo Farms into a well field. This project will provide an estimated 10,000 additional acre-feet annually by 2060.36 The Lower Valley Water District has received $10.2 million in state funds from TWDB to replace a water main as part of this project.37 Drilling for the Diablo Farms project is scheduled to begin in 2040. Like the Bone Spring-Victorio Peak project, this is a long- term strategy to meet future water demand driven by regional population growth. Because water demand has not been as high as projected in the 2006 regional water plan, the region is likely to push back the scheduled start dates for the Diablo Farms and the Bone Spring-Victorio Peak Aquifer projects.38 According to TWDB, if the strategies listed above are not implemented, Region E residents could lose $160 million in income and 4,570 full- and part-time jobs by 2010, rising to nearly $1.1 billion in income and more than 13,000 jobs by 2060. In addition, state and local governments could lose $8 million in annual tax revenue by 2010 and about $105 million by 2060.39 Regional Challenges and Successes Since 1993, EPWU has operated an aggressive water conservation program that imposes re- strictions on residential watering and includes a rate structure that penalizes high consumption. The utility also offers several rebate programs for replacing appliances and bathroom fixtures with low-consumption units and using native landscaping to reduce the need for irrigation.40 Through such conservation efforts, El Paso’s daily water use has decreased from 200 gallons per capita in 1990 to 151 in 2006.41 The per capita
  • 33.
    Texas Comptroller ofPublic Accounts Liquid Assets: The State of Texas’Water Resources 29 Regional Water Planning Region F has been a leader in weather modification (seeding clouds with rain-inducing chemicals) and brush management for many years. Areas within the region have been seeding promising cloud formations since the early 1970s. more than the city could afford by itself. Eden is working with TWDB to find funding. Furthermore, San Angelo recently built a pipe- line to its well field south of Melvin to supply it with adequate water. The pipeline passes near Eden and the city could link to it. Plans to do so are still developing.48 According to TWDB, any failure to implement Region F’s strategies could cost its residents $475 million in income and 8,020 full- and part-time jobs by 2010, and $962 million in income and 15,600 jobs by 2060. In addition, state and local governments could lose $35 ising cloud formations since the early 1970s.46 The North Concho River watershed was the site of a state-funded brush management program in the early 2000s to restore grassland and reduce large areas of water-hogging juniper and mes- quite trees, thus allowing rainfall to penetrate the soil and flow into underground supplies.47 Both technologies are included in the region’s plan to enhance surface and groundwater supplies. The Hickory Aquifer supplies the city of Eden with sufficient fresh water, but the area’s low number of wells has impeded the city’s ability to access much of the aquifer’s supplies. Drilling more wells could cost more than $1.5 million, Exhibit 20 Region F Pecos Reeves Crockett Irion Sutton Upton Kimble Ward Brown Reagan Coleman Tom Green Mason Crane Concho Schleicher Sterling Menard McCulloch Coke Ector Martin Scurry Runnels Borden Mitchell Howard Midland WinklerLoving Glasscock Andrews Colorado River Pecos River Cities Major rivers Region F Edwards-Trinity (Plateau) Aquifer (outcrop) Existing reservoirs Capitan Reef Aquifer* Pecos Valley Aquifer Ogallala Aquifer Trinity Aquifer (outcrop) Trinity Aquifer (subsurface) Dockum Aquifer (outcrop)* Dockum Aquifer (subsurface)* *Minor aquifer (only shown where there is no major aquifer) Edwards-Trinity (High Plains) Aquifer* Ellenburger-San Saba Aquifer (outcrop)* Ellenburger-San Saba Aquifer (subsurface)* Hickory Aquifer (outcrop)* Hickory Aquifer (subsurface)* Lipan Aquifer* Marble Falls Aquifer* Rustler Aquifer (outcrop)* Rustler Aquifer (subsurface)* Igneous Aquifer* Source: Texas Water Development Board.
  • 34.
    Liquid Assets: TheState of Texas’Water Resources Texas Comptroller of Public Accounts30 Regional Water Planning include Abilene, Bryan, College Station, Killeen, Round Rock, Temple and Waco. More than 90 percent of the region is located within the Brazos River Basin, which is also its primary water source. Industries with the largest economic impact on the region are service, manufacturing and retail trade. The Brazos Planning Group has recommended a va­riety of management strategies that could provide more water than it needs to meet fu­ture needs. In all, these strategies would provide 736,032 acre-feet of additional water annually by 2060. The projected total capital cost for provid- ing this additional water is just over $1 billion. To achieve the water goals set forth by its plan- ning group, Region G will implement strate- gies in the areas of conservation, groundwater, surface water and water reuse (Exhibit 23).51 Status of Major Water Projects and Strategies Region G’s conservation strategies would pro- vide 6 percent of all water associated with its strategies. The region has recommended water conservation for every municipal water user group that had both a need and a gallons-per- capita-per-day use greater than 140 gallons.52 The region will meet with local and municipal groups to develop timelines and reuse systems and closely monitor well and reservoir levels.53 Region G also has several groundwater strate- gies including building additional wells, water treatment facilities and voluntary redistribution. million in annual tax revenue by 2010 and $82 million by 2060.49 Regional Challenges and Successes Region F faces challenges in meeting drink- ing water standards as well as with disposing of waste from desalination and radionuclide treatment, which is, respectively, the removal of salts and naturally-occurring, low level radio- active particles from groundwater. A few small, rural communities in the region rely solely on water sources that exceed U.S. Environmental Protection Agency (EPA) regulations on some of these contaminants, but they cannot afford expensive water treatment costs, nor do they have clear guidance on how to dispose of the residual waste. Some regional representatives contend that the cost of treatment in order to meet federal drinking water standards is not justified by the health risks from the pres- ence of radionuclide in the water. The region therefore recommends that the TCEQ help these communities receive exemptions from EPA’s radionuclide regulations so that they do not face either strict enforcement or costly water treatment costs. Further, the region also has recommended that TCEQ create rules for disposing of radionuclide waste residuals so that these communities can estimate treatment costs more accurately.50 Brazos Region (G) Region G, also known as the Brazos region, stretches from Grimes County northwest to Kent County and includes all or parts of 37 counties (Exhibit 22). Major cities in the region Exhibit 21 Region F Water Management Strategies Description Capital Costs Water Gained in Acre-Feet Average Capital Cost per Acre-Feet Conservation $43,152,601 81,974 $526 Desalination 131,451,830 16,221 8,104 Groundwater 251,825,812 38,270 6,580 Surface Water 30,115,300 90,075 334 Water Reuse 100,889,000 12,710 7,938 Total $557,434,543 239,250 $2,330 Note: Capital cost figures do not include administrative, programmatic or other costs that may be required to implement water management strategies. Source: Texas Water Development Board.
  • 35.
    Texas Comptroller ofPublic Accounts Liquid Assets: The State of Texas’Water Resources 31 Regional Water Planning the population center along with the well field to supply the residents. Sweetwater plans to complete a study about wa- ter levels and quality with information from the surface water and the well field. The city’s waste- water treatment plant, online since 2004, and other infrastructure, including pipelines, will be updated to supply the city with surface water beginning 2009.54 If the study finds excessive use from citizens using the well field before it Region G, in partnership with TWDB, HDR Engineering and the city of Sweetwater, began a study in April 2008 to assess the water levels and quality in the Champion Well Field. Sweetwa- ter currently receives all of its water from these wells. Lakes in the area, however, have returned to full capacity after several years of drought so the city can reduce its dependence on groundwa- ter. Sweetwater would like to begin using surface water taken from lakes located 30 miles from Exhibit 22 Brazos Region (G) Brazos River Brazos River Cities Major rivers Region G Carrizo-Wilcox Aquifer (outcrop) Carrizo-Wilcox Aquifer (subsurface) Edwards (Balcones Fault Zone) Aquifer (outcrop) Edwards (Balcones Fault Zone) Aquifer (subsurface) Edwards-Trinity (Plateau) Aquifer Gulf Coast Aquifer Seymour Aquifer Existing reservoirs Blaine Aquifer (outcrop)* Blaine Aquifer (subsurface)* Brazos River Alluvium Aquifer* Dockum Aquifer (outcrop)* Dockum Aquifer (subsurface)* Ellenburger-San Saba Aquifer (outcrop)* Ellenburger-San Saba Aquifer (subsurface)* Hickory Aquifer (outcrop)* Marble Falls Aquifer* Queen City Aquifer (outcrop)* Queen City Aquifer (subsurface)* Sparta Aquifer (outcrop)* Sparta Aquifer (subsurface)* Trinity Aquifer (outcrop) Trinity Aquifer (subsurface) *Minor aquifer (only shown where there is no major aquifer) Woodbine Aquifer (outcrop)* Woodbine Aquifer (subsurface)* Yegua-Jackson Aquifer* Somervell Haskell Hill Bell Lee Milam FallsCoryell Grimes Williamson McLennanHamilton Limestone Brazos Robertson Burleson Lampasas Washington Erath Kent Knox Jones Nolan Taylor Young Fisher Bosque Eastland Callahan Stephens Palo Pinto Stonewall Comanche JohnsonHood Shackelford Throck- morton Colorado River Source: Texas Water Development Board.
  • 36.
    Liquid Assets: TheState of Texas’Water Resources Texas Comptroller of Public Accounts32 Regional Water Planning Cedar Park, Leander and Round Rock all need additional water in the future. Rather than building three water treatment plants and excess infrastructure, the cities are building one regional water treatment plant and pipes that connect all of them together. A $300 million loan from TWDB will fund the project. themselves as the Brushy Creek Regional Author- ity. The cities of Cedar Park, Leander and Round Rock all need additional water in the future. Rather than building three water treatment plants and excess infrastructure, the cities are building one regional water treatment plant and pipes that connect all of them together. A $300 million loan from TWDB will fund the majority of the project, which will begin with improvements to the al- ready present floating intake in Lake Travis, a raw water line with water from the lake to the regional water treatment plant in Cedar Park, and a treated water line with take points for the communities. Cedar Park has the most immediate need for water at the present and will be online with the water treatment plant in 2012. In the interim, Round Rock will supply the city with water as part of their partnership. The bulk of the work for the project will be completed in the first phase, which includes building of pipes and the water treatment plant, at a cost of $180 million. Four local engineering firms are on working on the project, with the prospect for more consultants as construction begins. Once the project is complet- ed, other cities in the area, including Georgetown, will be free to use local surface water supplies for their own needs rather than sharing with Round Rock, which will receive the bulk of its water from the Lake Travis Regional Water System.57 Region G utilizes water reuse strategies with new technology including pipes, discharge mecha- nisms, and more efficient cleaning techniques for irrigation and manufacturing purposes. The can be replenished, the region may explore other groundwater management strategies such as us- ing supplies purchased from the city of Abilene, other groundwater supplies, or an off-channel alternative to Double Mountain Fork Reservoir. Region G continues to work with other regions to cultivate safe and sufficient water supplies.55 The Brazos Region plans include construction of new reservoirs and enhancing existing reservoirs. The region plans to identify specific small public water systems where problems with organization and resources might occur and study regionaliza- tion. The Brazos Group hopes to create larger re- gions that could share resources and pull together with larger water utilities. When counties within the region require more water than they have, the regional groups can distribute water from lakes, reservoirs and treatment plants needing water or to other entities outside the region. According to TWDB, Somervell County has received $31 million in funding for a water treatment plant, storage and transmission lines. The Brazos River Authority received $22 mil- lion to develop a strategy using groundwater to firm up current supplies in Lake Granger, Palo Pinto Water District recieved $8 million for the acquisition of Lake Turkey Peak and the City of Cleburne received nearly $4.8 million for devel- opment of Lake Whitney.56 Three cities within Region G have joined to- gether to complete the Lake Travis Regional Water System management strategy representing Exhibit 23 Brazos Region (G) Water Management Strategies Description Capital Costs Water Gained in Acre-Feet Average Capital Cost per Acre-Feet Conjunctive Use 303,288,000 54,390 5,576 Conservation $0 45,218 $0 Groundwater 86,713,541 41,075 2,111 Surface Water 582,639,746 513,621 1,134 Water Reuse 103,681,747 81,728 1,269 Total $1,076,323,034 736,032 $1,462 Note: Capital cost figures do not include administrative, programmatic or other costs that may be required to implement water management strategies. Source: Texas Water Development Board.
  • 37.
    Texas Comptroller ofPublic Accounts Liquid Assets: The State of Texas’Water Resources 33 Regional Water Planning more inclusive and there is much better com- munication now between the planning group, entities providing water and entities needing wa- ter. This has led to greater understanding of the water issues that the region faces in the future. Specifically, the planning group indicated that the long-term planning horizon for the region is now 50 years, as opposed to previous planning efforts where the region only evaluated 10- to 15-year water needs. Also, the region established a formal method to communicate between competing users for a common resource and among regional water providers that manage the resources. Lastly, grassroots-level water planning with local stakeholders has created greater water literacy on the part of more local people.60 Region H Region H, located in eastern Texas, comprises 15 counties including the Houston metro- politan area (Exhibit 24). The region includes portions of the Trinity, San Jacinto and Brazos river basins. Its predominant economic sector is the petrochemical industry; the region is area also plans to purchase water from providers for irrigation. The region will monitor drought conditions and purchase additional water as needed, possibly from Region C. In partnership with Region C, the region will develop a study of the water supplies in Ellis County, Southwest Dallas County, Southeast Tarrant County and Johnson County to check on water levels for pos- sible use in the Brazos Region during drought. Once water levels are assessed, infrastructure may be needed to serve the counties.58 According to TWDB, if Region G’s strategies are not implemented, its residents could lose nearly $1.1 billion in income and 19,260 full- and part-time jobs by 2010, and nearly $2.8 billion in income and more than 46,000 jobs by 2060. In addition, state and local governments could lose $39 million in annual tax revenue by 2010 and about $141 million by 2060.59 Regional Challenges and Successes According to the Brazos Planning Group, the regional planning process has become much Exhibit 24 Region H Harris Polk Leon Brazoria Trinity Walker Austin Waller Chambers Madison San Jacinto Galveston Trinity RiverSan Jacinto River Brazos River Cities Major rivers Region H Carrizo-Wilcox Aquifer (subsurface) Carrizo-Wilcox Aquifer (outcrop) Existing reservoirs Queen City Aquifer (outcrop)* Queen City Aquifer (subsurface)* Sparta Aquifer (outcrop)* Sparta Aquifer (subsurface)* Yegua-Jackson Aquifer* Brazos River Alluvium Aquifer* Gulf Coast Aquifer *Minor aquifer (only shown where there is no major aquifer) Liberty Fort Bend Montgomery Source: Texas Water Development Board.
  • 38.
    Liquid Assets: TheState of Texas’Water Resources Texas Comptroller of Public Accounts34 Regional Water Planning from TWDB’s State Participation Program to fund future construction.62 The San Jacinto River Authority and the Cen- tral Harris County Regional Water Authority have received $21.5 million and $22.1 million respectively for the planning, permitting and infrastructure development to implement surface water conversion programs.63 The Region H Planning Group expects the North Fort Bend Water Authority to apply for $145 million in Water Development Funds from TWDB for the planning and construction of a similar program.64 According to the TWDB, if the strategies listed above are not implemented it could cost residents of Region H $2.5 billion in income and 27,970 full- and part-time jobs by 2010 and nearly $15.4 billion in income and about 188,000 jobs by 2060. In addition, state and local governments could lose $133 million in annual tax revenue by 2010 and nearly $1.2 billion by 2060.65 Regional Challenges and Successes Region H faces the challenge of subsidence, which is the settling or sinking of land caused by excessive groundwater pumping. As a result, the region is continuing to convert from groundwa- ter to new surface water sources.66 The regional planning group estimates that this conversion to surface water will cost $1 billion between now and 2020. The planning group anticipates that local municipalities and water agencies will seek responsible for two-thirds of the nation’s total petrochemical production. Other significant industries include medical services, tourism, construction, banking, transportation, govern- ment, fisheries and agriculture. Strategies Used and Estimated Cost The 23 strategies identified by Region H en- compass $5.5 billion in capital costs and would provide 1,300,639 acre-feet of water annually by 2060. About half ($2.7 billion) of this cost is for the city of Houston’s purchase of water from the Trinity River Authority. Other costs include the construction of a new desalination plant, wastewater treatment plants, reservoirs and pipelines, at a cost of $1.5 billion. The remain- ing capital costs are primarily for the renewal of existing water contracts or for new contracts for additional water (Exhibit 25).61 Status of Major Water Projects and Strategies In fiscal 2008, Region H received $71.6 mil- lion from the Water Infrastructure Fund from TWDB to implement three strategies that cre- ate or utilize more surface water. One of the projects in Region H, the Luce Bayou Interba- sin Project, has received $28 million in water infrastructure funding from TWDB. This project will provide 400 million gallons per day to users in Harris, Fort Bend and Mont- gomery counties. These funds will be used for planning, permitting and design. The Region H Planning Group anticipates $250 million Exhibit 25 Region H Water Management Strategies Description Capital Costs Water Gained in Acre-Feet Average Capital Cost per Acre-Feet Conservation $615,740 178,868 $3 Desalination 255,699,000 28,000 9,132 Groundwater 173,153,800 90,993 1,903 Surface Water 4,774,598,260 836,913 5,705 Water Reuse 256,453,592 165,865 1,546 Total $5,460,520,392 1,300,639 $4,198 Note: Capital cost figures do not include administrative, programmatic or other costs that may be required to implement water management strategies. Source: Texas Water Development Board.
  • 39.
    Texas Comptroller ofPublic Accounts Liquid Assets: The State of Texas’Water Resources 35 Regional Water Planning Region H faces the challenge of subsidence, which is the settling or sinking of land caused by excessive groundwater pumping. As a result, the region is continuing to convert from groundwater to new surface water sources. meet fu­ture needs. In all, the strategies would provide 324,756 acre-feet of additional water supply by 2060. The total projected capital cost of providing additional water in the region ex- ceeds $613.4 million. The region’s water manage- ment strategies fall into four general categories: conservation, groundwater, surface water and water reuse (Exhibit 27).68 Status of Major Water Projects and Strategies The state has committed about $15.6 million for the development costs of the Lake Columbia res- ervoir, currently in the pre-construction phase. Before starting construction, the project must gain a 404 permit, a permit certifying that the region meets governmental standards restricting wastewater discharge into bodies of water, from the U.S. Army Corps of Engineers. Project plan- ners are working with the Angelina & Neches state funds through the Water Infrastructure Fund and State Participation Program to cover part of the cost of conversion.67 East Texas Region (I) Region I, also known as the East Texas region, is located along the Louisiana border extending between Beaumont, Tyler, and the Trinity River, and comprises 20 counties (Exhibit 26). Large portions of the Sabine and Neches rivers and a smaller portion of the Trinity River are located in the area. Major industries in the region in- clude petrochemical, timber and agriculture. Status of Major Water Projects and Strategies In order to meet the region’s projected water de- mands in 2060, the East Texas Planning Group recommended 19 water management strategies that would provide more water than required to Exhibit 26 East Texas Region (I) Source: Texas Water Development Board.
  • 40.
    Liquid Assets: TheState of Texas’Water Resources Texas Comptroller of Public Accounts36 Regional Water Planning In addition to these issues, the region’s chairman identified solutions for two planning and regula- tory issues. Water demand projections are based on Texas State Data Center population projec- tions in conjunction with TWDB. According to the East Texas Region’s Chairman regional planners must adhere to these projections even if regional planners have better insight on lo- cal population trends. Water planning could improve if local consultants became responsible for population projections. According to TWDB, regional planners can amend population projec- tions if they have more accurate demographic data to support these charges. Also, levels of water consumption used for regional planning differ from levels specified in TCEQ statutes. The region’s planning group chairman prefers TCEQ levels, since they more closely align with needs of the region during a drought of record. These two levels could be reconciled based on scientific criteria to create one standard that accommodates both regional planning and TCEQ needs. Funding presents another obstacle for the region. To meet water demand in the northern and southern areas, the region must develop a costly water transporta- tion infrastructure. In addition, rural areas of the region lack the customer base to support large water projects. The East Texas region’s greatest success is the designation of Lake Columbia as a unique reservoir site. Several participants from the surrounding area of the future reservoir site continue making progress toward project construction.72 River Authority and a private consultant to re- view comments and address all concerns related to the 404 permit. The region will request an additional $48 million from the state in January, contingent on obtaining the 404 permit.69 According to the TWDB, if the strategies listed above are not implemented it could cost resi- dents of Region I $141 million in income and 1,860 full- and part-time jobs by 2010 and nearly $1.7 billion in income and almost 23,000 jobs by 2060. In addition, state and local governments could lose $17 million in annual tax revenue by 2010 and some $236 million by 2060.70 Regional Challenges and Successes The East Texas region continues to face and over- come challenges associated with water strategy implementation. Designation of unique stream segments presents a problem for the region as water planners must balance future needs of land rights owners with the interests of developers, future public works projects and environmental concerns. Regional planners also face challenges associated with implementing environmental flow, the amount of water necessary for a river, estuary or other freshwater system to maintain its health and productivity, mandates from Sen- ate Bill 3. Environmental flow planners must consider a range of competing interests, from national security to economic development and environmental welfare.71 For instance, efforts to deepen and widen Sabine Lake require creative ways of mitigating saltwater and brackish water inflows from the Gulf of Mexico. Possible solu- tions include pumping freshwater into the lake or construction of marshes. Exhibit 27 East Texas Region (I) Water Management Strategies Description Capital Costs Water Gained in Acre-Feet Average Capital Cost per Acre-Feet Conservation $0 1,916 $0 Groundwater 32,364,727 21,589 1,499 Surface Water 577,468,276 298,575 1,934 Water Reuse 3,601,700 2,676 1,346 Total $613,434,703 324,756 $1,889 Note: Capital cost figures do not include administrative, programmatic or other costs that may be required to implement water management strategies. Source: Texas Water Development Board.
  • 41.
    Texas Comptroller ofPublic Accounts Liquid Assets: The State of Texas’Water Resources 37 Regional Water Planning Eight of the 12 water management strategies in the region deal with conservation efforts in Kerr and Bandera counties and comprise just more than 10 percent, or 1,507 acre-feet, of the additional water needed in the region by 2060. The capital costs associated with these strategies is relatively low, just $3,600, and the region has already begun implementation of these strategies. Specifically, the region is auditing municipal water use in Kerr and Bandera counties to identify wasteful practices. The region is educating the public about wasteful practices and efficient use. In addition, the region is making a concerted effort to conserve water used for irrigation systems through more efficient crop management, time sensitive irrigation schedules and the use of low-pressure sprinkler systems. Approximately half of the capital costs, $7.7 mil- lion, will fund new groundwater wells in Kerr and Bandera counties. These new groundwater wells will provide more than one-third, or 5,672 acre-feet, of the additional water needed in the region by 2060. This strategy is currently being studied, with no plans implement it until at least 2010. The regional planning group is unclear Plateau Region (J) Region J, also known as the Plateau region, is located on the southern edge of the Edwards Plateau and consists of six counties (Exhibit 28). The major cities in the area are Del Rio and Ker- rville. The area extends from the Texas – Mexico border eastward through the Texas Hill Coun- try. Portions of the Guadalupe, Nueces, Colo- rado, San Antonio and Rio Grande River Basins are included in the area. The major industries in the region are tourism, ranching, hunting and government operations associated with Laughlin Air Force Base in Del Rio. Strategies Used and Estimated Costs The Plateau Planning Group recommended 12 water management strategies for the region that can be classified into three general categories: conservation, groundwater and surface water. The strategies recommended in the region have a total capital cost of $14.4 million and would result in an additional 14,869 acre-feet of water supply available by 2060 (Exhibit 29).73 Exhibit 28 Plateau Region (J) Val Verde Edwards Kinney Real Rio Grande Nueces River Medina River Guadalupe River Cities Major rivers Region J Edwards (Balcones Fault Zone) Aquifer (outcrop) Edwards (Balcones Fault Zone) Aquifer (subsurface) Edwards-Trinity (Plateau) Aquifer (outcrop) Edwards-Trinity (Plateau) Aquifer (subsurface) Trinity Aquifer Ellenburger-San Saba Aquifer* Hickory Aquifer* Existing reservoirs *Minor aquifer (only shown where there is no major aquifer) Kerr Bandera Source: Texas Water Development Board.
  • 42.
    Liquid Assets: TheState of Texas’Water Resources Texas Comptroller of Public Accounts38 Regional Water Planning and part-time jobs by 2010 and nearly $9 million in income and about 70 jobs could be lost by 2060. In addition, state and local governments could lose $140,000 in annual tax revenue by 2010 and about $180,000 by 2060.76 Regional Challenges and Successes The region needs better groundwa­ter modeling to provide more accurate data to the regional and sub-regional planning groups. Improved ground- water modeling data would not only provide a better picture of how much groundwater is avail- able, it would also provide a better idea of seasonal influxes in water needs due to tourists, hunters and weekend home owners. Many residents are very concerned about the possible export of the region’s groundwater to neighboring regions.77 Lower Colorado Region (K) Region K, also known as the Lower Colorado region, begins in Mills and San Saba counties in the Texas Hill Country and makes its way southeastward toward the Gulf of Mexico. The region serves much of the Hill Country, including Llano, Fredericksburg, Austin and Pflugerville, as well as Bay City and other coastal communities (Exhibit 30). Agriculture, government, manufacturing (primarily semi- conductor and other technological industries), retail and service industries are the region’s economic mainstays.78 Strategies Used and Estimated Costs Total capital costs for all of Region K’s water management strategies are estimated at $358.2 million. The region’s water management strate- gies are projected to produce 861,930 acre-feet by at this point exactly how much groundwater is available in the Edwards-Trinity Aquifer because there are some concerns about the accuracy of the current modeling system used by TWDB to calculate the water resources in the aquifer. In addition, the regional planning group has some concerns about the demographic growth data used for the area. Until the region can more ac- curately project its future demographic changes, as well as the available groundwater resources in the area, these strategies will be on hold. More than $6.5 million of the capital costs listed in the region’s plan deal with increasing the City of Kerrville’s water treatment capacity. By doing so, the region will be able to increase the amount of potable water available to the area by 2,240 acre-feet without any additional groundwater or surface water contracts. As part of this strategy, the city of Kerrville plans to increase the amount of water that is treated from 5 million gallons per day to 10 million gallons per day over the course of five years, beginning at the end of 2007. Ker- rville initiated the project in November of 2007 and has already expanded the water treatment rate from 5 million gallons per day to 6 million gallons per day.74 However, the region can also foresee the need for additional surface water sup- plies and has included in its plan a strategy to ob- tain additional water from the Upper Guadalupe River Authority (UGRA) in 2030, an additional 3,840 acre-feet, and by 2050, an additional 5,450 acre-feet, to meet its future needs75 According to the TWDB, if the strategies listed above are not implemented, residents of Region J stand to lose $6 million in income and 50 full- Exhibit 29 Plateau Region (J) Water Management Strategies Description Capital Costs Water Gained in Acre-Feet Average Capital Cost per Acre-Feet Conservation $3,600 1,507 $2 Groundwater 7,718,000 5,672 1,361 Surface Water 6,650,000 7,690 865 Total $14,371,600 14,869 $967 Note: Four of the region’s conservation strategies do not have any acre-foot cost because they involve crop management and changing irrigation schedules. These strategies can be implemented without any acre-foot cost to water users. Capital cost figures do not include administrative, programmatic or other costs that may be required to implement water management strategies. Source: Texas Water Development Board.
  • 43.
    Texas Comptroller ofPublic Accounts Liquid Assets: The State of Texas’Water Resources 39 Regional Water Planning Region K’s groundwater strategies, which require the bulk of its capital costs, include projects to maintain adequate groundwater supplies through expansion of the Carrizo- Wilcox and Trinity Aquifers, as well as other aquifers throughout the region. Expansion of the Carrizo-Wilcox is estimated at $13 million and the Trinity Aquifer expansion project has an estimated cost of $12.2 million. Overall, the region’s groundwater projects are on target to meet projected water demand levels.80 Region K is also working on a groundwater strategy in partnership with the Fox Crossing Water District to replace Lake Goldthwaite, which could include freshwater and brackish water from the Trinity and Hickory Aquifers in Mills County and the Ellenburger-San Saba Aquifer in Lampasas and Llano Counties.81 2060 and fall into four major categories of strate- gies: conservation, groundwater, surface water, and water reuse (Exhibit31).79 Status of Major Water Projects and Strategies Some strategies in the Lower Colorado Region may be changed or substituted with a new strate- gy based on the regional assessments. The Onion Creek recharge strategy originally would build two dams to provide water to Hays County. The retained water would then be released as needed to meet water needs downstream. However, the recharge strategy will need revisions based on reviews with the Barton Springs/Edwards Aqui- fer Conservation District and City of Austin. Once new strategy decisions have been made, Region K will host at least one public meeting to discuss them. Exhibit 30 Lower Colorado Region (K) Llano Mills Burnet Hays Gillespie San Saba Williamson Blanco Colorado River Colorado River Cities Major rivers Region K Carrizo-Wilcox Aquifer (outcrop) Carrizo-Wilcox Aquifer (subsurface) Edwards (Balcones Fault Zone) Aquifer (outcrop) Edwards (Balcones Fault Zone) Aquifer (subsurface) Edwards-Trinity (Plateau) Aquifer Gulf Coast Aquifer Trinity Aquifer (outcrop) Trinity Aquifer (subsurface) Existing reservoirs *Minor aquifer (only shown where there is no major aquifer) Travis Wharton Fayette Colorado Matagorda Bastrop Ellenburger-San Saba Aquifer (outcrop)* Ellenburger-San Saba Aquifer (subsurface)* Hickory Aquifer (outcrop)* Hickory Aquifer (subsurface)* Marble Falls Aquifer* Queen City Aquifer (outcrop)* Queen City Aquifer (subsurface)* Sparta Aquifer (outcrop)* Sparta Aquifer (subsurface)* Yegua-Jackson Aquifer* Source: Texas Water Development Board.
  • 44.
    Liquid Assets: TheState of Texas’Water Resources Texas Comptroller of Public Accounts40 Regional Water Planning Population growth in the Austin metro region, surrounding suburban districts, and in the outlying retirement communities has greatly altered the population and water needs estimates. tered the population and water needs estimates. Region K will work with local entities, TWDB and others to produce new projections based on findings within the area. Cities and districts in Region K have indicated that they know little of the conservation mea- sures required of them. In response, the region will re-evaluate conservation and drought con- tingency strategies for each water user groups (WUG). In addition, there will be a review of significant climate changes to the area. Because of the changes Region K will be making to its water strategies, additional study is sug- gested on water availability, quality and cost. Ad- ditionally, the region will continue to encourage public participation in the planning process.83 Finally, the region has repeatedly recommended the following water segments be studied to po- tentially identify them as ecologically unique: the Barton Springs segment of the Edwards Aquifer, Bull Creek, the Colorado River (including Gor- man Creek and Shaws Bend), Cummins Creek, the Llano River, the Pedernales River, Rocky Creek and Hamilton Creek.84 Region K members have indicated frustration with the lack of policy action in response to their recommendations for these studies. Until the Legislature makes a decision, no further work will be performed on studies on these areas.85 In addition the Lower Colorado River Authority (LCRA) and San Antonio River System (SAWS) are partnering on a project that will produce 150,000 acre feet of water in 2060 at a capital cost of $21 million. This water management strategy originates in Region K but will meet water needs in both Region K and Region L. (For more information on this project see LCRA/ SAWS Water Project on pages 41 and 42.) Not all recommended strategies are being imple- mented. For example, Region K’s recommended strategy to desalinate brackish groundwater, estimated at $96.5 million, is not being pursued. Rather, municipalities are considering imple- menting this strategy in the future. However, a water reuse project for the city of Austin is cur- rently under way and on target, and is projected to provide the region with 33,537 additional acre-feet per year by 2060. According to the Texas Water Development Board, if the strategies listed above are not implemented, residents of Region K stand to lose $335 million in income and 4,480 full- and part- time jobs by 2010, and more than $4.3 billion in income and nearly 50,000 jobs by 2060. In addi- tion, state and local governments could lose $8 million in annual tax revenue by 2010 and about $248 million by 2060.82 Regional Challenges and Successes Population growth in the Austin metro region, surrounding suburban districts, and in the outlying retirement communities has greatly al- Exhibit 31 Lower Colorado Region (K) Water Management Strategies Description Capital Costs Water Gained in Acre-Feet Average Capital Cost per Acre-Feet Conservation $2,903,692 194,315 $15 Desalination 96,537,717 29,568 3,265 Groundwater 65,445,175 95,742 684 Surface Water 15,227,525 398,215 38 Water Reuse 178,059,959 144,090 1,236 Total $358,174,068 861,930 $416 Note: Capital cost figures do not include administrative, programmatic or other costs that may be required to implement water management strategies. Source: Texas Water Development Board.
  • 45.
    Texas Comptroller ofPublic Accounts Liquid Assets: The State of Texas’Water Resources 41 Regional Water Planning cost for providing the additional water for the region is more than $5.2 billion (Exhibit 33).87 Status of Major Water Projects and Strategies The Lower Colorado River Authority (LCRA)/San Antonio River System (SAWS) Water Project has the largest capital cost in Region L. The project is expected to generate a capital cost of $2.1 million and produce a gain in water by 150,000 acre-feet in 2060.88 On February 27, 2002, a definitive agree- ment between SAWS and LCRA was established to purchase up to 150,000 acre-feet per year of surface water from the Lower Colorado River Basin. The agreement was signed by LCRA and SAWS to collaborate on the water supply project. The agree- ment requires a six-year study period and then project implementation can occur if the project meets all legislative requirement and is financially, technically and environmentally feasible.89 South Central Texas Region (L) Region L, also known as the South Central Texas region, stretches from the Gulf Coast in Calhoun County and westward through South Central Texas. The region comprises 21 coun- ties and the cities of San Antonio, Victoria, San Marcos and New Braunfels (Exhibit 32). The area includes segments of nine rivers, the Guadalupe Estuary and San Antonio Bay. The Comal and San Marcos Springs, the two largest springs in Texas, are located in the region. The main economic sectors in the area are tourism, medical, military, service, manufacturing and retail trade.86 Strategies Used and Estimated Costs The South Central Texas Water Planning Group has recommended 26 water management strate- gies to meet the water needs of 2060. In all, the strategies would provide 732,779 acre-feet of ad- ditional water supply. The projected total capital Exhibit 32 South Central Texas Region (L) Frio Uvalde Dimmit Medina Hays Atascosa Wilson Refugio Kendall Caldwell Calhoun Nueces River San Antonio River Guadalupe River Cities Major rivers Region L Carrizo-Wilcox Aquifer (outcrop) Carrizo-Wilcox Aquifer (subsurface) Edwards (Balcones Fault Zone) Aquifer (outcrop) Edwards (Balcones Fault Zone) Aquifer (subsurface) Edwards-Trinity (Plateau) Aquifer Gulf Coast Aquifer Trinity Aquifer (outcrop) Trinity Aquifer (subsurface) Existing reservoirs *Minor aquifer (only shown where there is no major aquifer) Queen City Aquifer (outcrop)* Queen City Aquifer (subsurface)* Sparta Aquifer (outcrop)* Sparta Aquifer (subsurface)* Yegua-Jackson Aquifer* Ellenburger-San Saba Aquifer* Hickory Aquifer* Bexar LaSalle Zavala Dewitt Goliad Victoria Gonzales Karnes Comal Guadalupe Source: Texas Water Development Board.
  • 46.
    Liquid Assets: TheState of Texas’Water Resources Texas Comptroller of Public Accounts42 Regional Water Planning Aquifer Recharge subcommittee’s familiarity with developing better ways to recharge aquifers.94 The Regional Carrizo for Bexar County Supply and Regional Carrizo for Schertz-Seguin Local Government Corporation (SSLGC) strategies have been experiencing impediments in pro- ceeding with the project. The Regional Carrizo for Bexar County Supply strategy is defined as being a total of 62,588 acre-feet per year of Carrizo groundwater from four well fields in Gonzales, Wilson and Bexar Counties. The groundwater is delivered to SAWS Twin Oaks facility in southern Bexar County. The project includes 98 miles of raw water pipeline, 37 miles of treated water transmission pipeline, three raw water pump stations and expansion of a water treatment plant at Twin Oaks will accommodate increase in water demand. 95 However, the project has been unable to proceed due to contestation. The groundwater districts do not want water in their region to be drawn from the Carrizo and used in the City of San Antonio. A mediation process between the Gon- zales groundwater district and SAWS was held last year, but no resolution was reached.96 The Regional Carrizo for SSLGC Project Expan- sion is owned and operated by SSLGC and holds permits to pump 12,200 acre-feet per year of groundwater from Gonzales County’s Carrizo Aquifer. Schertz and Seguin will be the primary sites to receive the supply of water, and SSLGC Currently, the LCRA/SAWS Water Project is in the study phase, which started in mid-2004. Specifically, “the majority of the field studies for the off-channel storage facility and intake facili- ties have been completed.”90 The study phase is expected to be complete by mid-2009, and an implementation plan will be developed by March 2015 once the project meets the requirements in the Definitive Agreement.91 The studies in prog- ress focus on issues such as climate change analy- sis and underground water studies. In relation, House Bill 1629 passed by the Texas Legislature in 2001 authorized the LCRA-SAWS Water Project to proceed only in the case that it meets specific requirements to protect the Lower Colorado River basin. Therefore, the study is formed with an emphasis on meeting criteria set by the bill prior to devising a plan to implement the strategy.92 The Edwards Aquifer Recharge – type 2 project has a capital cost of $367.2 million and is expected to generate 21,577 acre-feet of water in 2060.93 Type 2 projects use recharge dams to catch water in dry streams or creek beds so that it can seep into an aquifer. Currently, studies are being con- ducted on recharge, recirculation and the recov- ery implementation program. The project has not yet entered the design and implementation phase. Presentations on previous recharge studies and the Barton Springs recharge project were con- ducted on October 16, 2008, and November 13, 2008. The presentations on the various recharge projects are expected to enhance the Edwards Exhibit 33 South Central Texas Region (L) Water Management Strategies Description Capital Costs Water Gained in Acre-Feet Average Capital Cost per Acre-Feet Conjunctive Use $2,481,042,000 177,177 $14,003 Conservation 0 109,927 0 Desalination 984,726,000 89,674 10,981 Groundwater 713,958,000 206,111 3,464 Surface Water 853,374,000 98,214 8,689 Water Reuse 189,308,000 51,676 3,663 Total $5,222,408,000 732,779 $7,127 Note: Capital cost figures do not include administrative, programmatic or other costs that may be required to implement water management strategies. Source: Texas Water Development Board.
  • 47.
    Texas Comptroller ofPublic Accounts Liquid Assets: The State of Texas’Water Resources 43 Regional Water Planning could lose $32 million in annual tax revenue by 2010 and about $335 million by 2060.100 Regional Challenges and Successes One of the major problems in the region is the lack of water for the growing population. There are ongoing issues such as the exporting of Carrizo-Wilcox Aquifer water from Gonzales and Wilson counties, the potential of temporary overdrafting of the Carrizo-Wilcox Aquifer, the revised Lower Guadalupe Water Supply Project and the over-reliance on the Edwards Aquifer.101 Rio Grande Region (M) Region M, also known as the Rio Grande region, is located along the southern tip of Texas and is adjacent to Mexico. The region includes Maverick, Webb, Zapata, Jim Hogg, Starr, Hidalgo, Willacy and Cameron counties, as well as the major cities of Laredo, Brownsville, Harlingen and McAllen (Exhibit 34). Major economic drivers in the re- gion include agriculture, trade, services, manu- facturing and hydrocarbon production.102 has signed contracts to supply 400 acre-feet per year of peaking water to the cities of Selma and Universal City.97 Currently, the project has not been able to move forward due to contestation. Permit applications have been submitted to the underground districts, but the next process is being delayed by the contested case hearing.98 The SAWS Recycled Water Program is hoping to reach additional customers by establishing north and south interconnections between two main legs of the current system and by extending existing lines. SAWS is currently working with legislative representatives in its area on possible legislation for the 81st Legislature to allow better reuse of water.99 According to the TWDB, if the strategies listed above are not implemented, residents of Region L face losses of $664 million in income and 10,200 full- and part-time jobs by 2010, nearly $5.5 billion in income and about 100,000 jobs by 2060. In addition, state and local governments Exhibit 34 Rio Grande Region (M) Webb Starr Hidalgo Zapata Maverick Jim Hogg Cameron Willacy Rio Grande Cities Major rivers Region M Carrizo-Wilcox Aquifer (outcrop) Carrizo-Wilcox Aquifer (subsurface) Gulf Coast Aquifer Yegua-Jackson Aquifer* Existing reservoirs *Minor aquifer (only shown where there is no major aquifer) Source: Texas Water Development Board.
  • 48.
    Liquid Assets: TheState of Texas’Water Resources Texas Comptroller of Public Accounts44 Regional Water Planning The long-term water supply for Region M will be available through operation of an on-channel reservoir and construction. The project will be located approximately four miles southeast of Brownsville and will provide opportunities for water conservation and management improvement in the lower Rio Grande. gain of 7,902 acre-feet in 2060.107 The project has completed a pilot study focusing on the technol- ogy associated with seawater desalination. Cur- rently, NRS Engineering is attempting to secure funding to start the demonstration scale project, which will answer questions not addressed in the pilot study in developing and building a full scale seawater desalination plant.108 The region is making a concerted effort to re- duce water usage in rural areas through several on-farm conservation strategies. Specifically, the region is currently implementing meth- ods such as low energy precision application and metering to help reduce the amount of water used on farms and ranches. In addition, from 2007, manufacturing clothes washers are required to be 35 percent more efficient than current standards.109 The Brownsville Weir and Reservoir strategy has a total capital cost of $66.5 million and is expected to produce 20,643 acre-feet of water in 2060.110 The project is set to capture and store excess river flows as a consistent water supply for lower Rio Grande Valley communities. The water supply for the region will be available through operation of an on-channel reservoir. The project will be located approximately four miles southeast of Brownsville and will provide opportunities for water conservation and man- agement improvement in the lower Rio Grande. Currently, the Brownsville Public Utility Board is collaborating with “the U.S. and Mexican Sections of International Boundary and Water Strategies Used and Estimated Costs To meet projected water demands in 2060, the Rio Grande Planning Group has assessed vari- ous water management strategies and their costs. The objective is to provide 807,587 acre-feet of additional water supply by 2060. The projected total capital cost is just more than $1 billion, the fourth largest amount among all regions in Texas. To achieve an increase of 601,127 acre-feet of total water supply by 2060, the region will use a number of strategies including conservation, desalination, groundwater, surface water and water reuse (Exhibit 35).103 Status of Major Water Projects and Strategies Brackish groundwater desalination has the larg- est capital costs in Region M. Reverse osmosis (RO) is the most common method used in de- salination of brackish groundwater. A majority of the current or proposed full-scale RO systems will use drainage ditch discharge, which will ultimately discharge into the Gulf of Mexico or Laguna Madre.104 NRS Consulting Engineers has completed the construction of seven regional brackish groundwater facilities and there are various brackish groundwater desalination proj- ects in progress as well.105 Some of the regional facilities under construction are in the Valley municipal water district and City of Primera. Plants are also being built for the North Alamo Water Supply Corporation.106 The Seawater Desalination project will require a capital cost of nearly $16 million and a water Exhibit 35 Rio Grande Region (M) Water Management Strategies Description Capital Costs Water Gained in Acre-Feet Average Capital Cost per Acre-Feet Conservation $334,173,100 462,423 $723 Desalination 358,414,525 77,864 4,603 Groundwater 43,982,595 31,416 1,400 Surface Water 297,162,982 190,103 1,563 Water Reuse 52,389,226 45,781 1,144 Total $1,086,122,428 807,587 $1,345 Note: Capital cost figures do not include administrative, programmatic or other costs that may be required to implement water management strategies. Source: Texas Water Development Board.
  • 49.
    Texas Comptroller ofPublic Accounts Liquid Assets: The State of Texas’Water Resources 45 Regional Water Planning the required water under the treaty and no debt currently existed, according to the International Boundary and Water Commission, the interna- tional body that manages the agreement.115 Overall, water supply in the region is scarce, and more diversity in water sources is needed. Addi- tionally, funds from TWDB and federal programs for irrigation conservation have not been suffi- ciently available causing difficulty in successfully implementing irrigation conservation strategies.116 NRS Engineers on behalf of the Brownsville Pub- lic Utility Board (PUB) has completed a seawater desalination pilot study that will be published in January of 2009. The purpose of the study is to look at cost effective approaches in developing a full scale seawater desalination plant.117 Coastal Bend Region (N) Located in south Texas, Region N (also known as the Coastal Bend region), covers 11 counties and part of the Nueces River Basin and the Nueces Estuary. The largest cities in the region are Cor- pus Christi, Portland, Kingsville, Beeville, Alice and Robstown (Exhibit 36).118 The largest regional water provider, the City of Corpus Christi, sells water to the South Texas Water Authority and San Patricio Municipal Water District.119 The Commissions, City of Matamoros, Tamaulipas and Comision Nacional del Agua to develop bi- national efforts to construct the Project on the Rio Grande.”111 According to the TWDB, if the strategies listed above are not implemented, residents of Region M face losses of $164 million in income and 3,610 full- and part-time jobs by 2010, and more than $2 billion in income and nearly 26,900 jobs by 2060. In addition, state and local governments could lose $5 million in annual tax revenue by 2010 and about $76 million by 2060.112 Regional Challenges and Successes There is concern for the reliability of Mexico’s inflows into the International Amistad-Falcon Reservoir system and the supply of water that is needed for water rights downstream at points of diversion and usage. Throughout the years, Mex- ico has often accumulated water debts to the U.S. in violation of the 1944 Treaty.113 In 1944, Mexico and the US signed a treaty about waters of certain international rivers, including the Colorado River.114 The lack of surface water from Mexico will decrease the supply available to sustain the area’s immense population growth. As of Novem- ber 2008, however, Mexico had delivered all of Duval Bee Kenedy Brooks McMullen Kleberg Nueces San Patricio Aransas Nueces River Cities Major rivers Region N Carrizo-Wilcox Aquifer (subsurface) Gulf Coast Aquifer Yegua-Jackson Aquifer* Existing reservoirs *Minor aquifer (only shown where there is no major aquifer) Jim Wells Live Oak Source: Texas Water Development Board. Exhibit 36 Coastal Bend Region (N)
  • 50.
    Liquid Assets: TheState of Texas’Water Resources Texas Comptroller of Public Accounts46 Regional Water Planning Region N is working with the U.S. Army Corps of Engineers, the adjoining South Texas Region and other agencies to devise joint water management strategies. The region has been successful in planning for water needs in the region, with available supplies projected to meet water demands through at least 2035. now be redirected to other cost-effective water management strategies. Continued study will include the benefits of an off-channel reservoir, a storage reservoir in a lowland area, to accu- mulate additional water when supplies exceed capacity. Because the off-channel storage would be smaller and in a lowland area compared to the lake, it would minimize evaporation. HDR continues to assess the cost estimate and benefits of this water management strategy.122 Groundwater supplies will be enhanced by a new well field in western Refugio County over the Gulf Coast Aquifer to provide water during peak agricultural times. According to the TWDB, if the strategies listed above are not implemented, the region could lose $22 million in income and 230 full- and part- time jobs by 2010. By 2060, the cost could be about $3.2 billion in income and nearly 36,800 jobs. In addition, state and local governments could lose $3 million in annual tax revenue by 2010 and about $233 million by 2060.123 Regional Challenges and Successes The region has been a leader in water planning for years. For instance, the Mary Rhodes Pipe- line was completed in 1998 to transport water from Lake Texana to the City of Corpus Christi via an interbasin transfer permit. The pipeline can transport twice the volume of water under current supply contracts.124 The region is work- ing with the U.S. Army Corps of Engineers, the adjoining South Texas Region and other major industries in the region are service, govern- ment, retail trade and petrochemical. Strategies Used and Estimated Costs Implementing the recommended water man- agement strategies in the Coastal Bend Region would provide an additional 149,496 acre-feet of water in 2060 at a total capital cost of $789.5 mil- lion, most of which would develop surface water sources (Exhibit 37).120 Status of Major Water Projects and Strategies To enhance surface supplies, the City of Corpus Christi is planning for a major seawater desalina- tion plant to increase water for municipal users. According to the City of Corpus Christi water department, a feasibility study has been com- pleted on the desalination project. At this time, the project is not economically feasible and will remain on hold until it becomes a necessity.121 The city also bought 35,000 acre-feet per year from the Colorado River-based Garwood Irriga- tion Company that will be used for irrigation, as well as industrial and municipal purposes. Currently, HDR Engineering Inc. is partnering with the Nueces River Authority on a chan- nel loss study on the surface and groundwater moving between the Choke Canyon Reservoir to Lake Corpus Christi. Data revealed that little or no water is actually lost during transport between the reservoir and the lake, eliminat- ing the need to build the $105 million pipeline detailed in the previous plan. The funds can Exhibit 37 Coastal Bend Region (N) Water Management Strategies Description Capital Costs Water Gained in Acre-Feet Average Capital Cost per Acre-Feet Conservation $0 6,891 $0 Desalination 248,919,000 18,200 13,676 Groundwater 48,338,000 20,535 2,354 Surface Water 490,758,000 103,620 4,736 Water Reuse 1,500,000 250 6,000 Total $789,515,000 149,496 $5,281 Note: The conservation efforts for mining in Region N that contribute to the region’s overall water gain from conservation have highly variable costs per acre-foot and were not included in the overall average cost per acre-foot for that category. Capital cost figures do not include administrative, programmatic or other costs that may be required to implement water management strategies. Source: Texas Water Development Board.
  • 51.
    Texas Comptroller ofPublic Accounts Liquid Assets: The State of Texas’Water Resources 47 Regional Water Planning Strategies Used and Estimated Costs In order to meet the region’s projected water demands in 2060, the Llano Estacado Planning Group recommended 13 water management strategies to address most future water needs. In all, the strategies would provide 441,511 acre-feet of additional water supply by 2060, with total projected capital costs exceeding $818.6 million. The region’s water management strategies fall into four general categories: irrigation conservation, groundwater development, brackish groundwater desalination, and infrastructure connecting Lub- bock to the Alan Henry reservoir (Exhibit 39).126 Status of Major Water Projects and Strategies The state has committed nearly $23 million toward the construction of a pipeline from Lake Alan Henry to the city of Lubbock. Currently, the project is in the design and testing phase, with completion of the pipeline scheduled for 2012. The project includes 50 miles of pipeline, 3 pumping stations, and a treatment plant for distribution within the city of Lubbock. agencies to devise joint water management strategies. The Coastal Bend Region has been successful in planning for water needs in the region, with available supplies projected to meet water demands through at least 2035.125 Llano Estacado Region (O) Located in the Southern High Plains region of the Texas Panhandle, Region O, also known as the Llano Estacado region, includes 21 coun- ties, bounded on the north by Deaf Smith County, Motley and Dickens counties to the east, Gaines and Dawson counties to the south, and New Mexico on the western edge (Exhibit 38). Small portions of the Canadian, Red, Brazos and Colorado rivers are located in the area, although almost no surface water leaves the region. Instead, surface water is captured by nearly 14,000 playa basins, which are natural water collecting pools. Major industries in the region include livestock and cotton production. Major cities in the region include Lubbock, Brownfield, Plainview and Hereford. Exhibit 38 Llano Estacado Region (O) Hale Gaines Lynn Lamb Floyd Terry Motley Garza Castro Bailey Deaf Smith Crosby Briscoe Parmer Hockley Dickens Swisher Dawson Lubbock Yoakum Cochran Cities Major rivers Region O Ogallala Aquifer Seymour Aquifer Blaine Aquifer* Dockum Aquifer* Edwards-Trinity (High Plains) Aquifer* Existing reservoirs *Minor aquifer (only shown where there is no major aquifer) Prairie Dog Town Fork of the Red River Colorado River Source: Texas Water Development Board.
  • 52.
    Liquid Assets: TheState of Texas’Water Resources Texas Comptroller of Public Accounts48 Regional Water Planning aquifer in 1995 and 2000, due to drought condi- tions and unusually high demand. Furthermore, some of the region’s counties assumed that up to 80 percent of aquifer capacity in their area will remain in storage through 2060, rather than factoring into supply and demand estimates. The region believes that water supply and demand could be more accurately modeled using more complete data. Also, the region recommends a variety of conservation practices that would contribute to recharge efforts, notably vegetation control efforts in lake watershed districts, as well as efforts to improve irrigation.129 Lavaca Region (P) Region P, also known as the Lavaca Region, comprises Jackson and Lavaca counties, as well as the southwest portion of Wharton County. The region contains the cities of Edna, El Campo and Halletsville. The Lavaca River is the region’s main source of surface water, while the Gulf Coast Aquifer provides groundwater. Main industries in the region include agribusiness, mineral production, oil and gas production and manufacturing (Exhibit 40).130 Strategies Used and Estimated Costs The Lavaca region has only one strategy and it falls under the groundwater category. The strategy would provide 32,468 acre-feet of addi- tional water supply by 2060, with no projected capital costs.131 Region O also plans to amend the state water plan with one major reduction and various addi- tions. The region no longer plans to develop the reservoir Canyon Lake 8 and is working with the TWDB to remove the project. Instead, the City of Lubbock plans to purchase and develop Post Res- ervoir from the City of Post in exchange for water rights. Infrastructure from the Lake Alan Henry pipeline will transport and treat water from this reservoir. Lubbock is also negotiating with the Brazos River Authority to designate water from playa basins as city water. This water would reach Lubbock through the Lake Alan Henry pipeline after a diversion from North Fork. The state plan must be amended to include these additions.127 According to the TWDB, if the strategies listed above are not implemented, the region could lose $103 million in income and over 4,400 full- and part-time jobs by 2010. By 2060, the cost could be about $387 million in income and nearly 13,700 jobs. In addition, state and local governments could lose $10 million in annual tax revenue by 2010 and about $32 million by 2060.128 Regional Challenges and Successes Due to heavy reliance on groundwater from the Ogallala Aquifer, the region’s main concern is the accurate measurement of groundwater avail- ability. New modeling of the Ogallala’s water capacity suggests that the aquifer has greater recharge capacity than was reported for pur- poses of state and regional water planning. The planning group claims that original modeling was based on incomplete starting volumes of the Exhibit 39 Llano Estacado Region (O) Water Management Strategies Description Capital Costs Water Gained in Acre-Feet Average Capital Cost per Acre-Feet Conservation $353,510,000 337,790 $1,047 Desalination 10,051,230 3,360 2,991 Groundwater 43,986,161 50,421 872 Reuse 29,746,680 2,240 13,280 Surface Water 381,336,000 47,700 7,995 Total $818,630,071 441,511 $1,854 Note: Capital cost figures do not include administrative, programmatic or other costs that may be required to implement water management strategies. Source: Texas Water Development Board.
  • 53.
    Texas Comptroller ofPublic Accounts Liquid Assets: The State of Texas’Water Resources 49 Regional Water Planning Regional Challenges and Successes The Lavaca Region has 76,000 acres of irrigated farmland, with three-fourths solely in rice produc- tion. The planning group educates citizens on rice returns and futures. The area is crucial to national rice output. Any increase in production could result in a higher demand for groundwater. The region works to ensure adequate supply for rice farming and has successfully developed its own numbers and methodology to arrive at future plans recognized by the TWDB. Regional planners say they are prepared for drought conditions based on past experience and future planning.134 Status of Major Water Projects and Strategies The Lavaca Region investigated several drought-related strategies for the area. The region’s original plan called for three separate strategies. However, since the release of the plan, the region has combined the two over- drafting strategies from Jackson and Wharton counties. Temporary overdrafting of the Gulf Coast Aquifer, which was found to be economi- cally feasible, could provide adequate water for citizens and businesses. While the current im- plementation schedule of the region’s strategy is scheduled to begin in 2010 and provide 32,468 acre-feet by 2060 for agriculture, implementa- tion on the project will not begin until drought conditions exist (Exhibit 41).132 According to the TWDB, if the strategy listed above is not implemented, Region P residents face losses of $3 million in income and 120 full- and part-time jobs from 2010 through 2060. In addition, state and local governments could lose $300,000 in tax annual revenue from 2010 through 2060.133 Lavaca Wharton Jackson Lavaca River Cities Major rivers Region P Gulf Coast Aquifer Existing reservoirs Exhibit 41 Lavaca Region (P) Water Management Strategies Description Capital Costs Water Gained in Acre-Feet Average Capital Cost per Acre-Feet Groundwater $0 31,979 $0 Surface Water $0 489 0 Total $0 32,468 $0 Note: Capital cost figures do not include administrative, programmatic or other costs that may be required to implement water management strategies. Source: Texas Water Development Board. Source: Texas Water Development Board. Exhibit 40 Lavaca Region (P)
  • 54.
    Liquid Assets: TheState of Texas’Water Resources Texas Comptroller of Public Accounts50 Regional Water Planning 12 Texas Water Development Board, Water for Texas 2007, Volume II, p. 333. 13 Texas Water Development Board, Water for Texas 2007 (Austin, Texas, January 2007), Volume II, pp. 20-22, http://www.twdb.state.tx.us/publications/ reports/State_Water_Plan/2007/2007StateWaterPlan/ CHAPTER%202%20regional%20B%20 FINAL_113006.pdf. (Last visited December 31, 2008.) 14 Interview with Curtis Campbell, chairman, Region B Water Planning Group, Wichita Falls, Texas, November 5, 2008. 15 Texas Water Development Board, Water for Texas 2007, Volume II, p. 251. 16 Texas Water Development Board, Water for Texas 2007 (Austin, Texas, January 2007), Volume II, pp. 25-30, 333, 335-337, http://www.twdb. state.tx.us/publications/reports/State_Water_ Plan/2007/2007StateWaterPlan/CHAPTER%202_ Regional%20C%20FINAL_112706.pdf and http:// www.twdb.state.tx.us/publications/reports/State_ Water_Plan/2007/2007StateWaterPlan/APP%202.1_ final%20112906.pdf. (Last visited January 2, 2009.) 17 Data provided by Wendy Barron, team lead, Water Supply & Strategy Analysis, Texas Water Development Board, November 4, 2008; and Region C Water Planning Group, 2006 Region C Water Plan: Executive Summary (Grand Prairie, Texas, January 2006), p. ES-10, http:// www.twdb.state.tx.us/rwpg/2006_RWP/RegionC/ Executive%20Summary/EXECUTIVE_SUMMARY- final.pdf. (Last visited December 31, 2008.) 18 Texas S.B. 3, 80th Leg., Reg. Session (2007), Section 4.04, “Study Commission on Region C Water Supply,” pp. 86-89, http://www.capitol.state.tx.us/tlodocs/80R/ billtext/pdf/SB00003F.pdf. (Last visited January 1, 2009.) 19 Data provided by Wendy Barron, team lead, Water Supply & Strategy Analysis, Texas Water Development Board; and Interview with Mike Rickman, assistant general manager, North Texas Municipal Water District, Wylie, Texas, November 20, 2008. 20 Region C Water Planning Group, 2006 Region C Water Plan (Grand Prairie, Texas, December 2005), pp. 4D.1-2, 4D.9, 4D.16-17, http://www.twdb.state.tx.us/ rwpg/2006_RWP/RegionC/Chapter%204/Chapter%20 4D-final.pdf. (Last visited January 1, 2009.) 21 Region C Water Planning Group, 2006 Region C Water Plan (Grand Prairie, Texas, December 2005), pp. 4D.17-18, 4D.13-14, http://www.twdb.state. tx.us/rwpg/2006_RWP/RegionC/Chapter%204/ Chapter%204D-final.pdf. (Last visited January 1, 2009.) ; and Interview with Charlie Stringer, assistant general manager, Dallas Water Utilities, Dallas, Texas, November 21, 2008. 22 Region C Water Planning Group, 2006 Region C Water Plan (Grand Prairie, Texas, December 2005), pp. 4D.11-13, http://www.twdb.state.tx.us/rwpg/2006_ RWP/RegionC/Chapter%204/Chapter%204D-final. pdf. (Last visited January 1, 2009.) Endnotes 1 Texas Water Development Board, Water for Texas 2007 (Austin, Texas, January 2007), Volume II, p. 2, http://www.twdb.state.tx.us/publications/reports/ State_Water_Plan/2007/2007StateWaterPlan/ CHAPTER%201%20FINAL%20113006.pdf. (Last visited December 30, 2008.) 2 Region O Regional Water Planning Group, “Appendix D: Overview of the Methodology Used by the Texas Water Development Board to Estimate Social and Economic Impacts of Not Meeting Projected Water Needs,” in Texas Water Development Board Preliminary Report to Region O RWPG (Austin, Texas, August 8, 2000) pp. 8-9, www.twdb.state.tx.us/rwp/o/ Submitted_Files/Appendix/Appendix%20D.doc. (Last visited December 30, 2008.) 3 Texas Water Development Board, Water for Texas 2007 (Austin, Texas, January 2007), Volume II, pp. 38 and 132, http://www.twdb.state.tx.us/publications/ reports/State_Water_Plan/2007/2007StateWaterPlan/ CHAPTER%202_REGIONAL%20E%20final_112706. pdf and http://www.twdb.state.tx.us/publications/ reports/State_Water_Plan/2007/2007StateWaterPlan/ CHAPTER%205_final%20112906.pdf. (Last visited December 30, 2008.) 4 Alicia A. Caldwell, “El Paso Desalination Plant Opens with High Expectations,” The Associated Press State & Local Wire (August 9, 2007), pp.1-2. (Nexis document.) 5 Texas Water Development Board, Water for Texas 2007 (Austin, Texas, January 2007), Volume II, p. 201, http://www.twdb.state.tx.us/publications/ reports/State_Water_Plan/2007/2007StateWaterPlan/ CHAPTER%207%20FINAL_112906.pdf. (Last visited December 30, 2008.) 6 El Paso Water Utilities, “Setting the Stage for the Future,” pp. 1-3, http://www.epwu.org/water/desal_ info.html (Last visited December 30, 2008.) 7 Texas Water Development Board, Water for Texas 2007 (Austin, Texas, January 2007), Volume II, pp. 13-16, http://www.twdb.state.tx.us/publications/ reports/State_Water_Plan/2007/2007StateWaterPlan/ CHAPTER%202_REGIONAL%20A%20final_112906. pdf. (Last visited December 30, 2008.) 8 Texas Water Development Board, Water for Texas 2007, Volume II, pp. 13-16. 9 Texas Water Development Board, Water for Texas 2007 (Austin, Texas, January 2007), Volume II, pp. 333-334, http://www.twdb.state.tx.us/publications/ reports/State_Water_Plan/2007/2007StateWaterPlan/ APP%202.1_final%20112906.pdf. (Last visited December 30, 2008.) 10 Texas Water Development Board, Water for Texas 2007 (Austin, Texas, January 2007), Volume II, p. 251. http:// www.twdb.state.tx.us/publications/reports/State_ Water_Plan/2007/2007StateWaterPlan/CHAPTER%20 9_112806.indd.pdf. (Last visited December 30, 2008.) 11 Interview with C.E. Williams, chairman, Panhandle Water Planning Group, Amarillo, Texas, November 4, 2008.
  • 55.
    Texas Comptroller ofPublic Accounts Liquid Assets: The State of Texas’Water Resources 51 Regional Water Planning 40 Far West Texas Water Planning Group, Far West Texas Water Plan (El Paso, Texas, January 2006), p. 4-14, http:// www.twdb.state.tx.us/rwpg/2006_RWP/RegionE/ Complete_Text.pdf. (Last visited January 1, 2009.) 41 Texas Water Development Board, “2006 Water Use Survey Summary Estimates by City: Draft,” http:// www.twdb.state.tx.us/wrpi/wus/2006est/2006City.xls. (Last visited January 1, 2009.) (Excel file.) ; and Far West Texas Water Planning Group, Far West Texas Water Plan, p. 4-14. 42 Far West Texas Water Planning Group, Far West Texas Water Plan, p. 4-14. 43 El Paso Water Utilities, “Water: Setting the Stage for the Future,” p. 1, http://www.epwu.org/water/desal_ info.html. (Last visited January 1, 2009.) 44 Texas Water Development Board, Water for Texas 2007 (Austin, Texas, January 2007), Volume II, pp. 43-46, http://www.twdb.state.tx.us/publications/ reports/State_Water_Plan/2007/2007StateWaterPlan/ CHAPTER%202_REGIONAL%20F_FINAL%20 112706.pdf. (Last visited January 1, 2009.) 45 Region F Water Planning Group, “Identification, Evaluation, and Selection of Water Management Strategies Based on Needs,” in Region F Water Plan by Freese and Nichols, Inc., LBG-Guyton Associates, Inc., and Alan Plummer Associates, Inc. (Big Spring, Texas, January 2006), p. 4-1, http://www.twdb.state. tx.us/rwpg/2006_RWP/RegionF/pdf/Region%20 F%20Chapter%204.pdf. (Last visited January 1, 2009.) (Consultant’s report.) 46 Region F Water Planning Group, “Identification, Evaluation, and Selection of Water Management Strategies Based on Needs,” in Region F Water Plan by Freese and Nichols, Inc., LBG-Guyton Associates, Inc., and Alan Plummer Associates, Inc. (Big Spring, Texas, January 2006), pp. 4-213-218, http://www.twdb. state.tx.us/rwpg/2006_RWP/RegionF/pdf/Region%20 F%20Chapter%204.pdf. (Last visited January 1, 2009.) (Consultant’s report.) 47 Region F Water Planning Group, “Identification, Evaluation, and Selection of Water Management Strategies Based on Needs,” in Region F Water Plan by Freese and Nichols, Inc., LBG-Guyton Associates, Inc., and Alan Plummer Associates, Inc. (Big Spring, Texas, January 2006), pp. 4-218-228, http://www.twdb. state.tx.us/rwpg/2006_RWP/RegionF/pdf/Region%20 F%20Chapter%204.pdf. (Last visited January 1, 2009.) (Consultant’s report.) 48 Interview with Selena Hemmeter, city secretary and administrator, City of Eden, Eden, Texas, November 20, 2008. 49 Texas Water Development Board, Water for Texas 2007, Volume II, p. 251. 50 Region F Water Planning Group, “Unique Stream Segments/Reservoir Sites/Legislative Recommendations,” in Region F Water Plan by Freese and Nichols, Inc., LBG-Guyton Associates, Inc., and Alan Plummer Associates, Inc. (Big Spring, Texas, January 2006), pp. 8-13-14, http://www.twdb.state. 23 Data provided by Wendy Barron, team lead, Water Supply & Strategy Analysis, Texas Water Development Board; and Interview with Charlie Stringer, assistant general manager, Dallas Water Utilities; and Interview with Darrel Andrews, water quality manager, Tarrant Regional Water District, Fort Worth, Texas, November 18, 2008. 24 Data provided by Wendy Barron, team lead, Water Supply & Strategy Analysis, Texas Water Development Board; and Interview with Darrel Andrews, water quality manager, Tarrant Regional Water District. 25 Interview with Mike Rickman, assistant general manager, North Texas Municipal Water District. 26 Texas Water Development Board, Water for Texas 2007, Volume II, p. 251. 27 Letter from James M. Parks, chairman, Region C Water Planning Group, October 13, 2008. 28 Texas Water Development Board, Water for Texas 2007 (Austin, Texas, January 2007), Volume II, p. 337, http://www.twdb.state.tx.us/publications/reports/ State_Water_Plan/2007/2007StateWaterPlan/APP%20 2.1_final%20112906.pdf. (Last visited January 1, 2009.) 29 Interview with Stan Hayes, president, Hayes Engineering, Longview, Texas, November 19, 2008. 30 Interview with Walt Sears, executive director, North East Texas Regional Water Planning Group, Hughes Springs, Texas, November 19, 2008. 31 Texas Water Development Board, Water for Texas 2007, Volume II, p. 251. 32 Interview with Jim Thompson, chairman, North East Texas Regional Water Planning Group, Atlanta, Texas, October 31, 2008. 33 Texas Water Development Board, Water for Texas 2007 (Austin, Texas, January 2007), Volume II, pp. 37-40, http://www.twdb.state.tx.us/publications/ reports/State_Water_Plan/2007/2007StateWaterPlan/ CHAPTER%202_REGIONAL%20E%20final_112706. pdf. (Last visited January 1, 2009.) 34 Far West Texas Water Planning Group, Far West Texas Water Plan (El Paso, Texas, January 2006), p. 4-10, http://www.twdb.state.tx.us/rwpg/2006_RWP/ RegionE/Complete_Text.pdf. (Last visited January 1, 2009.) 35 Texas Water Development Board, Water for Texas 2007, Volume II, pp. 337-338. 36 Far West Texas Water Planning Group, Far West Texas Water Plan (El Paso, Texas, January 2006), p. 4-20, http://www.twdb.state.tx.us/rwpg/2006_RWP/ RegionE/Complete_Text.pdf. (Last visited January 1, 2009.) 37 Data provided by Stuart Norvell, manager, Water Resources Planning Division, Texas Water Development Board, Austin, Texas, November 19, 2008. 38 Interview with Bill Hutchison, manager, Water Resources Division, El Paso Water Utilities, El Paso, Texas, November 20, 2008. 39 Texas Water Development Board, Water for Texas 2007, Volume II, p. 251.
  • 56.
    Liquid Assets: TheState of Texas’Water Resources Texas Comptroller of Public Accounts52 Regional Water Planning 67 Letter from Mark Evans, vice-chair, Region H Water Planning Group. 68 Texas Water Development Board, Water for Texas 2007 (Austin, Texas, January 2007), Volume II, pp. 61-66, http://www.twdb.state.tx.us/publications/ reports/State_Water_Plan/2007/2007StateWaterPlan/ CHAPTER%202_REGIONAL%20I_FINAL%20 112706.pdf. (Last visited January 2, 2009.) 69 Email communication from Kenneth Reneau, general manager of the Angelina & Neches River Authority. Lufkin, Texas, November 20, 2008. 70 Texas Water Development Board, Water for Texas 2007, Volume II, p. 251. 71 Interview with Kelley Holcomb, chair, East Texas Region I Water Planning Group, Lufkin, Texas, November 4, 2008. 72 Interview with Kelley Holcomb, chair, East Texas Region I Water Planning Group. 73 Texas Water Development Board, Water for Texas 2007 (Austin, Texas, January 2007), Volume II, pp. 67-72, 342, http:// www.twdb.state.tx.us/publications/ reports/State_Water_Plan/2007/2007StateWaterPlan/ CHAPTER%202_REGIONAL%20J_FINAL_112706. pdf. and http://www.twdb.state.tx.us/publications/ reports/State_Water_Plan/2007/2007StateWaterPlan/ APP%202.1_final%20112906.pdf. (Last visited January 2, 2009.) 74 Interview with Charlie Hastings, director of Public Works, City of Kerrville, Kerrville, Texas, November 20, 2008. 75 Interview with Johnathan Letz, Kerr County commissioner and chairman of the Plateau Region J Water Planning Group, Kerrville, Texas, November 13, 2008. 76 Texas Water Development Board, Water for Texas 2007, Volume II, p. 251. 77 Interview with Johnathan Letz, Kerr County commissioner and chairman of the Plateau Region J Water Planning Group. 78 Texas Water Development Board, Water for Texas 2007 (Austin, Texas, January 2007), Volume II, p. 73, http://www.twdb.state.tx.us/publications/ reports/state_Water_Plan/2007/2007StateWaterPlan/ CHAPTER%202_REGIONAL%20K%20FINAL%20 112706.pdf. (Last visited January 2, 2009.) 79 Texas Water Development Board, Water for Texas 2007, Volume II, pp. 342-344. 80 Texas Water Development Board, Water for Texas 2007 (Austin, Texas, January, 2007), Volume II, pp. 73-78, http://www.twdb.state.tx.us/publications/ reports/State_Water_Plan/2007/2007StateWaterPlan/ CHAPTER%202_REGIONAL%20K%20FINAL%20 112706.pdf. (Last visited January 2, 2009.); and interview with John Burke, chairman, Region K: The Lower Colorado Water Planning Group, Bastrop, Texas, November 19, 2008. 81 Lower Colorado Regional Water Planning Group, Region K-2011 Plan, Draft Scope of Work: Lower Colorado Regional Water Planning Area (Austin, tx.us/rwpg/2006_RWP/RegionF/pdf/Region%20F%20 Chapters%205-10.pdf. (Last visited January 2, 2009.) (Consultant’s report.); and Texas Water Development Board, Water for Texas 2007, Volume II, pp. 43-48. 51 Texas Water Development Board, Water for Texas 2007 (Austin, Texas, January 2007), Volume II, pp. 49-52, http://www.twdb.state.tx.us/publications/ reports/State_Water_Plan/2007/2007StateWaterPlan/ CHAPTER%202%20regional%20G%20 FINAL_112806.pdf. (Last visited January 2, 2009.) 52 Texas Water Development Board, Water for Texas 2007, Volume II, p. 52. 53 Brazos G Regional Water Planning Group, “Exhibit C: Scope of Work (Extracted from the TWDB / BRA Final Contract signed 5/17/07),” pp. 1-2, http://www. brazosgwater.org/fileadmin/brazosg_upload/2011_ brazosg_water_plan/Brazos_G_Scope_of_Work_ approved_051707.pdf. (Last visited January 2, 2009.) 54 Interview with Eddie Brown, city manager, City of Sweetwater, Sweetwater, Texas, November 20, 2008. 55 Brazos G Regional Water Planning Group, “Exhibit C: Scope of Work (Extracted from the TWDB / BRA Final Contract signed 5/17/07),” pp. 3-5, http://www. brazosgwater.org/fileadmin/brazosg_upload/2011_ brazosg_water_plan/Brazos_G_Scope_of_Work_ approved_051707.pdf. (Last visited January 2, 2009.) 56 Data provided by Wendy Barron, team lead, Water Supply & Strategy Analysis, Texas Water Development Board. 57 Interview with Michael Thane, utilities director, City of Round Rock, Round Rock, Texas, November 20, 2008. 58 Brazos G Regional Water Planning Group, “Exhibit C: Scope of Work (Extracted from the TWDB / BRA Final Contract signed 5/17/07),” pp. 5-7. 59 Texas Water Development Board, Water for Texas 2007, Volume II, p. 251. 60 Email communication from Trey Buzbee, administrative assistant, Brazos G Regional Water Planning Group, Waco, Texas, October 20, 2008. 61 Texas Water Development Board, Water for Texas 2007 (Austin, Texas, January 2007) Volume II, pp. 55-60, http://www.twdb.state.tx.us/publications/ reports/State_Water_Plan/2007/2007StateWaterPlan/ CHAPTER%202_REGIONAL%20H_FINAL%20 112706.pdf. and pp. 340-341, http://www.twdb. state.tx.us/publications/reports/State_Water_ Plan/2007/2007StateWaterPlan/APP%202.1_final%20 112906.pdf. (Last visited January 2, 2009.) 62 Letter from Mark Evans, vice-chair, Region H Water Planning Group, October 24, 2008. 63 Data provided by Stuart Norvell, manager, Water Resources Planning Division, Texas Water Development Board. 64 Letter from Mark Evans, vice-chair, Region H Water Planning Group. 65 Texas Water Development Board, Water for Texas 2007, Volume II, p. 251. 66 Texas Water Development Board, Water for Texas 2007, Volume II, p. 58.
  • 57.
    Texas Comptroller ofPublic Accounts Liquid Assets: The State of Texas’Water Resources 53 Regional Water Planning Volume II, p. 4C.14-0, http://www.regionltexas.org/ documents/2006rwp/vol2/Section_4C.14Regional_ Carrizo_to_Bexar_County.pdf. (Last visited January 3, 2009.) (Consultant’s report.) 96 Interview with Donovan Burton, manager of Legislative Affairs, San Antonio Water Supply, San Antonio, Texas, November 20, 2008. 97 South Central Texas Regional Water Planning Group with San Antonio River Authority, South Central Texas Regional Water Planning Area: 2006 Regional Water Plan, by HDR Engineering, Inc., Margaret Dalthorp, Paul Price Associates, Inc., and John Folk-Williams, Sr. (Austin, Texas, January 2006), Volume II, p. 4C.15-1, http://www.regionltexas.org/documents/2006rwp/vol2/ Section_4C.15Regional_Carrizo_for%20SSLGC.pdf. (Last visited January 3, 2009.) (Consultant’s report.) 98 Interview with Alan Cockerell, general manager, Schertz-Seguin Local Government Corporation, Seguin, Texas, November 20, 2008. 99 Interview with Donovan Burton, manager of Legislative Affairs, San Antonio Water System. 100 Texas Water Development Board, Water for Texas 2007, Volume II, p. 251. 101 Texas Water Development Board, Water for Texas 2007 (Austin, Texas, January 2007) Volume II, p. 82, http://www.twdb.state.tx.us/publications/reports/ State_Water_Plan/2007/2007StateWaterPlan/ CHAPTER%202_REGIONAL%20L%20FINAL%20 112706.pdf. (Last visited January 3, 2009.) 102 Texas Water Development Board, Water for Texas 2007 (Austin, Texas, January 2007) Volume II, p. 85, http://www.twdb.state.tx.us/publications/reports/ State_Water_Plan/2007/2007StateWaterPlan/ CHAPTER%202_REGIONAL%20M_FINAL%20 112706.pdf. (Last visited January 3, 2009.) 103 Texas Water Development Board, Water for Texas 2007 (Austin, Texas, January 2007) Volume II, p. 88, http://www.twdb.state.tx.us/publications/reports/ State_Water_Plan/2007/2007StateWaterPlan/ CHAPTER%202_REGIONAL%20M_FINAL%20 112706.pdf. (Last visited January 3, 2009.) 104 Rio Grande Regional Water Planning Group, Region M Regional Water Plan, by NRS Consulting Engineers, R.J. Brandes Company, LBG-Guyton Associates, Fernandez Group, Inc., Texas Agricultural Experiment Station, and Texas Cooperative Extension (Harlingen, Texas, January 2006), pp. 4-53-54, http://www.riograndewaterplan.org/downloads/ waterplan2006/ch04-identevalselect.pdf. (Last visited January 3, 2009.) (Consultant’s report.) 105 Interview with Jake White, director of Special Projects, NRS Consulting Engineers, Harlingen, Texas, November 20, 2008. 106 Interview with Bill Norris, principal engineer, NRS Consulting Engineers, Harlingen, Texas, November 24, 2008. 107 Texas Water Development Board, Water for Texas 2007 (Austin, Texas, January 2007) Volume II, p. 346, http://www.twdb.state.tx.us/publications/reports/ Texas), http://www.regionk.org/RegionK_2011Plan_ DraftSOW.pdf. (Last visited January 2, 2009.) 82 Texas Water Development Board, Water for Texas 2007, Volume II, p. 251. 83 Lower Colorado Regional Water Planning Group, Region K-2011 Plan, Draft Scope of Work: Lower Colorado Regional Water Planning Area. 84 Lower Colorado Regional Water Planning Group, 2006 Region “K” Water Plan for the Lower Colorado Regional Water Planning Group with assistance from Turner Collie & Braden, Alan Plummer Associates, Inc., and Group Solutions RJW (Austin, Texas, January 2006), p. 8-19, http://www.twdb.state.tx.us/ rwpg/2006_RWP/RegionK/Chapter%208.pdf. (Last visited January 3, 2009.) 85 Lower Colorado Regional Water Planning Group, Region K-2011 Plan, Draft Scope of Work: Lower Colorado Regional Water Planning Area. 86 Texas Water Development Board, Water for Texas 2007 (Austin, Texas, January 2007), Volume II, p. 79, http://www.twdb.state.tx.us/publications/ reports/State_Water_Plan/2007/2007StateWaterPlan/ CHAPTER%202_REGIONAL%20L%20FINAL%20 112706.pdf. (Last visited January 3, 2009.) 87 Texas Water Development Board, Water for Texas 2007 (Austin, Texas, January 2007), Volume II, p. 80, http://www.twdb.state.tx.us/publications/ reports/State_Water_Plan/2007/2007StateWaterPlan/ CHAPTER%202_REGIONAL%20L%20FINAL%20 112706.pdf. (Last visited January 3, 2009.) 88 Texas Water Development Board, Water for Texas 2007, p. 344. 89 Lower Colorado River Authority, “Contractual Agreement”, http://www.lcra.org/lswp/overview/ agreement.html. (Last visited January 3, 2009.) 90 Lower Colorado River Authority, LCRA-SAWS Water Project Quarterly Status Report (Austin, Texas, 1st Quarter 2008), p. 1, http://www.lcra.org/library/ media/public/docs/lswp/1st_Qtr_2008_Report.pdf. (Last visited January 3, 2009.) 91 Lower Colorado River Authority, LCRA-SAWS Water Project Quarterly Status Report. 92 Interview with Joe Rippole, project manager, San Antonio Water Systems, San Antonio, Texas, November 6, 2008. 93 Texas Water Development Board, Water for Texas 2007 (Austin, Texas, January 2007), Volume II, p. 345, http:// http://www.twdb.state.tx.us/publications/reports/ State_Water_Plan/2007/2007StateWaterPlan/APP%20 2.1_final%20112906.pdf. (Last visited January 3, 2009.) 94 Email communication from Rick Illgner, coordinator of Intergovernmental Affairs, Edwards Aquifer Authority, San Antonio, Texas, November 20, 2008. 95 South Central Texas Regional Water Planning Group with San Antonio River Authority, South Central Texas Regional Water Planning Area: 2006 Regional Water Plan, by HDR Engineering, Inc., Margaret Dalthorp, Paul Price Associates, Inc., and John Folk-Williams, Sr., (Austin, Texas, January 2006),
  • 58.
    Liquid Assets: TheState of Texas’Water Resources Texas Comptroller of Public Accounts54 Regional Water Planning com/13/38/1/default.aspx?projectID=805. (Last visited January 5, 2009.) 123 Texas Water Development Board, Water for Texas 2007, Volume II, p. 252. 124 Coastal Bend Regional Water Planning Group, Nueces River Authority, and HDR Engineering, Inc., 2011 Regional Water Plan: Study 1 Evaluation of Additional Potential Regional Water Supplies for Delivery through the Mary Rhodes Pipeline, Including Gulf Coast Groundwater and Garwood Project, DRAFT (Corpus Christi, Texas, November 2008), p. 1, http://www. nueces-ra.org/CP/RWPG/pdfs/1.pdf. (Last visited January 5, 2009.) (Consultant’s report.) 125 Letter from Rocky Freund, staff, Coastal Bend Regional Water Planning Group and Nueces River Authority, November 4, 2008. 126 Texas Water Development Board, Water for Texas 2007 (Austin, Texas, January 2007), Volume II, pp. 97-100, http://www.twdb.state.tx.us/publications/ reports/State_Water_Plan/2007/2007StateWaterPlan/ CHAPTER%202_REGIONAL%20O%20final%20 112706.pdf. (Last visited January 5, 2009.) 127 Interview with Aubrey Spear, director of Water Utilities, City of Lubbock, Lubbock, Texas, November 19, 2008. 128 Texas Water Development Board, Water for Texas 2007, Volume II, p. 252. 129 Llano Estacado Regional Water Planning Group, Llano Estacado Regional Water Plan: Executive Summary, by HDR Engineering, Inc. (Lubbock, Texas, January 2006), pp. ES-23-27, http://www.llanoplan. org/May%202006%20REVISED%20LERWPG%20 Plan/4%20-%20Region%20O%20Executive%20 Summary%20Final%202006%20Plan.pdf. (Last visited January 5, 2009.) (Consultant’s report.) 130 Texas Water Development Board, Water for Texas 2007 (Austin, Texas, January 2007), Volume II, p. 103, http://www.twdb.state.tx.us/publications/ reports/State_Water_Plan/2007/2007StateWaterPlan/ CHAPTER%202_REGIONAL%20P_final%20112706. pdf. (Last visited January 5, 2009.) 131 Texas Water Development Board, Water for Texas 2007 (Austin, Texas, January 2007), Volume II, pp. 104-108, http://www.twdb.state.tx.us/publications/ reports/State_Water_Plan/2007/2007StateWaterPlan/ CHAPTER%202_REGIONAL%20P_final%20112706. pdf. (Last visited January 5, 2009). 132 Texas Water Development Board, Water for Texas 2007, Volume II, pp. 104-108. 133 Texas Water Development Board, Water for Texas 2007, Volume II, p. 252. 134 Interview with Patrick Brozowski, general manager, Lavaca-Navidad River Authority, Edna, Texas, November 6, 2008. State_Water_Plan/2007/2007StateWaterPlan/APP%20 2.1_final%20112906.pdf. (Last visited January 3, 2009.) 108 Interview with Jake White, director of Special Projects, NRS Consulting Engineers. 109 Rio Grande Regional Water Planning Group, Region M Regional Water Plan, by NRS Consulting Engineers, R.J. Brandes Company, LBG-Guyton Associates, Fernandez Group, Inc., Texas Agricultural Experiment Station, and Texas Cooperative Extension (Harlingen, Texas, January 2006), pp. 4-24-25, 4-43, http://www.riograndewaterplan.org/downloads/ waterplan2006/ch04-identevalselect.pdf. (Last visited January 3, 2009.) (Consultant’s report.) 110 Texas Water Development Board, Water for Texas 2007, Volume II, p.346. 111 Email from Jaime Estrada, Brownsville Public Utility Board, Brownsville, Texas, November 24, 2008. 112 Texas Water Development Board, Water for Texas 2007 (Austin, Texas, January 2007) Volume II, p. 252, http:// www.twdb.state.tx.us/publications/reports/State_ Water_Plan/2007/2007StateWaterPlan/CHAPTER%20 9_112806.indd.pdf. (Last visited January 3, 2009.) 113 Texas Water Development Board, Water for Texas 2007, Volume II, p. 88. 114 Colorado State University, Colorado Water Resources Research Institute and The Water Center, “Mexican Treaty (1944),” http://waterknowledge.colostate. edu/1944_mex.htm. (Last visited January 3, 2009.) 115 International Boundary and Water Commission, “Status Report of Rio Grande Water Deliveries by Mexico,” (El Paso, Texas, November 22, 2008). 116 Interview with Jake White, director of Special Projects, NRS Consulting Engineers, Harlingen, Texas, November 4, 2008. 117 Interview with Jake White, director of Special Projects, NRS Consulting Engineers, Harlingen, Texas, November 4, 2008; and interview with Bill Norris, principal engineer, NRS Consulting Engineers. 118 Texas Water Development Board, Water for Texas 2007 (Austin, Texas, January 2007), Volume II, p. 91, http://www.twdb.state.tx.us/publications/ reports/State_Water_Plan/2007/2007StateWaterPlan/ CHAPTER%202_REGIONAL%20N%20_final%20 112706.pdf. (Last visited January 3, 2009.) 119 Coastal Bend Regional Water Planning Group, Coastal Bend (Region N) Regional Water Plan: Executive Summary by Nueces River Authority and HDR Engineering, Inc. (Corpus Christi, Texas, January 2001), p. ES-5, http://www.twdb.state.tx.us/ rwp/N/PDFs/N_Executive%20Summary.pdf. (Last visited January 3, 2009.) (Consultant’s report.) 120 Texas Water Development Board, Water for Texas 2007, Volume II, pp. 91- 92. 121 Interview with Mark Van Vleck, deputy water director, City of Corpus Christi, Corpus Christi, Texas, November 21, 2008. 122 HDR Engineering, Inc., “Coastal Bend (Region N) Regional Water Supply Plan,” pp. 1-2, http://hdrinc.
  • 59.
    Texas Comptroller ofPublic Accounts Liquid Assets: The State of Texas’Water Resources 55 State Water Plan: Issues and Funding ties in East Texas, preventing the construction of Fastrill reservoir, a water supply project which had been sought by the city of Dallas.2 This des- ignation is being appealed. Acquisition and protection of future sites is also an issue. To address this, the Texas Water Development Board (TWDB) controls the Stor- age Acquisition Fund for projects related to the acquisition and development of water storage.3 In 2007, the 80th Legislature enacted Senate Bill 3. Among its provisions, the bill designated 19 sites identified in the State Water Plan as having unique value for the construction of a dam and reservoir, a designation that will expire in 2015 unless an affirmative vote for a project is made by the project sponsor, such as the governing body of a city. Although the bill did not initiate reservoir construction, it did lay the ground- In addition to the strategies identified by water planning regions, the 2007 Texas State Water Plan highlighted several policy issues to be addressed in implementing the plan. Some of the recommendations were enacted by the 80th Legislature in 2007, while others have not yet been addressed. Reservoir Site Designation and Acquisition Development and construction of new reservoirs remains an ongoing policy issue. An important factor in preserving future reservoir sites for construction is proper designation by the Legis- lature. Actions by federal, state or local govern- ments to protect ecosystems in or near reservoir sites can sometimes impede development.1 For example, in 2006 the U.S. Fish and Wildlife Service designated a federal wildlife refuge on 25,000 acres in Anderson and Cherokee coun- State Water Plan: Issues and Funding Cotton fields near Lubbock, Texas
  • 60.
    Liquid Assets: TheState of Texas’Water Resources Texas Comptroller of Public Accounts56 State Water Plan: Issues and Funding Rivers need a base level of flow to preserve the fragile ecosystems that surround them. Coastal bays and estuaries need freshwater inflows to maintain the delicate balance between freshwater and seawater that sustains wildlife and supports shrimping, fishing, recreation, and other coastal industries. Groundwater Regulation in Texas For more than a century, Texas’ groundwater has been governed under the “rule of capture,” a te- net based in English common law that considers groundwater to be a privately owned resource. Thus in Texas groundwater is treated differently from surface water, which is publicly owned and requires a permit for use. Under the rule of capture, as adopted by the Texas Supreme Court in 1904, a Texas land- owner may pump a virtually unlimited amount of groundwater from below his or her land.7 The court has established only limited excep- tions to this rule, requiring that the water be put to a beneficial use; that a landowner may not withdraw water to maliciously injure a neighbor; and that a landowner cannot cause subsidence to a neighbor’s land as a result of groundwater withdrawals.8 Since adopting the rule of capture, Texas courts have deferred to the Legislature regard- ing groundwater regulation. In 1997, Senate Bill 1 took a major step toward altering the state’s approach to groundwater regulation by strengthening the role of groundwater conserva- tion districts, specifying that these districts are the preferred method for managing the state’s groundwater.9 Groundwater districts can be created by local voters or through legislation. At this writing, Texas has 95 groundwater districts.10 These districts can regulate well spacing and may limit groundwater production. In some areas, more than one groundwater district manages land over a single aquifer. In these cases, groundwater districts must work together under the framework of a “groundwater management area” that encompasses the aquifer. Districts in a groundwater management area collaborate to ensure that groundwater with- drawals are consistent with their plans for the aquifer. Parts of the state that are without a groundwater district, however, remain governed by the rule of capture. Because groundwater is less highly regulated than surface water, water marketers work for it by designating these sites. To address concerns over the controversial Marvin Nichols reservoir planned along the Sulphur River in Red River and Titus Counties, a study com- mission will examine water needs in Region C (Dallas-Fort Worth) and recommend, no later than December 1, 2010, whether Marvin Nichols should remain designated as a reservoir site.4 Reservoir designation and construction are con- troversial issues. Development can conflict with the interests of local landowners whose property would be flooded, and environmental concerns such as habitat loss, diminished downstream flows and pollution have also led to opposition. Interbasin Transfers of Surface Water Interbasin transfer of surface water is the practice of moving surface water from one river basin to another. This provides an important source of regional water supply for some, and has been used to meet water demand shortages in various regions. Current state laws, however, substantially restrict the free flow of interbasin transfers. Prior to the passage of Senate Bill 1 in the 75th Legislative Session (1997), interbasin transfers were significantly more accessible. With Senate Bill 1, the state adopted the “junior water rights provision.” This regulation requires any water right that transfers surface water from one river basin to another to be reclassified as “junior.” This reclassification means that senior water rights allowing the transfer of surface water outside the basin become junior to other water rights within the basin. For this reason intra- basin water rights have priority over interba- sin rights. In drought years when there is not enough surface water to satisfy all water rights, junior interbasin rights may not be satisfied.5 Since the passage of Senate Bill 1, only two inter- basin transfers have been authorized. Opponents argue that the Legislature should repeal the 1997 provisions to restore the volume of inter- basin transfers and facilitate free flows of water throughout the state.6 Others point out that the process can harm agricultural or historic users in the originating river basin and that these us- ers have a right to be protected.
  • 61.
    Texas Comptroller ofPublic Accounts Liquid Assets: The State of Texas’Water Resources 57 State Water Plan: Issues and Funding Conservation initiatives will help supply nearly 23 percent of the state’s water requirements by 2060. Environmental Water Needs Environmental concerns regarding water alloca- tion are a crucial part of state water planning. Rivers need a base level of flow to preserve the fragile ecosystems that surround them. Coastal bays and estuaries need freshwater inflows to maintain the delicate balance between fresh- water and seawater that sustains wildlife and supports shrimping, fishing, recreation, and other coastal industries. It is important for state officials to have accurate information on environmental flow requirements when they issue permits for municipal, industrial and ag- ricultural uses. And water rights applicants and permit holders need reliable information from the state to plan adequately for environmental issues. Although state agencies have studied environmental inflow needs since 1977, until recently the results were not widely accepted or incorporated into the water right permitting and planning process.11 In 2007, Senate Bill 3 passed by the legislature included a process to determine the environ- mental needs of Texas rivers, bays and estuaries. This process incorporates a bottom-up planning approach, where basin stakeholder committees and expert science teams submit environmental recommendations to the Environmental Flows Advisory Group and the Texas Commission on Environmental Quality (TCEQ), which then develops environmental flow standards. These flow standards are developed to inform water rights applicants of water to be set aside for the environmental protection of rivers, bays and estuary ecosystems.12 Currently, two river basin/bay stakeholder committees are active: the Sabine and Neches Rivers/Sabine Lake Bay Stakeholder Commit- tee and the Trinity and San Jacinto Rivers/ Galveston Bay Stakeholders Committee. These committees have appointed experts to gather research on environmental flow needs specific to these river and bay systems. TCEQ is sched- uled to adopt environmental flow standards for these regions by May 2011. As specified by Senate Bill 3, the remaining river basin and bay systems will begin their planning process in the coming months and all will be active by June 2010.13 In addition, the Environmental have become increasingly interested in ground- water resources as an option for meeting grow- ing demand. In recent months, several important court rul- ings have highlighted the contentious nature of groundwater regulation in Texas. In Guitar Hold- ing Co. L.P. v. Hudspeth County Underground Water Conservation Dist. No. 1, et al. (December 2007), the Texas Supreme Court found that when using historic usage to permit groundwater withdrawals, a district must consider not only the amount of water historically permitted to a land- owner, but also the purpose for which the water had been used. According to the court, “because transferring water out of the district is a new use, it cannot be preserved or ‘grandfathered.’” The net effect of the court’s ruling was to level the playing field for landowners in the Hudspeth County Un- derground Water Conservation District, mean- ing that landowners who do not have a history of irrigating now have a right to export water that is equal to those who have historically drawn from the aquifer, and both must apply for a new permit on an equal basis. Two recent rulings by the Fourth Court of Ap- peals in San Antonio clarified the status of a landowner’s ownership right to groundwater. In February 2008, the court ruled in City of Del Rio v. Clayton Sam Colt Hamilton Trust that ground- water is the property of a landowner whether or not it has yet been captured by the landowner. In August 2008, the Fourth Court of Appeals ruled in Edwards Aquifer Authority v. Day that a land- owner has a vested ownership right in ground- water, potentially opening the door to compen- sation for landowners if a groundwater district restricts their ability to withdraw groundwater from their property. These recent court rulings have affirmed the state’s long-held position on ownership of private property, as codified in 1995 by SB 14, the Private Real Property Rights Act, authored by Senator Teel Bivins and then-Representative Susan Combs. Groundwater is the property of the owner of the land overlying the aquifer, and efforts to interfere with this right could result in both uncertainty of ownership and enormous economic consequences for our state.
  • 62.
    Liquid Assets: TheState of Texas’Water Resources Texas Comptroller of Public Accounts58 State Water Plan: Issues and Funding Major challenges affecting each water region include decreased federal assistance, the competition for funding by non-water infrastructure needs and time necessary to complete water projects. those plans or a waiver from TWDB and from the appropriate regional water planning group. The amendment process can be costly and dif- ficult, requiring such actions as a 60-day notice and comment period; notices to municipalities and river authorities; notices published in local newspapers; and public hearings and comments. To streamline this process, TWDB has recom- mended an expedited process for projects that would not result in over-allocation of water resources, was not a reservoir project and would not significantly impact environmental flows. This proposed process would require a two-week public notice of an entity’s intent to amend the water plans, followed by a public meeting in which the planning group must consider any public comment before amending the plan.17 The agency claims that this recommendation would significantly accelerate the amendment process and afford economically disadvantaged areas more opportunities. Indirect Reuse Indirect reuse occurs when wastewater treat- ment plants discharge water into a stream and that water is diverted and reused by the same permit holder downstream creating, in effect, a closed loop system. Under current law, indirect reuse requires a “bed and banks” permit that authorizes a water rights holder to transmit water in a watercourse. This is contrasted with direct reuse, in which water is sent directly from a treatment plant to a location where it is used again without reentering the river or stream. Conflicts have arisen over indirect reuse because downstream users argue that discharged water falls under the “first come, first served” doctrine of “prior appropriation.” Prior appropriation al- lows the water rights holder with the most senior permit full use of his or her permitted amount before the next most senior permit holder can exercise his or her use. Under this doctrine, any entity interested in reusing water that had been discharged into a river would have to apply for another, more junior permit in order to use that water. Proponents of indirect reuse believe that they should be allowed to reuse discharged effluent downstream in order to meet growing demand for water. Flows Advisory Group, which will ultimately recommend environmental flow set-aside levels to TCEQ, was appointed by the governor, in December 2007.14 This group has met several times, as has the Environmental Flows Science Advisory Committee, which advises the Envi- ronmental Flows Advisory Group on technical and scientific questions. Water Conservation Water conservation is an integral part of the Texas Water Plan. Conservation initiatives will help supply nearly 23 percent of the state’s water requirements by 2060. The 78th Legislature established a Water Conservation Implementa- tion Task Force that developed best practices for regional water planners to enhance conservation efforts statewide. The task force made 25 recom- mendations for conservation initiatives at the state level. Examples of these recommendations included efforts to raise water conservation awareness, tying state water funding to water conservation requirements, grants to fund innovations in water conservation, and the establishment of a water management resource library. Of the 25 statewide recommendations made by the task force, three need continued funding for existing programs, eight require new or additional fund- ing and 13 require legislation and, in most cases, additional funding.15 In addition to these measures, in 2007 the 80th Legislature established a statewide water conservation public awareness program and required public utilities serving at least 3,300 water utility connections to develop a water conservation plan. The Legislature also estab- lished the Water Conservation Advisory Coun- cil, to provide guidance on water conservation issues.16 Expedited Amendment Process To qualify for state funding assistance, Texas law requires that water supply projects are consistent with the state and regional plans, and receive surface water right permits from TCEQ. If a project does not conform to the state water plan and to the regional water plan, the project’s applicant must seek either an amendment to
  • 63.
    Texas Comptroller ofPublic Accounts Liquid Assets: The State of Texas’Water Resources 59 State Water Plan: Issues and Funding Through the State Participation Program (SPP), TWDB provides loans to local governments for the construction of water facilities where local funding is inadequate and the entity cannot assume the necessary debt. subsequently updated this number to $2.4 bil- lion. In the summer of 2008 TWDB completed a new infrastructure finance survey and the agency now estimates that the state will need to provide $16.6 billion by 2060.19 Current Water Project Financing Water projects in Texas are funded by state and local sources. For the past four years, state funding has made up approximately 2 percent of total water project funding in Texas. In fiscal 2008, TWDB provided $137.9 million, which was 3 percent of the total debt issued in Texas for water projects.20 Texas’ primary funding mechanism has been the issuance of general obligation (GO) bonds backed by the state. TWDB has authority to issue $4.9 billion in GO bonds. As of August 31, 2008, the agency had issued $2.5 billion in GO bonds with a remaining $2.4 billion in issuance authority.21 Although TWDB has constitutional authority to issue the bonds, the agency depends upon the Legislature to make an appropriation for debt service (interest and principal pay- ments) on any non-self supporting bonds issued. Therefore, debt service amounts appropriated by the Legislature affect the amount that TWDB can issue in GO bonds each biennium. The 80th Legislature authorized TWDB to issue $874.8 million in non-self-supporting GO bonds with debt service payments of $39.8 million for fiscal 2008 and $70.9 million for fiscal 2009.22 The majority of these debt service amounts will be paid from general revenue. Of the bonds authorized for issuance during the 2008-09 bi- ennium, $762.8 million will be used for projects in the State Water Plan.23 TWDB provides grants and loans to local entities for funding the planning, design and construction of water and wastewater proj- ects. Grants are provided primarily through the Economically Distressed Areas Program (EDAP), while loans are provided through the State Participation Program, the Water Infra- structure Fund (WIF), the Clean Water State Revolving Fund, and the Drinking Water State Revolving Fund. Typically, the proceeds from GO bond issuances are used to provide loans Ultimately, many water users believe that the Legislature should clarify water rights accord- ingly. Potential issues that could be addressed include: the uniform status of water that is de- rived from different sources; whether water from future or existing sources is treated uniformly; who can obtain indirect reuse rights; and envi- ronmental protection in reuse permitting.18 Financing Water Management Strategies The 2007 State Water Plan’s total price tag is $30.7 billion, which represents capital costs asso- ciated with supplying water to regional systems. Capital costs do not include funds for water distribution within a water supplier’s service area, forcing suppliers to shoulder a variety of investment strategies to meet water needs. Major challenges affecting each water re- gion include decreased federal assistance, the competition for funding by non-water infrastructure needs and time necessary to complete water projects. Local water groups are receiving less federal support for infra- structure, and are feeling the pinch of higher real interest rates, water scarcity, and rising energy costs, which all erode spending power on water projects. Additionally, water projects must compete with other infrastructure needs brought about by population growth, such as roads and schools. The length of time needed for large water proj- ect construction prevents many local groups from implementing projects without state help. Current legal and regulatory barriers require 10 years for planning, and local sponsors are reluctant to approve projects with little short- term benefit. Economically disadvantaged areas cannot raise necessary capital without sufficient income from residents, adding another barrier to water development without state assistance. Of the $30.7 billion cost of proposed projects in the 2007 state water plan, municipalities and other jurisdictions indicate that the state will need to provide $2.1 billion by 2060. State funds would aid in initiating essential, large scale projects in communities across the state. TWDB
  • 64.
    Liquid Assets: TheState of Texas’Water Resources Texas Comptroller of Public Accounts60 State Water Plan: Issues and Funding ing programs, proceeds from the sale of bonds are used to make loans to communities. Repayments from the communities are then deposited to the particular program fund. These repayments are insufficient to pay all the debt service required and general revenue pays the remaining amount required to pay debt service. Non-Self-Supporting GO Bond Programs Through the State Participation Program (SPP), TWDB provides loans to local governments for the construction of water facilities where local funding is inadequate and the entity cannot assume the necessary debt. To ensure that the project is built with enough capacity to serve fu- ture growth, TWDB will defer repayment of the loan until an adequate customer base has been established. In exchange, TWDB may acquire an ownership interest in the water rights or co- ownership in the facility or property.24 TWDB continues to pay the debt service amounts on the original GO bond issuance while local enti- ties repay the entire loan amount on a deferred timetable. TWDB is authorized to issue $326.1 million in bond authority during the 2008-09 biennium with $276.1 million to be used for projects in the State Water Plan.25 EDAP provides loans and grants in economically distressed areas where water or wastewater sys- tems are inadequate and the financial resources to provide services are insufficient. Qualifying sys- tems include colonias on the Texas-Mexico border and unincorporated areas across the state. Eligible projects are in areas where the median household income is less than 75 percent of the median state household income. In 1991, voters approved $250 million in bonds for the EDAP program and in 2007 approved an additional $250 million. By the end of fiscal 2007, $238 million had been issued.26 Out of the authorized issuance of $99.5 million in the 2008-09 biennium, $37.5 million is for projects identified in the State Water Plan. By using GO bond proceeds and federal funds in the Colonia Wastewater Treatment Assistance Pro- gram, TWDB has provided $570.9 million to 103 projects in 24 counties, affecting 328,069 residents in 676 colonias.27 WIF was created in 2001 for making grants and low-interest loans to communities for water to local entities that in turn pledge to pay back the loans. Local entities apply for state financial assistance when they cannot assume enough debt for a project or if they can obtain more favorable terms from a state program. Loans are available to a variety of entities and political subdivisions including: • cities; • counties; • river authorities; • special law districts; • water improvement districts; • water control and improvement districts; • irrigation districts; • groundwater districts; and • nonprofit water supply corporations. Some of TWDB’s loan programs offer local entities the option of deferred payments or a repayment rate below market rates. Deferring payments after the completion of a project lets local entities build the required customer base to generate enough revenue to repay the loan. TWDB also offers loans below the market rate to encourage local entities to begin crucial water projects for the region. In the case of deferred loans, from the State Participation Fund, the state recovers all of the principal and interest. Under the Water Infrastructure Fund, the dif- ference between TWDB’s cost for debt service and the amount paid back by the local entities represents a cost to the state. TWDB administers both self-supporting and non-self-supporting GO bond programs. In self- supporting programs, such as the Water Develop- ment Fund, proceeds are used to make loans to communities and loan repayments are used to pay debt service on these bonds and make addi- tional loans. Repayments by local entities are then deposited to the same fund for debt service pay- ments and additional loans. In non-self-support-
  • 65.
    Texas Comptroller ofPublic Accounts Liquid Assets: The State of Texas’Water Resources 61 State Water Plan: Issues and Funding Water state revolving funds. Through this initia- tive, TWDB can make one loan to a municipality for multiple water projects. TWDB funds the 20 percent federally required state match for the Clean and the Drinking Water state revolving funds primarily by using bond proceeds amounts from the Water Development Fund II.33 Rural political subdivisions that include mu- nicipalities and water districts with a population under 10,000 and counties where no urban area has a population more than 50,000 qualify for Rural Water Assistance Fund loans. The pro- gram issues Alternative Minimum Tax (AMT) bonds through the state’s private activity bond program and under DFUND authority. The AMT bond allow TWDB to offer loans at rates below taxable market rates to non-profit water supply corporations. Another benefit to the pro- gram is that construction purchases by nonprofit water supply corporations may receive a sales tax exemption.34 Since the program’s inception in 2001, $104.8 million has been committed to 34 rural communities through the program.35 Federal Financial Assistance TWDB operates two revolving loan funds that receive federal capitalization grants. The Clean Water State Revolving Fund (CWSRF) was established in 1988 in compliance with the Clean Water Act and the Drinking Water State Revolv- ing Fund (DWSRF) established in 1997 in compli- ance with the Safe Water Drinking Act.36 Each of these funds receives a federal grant and the state must provide a match of 20 percent of the federal amount. The state matching amount is provided by bonds issued through the Water Development Fund. CWSRF program funds are used as col- lateral to issue CWSRF revenue bonds to leverage the program. By leveraging the federal and state match amounts, TWDB is able to make more and larger loans than would be possible using only the amounts in the funds. Repayment of the loan is made by the local entity and these amounts are deposited in the respective fund and used to pay debt service and secure additional bond issu- ances. TWBD provides these loans at rates of 1 percent to 4 percent below market rates.37 The CWSRF provides loans to political subdivi- sions (except nonprofit water supply corpora- projects, but it did not receive any appropria- tions until 2007. Currently, TWDB can issue $449.3 million in GO bonds for funding projects in the State Water Plan.28 Bond proceeds are used to make loans at a subsidized interest rate of 2 percent below the cost for TWDB and no less than zero percent. Since the state offers local entities loans at a lower rate than the state is pay- ing for the debt service, general revenue is used to make up the difference. To advance projects that have significant planning and design stages, locals may defer repayment for up to 10 years or until end of construction for the project.29 TWDB has constitutional authority to issue up to $200 million in GO bonds for the Agricultur- al Water Conservation Fund (AWCF). Through the AWCF, TWDB can provide grants to state agencies and political subdivisions for conserva- tion activities and the purchase and installation of metering devices for irrigation use. Loans are available for projects such as converting ir- rigated land to dryland farming, more efficient use of precipitation and brush control activities. Local banks and credit systems also can apply to this program for funds. Through linked depos- its, banks or farm credit associations are able to offer a lower rate for loans to individuals.30 In exchange, the lender pays a less-than-market interest rate on state funds deposited with the lender. To date, TWDB has loaned $35.2 million to political subdivisions, individuals, and local lending institutions through the AWCF.31 Self -Supporting Bond Programs The Water Development Fund I was established in 1957 when voters approved a constitutional amendment authorizing $200 million in GO bonds for water projects. In 1997, a new Water Development Fund II was established to update the process used to loan and distribute funds.32 This constitutionally dedicated fund provides most of TWDB’s authority to issue GO bonds for such programs as the SPP, EDAP, WIF and RWAF. The Water Development Fund program offers TWDB flexibility as a wide array of water projects are eligible for funding. The self-support- ing component of the Water Development Fund provides loans to entities that need state assis- tance, are unable to wait for federal funds, and are ineligible for either the Clean or the Drinking
  • 66.
    Liquid Assets: TheState of Texas’Water Resources Texas Comptroller of Public Accounts62 State Water Plan: Issues and Funding mechanism exists. Debt service on non-self- supporting general obligation bonds is paid with general revenue from state taxes. The Water Development Board has identi- fied $2.4 billion in state funding that will be needed to support $30.7 billion in local projects identified in the State Water Plan. Texas needs a funding system for water projects that pro- vides a link between these water development projects and end users. The Texas Legislature is actively exploring the options that are available for funding water projects and may act on the issue in the 2009 legislative session. Although no funding mechanism has been adopted so far, policymakers have considered several propos- als. Most recently, the Joint Committee on State Water Funding has held hearings considering several options. Funding proposals presented by TWDB and the Joint Committee on State Water Funding include: • a state sales tax increase; • a water conservation and development fee; • a water rights fee; • a water connection fee; and • a sales tax on bottled water. Research has shown that the following criteria represent ideal principles by which to evaluate water project funding proposals: 1. Adequacy: The financing mechanism should be sufficient to cover identified costs without excessively burdening those who pay the fees. 2. Balance: The burden for funding water proj- ects should be spread among all water user groups in relative proportion to each group’s demand for water, and no group should be favored. 3. Specificity: Funds that are raised should be used for water development projects and not diverted for other budgetary obligations. tions) for wastewater treatment facilities and pollution projects that address compliance with the federal Clean Water Act. In addition to providing loans to political subdivisions, banks or farm credit associations may apply for linked deposits to make loans for nonpoint source pollution control projects.38 TWDB has received $3.0 billion in federal capitalization grants as of 2007 and has provided $5.2 billion in loans to local entities.39 Loans provided through the DWSRF ensure public drinking water systems comply with the federal Safe Drinking Water Act regulations and the State Water Plan. In addition to political subdivisions, nonprofit water supply corpora- tions, privately owned water systems, and state agencies are also eligible for funding. Loans can be used for water supply infrastructure upgrades, compliance with federal health standards and the purchase of land or easements in order to prevent contamination of a drinking system water source.40 TWDB has received $685.2 million in federal capitalization grants as of 2007 and has provided $971 million in loans to local entities.41 Proposed Revenue Sources By adopting a statewide planning process to identify and pursue water development proj- ects, the State of Texas has established water infrastructure as an important public priority. However, Texas also has many other impor- tant spending priorities. In coming years, as the Texas population expands, public demand for services provided by state government will grow. State expenditures on health care, public education, higher education, public safety and transportation infrastructure will continue to exert pressure on the state’s budget. In addi- tion, given the relatively high levels of property and sales taxation in Texas, it is questionable whether these sources will be available for addi- tional funding. Thus, a dedicated funding source for those projects may need to be established to ensure steady progress toward adequate future water supplies. Since 1997, the Legislature has considered establishing a dedicated funding mechanism for water programs. Currently, however, no such
  • 67.
    Texas Comptroller ofPublic Accounts Liquid Assets: The State of Texas’Water Resources 63 State Water Plan: Issues and Funding in proportion to the water that they consume. As- suming an industrial exemption, revenue would decline to an estimated $220.1 million in fiscal 2008 and $242.8 million in fiscal 2011. This is based on estimated taxable retail sales of water and sewer services of $3.5 billion in fiscal 2008 and $3.9 billion in fiscal 2011. The sales tax on water services accounts for 60 percent of the total water/sewer sales tax revenue, with wastewater service account- ing for the rest. By applying the 6.25 percent state sales tax to water sales, the average monthly water/ sewer bill would increase by approximately $1.66 per month for residential customers and approxi- mately $10.51 for commercial customers.44 Proponents of this approach argue that this op- tion generates substantial revenue and would be easy to administer. These amounts could be used to replace general revenue funds for the payment of debt service. Annual amounts for debt service associated with the State Water Plan are expected to increase significantly, but annual revenues generated from this sales tax would exceed that amount. Sales tax revenue could also be used to supplant a portion of GO bond proceeds in the future, providing a savings to the state by avoiding debt service costs. In addition, a tax on water sales would discourage water waste, as taxes increased with increases in water use, which could further be discouraged if higher levels of water use were priced at marginally higher rates. The regressive aspect of this approach would be minimized by providing an allowance for a base level of residential use that would go untaxed. Critics point out that although this tax is a small portion of a user’s residential water bill, sales tax- es are regressive, meaning that their burden falls more heavily on lower-income taxpayers than on higher-income taxpayers. Some critics think it would be unfair for industrial users to get an exemption while residents and other commercial users pay the tax. In addition, some argue that it would be problematic for the tax to be a function of both consumption and the price for water that is charged by a utility, rather than exclusively basing it on water use. Finally, unless the revenue stream was established as a dedicated fund, these amounts would be credited to the General Rev- enue Fund (as is most sales tax) and could be used to pay for other government programs. 4. Equity: The plan should be sensitive to water users’ ability to pay, since a certain level of water consumption is nondiscretionary and essential for every individual’s health. No plan should unduly burden individuals who might have difficulty paying for it. 5. Efficiency: The plan should be easy to admin- ister, comply with and understand. Such a plan also should avoid distorting economic activity by favoring certain user groups or creating incentives favoring certain types of water projects. 6. Conservation: The financing system should be consistent with the goal of water conservation and discourage inefficient uses. Policymakers should strive to find the appropriate balance among these criteria. State Sales Tax Proposal Under this proposal, the state sales tax rate of 6.25 percent would apply to currently exempt retail sales of water or sewer services by public water supply systems. In addition to a state sales tax, local governments could apply a local tax on retail water sales. Typical exemptions include govern- ment entities, education, charitable and nonprofit organizations and chambers of commerce. Resi- dential users would also receive a fixed monthly exemption to account for basic water needs. Assuming an exemption for the first 5,000 gallons of household residential use per month, state rev- enues generated from a sales tax on both water and sewer services would be an estimated $243.2 mil- lion in fiscal 2008, increasing to $266.6 million in fiscal 2011. This estimate is based on taxable retail sales of water and sewer services of $3.9 billion in fiscal 2008 and $4.3 billion in fiscal 2011.42 In 2003, average per person-per month water use ranged from approximately 3,750 gallons in Killeen to ap- proximately 8,250 in Richardson.43 Taxing industrial users would have been exempt. Industrial users have argued that they should be exempt from this tax because they are taxed on their final product. They point out that manufac- turers’ inputs typically are exempt from sales tax. Others argue that industrial users should be taxed
  • 68.
    Liquid Assets: TheState of Texas’Water Resources Texas Comptroller of Public Accounts64 State Water Plan: Issues and Funding Water Funding Mechanisms in Other States Because of high costs associated with building water infrastructure, many states issue GO or revenue bonds to pay for large water projects. States use additional funding mechanisms to support water quality, conser- vation and some infrastructure projects.46 Arizona Arizona levies a 5 percent transaction privilege tax on the gross sales or income derived by an entity that furnishes water, including cities and municipalities. The delivery of water by federal or state government entities is exempt generally. The state exempts bottled water (other than water delivered by a retailer to an office or business) and governmental entities. Residential and commercial users pay a water quality fee of $0.0065 per 1,000 gallons of water. The state uses this fee for water quality improvement projects. The state also collects a storm water fee of 50 cents on each utility account. Arkansas Arkansas applies a 6 percent state sales tax on residential, commercial and industrial water sales. Large users of water are assessed an annual water use fee in the amount of $10 per registered-surface water diversion and $10 per registered well. The state funds water conservation programs using these fees.47 California In California, water rights holders pay an annual fee of 3 cents per acre-foot of “authorized” water. Kansas Kansas assesses a water protection fee of 3 cents per 1,000 gallons of water on the following: 1) water sold at retail by public water supply systems; 2) water appropriated for industrial use; and 3) water appropriated for stock watering. The state charges an inspection fee on each ton of fertilizer offered for sale and deposits $1.40 per ton to the State Water Plan Fund. The state deposits $100 of each pesticide registration fee to the State Water Plan Fund. Kansas also assesses a Clean Water Drinking fee of 3 cents per 1,000 gallons of retail water sold by a public water supply system. The state deposits 95 percent of this in the State Water Plan Fund, using 85 percent of this amount for the renovation and protection of lakes and 15 percent for techni- cal assistance for public water supply systems.48 Louisiana Louisiana applies a 3.8 percent sales tax on water sales to commercial and industrial users. While individual residential consumers are exempt, sales where one meter applies to several residential units, multi-family rentals for example, are subject to the tax. Michigan Michigan assesses an annual water use fee on community water supply systems ranging from $372 to $124,791, depending on the number of people served by the water system.49 The state also charges non- community water suppliers a fee. Facilities with wells serving primarily transient populations, including campgrounds, rest stops, motels and restaurants, are assessed an annual fee of $104. Larger, non-communi- ty water systems, such as schools and businesses, that serve the same 25 or more persons on a routine basis, are assessed $442 per year. The state uses the fees to administer Michigan’s Clean Drinking Water Act. Nebraska Nebraska levies a 5.5 percent sales tax on amounts paid for through sewer and water services. The state exempts water used for agricultural irrigation and manufacturing.
  • 69.
    Texas Comptroller ofPublic Accounts Liquid Assets: The State of Texas’Water Resources 65 State Water Plan: Issues and Funding in fiscal 2008 and 557.5 million in fiscal 2011.53 Residential users would see an estimated 48 cents per month average increase to their water bill while commercial customers would see a $4.66 monthly increase.54 A change in the number of exempted residential gallons would increase revenue for both the sales tax proposal and the water conservation fee pro- posal. Reducing the number of gallons exempted by 1,000 would increase average annual revenue amounts by $17.9 million for the sales tax and $9 million for the water conservation fee revenue, based on fiscal 2008. This also would result in a corresponding increase in the monthly water/ sewer bill of residential customers of an average of 20 cents for the sales tax and 10 cents for the water conservation fee. Supporters claim that this option would gener- ate sufficient revenue to replace general revenue funds for expected annual debt service payments associated with the State Water Plan for all but a few years. In the future, these revenues could also supplant some GO bond financing, depending on debt service demands. This fee is a small portion of the average monthly water bill and provides a residential exemption for basic water uses. The fee and exemption could also be changed based on estimated future needs. While costs may be Water Conservation and Development Fee Proposal Legislation introduced, but not passed, in the 79th Legislature in 2005 would have established a water conservation and development fee of $0.13 per 1,000 gallons used by consumers each month. The fee would have been collected by public water supply systems, remitted to the Comptroller and deposited to the Water Infrastructure Fund. The first 5,000 gallons of water used by a residen- tial customer each month would not be subject to the fee. Exemptions from the fee would have included governmental entities, educational, charitable and nonprofit organizations, and chambers of commerce, and could be expanded to include industrial users.45 Using this structure, estimated revenue would be $127.3 million in fiscal 2008 increasing to $130.0 million in fiscal year 2011. This is based on a tax- able amount of 978.8 billion gallons in fiscal 2008 and 1 trillion gallons in 2011 of residential, com- mercial, industrial and irrigation usages.52 Assuming exemption for industrial uses (as under the previous sales tax exemption), revenue would decrease by 44 percent to $70.7 million in fiscal 2008 and $72.5 million in fiscal 2011. Tax- able gallons for this estimate are 543.8 million Water Funding Mechanisms in Other States (continued) Minnesota Minnesota taxes commercial and industrial water sales at a rate of 7 percent. The state exempts housing authorities, non profits, governmental entities and ice manufacturers. Water permit holders pay a $140 minimum water use fee and a per million gallon fee based on the amount of water appropriated (or used). Maximum allowable fees range from $750 for an agricultural irrigation permit to $250,000 for cities with populations of more 100,000.50 Oregon Oregon charges a fee for water right transfers, permit amendments and exchanges. Water rights users are assessed a minimum fee of $200 or $400 depending on the intended use. The state also charges a fee based on the flow of water measured in cubic feet per second. These fees range from $80 to $200 per cubic feet per second, depending on use.51 Tennessee The state assesses a 7 percent sales tax on residential and commercial water utility accounts and a 1 per- cent rate on water sold to manufacturers.
  • 70.
    Liquid Assets: TheState of Texas’Water Resources Texas Comptroller of Public Accounts66 State Water Plan: Issues and Funding fee would apply to 7,090 municipal, industrial, irrigation, and mining water rights holders with an estimated 32.9 million acre-feet of authorized water. Water rights for hydroelectric, recreation, storage and environmental needs would be exempt. Average annual costs to water rights holders would increase approximately $10,906 for municipal permit holders and $44,421 for industrial permit holders. Costs to irrigation and mining permit holders would be significantly less, at $1,148 and $1,413 respectively.57 Increas- ing revenue from this fee would depend upon increased permitting or raising the fee amount. Supporters say that this proposal could be used to supplant some general revenue for debt service payments. Although some of the costs to munici- pal and industrial holders would be passed to resi- dential users, it would not be overly burdensome. This option generates the least amount of rev- enue and it may not provide enough money to cover the needs that have been identified. Water Connection Fee Proposal A water connection, or “tap fee,” would place a monthly charge on each water connection in the state. Applying a $1 monthly fee on residen- tial, commercial, irrigation and industrial users would generate an estimated $94.6 million in fiscal 2008, and increase to $97.3 million in fiscal 2011. This estimate is based on 7.9 million con- nections in fiscal 2008 and 8.1 million in fiscal 2011.58 Residential connections could account for 93.5 percent of the total revenue. This option would generate slightly more rev- enue than what is required for annual 2008- 09 debt service payments. The residential bill charge is slightly less than the sales tax and is a small portion of the water/sewage bill, meaning that it would not be a burdensome levy. Critics argue that this fee is not tied to water usage, includes no conservation component and is regressive. Residential customers would be the primary contributor of the fee since they make up over 90 percent of water connections in Texas, even though they account for only about 48 percent of water usage. passed on to the consumer, this plan would allow for more accurate pricing of water resources, improving efficiency in the market for this scarce resource. Construction of water infrastructure will pose a significant cost. From the standpoint of economic efficiency it would be most appropri- ate if those costs were accounted for in the goods that require expanded water supplies. On the other hand, critics point out that with industrial exemption, the fee would raise insuf- ficient funds, while industrial users would bear a heavy burden without an exemption. Although designed as a conservation measure, increased usage costs residential customers very little. Business interests suggest that it would be unfair for low-use residential customers to avoid pay- ing any fee while industrial users account for the largest share. There is the possibility that industrial users would pass on additional costs to the consumer, potentially reducing demand for some products. Water Rights Fee Proposal Surface water in Texas is owned by the state of Texas and requires a permit for use. The Texas Commission for Environmental Quality (TCEQ) administers water rights based on the principle of “prior appropriation,” which, in effect, means “first come, first served.” A water rights holder could be anyone from an individual landowner to a manufacturing firm, to a municipal water utility that provides water service to thousands of households.55 Currently, TCEQ collects an annual fee from water rights holders based on acre-feet of water rights held. In the case of municipal, industrial, agricultural or mining users, the fee is 22 cents per acre-foot up to 20,000 acre-feet, and 8 cents per acre-foot above 20,000 acre-feet. However, many of these entities are exempt under statute if they are paying the Water Quality Fee. As a result, revenues for this fee are low ($416,483 in fiscal 2006).56 The intent of the fee is to defray TCEQ’s costs associated with the water rights permitting program. Assessing a fee of $1.50 per acre-foot of autho- rized water on water rights holders would gener- ate an estimated $49.3 million annually. The
  • 71.
    Texas Comptroller ofPublic Accounts Liquid Assets: The State of Texas’Water Resources 67 State Water Plan: Issues and Funding increased significantly in the past few years, providing the possibility of steady revenue growth. Bottled water consumption is typically discretionary, as consumers could purchase other tax-exempt products or drink tap water. In rural areas where tap water is not available, tax exemptions could be structured to avoid taxa- tion of drinking water. Critics say this fee would not be related to water usage, and bottled water suppliers and consum- ers likely would object to being singled out. This tax would include no conservation component and would likely be regressive. Exhibit 42 shows the potential results of the funding mechanisms listed above. Fiscal impact numbers for the proposed funding mechanisms were generated by TWDB with help from TCEQ and the Comptroller’s office. Sales Tax on Bottled Water Proposal Removal of the state sales tax exemption for bottled water is estimated to generate $78 mil- lion of state sales tax revenue in fiscal 2008 to $101.8 million in fiscal 2011. This estimate is based on Texas bottled water sales of $1.2 billion and $1.6 billion, respectively. The 6.25 percent sales tax would apply to bottled water sold at retail (including gallons or larger), carbonated or seltzer water and cooler water delivered to homes and offices. Local sales and use taxes also would apply. Water delivered by tanker truck to residential wells or cisterns and water sold at community dispensers would be exempt from the sales tax.59 As proposed, the bottled water fee would not generate enough revenue supplant all general revenue for debt service payments. Propo- nents argue, however, that bottled water sales Exhibit 42 Proposed Funding Mechanisms Proposed Revenue Sources Fiscal 2008 Fiscal 2011 State Sales Tax $243,270,000 $266,579,375 State Sales Tax, industrial exemption $220,112,500 $242,837,500 Water Conservation and Development Fee $127,250,019 $130,001,766 Water Conservation and Development , industrial exemption $70,695,486 $72,479,123 Water Rights Fee $49,339,946 $49,339,946 Water Connection Fee $94,573,104 $97,280,928 Sales Tax on Bottled Water $78,000,000 $101,750,000 Source: Texas Water Development Board. and Texas Comptroller of Public Accounts
  • 72.
    Liquid Assets: TheState of Texas’Water Resources Texas Comptroller of Public Accounts68 State Water Plan: Issues and Funding 17 Texas Water Development Board, Water for Texas 2007 (Austin, Texas, January 2007), Volume I, pp. 23-24, http://www.twdb.state.tx.us/publications/ reports/State_Water_Plan/2007/2007StateWaterPlan/ vol%201_FINAL%20113006.pdf. (Last visited January 6, 2009.) 18 Texas Water Development Board, Water for Texas 2007, Volume I, pp. 24-25. 19 Texas Water Development Board, Water for Texas 2007, (Austin, Texas, January 2007), Volume I, pp. 8-10, http://www.twdb.state.tx.us/publications/ reports/State_Water_Plan/2007/2007StateWaterPlan/ vol%201_FINAL%20113006.pdf. (Last visited January 6, 2009.) 20 E-mail communication from Piper Montemayor, Debt and Portfolio manager, Texas Water Development Board, November 19, 2008. 21 Unpublished FY 2008 annual report from Piper Montemayor, Debt and Portfolio manager, Texas Water Development Board to Robert C. Kline, executive director, Texas Bond Review Board, September 18, 2008. 22 E-mail communication from Stuart Norvell, manager, Water Planning Research and Analysis, Texas Water Development Board, September 22, 2008; and data provided by Texas Water Development Board, “Non- Self Supporting General Obligation Water Bonds as of June 2008,” (Excel file); and Texas H.B. 1, p. VI-60, 80th Leg., Reg. Sess. (2007). 23 Texas Legislative Budget Board, Fiscal Size-Up: 2008- 09 Biennium (Austin, Texas, March 2008), p. 368, http://www.lbb.state.tx.us/Fiscal_Size-up/Fiscal%20 Size-up%202008-09.pdf. (Last visited January 6, 2009.) 24 Texas Water Development Board, “State Participation,” pp. 1-4, http://www.twdb.state. tx.us/assistance/financial/fin_infrastructure/ StateParticipation.asp. (Last visited January 6, 2009.); and Texas Water Development Board, “Water Infrastructure Fund Loan Program,” pp. 1-2, http:// www.twdb.state.tx.us/assistance/financial/fin_ infrastructure/WIF.asp. (Last visited January 6, 2009.) 25 Texas Legislative Budget Board, Fiscal Size-Up: 2008- 09 Biennium (Austin, Texas, March 2008), p. 370, http://www.lbb.state.tx.us/Fiscal_Size-up/Fiscal%20 Size-up%202008-09.pdf. (Last visited January 6, 2009.) 26 E-mail communication from Piper Montemayor, Debt and Portfolio manager, Texas Water Development Board, October 9, 2008; and data provided by Texas Water Development Board, “Project Financial Assistance Programs.” 27 Texas Legislative Budget Board, Fiscal Size-Up: 2008- 09 Biennium (Austin, Texas, March 2008), p. 370; and Texas Water Development Board, Economically Distressed Areas Program: Counties with EDAP Projects in Progress or Completed: 24 (Austin, Texas, August 31, 2008), p. 3, http://www.twdb.state.tx.us/ Endnotes 1 Texas Water Development Board, Water for Texas 2007 (Austin, Texas, January 2007), Volume I, p. 13. http://www.twdb.state.tx.us/publications/reports/ State_Water_Plan/2007/2007StateWaterPlan/ vol%201_FINAL%20113006.pdf. (Last visited January 5, 2009.) 2 Rudolf Bush, “Judge Blocks Dallas Plans for Fastrill Reservoir in East Texas,” Dallas Morning News (July 1, 2008), http://www.dallasnews.com/sharedcontent/ dws/news/localnews/stories/070208dnmetreservoir.3f c13e6.html. (Last visited January 6, 2009.) 3 Texas Water Development Board, Water for Texas 2007, Volume I, pp. 11-16. (Last visited January 5, 2009.) 4 Texas House of Representatives, House Research Organization, Major Issues of the 80th Legislature, Regular Session (Austin, Texas, July 17, 2007), p. 57, http://www.hro.house.state.tx.us/focus/major80.pdf. (Last visited January 6, 2009.) 5 Greg Bowen, “Water Issues Volatile,” The Victoria Advocate (January 17, 2005). 6 Texas Water Development Board, Water for Texas 2007, Volume I, pp. 16-17. 7 Houston & Texas Central Railroad Company v. W. A. East, 98 Tex. 146, 81 S.W. 279, 1904 Tex. LEXIS 228 (1908). 8 Texas House of Representatives, House Research Organization, “Groundwater Management Issues in Texas,” by Tedd Holladay (Austin, Texas, June 6, 2006), pp. 2-3, http://www.hro.house.state.tx.us/focus/ groundwater79-14.pdf (Last visited on January 26, 2009.) 9 Tex. Water Code §36.0015 (Vernon 1997 & Supp. 2001). 10 Texas Water Development Board, “GCD Facts,” p. 1, http://www.twdb.state.tx.us/gwrd/gcd/facts.htm. (Last visited January 26, 2009.) 11 Texas Water Development Board, Water for Texas 2007, Volume I, pp. 17-19. 12 Texas House of Representatives, House Research Organization, Major Issues of the 80th Legislature, Regular Session (Austin, Texas, July 17, 2007), p. 58, http://www.hro.house.state.tx.us/focus/major80.pdf. (Last visited January 6, 2009.) 13 Texas Commission on Environmental Quality, “Revised Environmental Flows Timeline-SB3/HB3 Revised Schedule,” http://www.tceq.state.tx.us/ permitting/water_supply/water_rights/eflows/group. html. (Last visited January 6, 2009.) 14 Texas Office of the Governor, “Gov. Perry Names Two to Environmental Flows Advisory Group,” p. 1, http:// governor.state.tx.us/news/appointment/2701. (Last visited January 6, 2009.) 15 Texas Water Development Board, Water for Texas 2007, Volume I, pp. 19-21. 16 Texas House of Representatives, House Research Organization, Major Issues of the 80th Legislature, Regular Session, p. 57.
  • 73.
    Texas Comptroller ofPublic Accounts Liquid Assets: The State of Texas’Water Resources 69 State Water Plan: Issues and Funding publications/reports/Colonias/status.pdf. (Last visited January 6, 2009.) 28 Texas H.B. 1, p. VI-60, 80th Leg., Reg. Sess. (2007). 29 Texas Water Development Board, “Water Infrastructure Fund Loan Program,” pp. 1-2. 30 Texas Water Development Fund, “Agricultural Water Conservation Loan Program,” p. 1, http://www.twdb. state.tx.us/assistance/financial/fin_infrastructure/ awcfund.asp. (Last visited January 6, 2009.) 31 E-mail communication from Piper Montemayor, Debt and Portfolio manager, Texas Water Development Board, October 9, 2008; and data provided by Texas Water Development Board, “Project Financial Assistance Programs.” 32 E-mail communication from Piper Montemayor, Debt and Portfolio manager, Texas Water Development Board, October 9, 2008; and data provided by Texas Water Development Board, “Project Financial Assistance Programs.” 33 E-mail communication from Piper Montemayor, Debt and Portfolio Manager, Texas Water Development Board, October 9, 2008; and data provided by Texas Water Development Board, “Project Financial Assistance Programs.” 34 Texas Water Development Fund, “Rural Water Assistance Fund (RWAF) Program,” pp. 1-2, http://www.twdb.state.tx.us/assistance/financial/ fin_infrastructure/RWAF.asp. (Last visited January 7, 2009.) 35 E-mail communication from Piper Montemayor, Debt and Portfolio Manager, Texas Water Development Board, October 9, 2008; and data provided by Texas Water Development Board, “Project Financial Assistance Programs.” 36 Texas Legislative Budget Board, Fiscal Size-Up: 2008- 09 Biennium, p. 368. 37 E-mail communication from Piper Montemayor, Debt and Portfolio Manager, Texas Water Development Board, October 9, 2008; and data provided by Texas Water Development Board, “Project Financial Assistance Programs.” 38 E-mail communication from Piper Montemayor, Debt and Portfolio Manager, Texas Water Development Board, October 9, 2008; and data provided by Texas Water Development Board, “Project Financial Assistance Programs.” 39 U.S. Environmental Protection Agency, “Clean Water SRF Federal Capitalization Grants, by Federal Fiscal Year of Award, by State,” p. 2, http://www.epa.gov/ owm/cwfinance/cwsrf/cwnims/pdf/capfedst.pdf. (Last visited January 7, 2009.); and data provided by Texas Water Development Board, “Texas Water Development Board Program Summary as of August 31, 2008.” (Excel file.) 40 Texas Water Development Board, “Drinking Water State Revolving Fund (DWSRF) Loan Program,” p. 2, http://www.twdb.state.tx.us/assistance/financial/ fin_infrastructure/dwsrf.asp. (Last visited January 7, 2009.) 41 U.S. Environmental Protection Agency, “DWSRF Annual Allotments by Fiscal Year,” http://www.epa. gov/safewater/dwsrf/allotments/funding_dwsrf_ allotments.html. (Last visited January 7, 2009.) ; and e-mail communication from Piper Montemayor, October 23, 2008; and information provided by Texas Water Development Board, “10.14.08 LBB chart for Water Primer,” (Excel file) with Texas Comptroller’s Office calculations. 42 E-mail communication from Stuart Norvell, manager, Water Planning Research and Analysis, Texas Water Development Board, October 8, 2008; and Texas Water Development Board, “Table 1: Potential Revenues Generated from a Sales Tax on Retail Water Service Provided by Community Public Water Suppliers in Texas ($ millions)” and “Table 2: Potential Revenues Generated from a Sales Tax on Retail Sewer Service Provided by Community Public Water Suppliers in Texas ($ millions)” with Texas Comptroller’s Office calculations. 43 Texas Water Development Board, Water for Texas 2007, Volume II, p. 128 with Texas Comptroller’s Office calculations. 44 E-mail communication from Stuart Norvell, manager, Water Planning Research and Analysis, Texas Water Development Board, September 22, 2008; and Texas Water Development Board, Potential Revenue Sources for Funding Texas Water Programs (Austin, Texas, May 11, 2008), pp. 3-7; and “Table 1: Potential Revenues Generated from a Sales Tax on Retail Water Service Provided by Community Public Water Suppliers in Texas ($ millions)” and “Table 2: Potential Revenues Generated from a Sales Tax on Retail Sewer Service Provided by Community Public Water Suppliers in Texas ($ millions)” with Texas Comptroller’s Office calculations. 45 Texas S.B. 3, 79th Leg., Reg. Sess. (2005). 46 Texas Water Development Board, Potential Revenue Sources for Funding Texas Water Programs, pp. 14-19, with Texas Comptroller’s Office calculations. 47 University of Arkansas, Division of Agriculture, Public Policy Center, Partners in Protecting Arkansas’ Waterbodies (Little Rock, Arkansas, 2008), http:// www.uaex.edu/Other_Areas/publications/PDF/ FSPPC103.pdf. (Last visited January 7, 2009.) 48 Kansas Legislative Research Department, Agriculture and Natural Resources: B-3 State Water Plan Fund, Kansas Water Authority, and State Water Plan (Topeka, Kansas, 2008), pp. 1-2, http://skyways. lib.ks.us/ksleg/KLRD/Publications/2008Briefs/B- 3StateWaterPlanFund.pdf. (Last visited January 7, 2009.) 49 Michigan Department of Environmental Quality, “Fee Schedule Community Water Systems,” and “Questions and Answers to Explain Michigan Public Water Supply Annual Fees,” http://www. michigan.gov/documents/deq/deq-wd-water-fos-tsu- CWSAnnualFee_247740_7.pdf. (Last visited January 7, 2009.)
  • 74.
    Liquid Assets: TheState of Texas’Water Resources Texas Comptroller of Public Accounts70 State Water Plan: Issues and Funding 50 Minnesota Department of Natural Resources, “Water Use Fee Rates,” http://www.dnr.state.mn.us/waters/ watermgmt_section/appropriations/feerates.html. (Last visited January 7, 2009.) 51 State of Oregon, Water Resources Department, “Fee Schedule as of July 1, 2007,” pp. 4-5, http://www1.wrd. state.or.us/pdfs/fees2007.pdf. (Last visited October 20, 2008.) 52 E-mail communication from Stuart Norvell, manager, Water Planning Research and Analysis, Texas Water Development Board, October 8, 2008; and data provided by Texas Water Development Board, “Table 5: Potential Revenues Generated from a Water Conservation and Development Fee as Proposed Under Senate Bill 3 of the 79th Texas Legislature ($millions).” 53 E-mail communication from Stuart Norvell, manager, Water Planning Research and Analysis, Texas Water Development Board, September 22, 2008; and Texas Water Development Board, Potential Revenue Sources for Funding Texas Water Programs, pp. 8-9, with Texas Comptroller’s Office calculations. 54 Texas Water Development Board, Potential Revenue Sources for Funding Texas Water Programs, pp. 8-9. 55 Texas Commission on Environmental Quality, “Water Rights: Am I Regulated?” , http://www.tceq. state.tx.us/permitting/water_supply/water_rights/ wr_amiregulated.html. (Last visited January 7, 2009.) 56 Texas Legislative Budget Board, Agency Fee Survey 2006 (Austin, Texas, 2008), p. 408, http://www. lbb.state.tx.us/Other_Pubs?Agency_Fee%20 Survey_2006_0107.pdf. (Last visited January 7, 2009.) 57 Texas Water Development Board, Potential Revenue Sources for Funding Texas Water Programs, p. 10. 58 Texas Water Development Board, Potential Revenue Sources for Funding Texas Water Programs, p. 11. 59 Texas Water Development Board, Potential Revenue Sources for Funding Texas Water Programs, p. 12.
  • 75.
    Texas Comptroller ofPublic Accounts Liquid Assets: The State of Texas’Water Resources 71 Conclusion • adequacy — the financing mechanism should be sufficient to cover identified costs without excessively burdening those who pay the fees. • equity — the financial burden of water proj- ects should be spread among all water user groups in proportion to their demand for water. It should not favor certain user groups or projects. • specificity — funds raised for water develop- ment projects should not be diverted for other budgetary obligations. • affordability — the plan should be sensitive to water users’ ability to pay, since a certain level of water consumption is nondiscretionary and essential for every Texan’s health. No plan Given Texas’ growing population, the develop- ment and protection of our water resources is one of the most pressing long-term issues fac- ing lawmakers. Ensuring clean and dependable water supplies will be essential to protect the health of Texas citizens and the strength of the state’s economy. With the 1997 initiation of the regional water planning process, Texas took an important step toward coordinating the water needs of com- munities across the state. This role will continue and may become more prominent as policymak- ers consider dedicated funding for community water projects. In evaluating proposals for water project fund- ing, policymakers should seek the appropriate balance among these criteria: Conclusion Lady Bird Lake in Austin, Texas
  • 76.
    Liquid Assets: TheState of Texas’Water Resources Texas Comptroller of Public Accounts72 Conclusion should unduly burden individuals who might have difficulty paying for it. • simplicity — the plan should be easy to ad- minister, understand and follow. • conservation — the financing system should be consistent with the goal of water conserva- tion and discourage inefficient usage. If Texas state government continues moving toward greater involvement in financing water projects, a dedicated funding source for water projects may prove useful. However, with this more active state role in regional water planning, policymakers will increasingly look to ensure that the water planning process effectively serves the interests of all Texas citizens. To do so, two key issues should be explored further. Conservation Conservation is often cited as the first goal of any water development plan, since it is the most cost-effective and sustainable water manage- ment strategy. One concern is the varying levels of conservation effort made by municipalities across the state. Several cities have already made extensive and successful efforts to reduce their water use, while others plan to rely on increased conservation measures to meet growing demand in the future. Accountability Another concern identified by the review team was the manner in which different regional wa- ter planning groups are required to report their water needs. The “bottom-up” approach current- ly employed in Texas allows communities and regions to develop their own estimates for future water needs and project recommendations. While this system has many benefits, including the ability for local stakeholders to determine the direction of water policy decisions that will affect their communities, it may encourage re- gions to include marginal projects in their plans. Many water development projects are extremely expensive, and some projects such as reservoirs can have substantial environmental and social consequences. Policymakers may want to con- sider strengthening oversight and accountability measures to ensure that they fund only those projects that are truly necessary. Regional water planning will play an important role in the future of the Lone Star State. Start- ing with the passage of SB 1 in 1997, policy- makers in Texas have shown a willingness to confront this challenging issue head-on. Since the passage of SB 1, Texas has taken many steps to ensure that citizens, businesses and agri- cultural producers have enough water to serve their needs, while safeguarding environmental needs of our rivers, bays and estuaries. The coming years will require continued attention to this issue, to ensure that all Texans have ac- cess to the water they need to thrive.
  • 77.
    Texas Comptroller ofPublic Accounts Liquid Assets: The State of Texas’Water Resources 73 Acknowledgements Acknowledgements Darrel Andrews, Tarrant Regional Water District Carl Anderson, Texas A&M University Carolyn L. Brittin, Texas Water Development Board Eddie Brown, City of Sweetwater, TX Patrick Brzozowski, Lavaca-Navidad River Authority (Region P) John Burke, Lower Colorado Regional Water Planning Group Donovan Burton, San Antonio Water System Trey Buzbee, Region G Water Planning Group Curtis Campbell, Region B Water Planning Group Teddy Carter, Texas Senate Natural Resources Committee Alan Cockrell, Schertz-Seguin Local Government Corporation Jaime Estrada, Brownsville Public Utility Board Genoveva Gomez, Brownsville Public Utility Board Robert Gulley, Edwards Aquifer Restoration Implementation Plan Charlie Hastings, City of Kerrville, TX Stan Hayes, Hayes Engineering Celena Hemmeter, City of Eden, TX Myron Hess, National Wildlife Federation Kelley Holcomb, East Texas Water Region Bill Hutchison, El Paso Water Utilitiy Rick Illgner, Edwards Aquifer Authority Glenn Jarvis, Rio Grande Water Planning Group Mary E. Kelly, Environmental Defense Ken Kramer, Lone Star Chapter of the Sierra Club Johnathan Letz, Region J Water Planning Group Con Mims, South Central Texas Regional Water Planning Group Piper Montemayor, Texas Water Development Board Bill Mullican, Texas Water Development Board Bill Norris, NRS Consulting Engineers Stuart D. Norvell, Texas Water Development Board James M. Parks, Region C Water Planning Group Kenneth Reneau, Angelina & Neches River Authority Mike Rickman, North Texas Municipal Water District Joe Rippole, San Antonio Water System Walt Sears, Region D Water Planning Group Aubrey Spear, Lubbock Water Utilities Charlie Stringer, Dallas Water Utilities Michael Thane, City of Round Rock Jim Thompson, Region D Water Planning Group Jeff Walker, Texas Water Development Board J. Kevin Ward, Texas Water Development Board Jake White, NRS Consulting Engineers C.E. Williams, Panhandle Water Planning Group