TPN1333 Food Packagingand Storage Technology
Food Science and Technology Department
Faculty of Agricultural Engineering and Technology, IPB
Internationally Approved Food Technology Program by IFT and IUFoST
Food Shelf-life Evaluation –
Accelerated Shelf-life Test
2.
Internationally Recognized UndergraduateProgram by IFT & IUFoST
2
Learning Outcome
Upon successful completion of this topic,
students will be able to:
determine the shelf life of food by using
accelerated shelf life test (Arrhenius and
Labuza Equation).
Internationally Recognized UndergraduateProgram by IFT & IUFoST
Shelf-life Prediction Model (ASLT Method)
ASLT
Method
Arrhenius
Critical Moisture
Content
MSI Curve
Model
Modified MSI
Model
5.
Internationally Recognized UndergraduateProgram by IFT & IUFoST
Data Extrapolation Method by ASLT
Storage Condition
Data
Extrapolation
Laju
kerusakan
Accelerating Factors
6.
Internationally Recognized UndergraduateProgram by IFT & IUFoST
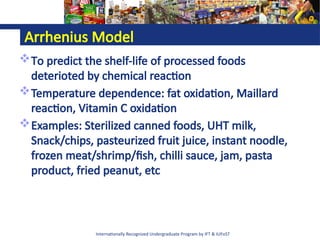
Arrhenius Model
To predict the shelf-life of processed foods
deterioted by chemical reaction
Temperature dependence: fat oxidation, Maillard
reaction, Vitamin C oxidation
Examples: Sterilized canned foods, UHT milk,
Snack/chips, pasteurized fruit juice, instant noodle,
frozen meat/shrimp/fish, chilli sauce, jam, pasta
product, fried peanut, etc
Internationally Recognized UndergraduateProgram by IFT & IUFoST
Experimental Steps
Identify product
characteristics
Identify critical
parameters
Determine anal.
method
Experiment:
Storage T, t
Data collection
Determine Qo
and Qc
Data analysis:
Determine reaction order
(0 or 1)
Determine kT
Determine kT at storage
temp. (Arrhenius model
Calculate SL
Select significant critical
parameters
Verification
9.
Internationally Recognized UndergraduateProgram by IFT & IUFoST
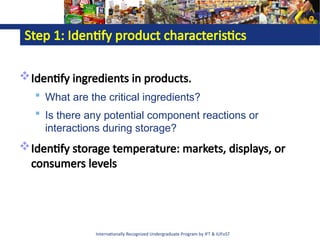
Step 1: Identify product characteristics
Identify ingredients in products.
What are the critical ingredients?
Is there any potential component reactions or
interactions during storage?
Identify storage temperature: markets, displays, or
consumers levels
10.
Internationally Recognized UndergraduateProgram by IFT & IUFoST
Step 2: Identify Critical Parameters Causing Product
Deterioration
Based on experience, what are the major quality attributes
cause product rejection?
Rancidity (fat oxidation): FFA, TBA value.
Colour change (Maillard reaction): color measurement
If unknown well, select several potential critical parameters.
If any product claim, select as a critical parameters
Exp. rich in DHA/EPA.
Commercially sterilized canned foods: product deterioration is
not caused by microbiological factors
11.
Internationally Recognized UndergraduateProgram by IFT & IUFoST
Step 3: Determine Analytical Methods
Analysis:
Fat oxidation: TBA value, peroxide value
Maillard reaction: Color measurement by
colorimeter
Sensory evaluation: Rancid odor, color
Consider cost for analysis
12.
Internationally Recognized UndergraduateProgram by IFT & IUFoST
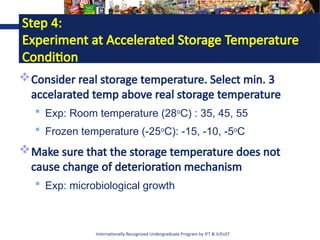
Step 4:
Experiment at Accelerated Storage Temperature
Condition
Consider real storage temperature. Select min. 3
accelarated temp above real storage temperature
Exp: Room temperature (28o
C) : 35, 45, 55
Frozen temperature (-25o
C): -15, -10, -5o
C
Make sure that the storage temperature does not
cause change of deterioration mechanism
Exp: microbiological growth
13.
Internationally Recognized UndergraduateProgram by IFT & IUFoST
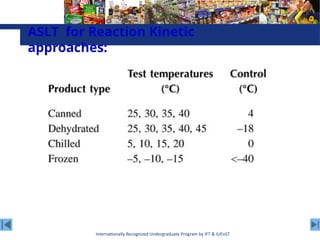
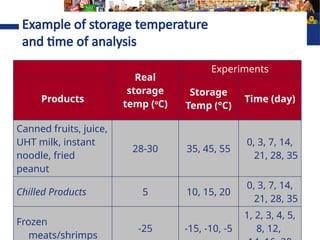
Example of storage temperature
and time of analysis
Real
storage
temp (o
C)
Experiments
Products
Storage
Temp (°C)
Time (day)
Canned fruits, juice,
UHT milk, instant
noodle, fried
peanut
28-30 35, 45, 55
0, 3, 7, 14,
21, 28, 35
Chilled Products 5 10, 15, 20
0, 3, 7, 14,
21, 28, 35
Frozen
meats/shrimps
-25 -15, -10, -5
1, 2, 3, 4, 5,
8, 12,
14.
Internationally Recognized UndergraduateProgram by IFT & IUFoST
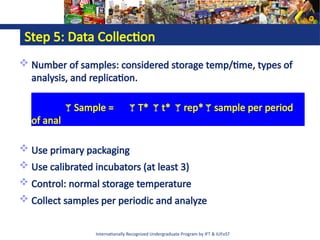
Step 5: Data Collection
Number of samples: considered storage temp/time, types of
analysis, and replication.
Sample = T* t* rep*sample per period
of anal
Use primary packaging
Use calibrated incubators (at least 3)
Control: normal storage temperature
Collect samples per periodic and analyze
Internationally Recognized UndergraduateProgram by IFT & IUFoST
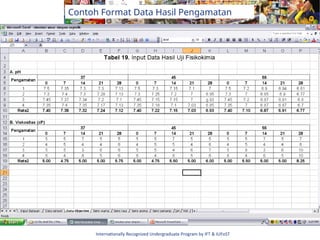
Step 5: Data Collection
Tabulate analytical data in table formats.
Use separate table for each quality parameters (Excel)
Calculate average for each data.
Internationally Recognized UndergraduateProgram by IFT & IUFoST
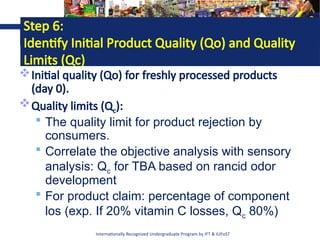
Step 6:
Identify Initial Product Quality (Qo) and Quality
Limits (Qc)
Initial quality (Qo) for freshly processed products
(day 0).
Quality limits (Qc):
The quality limit for product rejection by
consumers.
Correlate the objective analysis with sensory
analysis: Qc for TBA based on rancid odor
development
For product claim: percentage of component
los (exp. If 20% vitamin C losses, Qc 80%)
19.
Internationally Recognized UndergraduateProgram by IFT & IUFoST
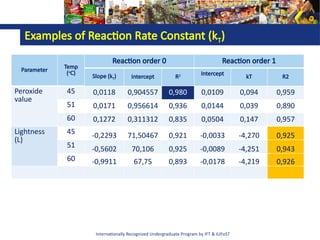
Step 7:
Determine Order Reaction abd kT
Plot graphic: Quality (Qt) vs time (t, day) according
to Order 0 and 1.
Order 0 : Qt = Qo – kTt
Order 1 : LnQt = LnQo – kTt
Determine equation model: kT (slope) and R2
.
Reaction order 0 or 1: select kT with higher R2:
20.
Internationally Recognized UndergraduateProgram by IFT & IUFoST
Step 7:
Determine ReactionOrder and kT
The predicted shelf life for zero order will be shorter
than first order
t
Ln
Q
Slope = - kT
Order 1
T1
T2
T3
t
Q
Slope = - kT
Order 0
T1
T2
T3
21.
Internationally Recognized UndergraduateProgram by IFT & IUFoST
Step 8:
Select Significant Critical Parameters
Consider :
R2
of reaction rate constants (kT) :
Usually >
0.75
kT increase consistently by temperature
22.
Internationally Recognized UndergraduateProgram by IFT & IUFoST
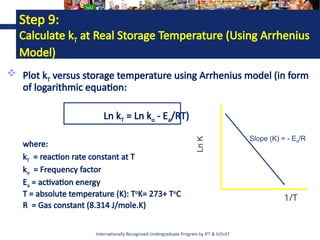
Step 9:
Calculate kT at Real Storage Temperature (Using Arrhenius
Model)
Plot kT versus storage temperature using Arrhenius model (in form
of logarithmic equation:
Ln kT = Ln ko - Ea/RT)
where:
kT = reaction rate constant at T
ko = Frequency factor
Ea = activation energy
T = absolute temperature (K): To
K= 273+ To
C
R = Gas constant (8.314 J/mole.K)
Ln
K
Slope (K) = - Ea/R
1/T
23.
Internationally Recognized UndergraduateProgram by IFT & IUFoST
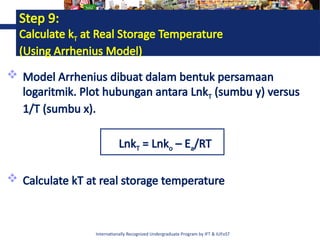
Step 9:
Calculate kT at Real Storage Temperature
(Using Arrhenius Model)
Model Arrhenius dibuat dalam bentuk persamaan
logaritmik. Plot hubungan antara LnkT (sumbu y) versus
1/T (sumbu x).
LnkT = Lnko – Ea/RT
Calculate kT at real storage temperature
24.
Internationally Recognized UndergraduateProgram by IFT & IUFoST
Tahap 10:
Calculate Predicted Shelf-life
Shelf-life (ts) at a storage temperature:
Order 0 : ts = (Qo-Qs)/kT
Order 1 : ts = [ln(Qo/Qs)]/kT
kT comes from Arrhenius equation
Plot graphics storage temp vs shelf-life
Shelf-life
(day)
Storage Temp (o
C)
25.
Internationally Recognized UndergraduateProgram by IFT & IUFoST
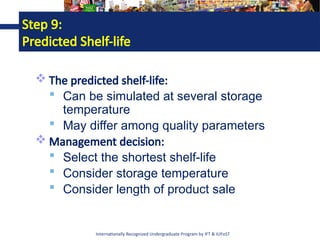
Step 9:
Predicted Shelf-life
The predicted shelf-life:
Can be simulated at several storage
temperature
May differ among quality parameters
Management decision:
Select the shortest shelf-life
Consider storage temperature
Consider length of product sale
26.
Internationally Recognized UndergraduateProgram by IFT & IUFoST
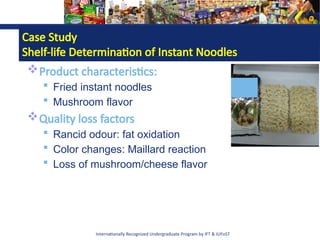
Case Study
Shelf-life Determination of Instant Noodles
Product characteristics:
Fried instant noodles
Mushroom flavor
Quality loss factors
Rancid odour: fat oxidation
Color changes: Maillard reaction
Loss of mushroom/cheese flavor
27.
Internationally Recognized UndergraduateProgram by IFT & IUFoST
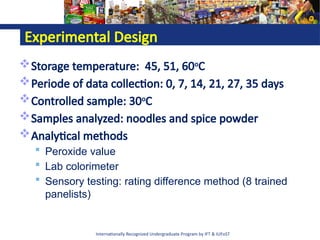
Experimental Design
Storage temperature: 45, 51, 60o
C
Periode of data collection: 0, 7, 14, 21, 27, 35 days
Controlled sample: 30o
C
Samples analyzed: noodles and spice powder
Analytical methods
Peroxide value
Lab colorimeter
Sensory testing: rating difference method (8 trained
panelists)
Internationally Recognized UndergraduateProgram by IFT & IUFoST
Step 9:
Verification and Monitoring
To verify between predicted and actual shelf-life
Store and observe products at actual storage
temperature
Internationally Recognized UndergraduateProgram by IFT & IUFoST
Shelf-life Prediction Model (ASLT Method)
ASLT
Method
Arrhenius
Critical
Moisture Content
Critical Moisture
Content Model
Modified CMC
Model
34.
Courtesy of FeriKusnandar/ITP/Fateta/IPB November 28, 2025
Critical Moisture Content/ MSI
Method
35.
Internationally Recognized UndergraduateProgram by IFT & IUFoST
ASLT:
Critical Moisture Content Method
Product deterioration due to water absorption. Exp:
biscuits, chips, flour
Loss of quality: agglomeration, loss of crispiness,
incresed stickiness
No chemical reaction effect is considered
Critical moisture content (Mc): level of moisture when
product is rejected sensorically
Time to reach critical moisture content (Mo-Mc):
product shelf-life
36.
Internationally Recognized UndergraduateProgram by IFT & IUFoST
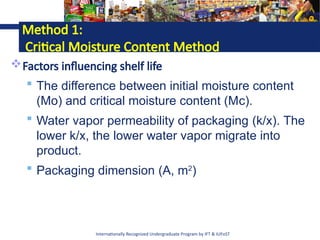
Method 1:
Critical Moisture Content Method
Factors influencing shelf life
The difference between initial moisture content
(Mo) and critical moisture content (Mc).
Water vapor permeability of packaging (k/x). The
lower k/x, the lower water vapor migrate into
product.
Packaging dimension (A, m2
)
37.
Internationally Recognized UndergraduateProgram by IFT & IUFoST
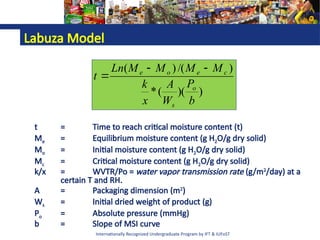
Labuza Model
t = Time to reach critical moisture content (t)
Me = Equilibrium moisture content (g H2O/g dry solid)
Mo = Initial moisture content (g H2O/g dry solid)
Mc = Critical moisture content (g H2O/g dry solid)
k/x = WVTR/Po = water vapor transmission rate (g/m2
/day) at a
certain T and RH.
A = Packaging dimension (m2
)
Ws = Initial dried weight of product (g)
Po = Absolute pressure (mmHg)
b = Slope of MSI curve
)
)(
(
*
)
/(
)
(
b
P
W
A
x
k
M
M
M
M
Ln
t
o
s
c
e
o
e
38.
Internationally Recognized UndergraduateProgram by IFT & IUFoST
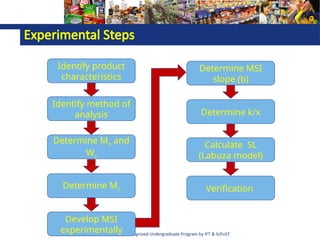
Experimental Steps
Identify product
characteristics
Identify method of
analysis
Determine Mo and
Ws
Determine Mc
Develop MSI
experimentally
Determine MSI
slope (b)
Determine k/x
Calculate SL
(Labuza model)
Verification
39.
Internationally Recognized UndergraduateProgram by IFT & IUFoST
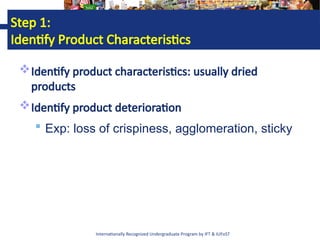
Step 1:
Identify Product Characteristics
Identify product characteristics: usually dried
products
Identify product deterioration
Exp: loss of crispiness, agglomeration, sticky
40.
Internationally Recognized UndergraduateProgram by IFT & IUFoST
Critical Parameter
Example: survey to consumer for biscuits
Critical parameter: Texture
0
5
10
15
20
25
30
35
Tekstur Rasa Aroma Warna
Texture Taste Aroma Color
Internationally Recognized UndergraduateProgram by IFT & IUFoST
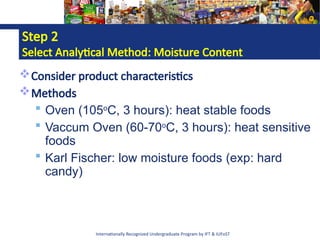
Step 3:
Determine Mo and Ws
Freshly processed products
Mo: Avarage of Initial Moisture contents (db), minimal
10 times measurement
Ws : weight of product corrected by its Mo
1 -
Mo
1 + Mo
x 100
% Solid =
Ws = m (weight basis) x % solid (g)
43.
Internationally Recognized UndergraduateProgram by IFT & IUFoST
Step 4:
Determine Critical Moisture Content (Mc)
Store product at high RH (91% or 96%) with
packaging or at open air (without packaging).
Develop sensory sheet of quality parameters
Observe periodically (per hour) by trained panelists
(5-7) until product starts to loss of quality.
Measure moisture content when product started to
be rejected: Mc
44.
Internationally Recognized UndergraduateProgram by IFT & IUFoST
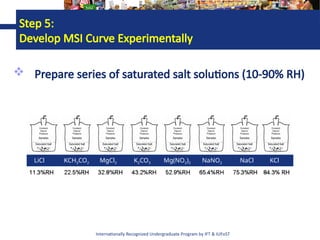
Step 5:
Develop MSI Curve Experimentally
Prepare series of saturated salt solutions (10-90% RH)
LiCl KCH3CO2 MgCl2 K2CO3 Mg(NO2)2 NaNO2 NaCl KCl
Internationally Recognized UndergraduateProgram by IFT & IUFoST
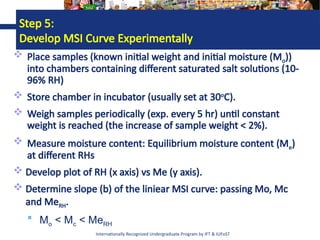
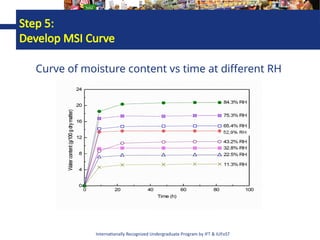
Step 5:
Develop MSI Curve Experimentally
Place samples (known initial weight and initial moisture (Mo))
into chambers containing different saturated salt solutions (10-
96% RH)
Store chamber in incubator (usually set at 30o
C).
Weigh samples periodically (exp. every 5 hr) until constant
weight is reached (the increase of sample weight < 2%).
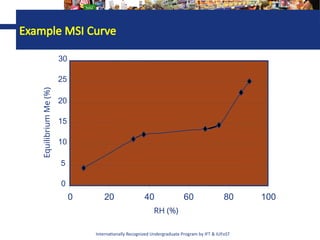
Measure moisture content: Equilibrium moisture content (Me)
at different RHs
Develop plot of RH (x axis) vs Me (y axis).
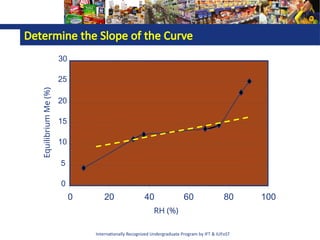
Determine slope (b) of the liniear MSI curve: passing Mo, Mc
and MeRH.
Mo < Mc < MeRH
Internationally Recognized UndergraduateProgram by IFT & IUFoST
Step 6:
Determine Me at Storage RH
Determine Me from the liniear equation of MSI
curve.
Various storage RHs can be simulated
50.
Internationally Recognized UndergraduateProgram by IFT & IUFoST
Step 7:
Water Vapor Permability and
Surface Area of Packaging
k/x : check packaging specification/certificate of
analysis
When WVTR at RH at T known:
k/x = WVTR/Po; Po at T
A is two side surface area of primary packaging
51.
Internationally Recognized UndergraduateProgram by IFT & IUFoST
Tahap 8:
Calculate Shelf-life
Input the experimental data into Labuza model
)
)(
(
*
)
/(
)
(
b
P
W
A
x
k
M
M
M
M
Ln
t
o
s
c
e
o
e
52.
Internationally Recognized UndergraduateProgram by IFT & IUFoST
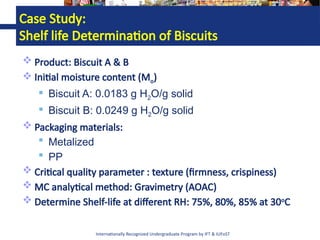
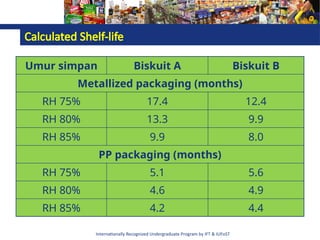
Case Study:
Shelf life Determination of Biscuits
Product: Biscuit A & B
Initial moisture content (Mo)
Biscuit A: 0.0183 g H2O/g solid
Biscuit B: 0.0249 g H2O/g solid
Packaging materials:
Metalized
PP
Critical quality parameter : texture (firmness, crispiness)
MC analytical method: Gravimetry (AOAC)
Determine Shelf-life at different RH: 75%, 80%, 85% at 30o
C
53.
Internationally Recognized UndergraduateProgram by IFT & IUFoST
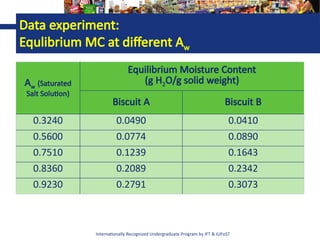
Data experiment:
Equlibrium MC at different Aw
Aw (Saturated
Salt Solution)
Equilibrium Moisture Content
(g H2O/g solid weight)
Biscuit A Biscuit B
0.3240 0.0490 0.0410
0.5600 0.0774 0.0890
0.7510 0.1239 0.1643
0.8360 0.2089 0.2342
0.9230 0.2791 0.3073
Courtesy of FeriKusnandar/ITP/Fateta/IPB November 28, 2025
Modified Critical Moisture Content
Method
58.
Internationally Recognized UndergraduateProgram by IFT & IUFoST
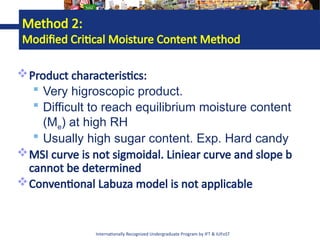
Method 2:
Modified Critical Moisture Content Method
Product characteristics:
Very higroscopic product.
Difficult to reach equilibrium moisture content
(Me) at high RH
Usually high sugar content. Exp. Hard candy
MSI curve is not sigmoidal. Liniear curve and slope b
cannot be determined
Conventional Labuza model is not applicable
59.
Internationally Recognized UndergraduateProgram by IFT & IUFoST
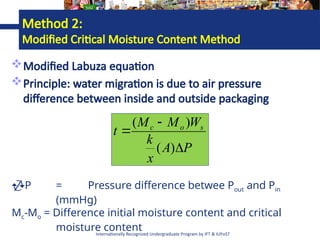
Modified Labuza equation
Principle: water migration is due to air pressure
difference between inside and outside packaging
P
A
x
k
W
M
M
t s
o
c
)
(
)
(
P = Pressure difference betwee Pout and Pin
(mmHg)
Mc-Mo = Difference initial moisture content and critical
moisture content
Method 2:
Modified Critical Moisture Content Method
60.
Internationally Recognized UndergraduateProgram by IFT & IUFoST
Water migration due to air pressure difference
If Pout > Pin, water vapor migrates from outside to
inside. Moisture content of product will increase
If Pout < Pin, water vapor migrates from inside to
outside (product will dry, less moisture content).
In shelf-life model: Pout>Pin
If it is assumed that RH inside packaging = aw*100,
So: Pin = aw*Po
Time for water migration to reach Mc : product shelf
life
Principle of Modified Critical Moisture Content Method
61.
Internationally Recognized UndergraduateProgram by IFT & IUFoST
Experimental Steps
Identify product
characteristics
Identify method of
analysis
Determine Mo and
Ws
Determine Mc
Measure initial Aw
of product
Calculate P
Determine k/x
Calculate SL
(Labuza model)
Verification
62.
Internationally Recognized UndergraduateProgram by IFT & IUFoST
Step 6:
Determine Air Pressure Difference (P)
Pout = Po* RH
Pin = Po* Aw
Po : water pressure at certain temperature (water
vapor table; Labuza, 1982).
63.
Internationally Recognized UndergraduateProgram by IFT & IUFoST
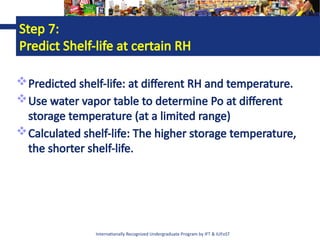
Step 7:
Predict Shelf-life at certain RH
Predicted shelf-life: at different RH and temperature.
Use water vapor table to determine Po at different
storage temperature (at a limited range)
Calculated shelf-life: The higher storage temperature,
the shorter shelf-life.
64.
Internationally Recognized UndergraduateProgram by IFT & IUFoST
Tahap 7:
Predict Shelf-life at Certain RH
The determinant of product shelf-life:
Type of packaging
Storage temperature and RH
Initial moisture content
Initial aw
65.
Internationally Recognized UndergraduateProgram by IFT & IUFoST
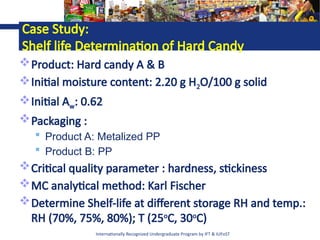
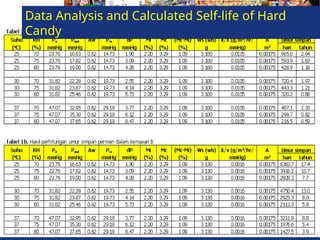
Case Study:
Shelf life Determination of Hard Candy
Product: Hard candy A & B
Initial moisture content: 2.20 g H2O/100 g solid
Initial Aw: 0.62
Packaging :
Product A: Metalized PP
Product B: PP
Critical quality parameter : hardness, stickiness
MC analytical method: Karl Fischer
Determine Shelf-life at different storage RH and temp.:
RH (70%, 75%, 80%); T (25o
C, 30o
C)
Internationally Recognized UndergraduateProgram by IFT & IUFoST
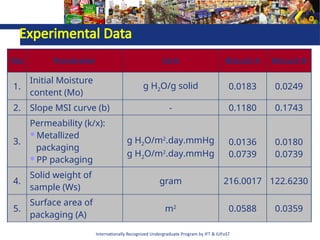
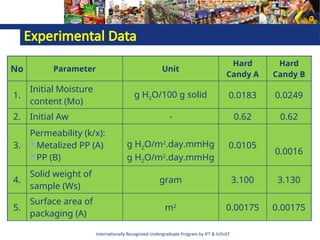
Experimental Data
No Parameter Unit
Hard
Candy A
Hard
Candy B
1.
Initial Moisture
content (Mo)
g H2O/100 g solid 0.0183 0.0249
2. Initial Aw - 0.62 0.62
3.
Permeability (k/x):
Metalized PP (A)
PP (B)
g H2O/m2
.day.mmHg
g H2O/m2
.day.mmHg
0.0105
0.0016
4.
Solid weight of
sample (Ws)
gram 3.100 3.130
5.
Surface area of
packaging (A)
m2
0.00175 0.00175
68.
Internationally Recognized UndergraduateProgram by IFT & IUFoST
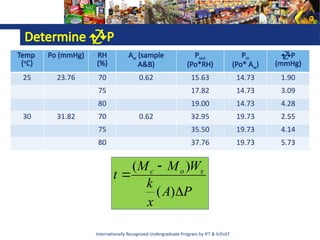
Determine P
Temp
(o
C)
Po (mmHg) RH
(%)
Aw (sample
A&B)
Pout
(Po*RH)
Pin
(Po* Aw)
P
(mmHg)
25 23.76 70 0.62 15.63 14.73 1.90
75 17.82 14.73 3.09
80 19.00 14.73 4.28
30 31.82 70 0.62 32.95 19.73 2.55
75 35.50 19.73 4.14
80 37.76 19.73 5.73
P
A
x
k
W
M
M
t s
o
c
)
(
)
(


![Internationally Recognized Undergraduate Program by IFT & IUFoST
Tahap 10:
Calculate Predicted Shelf-life
Shelf-life (ts) at a storage temperature:
Order 0 : ts = (Qo-Qs)/kT
Order 1 : ts = [ln(Qo/Qs)]/kT
kT comes from Arrhenius equation
Plot graphics storage temp vs shelf-life
Shelf-life
(day)
Storage Temp (o
C)](https://image.slidesharecdn.com/9-10shelf-lifeevaluationusingalst-251128025300-77444581/85/9-10_-shelf-life-evaluation-using-ALST-pptx-24-320.jpg)