QNBFS Daily Technical Trader - Qatar July 28, 2016QNB Group
The Index succeeded in breaking above
the 10,550 level, which puts it in an
upward trajectory. Even though volume
has increased, we would like to see more
participation and higher volumes to
substantiate this rise. Deeper correction
can be used for accumulation.
QNBFS Daily Technical Trader - Qatar August 28, 2016QNB Group
The uptrend on the Index remains up over
the short term (seen on the intraday
chart). The integrity of the 11,000 should
stay intact; the psychological impact in
breaking below the mentioned level could
have corrective consequences.
QNBFS Daily Technical Trader - Qatar April 19, 2017QNB Group
A possible bearish Flag formation has been created and we update our current support to 10,300. Breaking below that level may confirm that formation which could take the Index down to the 10,000 level in the medium term.
Daily Technical Trader - Qatar February 17QNB Group
We were expecting the QSE Index to
move higher but volatility in oil prices
subdued confidence and the market
inched up marginally. Momentum
indicators remain positive; we need the
Index to remain above the 9,600 to be on
the safe side.
Roteiros de viagens comercializados pela Militur Viagens Internacionais.
Descubra um jeito novo de viajar! Explore o mundo à sua maneira, com roteiros exclusivos, especialmente pensados para você. Saia do pacote e venha para a Militur!
QNBFS Daily Technical Trader - Qatar November 01, 2016QNB Group
There has been a marginal uptick on the
Index through the previous session and
this could continue. We note that the
Index is moving just around the 200SMA
on the daily chart, which could act as a
support level.
QNBFS Daily Market Report December 24, 2023QNB Group
The QE Index rose 0.8% to close at 10,285.3. Gains were led by the Transportation and Banks & Financial Services indices, gaining 1.4% and 1.2%, respectively.
QNBFS Daily Market Report October 04, 2023QNB Group
The QE Index rose 0.2% to close at 10,273.3. Gains were led by the Transportation and Consumer Goods & Services indices, gaining 1.7% and 0.1%, respectively.
QNBFS Daily Technical Trader Qatar - October 04, 2023 التحليل الفني اليومي لب...QNB Group
The General Index failed to sustain its breakout above the double-bottom formation’s neckline and continued with its decline into the formation’s territory.
QNBFS Daily Technical Trader Qatar - September 28, 2023 التحليل الفني اليومي ...QNB Group
The General Index failed to sustain its breakout above the double-bottom formation’s neckline and continued with its decline into the formation’s territory.
QNBFS Daily Market Report September 24, 2023QNB Group
The QE Index rose 0.3% to close at 10,323.0. Gains were led by the Transportation and Industrials indices, gaining 0.8% each. Top gainers were Qatar Navigation and Al Khaleej Takaful Insurance Co., rising 3.3% and 2.0%, respectively.
QNBFS Daily Technical Trader Qatar - September 24, 2023 التحليل الفني اليومي ...QNB Group
The General Index failed to sustain its breakout above the double-bottom formation’s neckline and continued with its decline into the formation’s territory.
QNBFS Daily Technical Trader Qatar - September 19, 2023 التحليل الفني اليومي ...QNB Group
The General Index failed to sustain its breakout above the double-bottom formation’s neckline and continued with its decline into the formation’s territory.
QNBFS Daily Market Report September 17, 2023QNB Group
The QE Index declined 0.5% to close at 10,319.3. Losses were led by the Industrials and Consumer Goods & Services indices, falling 1.4% and 1.1%, respectively.
QNBFS Daily Technical Trader Qatar - September 07, 2023 التحليل الفني اليومي ...QNB Group
The General Index failed to
sustain its breakout above the
double-bottom formation’s
neckline and continued with
its decline into the
formation’s territory.
how to sell pi coins effectively (from 50 - 100k pi)DOT TECH
Anywhere in the world, including Africa, America, and Europe, you can sell Pi Network Coins online and receive cash through online payment options.
Pi has not yet been launched on any exchange because we are currently using the confined Mainnet. The planned launch date for Pi is June 28, 2026.
Reselling to investors who want to hold until the mainnet launch in 2026 is currently the sole way to sell.
Consequently, right now. All you need to do is select the right pi network provider.
Who is a pi merchant?
An individual who buys coins from miners on the pi network and resells them to investors hoping to hang onto them until the mainnet is launched is known as a pi merchant.
debuts.
I'll provide you the Telegram username
@Pi_vendor_247
The European Unemployment Puzzle: implications from population agingGRAPE
We study the link between the evolving age structure of the working population and unemployment. We build a large new Keynesian OLG model with a realistic age structure, labor market frictions, sticky prices, and aggregate shocks. Once calibrated to the European economy, we quantify the extent to which demographic changes over the last three decades have contributed to the decline of the unemployment rate. Our findings yield important implications for the future evolution of unemployment given the anticipated further aging of the working population in Europe. We also quantify the implications for optimal monetary policy: lowering inflation volatility becomes less costly in terms of GDP and unemployment volatility, which hints that optimal monetary policy may be more hawkish in an aging society. Finally, our results also propose a partial reversal of the European-US unemployment puzzle due to the fact that the share of young workers is expected to remain robust in the US.
US Economic Outlook - Being Decided - M Capital Group August 2021.pdfpchutichetpong
The U.S. economy is continuing its impressive recovery from the COVID-19 pandemic and not slowing down despite re-occurring bumps. The U.S. savings rate reached its highest ever recorded level at 34% in April 2020 and Americans seem ready to spend. The sectors that had been hurt the most by the pandemic specifically reduced consumer spending, like retail, leisure, hospitality, and travel, are now experiencing massive growth in revenue and job openings.
Could this growth lead to a “Roaring Twenties”? As quickly as the U.S. economy contracted, experiencing a 9.1% drop in economic output relative to the business cycle in Q2 2020, the largest in recorded history, it has rebounded beyond expectations. This surprising growth seems to be fueled by the U.S. government’s aggressive fiscal and monetary policies, and an increase in consumer spending as mobility restrictions are lifted. Unemployment rates between June 2020 and June 2021 decreased by 5.2%, while the demand for labor is increasing, coupled with increasing wages to incentivize Americans to rejoin the labor force. Schools and businesses are expected to fully reopen soon. In parallel, vaccination rates across the country and the world continue to rise, with full vaccination rates of 50% and 14.8% respectively.
However, it is not completely smooth sailing from here. According to M Capital Group, the main risks that threaten the continued growth of the U.S. economy are inflation, unsettled trade relations, and another wave of Covid-19 mutations that could shut down the world again. Have we learned from the past year of COVID-19 and adapted our economy accordingly?
“In order for the U.S. economy to continue growing, whether there is another wave or not, the U.S. needs to focus on diversifying supply chains, supporting business investment, and maintaining consumer spending,” says Grace Feeley, a research analyst at M Capital Group.
While the economic indicators are positive, the risks are coming closer to manifesting and threatening such growth. The new variants spreading throughout the world, Delta, Lambda, and Gamma, are vaccine-resistant and muddy the predictions made about the economy and health of the country. These variants bring back the feeling of uncertainty that has wreaked havoc not only on the stock market but the mindset of people around the world. MCG provides unique insight on how to mitigate these risks to possibly ensure a bright economic future.
how to sell pi coins on Bitmart crypto exchangeDOT TECH
Yes. Pi network coins can be exchanged but not on bitmart exchange. Because pi network is still in the enclosed mainnet. The only way pioneers are able to trade pi coins is by reselling the pi coins to pi verified merchants.
A verified merchant is someone who buys pi network coins and resell it to exchanges looking forward to hold till mainnet launch.
I will leave the telegram contact of my personal pi merchant to trade with.
@Pi_vendor_247
how to sell pi coins at high rate quickly.DOT TECH
Where can I sell my pi coins at a high rate.
Pi is not launched yet on any exchange. But one can easily sell his or her pi coins to investors who want to hold pi till mainnet launch.
This means crypto whales want to hold pi. And you can get a good rate for selling pi to them. I will leave the telegram contact of my personal pi vendor below.
A vendor is someone who buys from a miner and resell it to a holder or crypto whale.
Here is the telegram contact of my vendor:
@Pi_vendor_247
Even tho Pi network is not listed on any exchange yet.
Buying/Selling or investing in pi network coins is highly possible through the help of vendors. You can buy from vendors[ buy directly from the pi network miners and resell it]. I will leave the telegram contact of my personal vendor.
@Pi_vendor_247
Empowering the Unbanked: The Vital Role of NBFCs in Promoting Financial Inclu...Vighnesh Shashtri
In India, financial inclusion remains a critical challenge, with a significant portion of the population still unbanked. Non-Banking Financial Companies (NBFCs) have emerged as key players in bridging this gap by providing financial services to those often overlooked by traditional banking institutions. This article delves into how NBFCs are fostering financial inclusion and empowering the unbanked.
What website can I sell pi coins securely.DOT TECH
Currently there are no website or exchange that allow buying or selling of pi coins..
But you can still easily sell pi coins, by reselling it to exchanges/crypto whales interested in holding thousands of pi coins before the mainnet launch.
Who is a pi merchant?
A pi merchant is someone who buys pi coins from miners and resell to these crypto whales and holders of pi..
This is because pi network is not doing any pre-sale. The only way exchanges can get pi is by buying from miners and pi merchants stands in between the miners and the exchanges.
How can I sell my pi coins?
Selling pi coins is really easy, but first you need to migrate to mainnet wallet before you can do that. I will leave the telegram contact of my personal pi merchant to trade with.
Tele-gram.
@Pi_vendor_247
1. COPYRIGHT: No part of this document may be reproduced without the explicit written permission of QNBFS Page 1 of 6
Daily Technical Trader – Qatar
Thursday, 07 May 2015
Stocks Covered Today
Ticker Price 1
st
Target
QIBK 104.00 105.90
MRDS 19.18 19.70
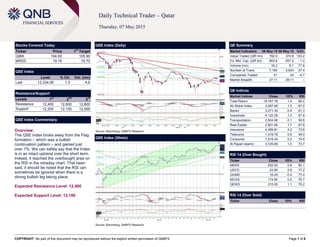
QSE Index
Level % Ch. Vol. (mn)
Last 12,334.06 1.0 4.6
Resistance/Support
Levels 1
st
2
nd
3
rd
Resistance 12,400 12,600 12,800
Support 12,200 12,100 12,000
QSE Index Commentary
Overview:
The QSE Index broke away from the Flag
formation – which was a bullish
continuation pattern – and gained just
over 1%. We can safely say that the Index
is in an intact uptrend over the short term.
Indeed, it reached the overbought area on
the RSI in the intraday chart. That been
said, it should be noted that the RSI can
sometimes be ignored when there is a
strong bullish leg taking place.
Expected Resistance Level: 12,400
Expected Support Level: 12,100
QSE Index (Daily)
Source: Bloomberg, QNBFS Research
QE Summary
Market Indicators 06 May 15 05 May 15 %Ch.
Value Traded (QR mn) 762.0 374.9 103.2
Ex. Mkt. Cap. (QR bn) 663.8 657.5 1.0
Volume (mn) 16.2 9.1 77.8
Number of Trans. 7,190 5,643 27.4
Companies Traded 41 43 -4.7
Market Breadth 27:11 28:11 –
QE Indices
Market Indices Close 1D% RSI
Total Return 19,167.78 1.0 66.2
All Share Index 3,297.69 1.0 67.5
Banks 3,271.34 0.4 61.3
Industrials 4,122.29 1.3 67.8
Transportation 2,504.98 0.1 59.8
Real Estate 2,651.96 1.7 67.8
Insurance 4,369.81 4.2 73.8
Telecoms 1,319.78 0.6 49.0
Consumer 7,519.34 0.2 74.9
Al Rayan Islamic 4,725.89 1.5 73.7
RSI 14 (Over Bought)
Ticker Close 1D% RSI
MERS 252.00 0.8 80.1
UDCD 23.90 2.9 77.2
QGMD 16.24 -0.9 77.0
MCGS 174.80 0.5 76.7
QEWS 215.00 1.1 76.2
RSI 14 (Over Sold)
Ticker Close 1D% RSI
QSE Index (30min)
Source: Bloomberg, QNBFS Research
2. COPYRIGHT: No part of this document may be reproduced without the explicit written permission of QNBFS Page 2 of 6
QIBK
Price % Ch. Volume
Last 104.00 0.97 91,755
Resistance/Support
Levels (QR) 1
st
2
nd
3
rd
Resistance 104.00 105.90 107.00
Support 102.40 101.00 100.00
Commentary
Overview:
The name broke above the recent range
which extended since the middle of April.
This break was accompanied by a large
bullish candlestick. MACD and RSI on
both time frames are up which is bullish.
Stock price is facing a potential resistance
just below QR106.00. We expect the price
might move to that level.
Expected Target Price: QR105.90 –
QR107.00
A break above QR104.00 is needed to
trigger the short-term long position.
Suggested Stop-Loss Price: QR102.00
(Daily)
Source: Bloomberg, QNBFS Research
(Hourly)
Source: Bloomberg, QNBFS Research
3. COPYRIGHT: No part of this document may be reproduced without the explicit written permission of QNBFS Page 3 of 6
MRDS
Price % Ch. Volume
Last 19.18 1.00 351,410
Resistance/Support
Levels (QR) 1
st
2
nd
3
rd
Resistance 19.34 19.70 20.00
Support 19.00 18.50 17.50
Commentary
Overview:
MRDS had a rally since late March and
stabilized over the past week. This
consolidation could be the solid step for
another run upwards, indicated by the
MACD and the RSI on the hourly chart.
For the risk-averse traders, it is
recommended to wait for a confirmation
before taking a position on the name.
Expected Target Price: QR19.70 –
QR20.00
A break above 19.34 is needed to trigger
the buy recommendation.
Suggested Stop-Loss Price: QR19.00
(Daily)
Source: Bloomberg, QNBFS Research
(Hourly)
Source: Bloomberg, QNBFS Research
5. COPYRIGHT: No part of this document may be reproduced without the explicit written permission of QNBFS Page 5 of 6
Definitions:
Candlestick: A chart that displays the high, low, opening and closing prices for a security in a single period. The body of the candle is made up by the opening
and the closing prices, i.e., the taller the body the greater the range between these two prices and vice versa. A colored candle denotes a closing price that is
lower than the opening price, while a white candle shows the opposite. The candlestick's shadows or wicks show the period's high and low prices and how they
compare to the opening and closing price. In general, the shape of the candle will vary upon the positions of the period's high, low, opening and closing prices.
Support: A level that could cause more buyers to step in in order to prevent the security from falling or causing the security price to head higher.
Resistance: An inverse of a support level. A resistance area or level could cause more sellers to step in in order to prevent the security from rising or causing the
security price to head lower.
SMA (Simple Moving Average): Is an arithmetic average, which calculates the average price of a security over a defined number of periods and is thus
considered a lagging indicator. SMAs used in our analysis refer to closing prices. In general, SMAs serve many purposes, such as a smoothing tool, an indicative
price direction and potential support/resistance levels.
Market Breadth: Breadth indicates the number of securities that have closed higher vs. the number of decliners in a particular exchange.
MACD (Moving Average Convergence/Divergence): Is a trading indicator, which shows changes in the strength, direction, momentum and duration of a trend in
a stock's price through a collection of three time series calculated from historical closing price data.
RSI (Relative Strength Index): Is a momentum indicator that compares a security’s price gains to its losses for a predetermined number of periods (we generally
use 14 periods). The RSI attempts to point out how a security, in relative terms, is in the overbought/oversold zone. Securities with a RSI above 70 could be
considered as overbought, and below 30 could be considered as oversold.
Pattern/Formation: Is a graphical presentation of a security’s price activity over a certain period of time. Formations come in different shapes (such as, head &
shoulders, triangles, flags, and so on). They can be used to identify potential trends, reversal of trends, price targets, entry and exit points, etc.
Fibonacci Retracements: Are horizontal lines that indicate expected areas of support/resistance for a security based on a predetermined price movement. These
levels are usually indicated by Fibonacci ratios of 23.6%, 38.2%, 50.0%, 61.8% and 100% from that particular movement.
Fibonacci Pivot and Intra-day Support/Resistance: A Pivot Point is generally used to formulate expected future support/resistance levels. From the base Pivot
Point, Fibonacci multiples of the high-low differential are added to form resistance levels and subtracted to form support levels.
6. COPYRIGHT: No part of this document may be reproduced without the explicit written permission of QNBFS Page 6 of 6
Contacts:
Saugata Sarkar Sahbi Kasraoui QNB Financial Services SPC
Head of Research Head of HNI Contact Center: (+974) 4476 6666
Tel: (+974) 4476 6534 Tel: (+974) 4476 6544 PO Box 24025
saugata.sarkar@qnbfs.com.qa sahbi.alkasraoui@qnbfs.com.qa Doha, Qatar
Disclaimer and Copyright Notice: This publication has been prepared by QNB Financial Services SPC (“QNBFS”) a wholly-owned subsidiary of QNB SAQ (“QNB”). QNBFS is regulated by the Qatar
Financial Markets Authority and the Qatar Exchange QNB SAQ is regulated by the Qatar Central Bank. This publication expresses the views and opinions of QNBFS at a given time only. It is not an offer,
promotion or recommendation to buy or sell securities or other investments, nor is it intended to constitute legal, tax, accounting, or financial advice. QNBFS accepts no liability whatsoever for any direct or
indirect losses arising from use of this report. Any investment decision should depend on the individual circumstances of the investor and be based on specifically engaged investment advice. We
therefore strongly advise potential investors to seek independent professional advice before making any investment decision. Although the information in this report has been obtained from sources that
QNBFS believes to be reliable, we have not independently verified such information and it may not be accurate or complete. QNBFS does not make any representations or warranties as to the accuracy
and completeness of the information it may contain, and declines any liability in that respect. For reports dealing with Technical Analysis, expressed opinions and/or recommendations may be different or
contrary to the opinions/recommendations of QNBFS Fundamental Research as a result of depending solely on the historical technical data (price and volume). QNBFS reserves the right to amend the
views and opinions expressed in this publication at any time. It may also express viewpoints or make investment decisions that differ significantly from, or even contradict, the views and opinions included
in this report. This report may not be reproduced in whole or in part without permission from QNBFS.