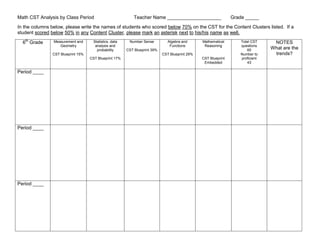
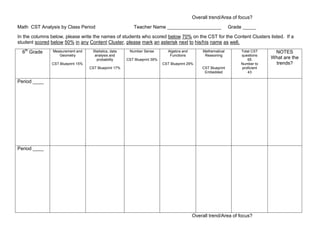
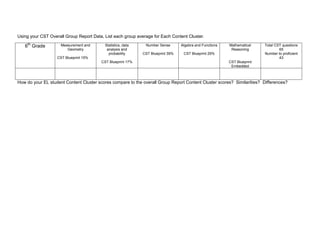
Math CST Analysis by Class PeriodTeacher Name ____________________       Grade _____<br />In the columns below, please write the names of students who scored below 70% on the CST for the Content Clusters listed.  If a student scored below 50% in any Content Cluster, please mark an asterisk next to his/his name as well.<br />6th GradeMeasurement and GeometryCST Blueprint 15%Statistics, data analysis and probabilityCST Blueprint 17%Number SenseCST Blueprint 39%Algebra and FunctionsCST Blueprint 29%Mathematical ReasoningCST Blueprint EmbeddedTotal CST questions65Number to proficient43NOTESWhat are the trends?Period ____Period ____Period ____<br />Overall trend/Area of focus?<br />Math  CST Analysis by Class PeriodTeacher Name ____________________     Grade _____<br />In the columns below, please write the names of students who scored below 70% on the CST for the Content Clusters listed.  If a student scored below 50% in any Content Cluster, please mark an asterisk next to his/his name as well.<br />6th GradeMeasurement and GeometryCST Blueprint 15%Statistics, data analysis and probabilityCST Blueprint 17%Number SenseCST Blueprint 39%Algebra and FunctionsCST Blueprint 29%Mathematical ReasoningCST Blueprint EmbeddedTotal CST questions65Number to proficient43NOTESWhat are the trends?Period ____Period ____<br />Overall trend/Area of focus?<br />Using your CST Overall Group Report Data, List each group average for Each Content Cluster.<br />6th GradeMeasurement and GeometryCST Blueprint 15%Statistics, data analysis and probabilityCST Blueprint 17%Number SenseCST Blueprint 39%Algebra and FunctionsCST Blueprint 29%Mathematical ReasoningCST Blueprint EmbeddedTotal CST questions65Number to proficient43<br />How do your EL student Content Cluster scores compare to the overall Group Report Content Cluster scores?  Similarities?  Differences?<br />
6th math plc analysis

6th math plc analysis

  • 1.
    Math CST Analysisby Class PeriodTeacher Name ____________________ Grade _____<br />In the columns below, please write the names of students who scored below 70% on the CST for the Content Clusters listed. If a student scored below 50% in any Content Cluster, please mark an asterisk next to his/his name as well.<br />6th GradeMeasurement and GeometryCST Blueprint 15%Statistics, data analysis and probabilityCST Blueprint 17%Number SenseCST Blueprint 39%Algebra and FunctionsCST Blueprint 29%Mathematical ReasoningCST Blueprint EmbeddedTotal CST questions65Number to proficient43NOTESWhat are the trends?Period ____Period ____Period ____<br />Overall trend/Area of focus?<br />Math CST Analysis by Class PeriodTeacher Name ____________________ Grade _____<br />In the columns below, please write the names of students who scored below 70% on the CST for the Content Clusters listed. If a student scored below 50% in any Content Cluster, please mark an asterisk next to his/his name as well.<br />6th GradeMeasurement and GeometryCST Blueprint 15%Statistics, data analysis and probabilityCST Blueprint 17%Number SenseCST Blueprint 39%Algebra and FunctionsCST Blueprint 29%Mathematical ReasoningCST Blueprint EmbeddedTotal CST questions65Number to proficient43NOTESWhat are the trends?Period ____Period ____<br />Overall trend/Area of focus?<br />Using your CST Overall Group Report Data, List each group average for Each Content Cluster.<br />6th GradeMeasurement and GeometryCST Blueprint 15%Statistics, data analysis and probabilityCST Blueprint 17%Number SenseCST Blueprint 39%Algebra and FunctionsCST Blueprint 29%Mathematical ReasoningCST Blueprint EmbeddedTotal CST questions65Number to proficient43<br />How do your EL student Content Cluster scores compare to the overall Group Report Content Cluster scores? Similarities? Differences?<br />