Download to read offline


![8
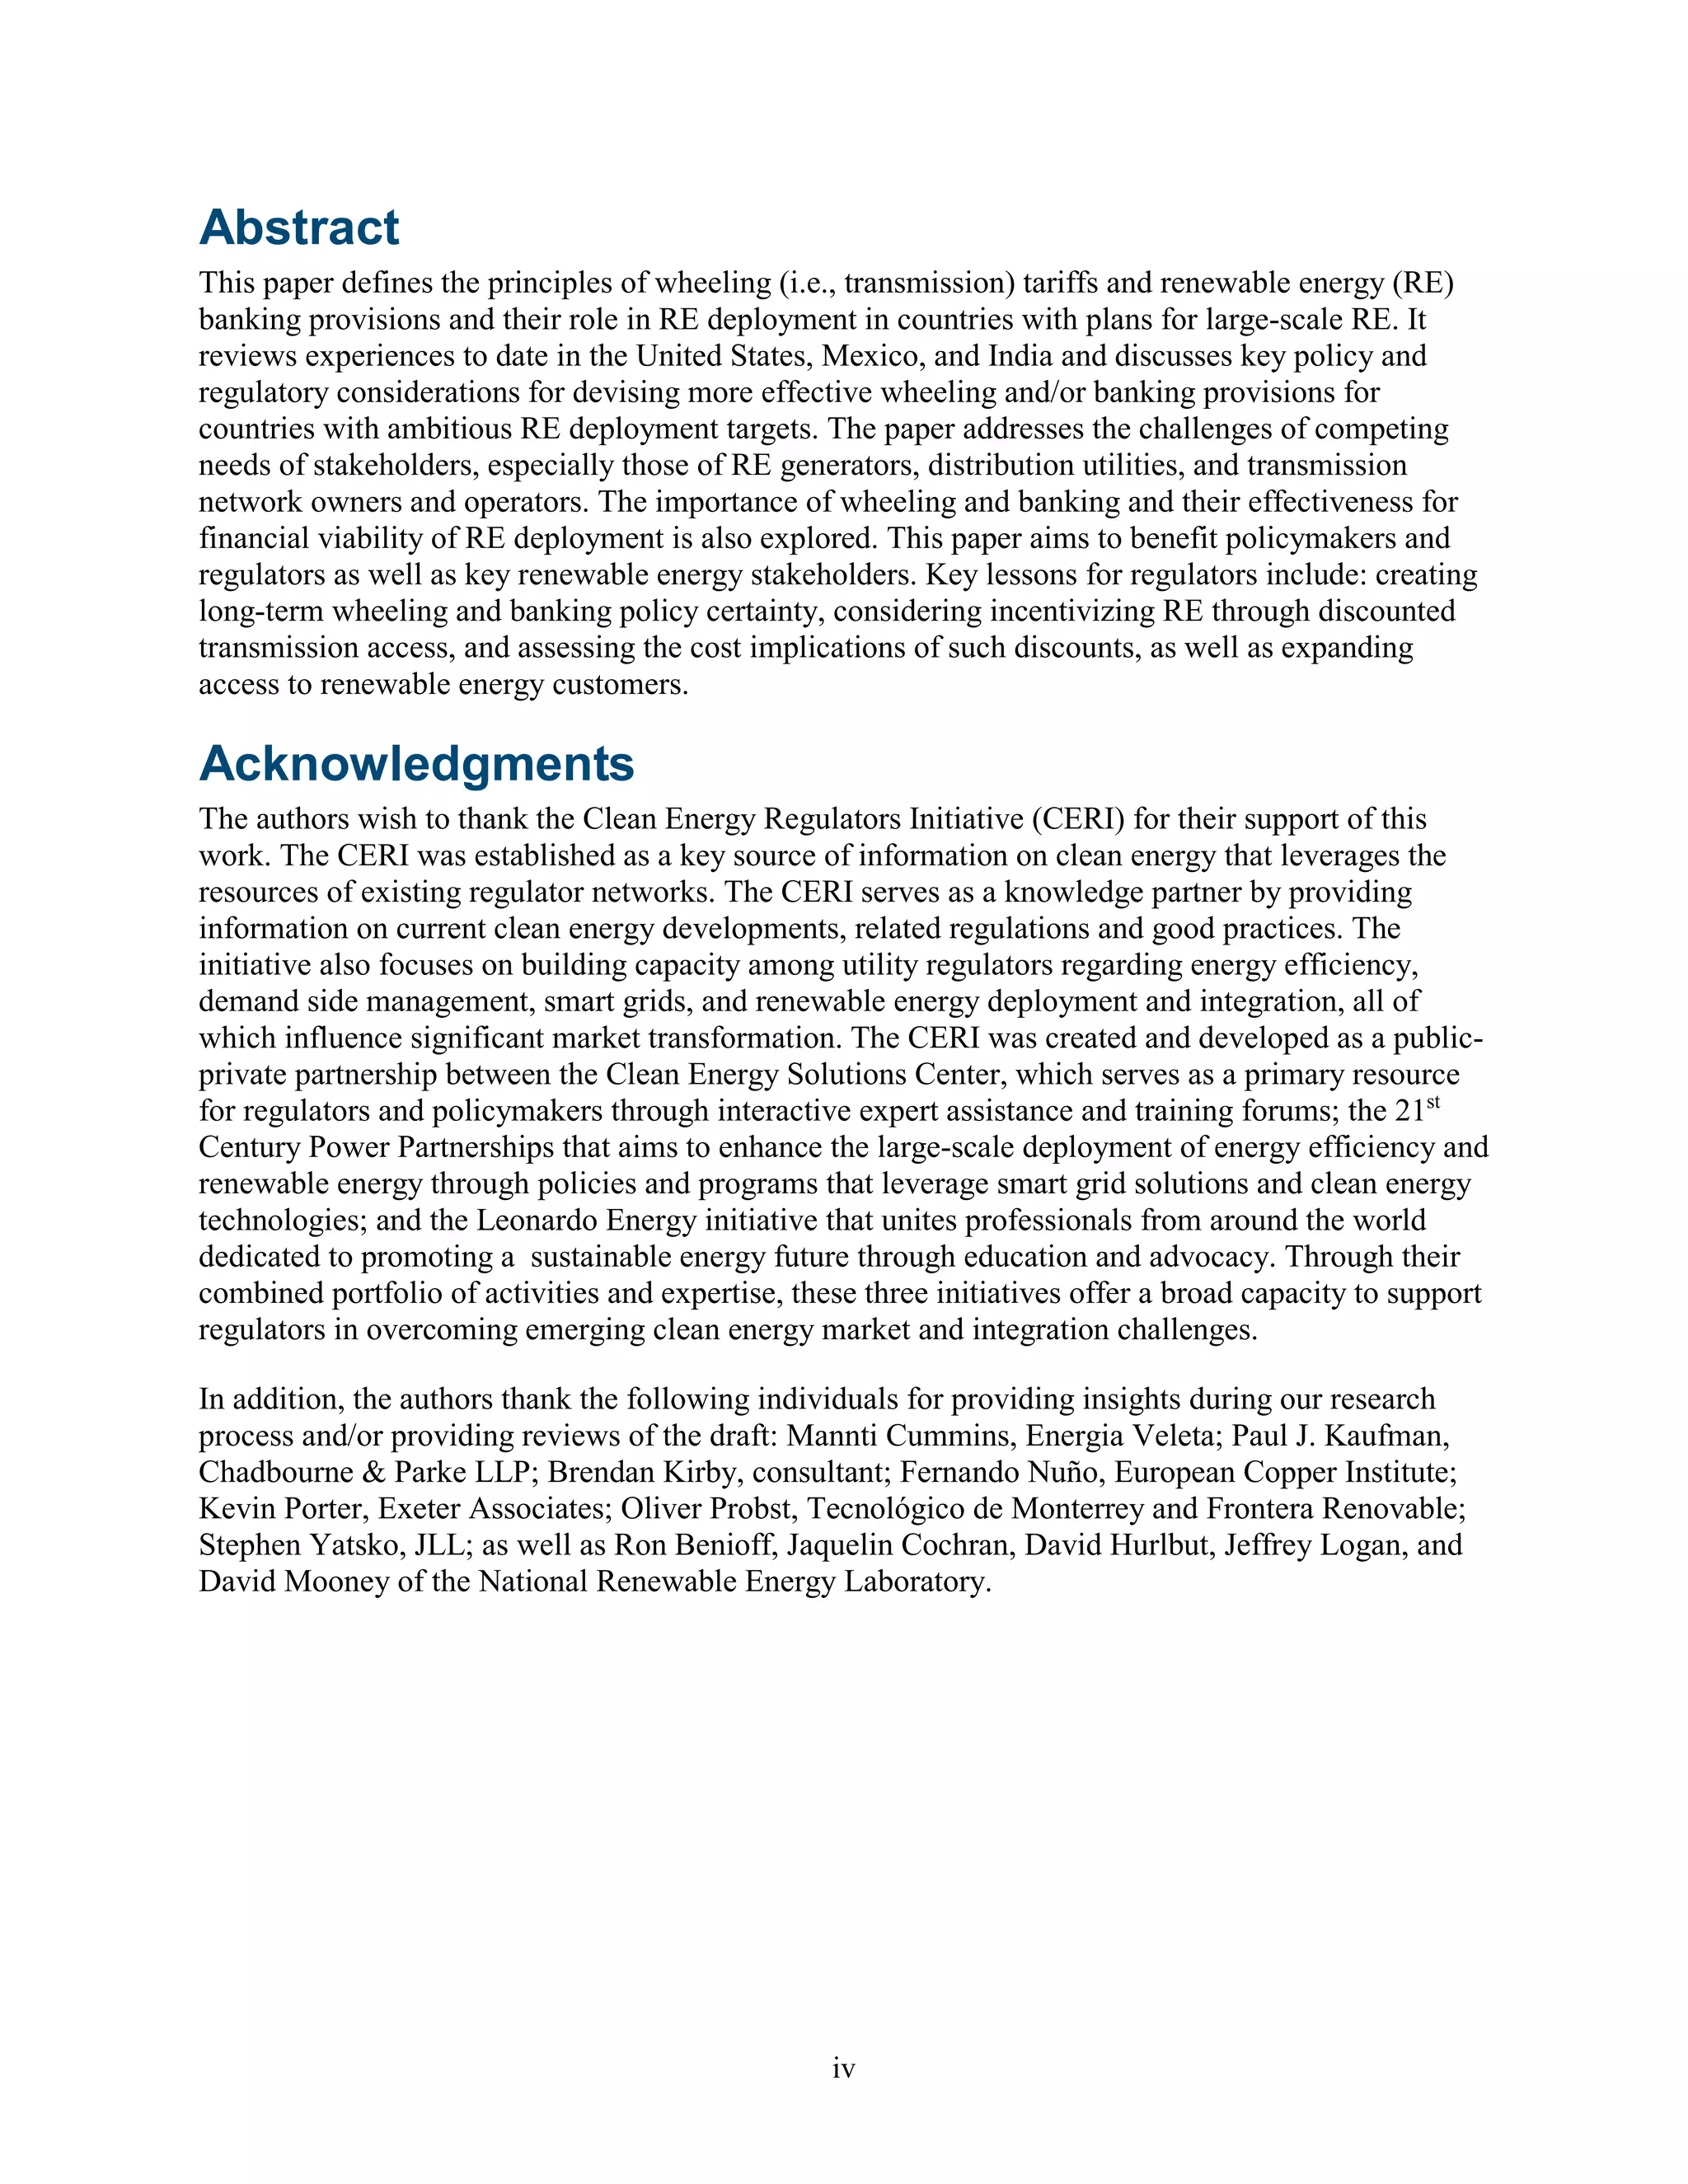
Regional and Interregional Transmission and Wheeling Cost Allocation
FERC Order 1000, issued in 2011, allowed each region to develop its own proposed cost allocation
measure for allocating costs of transmission facilities. It was not prescriptive, but mandated that cost
allocation follow these key principles:
• Costs allocated are “roughly commensurate” with estimated benefits
• Those who do not benefit from transmission do not have to pay for it
• Benefit-to-cost thresholds must not exclude projects with significant net benefits
• No allocation of costs outside a region unless the other concerned region agrees
• Cost allocation methods and identification of beneficiaries must be transparent
• Different allocation methods could apply to different types of transmission facilities.
Some commonly used rates and cost allocation methods used by the wholesale electricity market are:
• Pancaked rates come into play when power under contract involves more than one power system
and each system charges its full rate to provide transmission service. Regional power pools,
RTOs, and ISOs have developed joint pricing for transmission services, eliminating the need for
pancaked rates within their respective boundaries.
• Under postage stamp pricing, the per-unit fee to use the transmission system within a single zone
is the same, i.e., transmission costs are recovered uniformly from all loads in a defined market
area (e.g., RTO-wide in ERCOT and California Independent System Operator [CAISO]).
• License Plate (LP) pricing means that companies that use the transmission grid pay different
prices based on the costs from the point at which the power is delivered to their area and
therefore, each utility recovers the costs of its own transmission investments. In some cases (e.g.,
SPP, MISO, PJM), the cost of certain project types are allocated uniformly to transmission
operators, who then recover these allocated costs in their LP tariffs.
• Distance-sensitive pricing bases the price for using the transmission system on the number of
miles of the system for which users contract the line.
FERC Order 1000 does not proscribe discounted rates for RE generators; however, some rates may
be more advantageous to them. For example, postage stamp rates favor generators that are far from
load, which is common with wind generators.
Wheeling Charges
Wheeling access charges are assessed whenever energy leaves or enters the ISO- or RTO-controlled
grid. These charges are rent-for-wholesale transactions on the transmission system owned by the
Participating Transmission Owners (PTOs). They are settled by the ISOs/RTOs, which act as grid
managers on behalf of the PTOs. The PTOs use these wheeling charges to pay all operating and
capital costs for the transmission system, including a fair return on its investment. In this section we
present examples of wheeling charges in the United States. Text Box 1 provides a case study of
wheeling wind energy in the southern United States.](https://image.slidesharecdn.com/427ac203-6518-4742-9f71-b7a65c7257bf-160318192307/75/65660-15-2048.jpg)


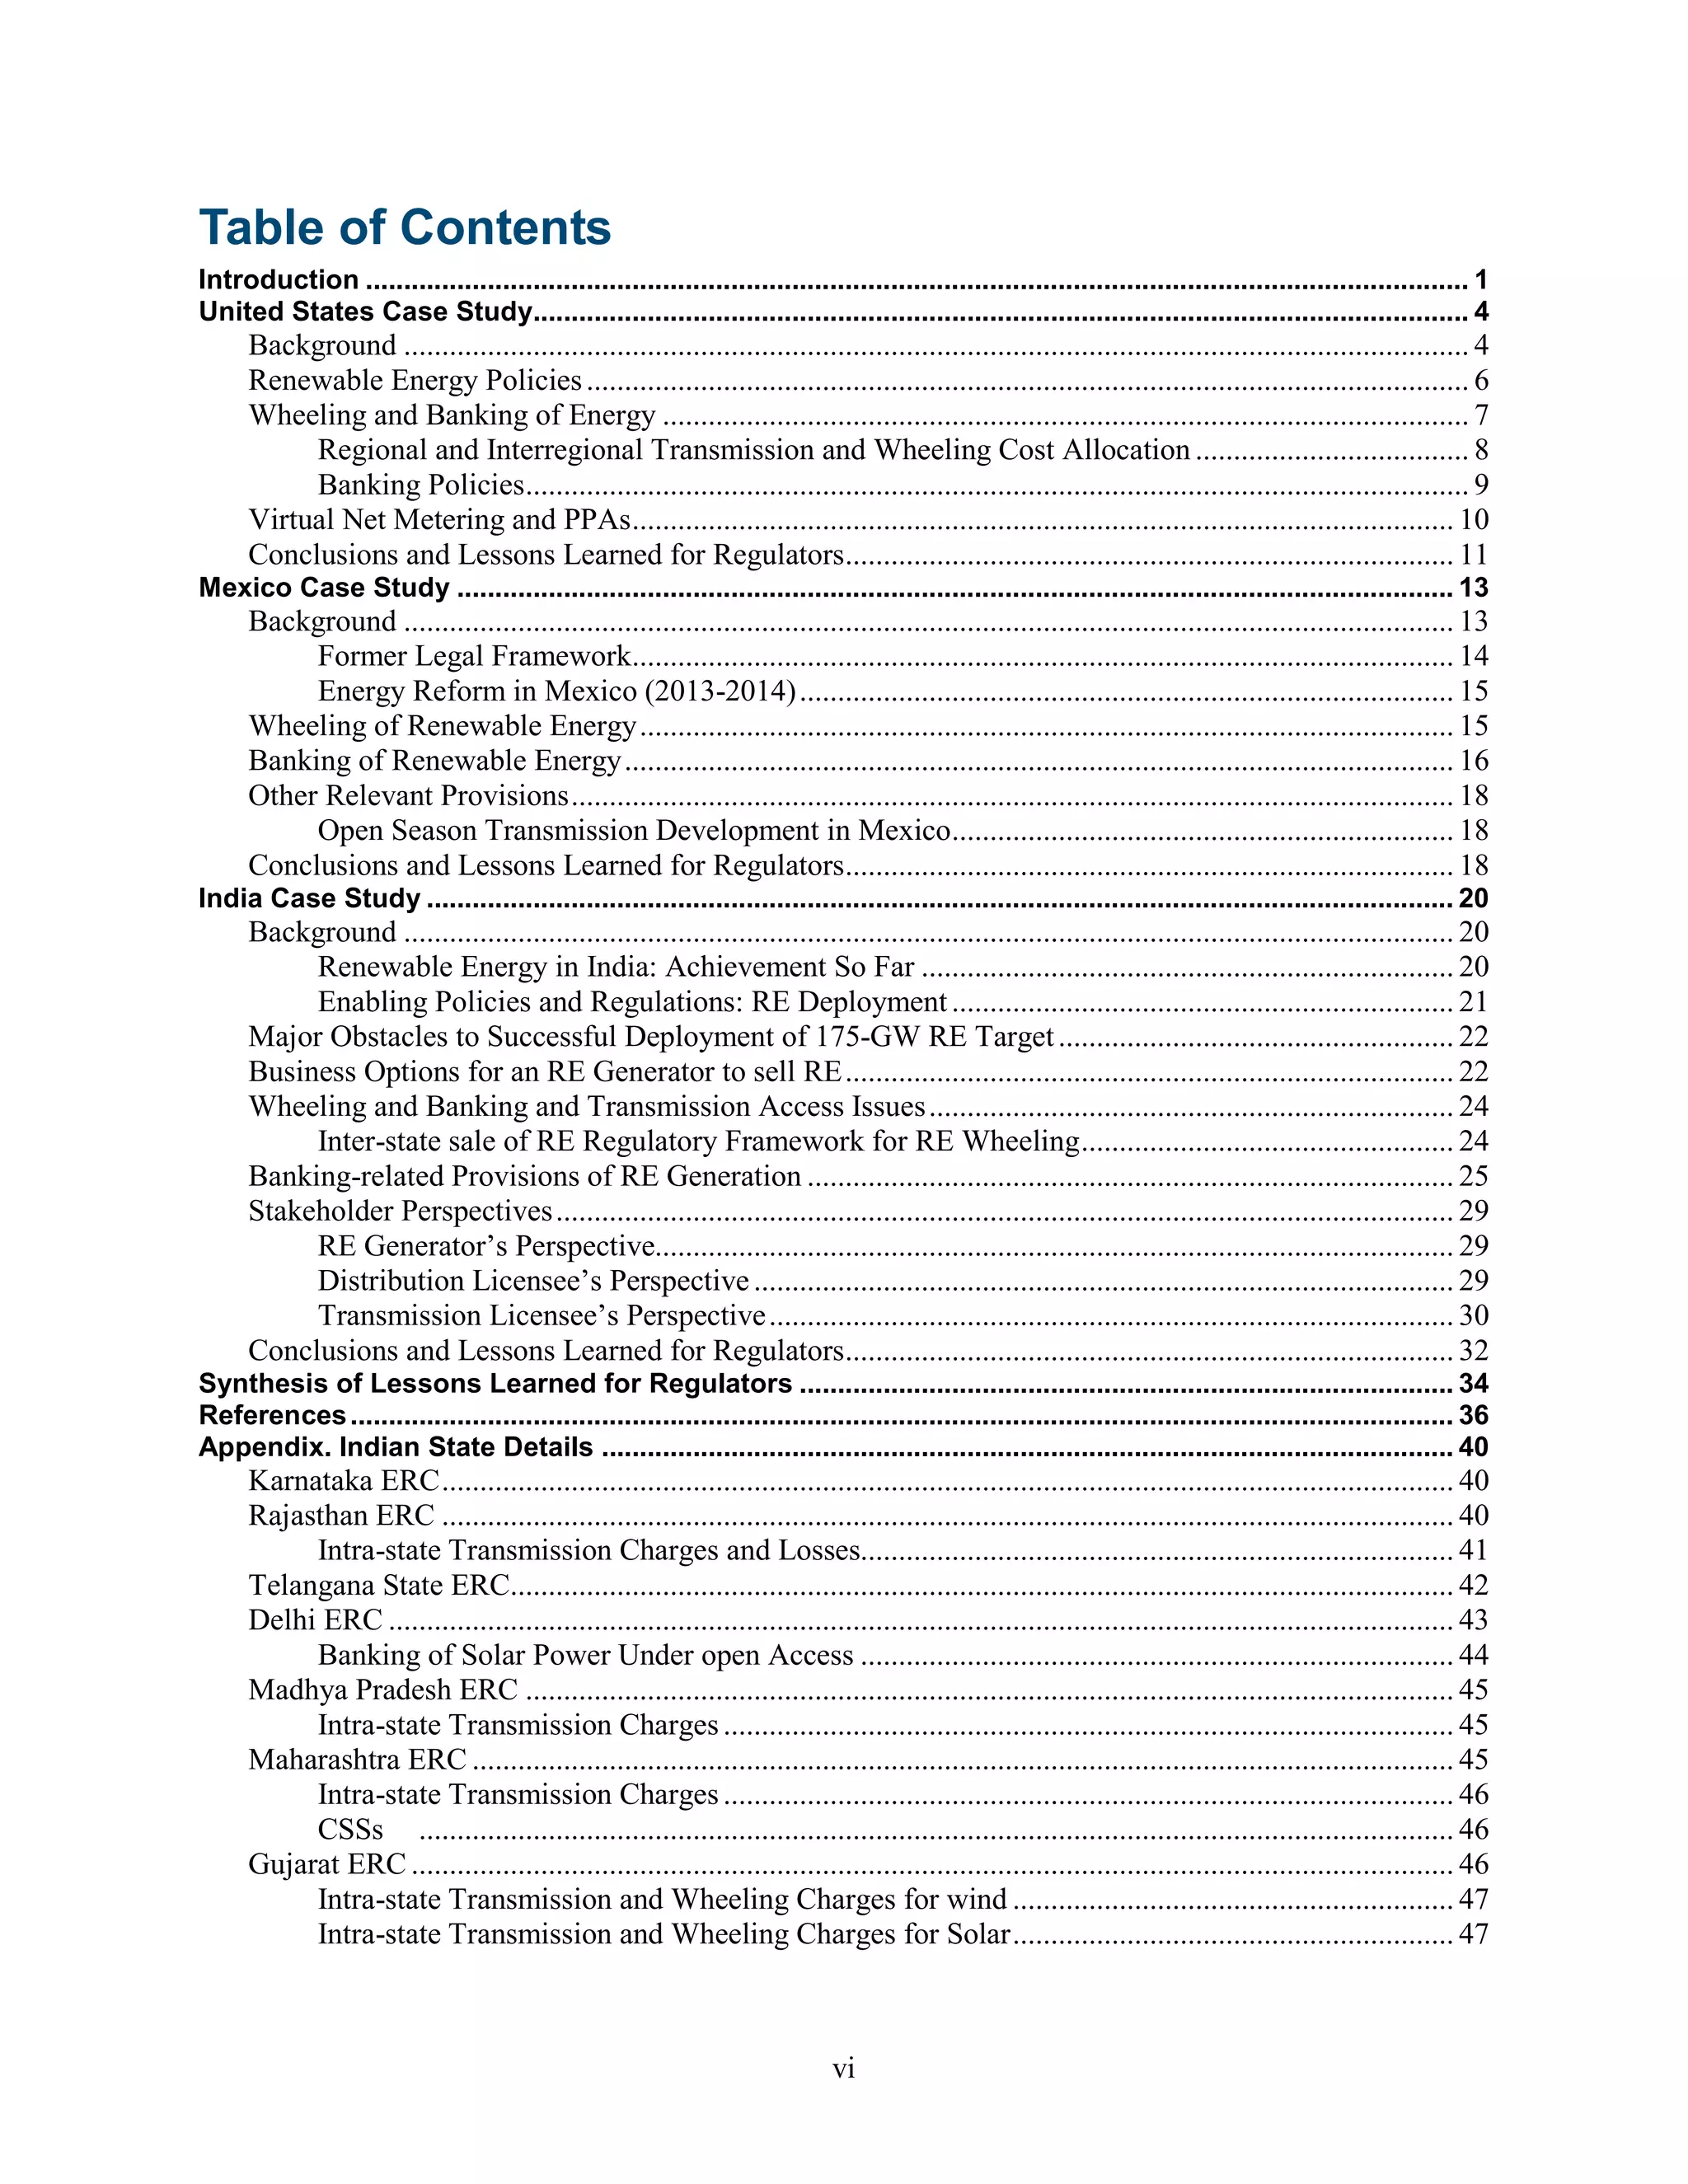
![42
Provided that the charges payable by the Long Term Users may also take into consideration
factors such as voltage, distance, direction, quantum of flow and time of use, as may be
stipulated by the Commission in its order passed under subsection (3) of Section 64 of the
Act:
Provided further that the charges shall be calculated on a daily basis by the Transmission
Licensee and shall be billed every month, except where directed otherwise by the
Commission for any User or class of such users:
Provided further that charges payable by Open Access consumers (other than Long Term)
shall be in accordance with RERC (Terms and Conditions for Open Access) Regulations,
2004 as amended thereto and in the manner as specified by the Commission through Orders
to be issued from time to time.
(2) The Annual Transmission Charges (ATC) payable by a Long term User of the
transmission system shall be computed in accordance with the following equation:
ATC = TC X [CL / SCL]
Where,
TC = Transmission Cost equivalent to the ARR of RVPN less income from short term open
access transactions
CL = Contracted/agreed Transmission Capacity of the User
SCL = Sum of Contracted/agreed Transmission Capacity of all Users.
68. Treatment of losses
Transmission Losses allowed by the Commission will have to be borne by users of the
transmission system and energy accounts, to be maintained by SLDC, shall reflect
accordingly.”
Accordingly, the RERC determined transmission charges at INR 148.91/kW/month (as per the final
tariff approved for FY 14-15 vide order dated October 9, 2014) and transmission losses at 4.2%.
Thus, the charges for long-term and medium-term open access transactions would be on an
INR/MW/month basis. As the capacity utilization factor for solar power plants is in the range of 18-
20%, the long-term transmission charges in terms of INR/MW, when converted to INR/MWh,
become almost five times higher than conventional power. However, the RERC recently reduced the
intra-state transmission charges by half of the charges applicable to normal open access consumers
for solar energy projects of around 2,000 MW, provided that such projects are commissioned by
March 31, 2018.
Telangana State ERC
The government of Telangana issued a solar policy for making use of the positive environment in the
solar market and the initiatives taken by the Government of India for substantially harnessing the
solar potential in Telangana. Paragraph 5 of Clause 11 (e) of Telangana Solar Policy states:](https://image.slidesharecdn.com/427ac203-6518-4742-9f71-b7a65c7257bf-160318192307/75/65660-49-2048.jpg)
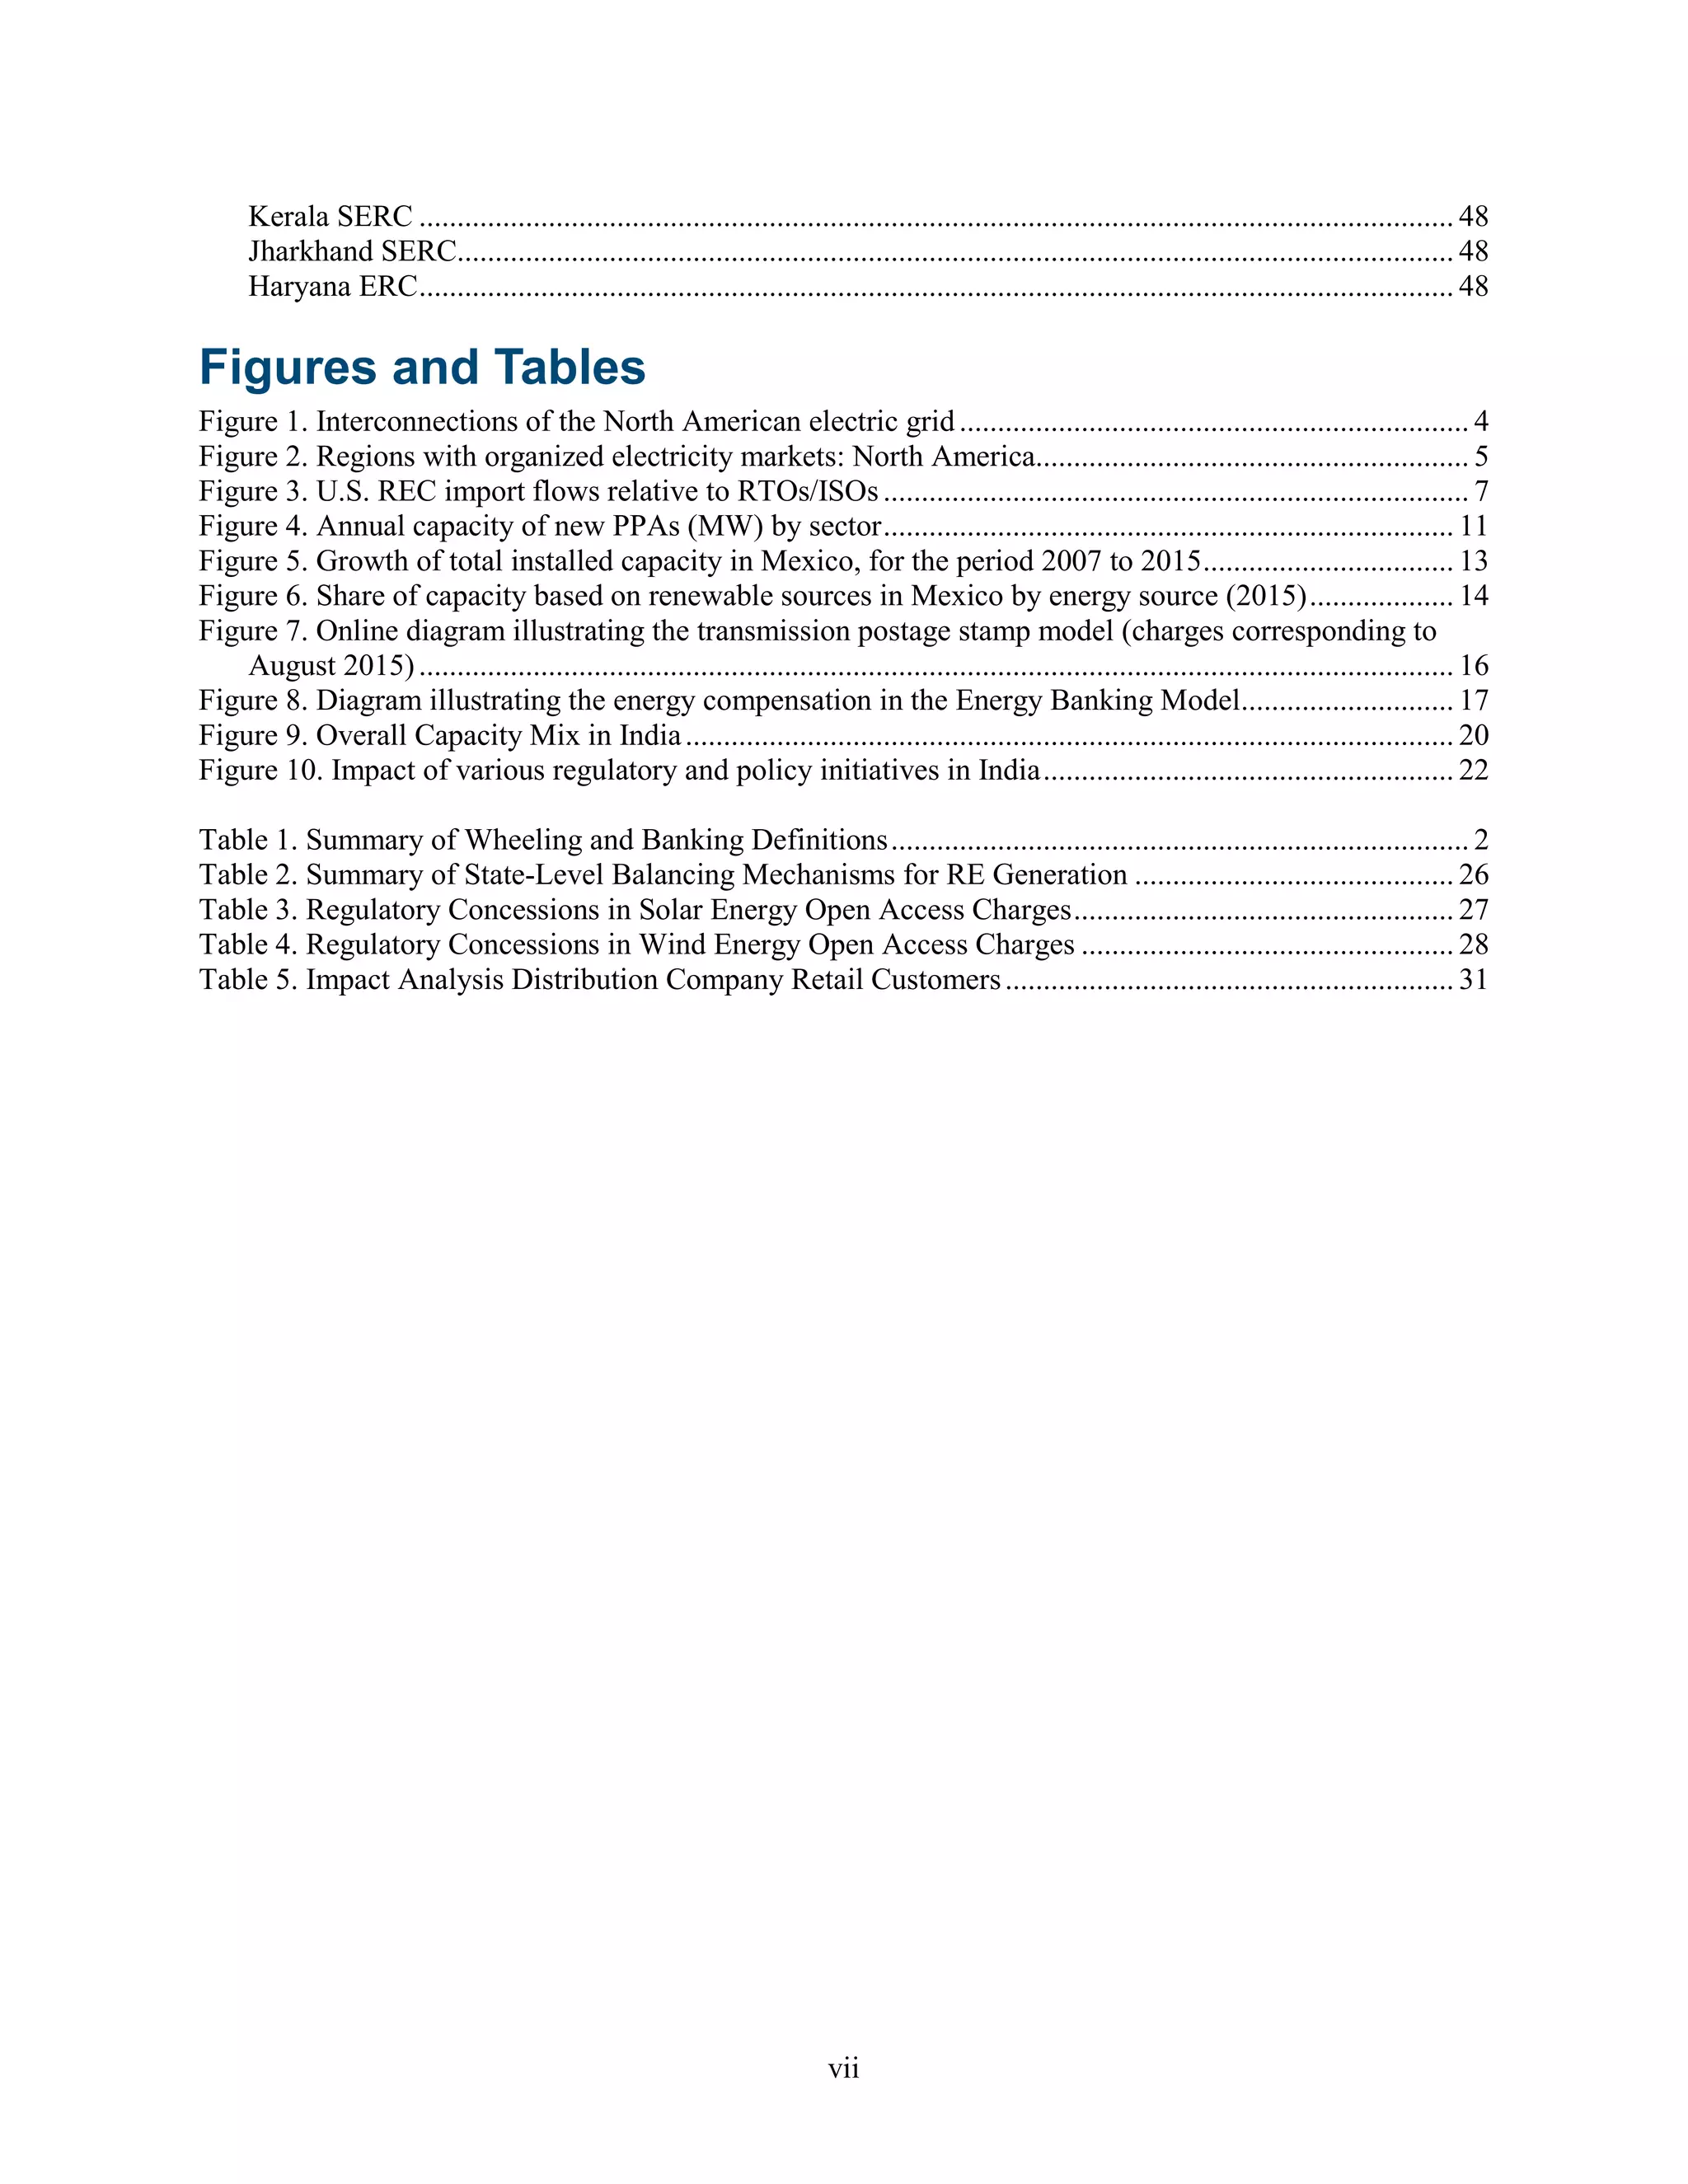
![43
“11. (e) Power Scheduling and Energy Banking
All SPPs shall be awarded must-run status that is injection from solar power projects shall be
considered as deemed to be scheduled.
Banking of 100% of energy shall be permitted for all Captive and Open Access/ Scheduled
consumers during all 12 months of the year. Banking charges shall be adjusted in kind @ 2%
of the energy delivered at the point of drawl.
The banking year shall be from April to March. Banked units cannot be consumed/redeemed
in the peak months (Feb to June) and in the peak hours (6 pm to 10 pm). The provisions on
banking pertaining to [withdrawal] restrictions shall be reviewed based on the power supply
position of the State.
For captive/ third party sale, energy injected into the grid from date of synchronization to
open access approval date will be considered as deemed energy banked.
The unutilized banked energy shall be considered as deemed purchase by DISCOM(s)
[distribution companies] at average pooled power purchase cost as determined by TSERC for
the year.
For Sale to DISCOMS, Energy injected into the grid from date of synchronization to
Commercial Operation Date (COD) will be purchased by the DISCOMS at the first year
tariff of the project, as per the provisions of the PPA with DISCOMS.”
It appears from the above that the banking of 100% of all energy shall be permitted for any captive
and open access/scheduled consumers at any time of the year with banking charges at 2% of the
energy delivered at the point of withdrawal. Such banked units cannot be consumed or redeemed in
the peak months (February to June) or in peak hours (6 p.m. to 10 p.m.). The unutilized banked
energy shall be deemed purchased by distribution companies at average pooled power purchase cost
as determined by TSERC for the year.
Delhi ERC
The Delhi Electricity Regulatory Commission (DERC) passed an order dated December 24, 2013 in
determining transmission and wheeling charges, CSSs, additional surcharges, and other applicable
charges under open access to which various stakeholders had submitted their comments. Under
Clause (xii) of the order, DERC clarified that open access consumers consuming solar power shall
not be covered under the UI mechanism. DERC also clarified that no wheeling, transmission, or
additional surcharge shall be applicable to open access consumers using energy from all renewable
sources of energy as defined by the MNRE in Delhi. Clause (xii) of the order passed by this
Honorable Commission says:
“(xii) Renewable Energy Sources
…………………………………………………………………………………………………
Commission’s View:-](https://image.slidesharecdn.com/427ac203-6518-4742-9f71-b7a65c7257bf-160318192307/75/65660-50-2048.jpg)


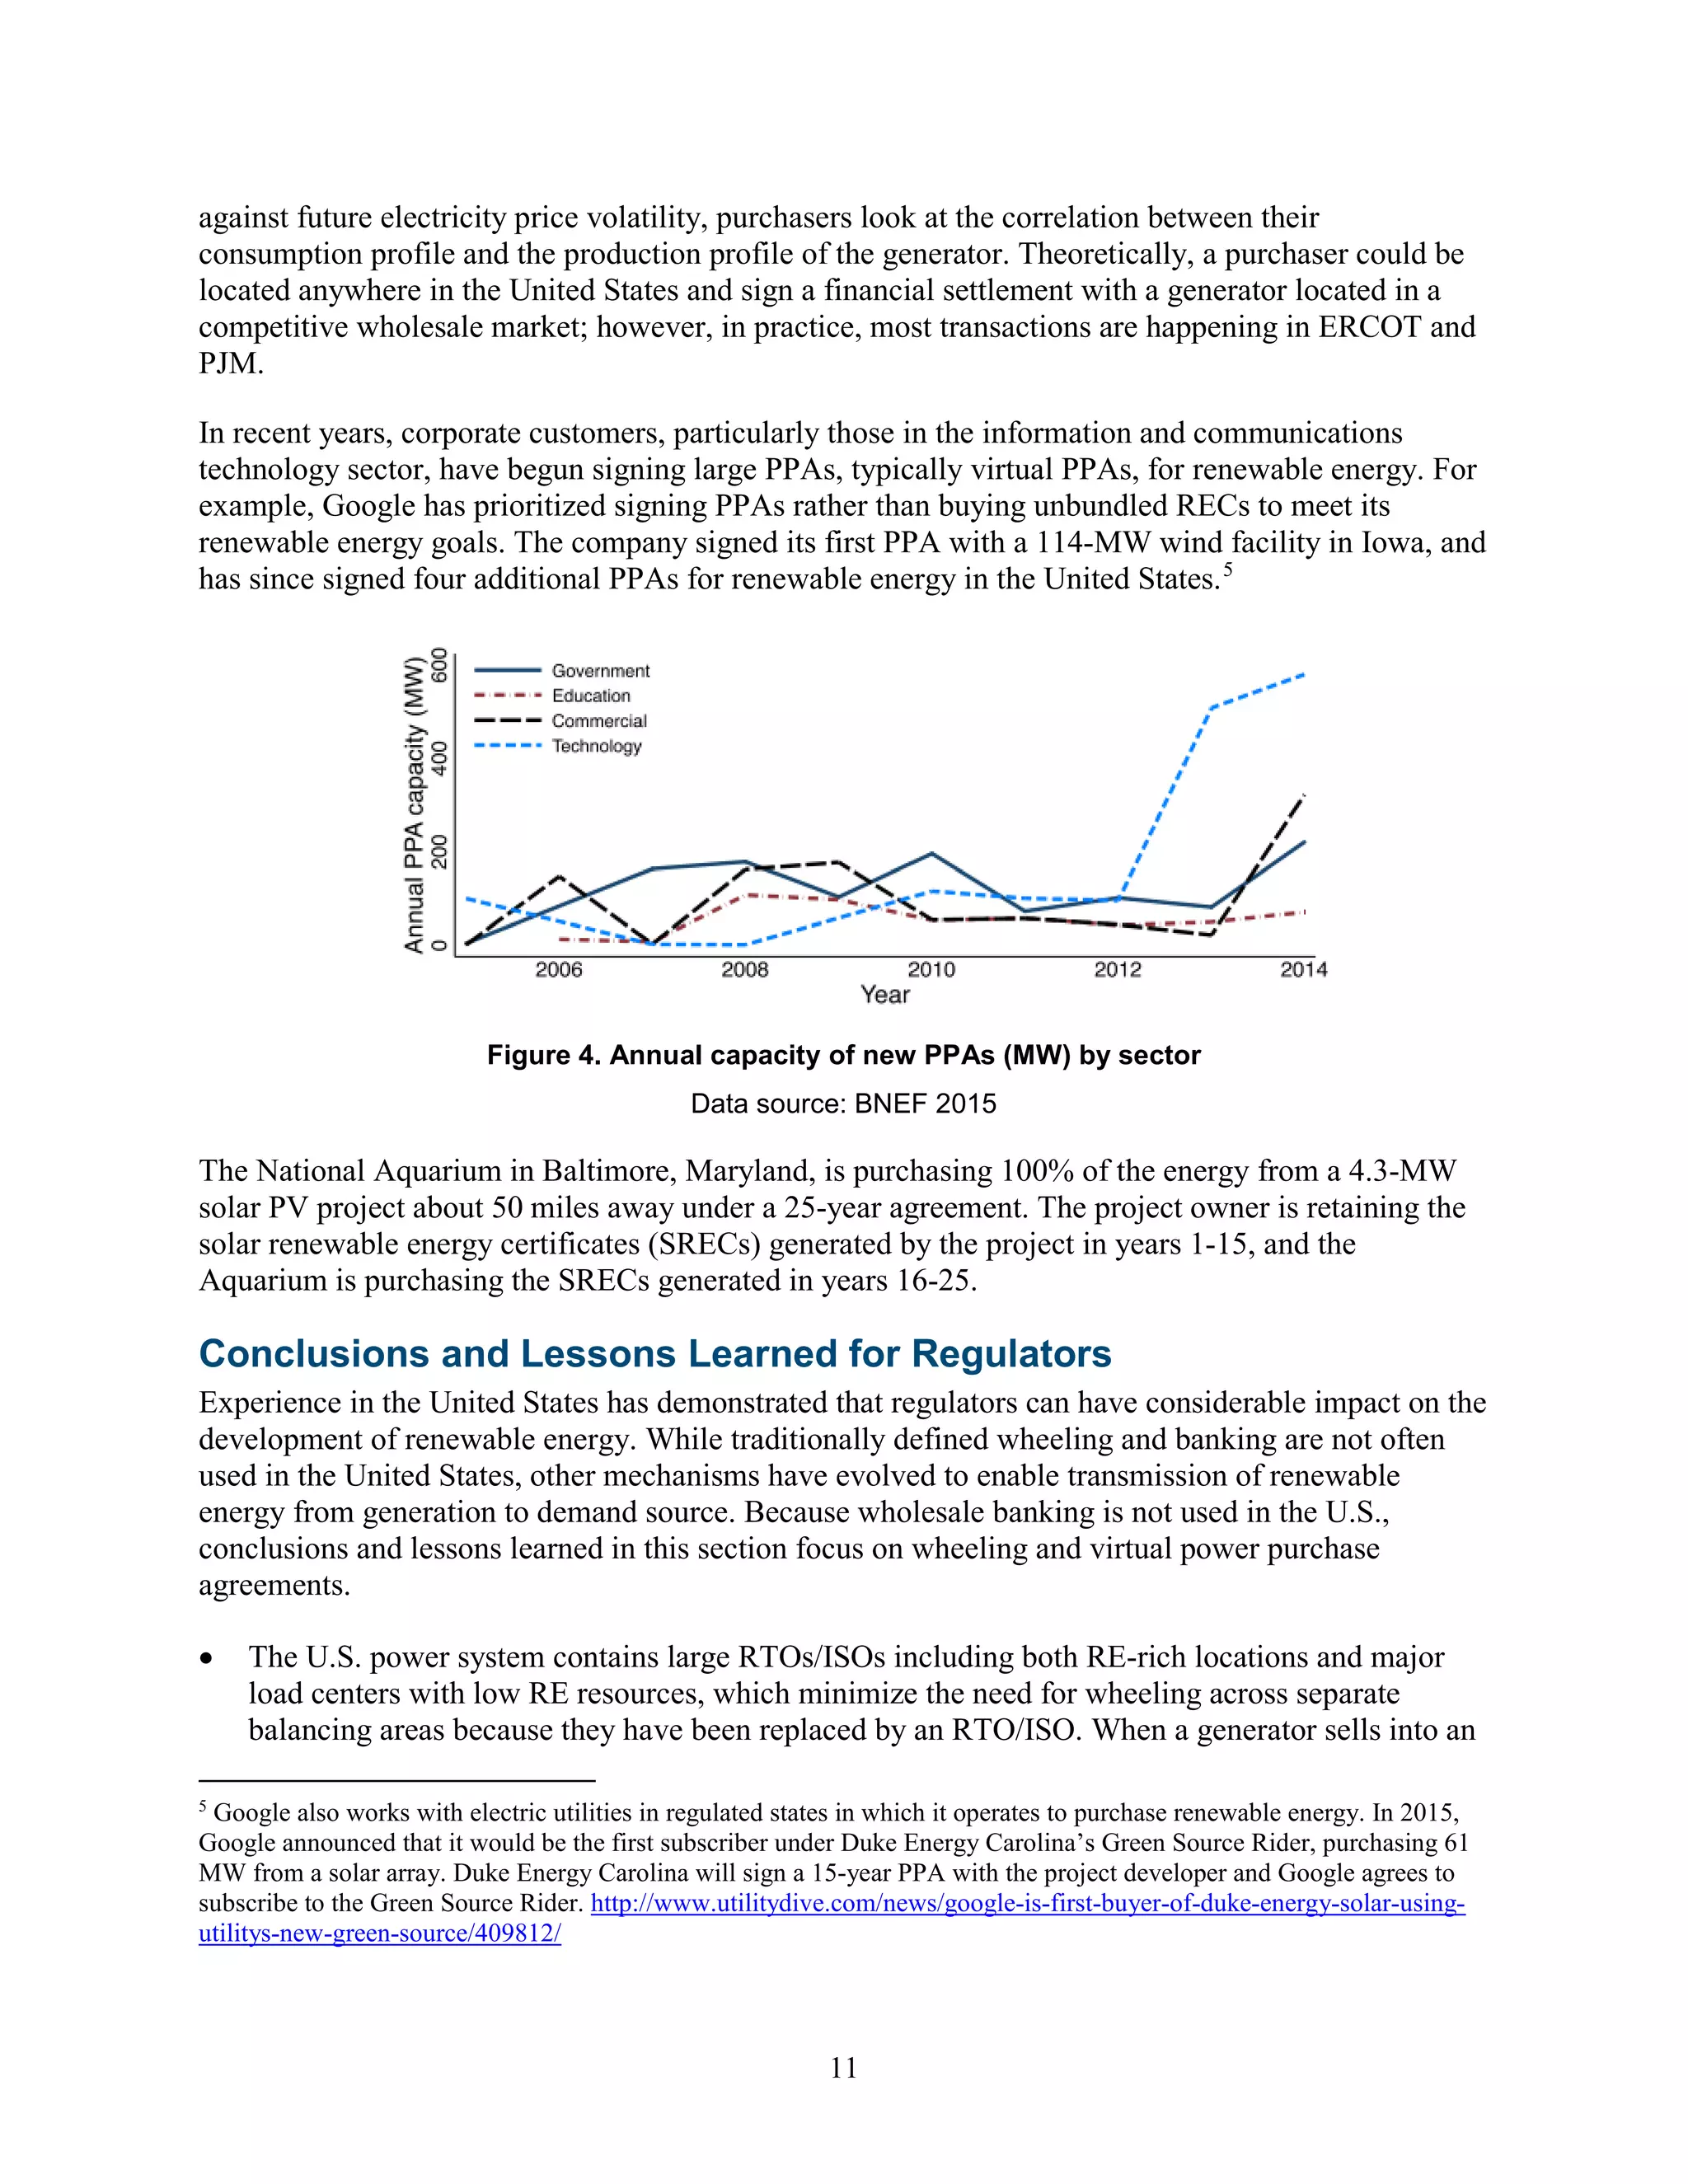
This technical report examines wheeling and banking strategies for renewable energy deployment in the United States, Mexico, and India. It defines wheeling as transmission tariffs and banking as renewable energy storage provisions. The report reviews experiences with these policies in each country and discusses considerations for regulators to help effectively deploy renewable energy through improved wheeling and banking policies. Key lessons identified include creating long-term policy certainty, incentivizing renewable energy through discounted transmission access while assessing costs, and expanding customer access to renewable energy. The report aims to help policymakers and regulators as well as renewable energy stakeholders.


