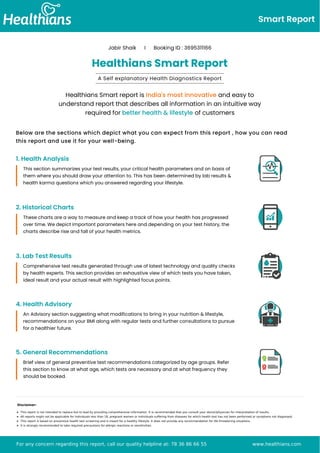
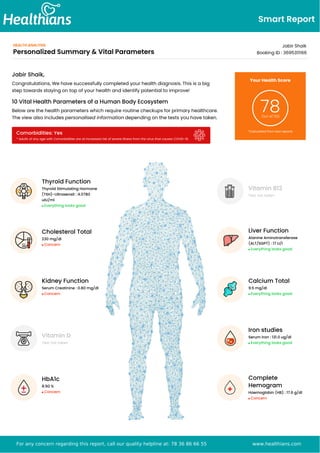
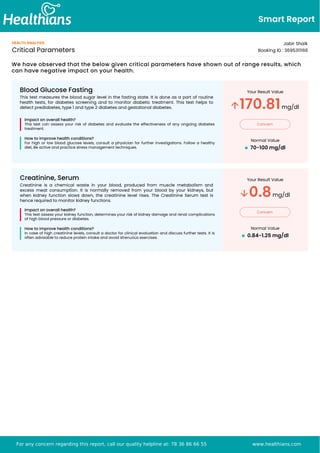
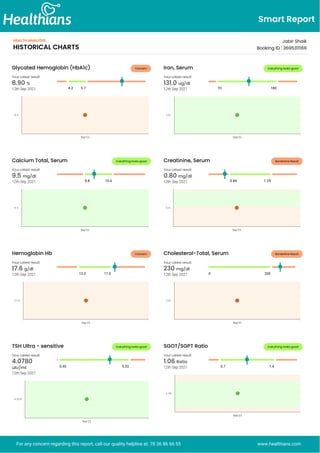
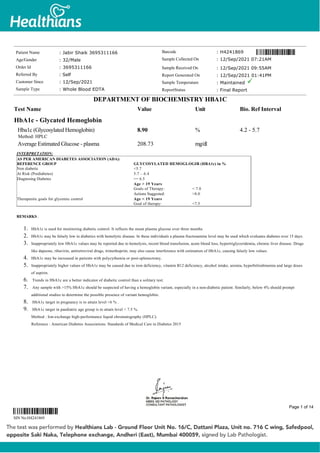
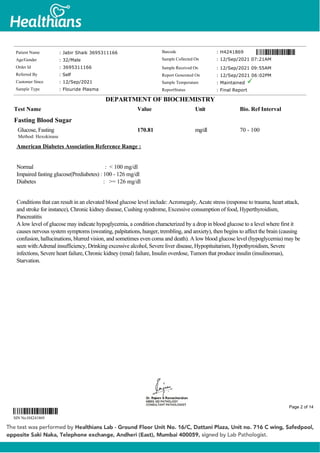
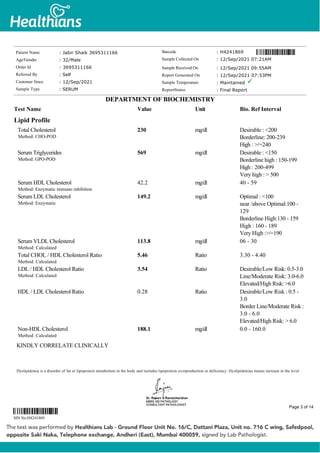
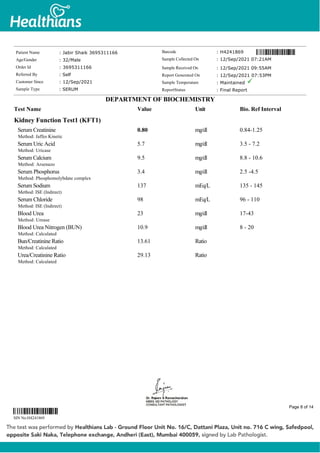
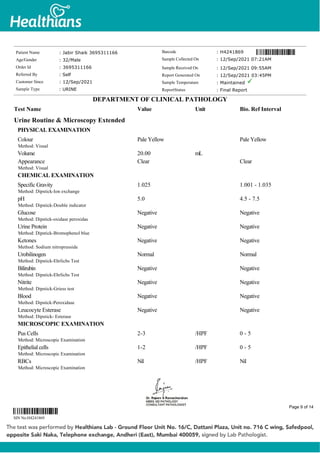
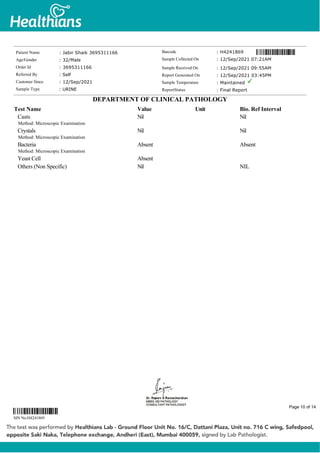
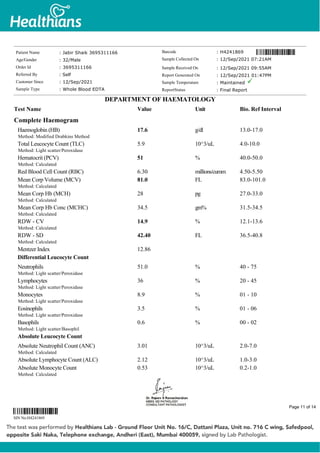
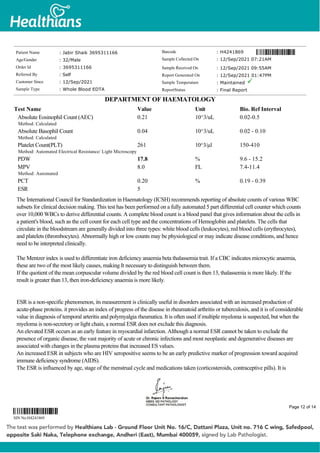
Booking ID : 3695311166
Jabir Shaik
Male, 32 Years
A Comprehensive
Health Analysis Report
A I B a s e d P e r s o n a l i z e d R e p o r t f o r Y o u
INDIA’S FIRST & ONLY CREDIBILITY CHECK FOR YOUR LAB REPORT
Check the authenticity of your lab report with machine data
Scan the QR using any QR code scanner or alternatively follow below steps :
Go to bit.ly/verifyqr on your mobile
Scan the QR Code
For any concern regarding this report, call our quality helpline at: 78 36 86 66 55 www.healthians.com
Smart Report
Jabir Shaik I Booking ID : 3695311166
Healthians Smart Report
A Self explanatory Health Diagnostics Report
Healthians Smart report is India's most innovative and easy to
understand report that describes all information in an intuitive way
required for better health & lifestyle of customers
Below are the sections which depict what you can expect from this report , how you can read
this report and use it for your well-being.
1. Health Analysis
This section summarizes your test results, your critical health parameters and on basis of
them where you should draw your attention to. This has been determined by lab results &
health karma questions which you answered regarding your lifestyle.
2. Historical Charts
These charts are a way to measure and keep a track of how your health has progressed
over time. We depict important parameters here and depending on your test history, the
charts describe rise and fall of your health metrics.
3. Lab Test Results
Comprehensive test results generated through use of latest technology and quality checks
by health experts. This section provides an exhaustive view of which tests you have taken,
ideal result and your actual result with highlighted focus points.
4. Health Advisory
An Advisory section suggesting what modifications to bring in your nutrition & lifestyle,
recommendations on your BMI along with regular tests and further consultations to pursue
for a healthier future.
5. General Recommendations
Brief view of general preventive test recommendations categorized by age groups. Refer
this section to know at what age, which tests are necessary and at what frequency they
should be booked.
Disclaimer:
This report is not intended to replace but to lead by providing comprehensive information. It is recommended that you consult your doctor/physician for interpretation of results.
All reports might not be applicable for individuals less than 18, pregnant women or individuals suffering from diseases for which health test has not been performed or symptoms not diagnosed.
This report is based on preventive health test screening and is meant for a healthy lifestyle. It does not provide any recommendation for life threatening situations.
It is strongly recommended to take required precautions for allergic reactions or sensitivities.
For any concern regarding this report, call our quality helpline at: 78 36 86 66 55 www.healthians.com
Smart Report
HEALTH ANALYSIS
Personalized Summary & Vital Parameters
Jabir Shaik
Booking ID : 3695311166
Vitamin B12
Test not taken
Liver Function
Alanine Aminotransferase
(ALT/SGPT) : 17 U/l
Everything looks good
Calcium Total
9.5 mg/dl
Everything looks good
Iron studies
Serum Iron : 131.0 ug/dl
Everything looks good
Complete
Hemogram
Haemoglobin (HB) : 17.6 g/dl
Concern
Jabir Shaik,
Congratulations, We have successfully completed your health diagnosis. This is a big
step towards staying on top of your health and identify potential to improve!
10 Vital Health Parameters of a Human Body Ecosystem
Below are the health parameters which require routine checkups for primary healthcare.
The view also includes personalised information depending on the tests you have taken.
Comorbidities: Yes
* Adults of any age with Comorbidities are at increased risk of severe illness from the virus that causes COVID-19.
Your Health Score
78
Out of 100
*Calculated from test reports
Thyroid Function
Thyroid Stimulating Hormone
(TSH)-Ultrasensit : 4.0780
uIU/ml
Everything looks good
Cholesterol Total
230 mg/dl
Concern
Kidney Function
Serum Creatinine : 0.80 mg/dl
Concern
Vitamin D
Test not taken
HbA1c
8.90 %
Concern
For any concern regarding this report, call our quality helpline at: 78 36 86 66 55 www.healthians.com
Smart Report
HEALTH ANALYSIS
Critical Parameters
Jabir Shaik
Booking ID : 3695311166
Blood Glucose Fasting
This test measures the blood sugar level in the fasting state. It is done as a part of routine
health tests, for diabetes screening and to monitor diabetic treatment. This test helps to
detect prediabetes, type 1 and type 2 diabetes and gestational diabetes.
Impact on overall health?
This test can assess your risk of diabetes and evaluate the effectiveness of any ongoing diabetes
treatment.
How to improve health conditions?
For high or low blood glucose levels, consult a physician for further investigations. Follow a healthy
diet, Be active and practice stress management techniques.
Your Result Value
170.81mg/dl
Concern
Normal Value
70-100 mg/dl
Creatinine, Serum
Creatinine is a chemical waste in your blood, produced from muscle metabolism and
excess meat consumption. It is normally removed from your blood by your kidneys, but
when kidney function slows down, the creatinine level rises. The Creatinine Serum test is
hence required to monitor kidney functions.
Impact on overall health?
This test assess your kidney function, determines your risk of kidney damage and renal complications
of high blood pressure or diabetes.
How to improve health conditions?
In case of high creatinine levels, consult a doctor for clinical evaluation and discuss further tests. It is
often advisable to reduce protein intake and avoid strenuous exercises.
Your Result Value
0.8mg/dl
Concern
Normal Value
0.84-1.25 mg/dl
We have observed that the below given critical parameters have shown out of range results, which
can have negative impact on your health.
For any concern regarding this report, call our quality helpline at: 78 36 86 66 55 www.healthians.com
Smart Report
HEALTH ANALYSIS
HISTORICAL CHARTS
Jabir Shaik
Booking ID : 3695311166
Concern
Glycated Hemoglobin (HbA1c)
Your Latest result
8.90 %
12th Sep 2021
Everything looks good
Iron, Serum
Your Latest result
131.0 ug/dl
12th Sep 2021
Everything looks good
Calcium Total, Serum
Your Latest result
9.5 mg/dl
12th Sep 2021
Borderline Result
Creatinine, Serum
Your Latest result
0.80 mg/dl
12th Sep 2021
Concern
Hemoglobin Hb
Your Latest result
17.6 g/dl
12th Sep 2021
Borderline Result
Cholesterol-Total, Serum
Your Latest result
230 mg/dl
12th Sep 2021
Everything looks good
TSH Ultra - sensitive
Your Latest result
4.0780
uIU/ml
12th Sep 2021
Everything looks good
SGOT/SGPT Ratio
Your Latest result
1.06 Ratio
12th Sep 2021
For any concern regarding this report, call our quality helpline at: 78 36 86 66 55 www.healthians.com
4.2 5.7 •
Sep'21
8.9
70 180
•
Sep'21
131
8.8 10.6
•
Sep'21
9.5
0.84 1.25
•
Sep'21
0.8
13.0 17.0 •
Sep'21
17.6
0 200 •
Sep'21
230
0.45 5.33
•
Sep'21
4.078
0.7 1.4
•
Sep'21
1.06
HbA1c - Glycated Hemoglobin
Hba1c (Glycosylated Hemoglobin)
Method: HPLC
8.90 % 4.2 - 5.7
Average Estimated Glucose - plasma 208.73 mg/dl
INTERPRETATION:
AS PER AMERICAN DIABETES ASSOCIATION (ADA):
REFERENCE GROUP GLYCOSYLATED HEMOGLOGIB (HBA1c) in %
Non diabetic <5.7
At Risk (Prediabetes) 5.7 – 6.4
Diagnosing Diabetes >= 6.5
Therapeutic goals for glycemic control
Age > 19 Years
Goals of Therapy: < 7.0
Actions Suggested: >8.0
Age < 19 Years
Goal of therapy: <7.5
REMARKS :
1. HbA1c is used for monitoring diabetic control. It reflects the mean plasma glucose over three months
2. HbA1c may be falsely low in diabetics with hemolytic disease. In these individuals a plasma fructosamine level may be used which evaluates diabetes over 15 days.
3. Inappropriately low HbA1c values may be reported due to hemolysis, recent blood transfusion, acute blood loss, hypertriglyceridemia, chronic liver disease. Drugs
like dapsone, ribavirin, antiretroviral drugs, trimethoprim, may also cause interference with estimation of HbA1c, causing falsely low values.
4. HbA1c may be increased in patients with polycythemia or post-splenectomy.
5. Inappropriately higher values of HbA1c may be caused due to iron deficiency, vitamin B12 deficiency, alcohol intake, uremia, hyperbilirubinemia and large doses
of aspirin.
6. Trends in HbA1c are a better indicator of diabetic control than a solitary test.
7. Any sample with >15% HbA1c should be suspected of having a hemoglobin variant, especially in a non-diabetic patient. Similarly, below 4% should prompt
additional studies to determine the possible presence of variant hemoglobin.
8. HbA1c target in pregnancy is to attain level <6 % .
9. HbA1c target in paediatric age group is to attain level < 7.5 %.
Method : Ion-exchange high-performance liquid chromatography (HPLC).
Reference : American Diabetes Associations. Standards of Medical Care in Diabetes 2015
Patient Name : Jabir Shaik 3695311166
Age/Gender : 32/Male
Order Id : 3695311166
Referred By : Self
Customer Since : 12/Sep/2021
Sample Type : Whole Blood EDTA
Barcode : H4241869
Sample Collected On : 12/Sep/2021 07:21AM
Sample Received On : 12/Sep/2021 09:55AM
Report Generated On : 12/Sep/2021 01:41PM
Sample Temperature : Maintained
ReportStatus : Final Report
DEPARTMENT OF BIOCHEMISTRY HBA1C
Test Name Value Unit Bio. Ref Interval
SIN No:H4241869
Page 1 of 14
Fasting Blood Sugar
Glucose, Fasting
Method: Hexokinase
170.81 mg/dl 70 - 100
American Diabetes Association Reference Range :
Normal : < 100 mg/dl
Impaired fasting glucose(Prediabetes) : 100 - 126 mg/dl
Diabetes : >= 126 mg/dl
Conditions that can result in an elevated blood glucose level include: Acromegaly, Acute stress (response to trauma, heart attack,
and stroke for instance), Chronic kidney disease, Cushing syndrome, Excessive consumption of food, Hyperthyroidism,
Pancreatitis
A low level of glucose may indicate hypoglycemia, a condition characterized by a drop in blood glucose to a level where first it
causes nervous system symptoms (sweating, palpitations, hunger, trembling, and anxiety), then begins to affect the brain (causing
confusion, hallucinations, blurred vision, and sometimes even coma and death). A low blood glucose level (hypoglycemia) may be
seen with:Adrenal insufficiency, Drinking excessive alcohol, Severe liver disease, Hypopituitarism, Hypothyroidism, Severe
infections, Severe heart failure, Chronic kidney (renal) failure, Insulin overdose, Tumors that produce insulin (insulinomas),
Starvation.
Patient Name : Jabir Shaik 3695311166
Age/Gender : 32/Male
Order Id : 3695311166
Referred By : Self
Customer Since : 12/Sep/2021
Sample Type : Flouride Plasma
Barcode : H4241869
Sample Collected On : 12/Sep/2021 07:21AM
Sample Received On : 12/Sep/2021 09:55AM
Report Generated On : 12/Sep/2021 06:02PM
Sample Temperature : Maintained
ReportStatus : Final Report
DEPARTMENT OF BIOCHEMISTRY
Test Name Value Unit Bio. Ref Interval
SIN No:H4241869
Page 2 of 14
Lipid Profile
Total Cholesterol
Method: CHO-POD
230 mg/dl Desirable : <200
Borderline: 200-239
High : >/=240
Serum Triglycerides
Method: GPO-POD
569 mg/dl Desirable : <150
Borderline high : 150-199
High : 200-499
Very high : > 500
Serum HDL Cholesterol
Method: Enzymatic immuno inhibition
42.2 mg/dl 40 - 59
Serum LDL Cholesterol
Method: Enzymatic
149.2 mg/dl Optimal : <100
near /above Optimal:100 -
129
Borderline High:130 - 159
High : 160 - 189
Very High :>/=190
Serum VLDL Cholesterol
Method: Calculated
113.8 mg/dl 06 - 30
Total CHOL / HDL Cholesterol Ratio
Method: Calculated
5.46 Ratio 3.30 - 4.40
LDL / HDL Cholesterol Ratio
Method: Calculated
3.54 Ratio Desirable/Low Risk: 0.5-3.0
Line/Moderate Risk: 3.0-6.0
Elevated/High Risk: >6.0
HDL / LDL Cholesterol Ratio 0.28 Ratio Desirable/Low Risk : 0.5 -
3.0
Border Line/Moderate Risk :
3.0 - 6.0
Elevated/High Risk: > 6.0
Non-HDL Cholesterol
Method: Calculated
188.1 mg/dl 0.0 - 160.0
KINDLY CORRELATE CLINICALLY
Dyslipidemia is a disorder of fat or lipoprotein metabolism in the body and includes lipoprotein overproduction or deficiency. Dyslipidemias means increase in the level
Patient Name : Jabir Shaik 3695311166
Age/Gender : 32/Male
Order Id : 3695311166
Referred By : Self
Customer Since : 12/Sep/2021
Sample Type : SERUM
Barcode : H4241869
Sample Collected On : 12/Sep/2021 07:21AM
Sample Received On : 12/Sep/2021 09:55AM
Report Generated On : 12/Sep/2021 07:53PM
Sample Temperature : Maintained
ReportStatus : Final Report
DEPARTMENT OF BIOCHEMISTRY
Test Name Value Unit Bio. Ref Interval
SIN No:H4241869
Page 3 of 14
of one or more of the following:
Total Cholesterol
The "bad" cholesterol or low density lipoprotein (LDL) and/or triglyceride concentrations. Dyslipidemia also includes a decrease in the “good" cholesterol or high-density
lipoprotein (HDL) concentration in the blood.
Lipid level assessments must be made following 9 to 12 hours of fasting, otherwise assay results might lead to erroneous interpretation.
Healthians labs report biological reference intervals (normal ranges) in accordance to the recommendations of The National Cholesterol Education Program (NCEP) &
Adult Treatment Panel IV (ATP IV) Guidelines providing the most desirable targets of various circulating lipid fractions in the blood. NCEP recommends that all
adults above 20 years of age must be screened for abnormal lipid levels.
*NCEP recommends the assessment of 3 different samples drawn at intervals of 1 week for harmonizing biological variables that might be encountered in single assays.
Hence a single result of Lipid Profile may not be adequate for clinical decision making. Healthians' counselling team will reach you shortly to explain implications of your
report. You may reach out to customer support helpline as well.
*NCEP recommends lowering of LDL Cholesterol as the primary therapeutic target with lipid lowering agents, however, if triglycerides remain >200 mg/dL after LDL
goal is reached, set secondary goal for non-HDL cholesterol (total minus HDL) 30 mg/dL higher than LDL goal.
*High Triglyceride and low HDL levels are independent risk factors for Coronary Heart disease and requires further clinical consultation.
*Healthians lab performs direct LDL measurement which is more appropriate and may vary from other lab reports which provide calculated LDL values.
Patient Name : Jabir Shaik 3695311166
Age/Gender : 32/Male
Order Id : 3695311166
Referred By : Self
Customer Since : 12/Sep/2021
Sample Type : SERUM
Barcode : H4241869
Sample Collected On : 12/Sep/2021 07:21AM
Sample Received On : 12/Sep/2021 09:55AM
Report Generated On : 12/Sep/2021 07:53PM
Sample Temperature : Maintained
ReportStatus : Final Report
DEPARTMENT OF BIOCHEMISTRY
Test Name Value Unit Bio. Ref Interval
SIN No:H4241869
Page 4 of 14
Liver Function Test (LFT)
Serum Bilirubin, (Total)
Method: DPD
0.80 mg/dl 0.3 - 1.2
Serum Bilirubin, (Direct)
Method: Diazo
0.11 mg/dl 0.0 - 0.2
Serum Bilirubin, (Indirect)
Method: Calculated
0.69 0.0 - 0.8
Aspartate Aminotransferase (AST/SGOT)
Method: IFCC
18 U/L < 50
Alanine Aminotransferase (ALT/SGPT)
Method: IFCC
17 U/l < 50
Alkaline Phosphatase (ALP)
Method: IFCC AMP Buffer
77 U/L 30-120
Gamma Glutamyl Transferase (GGT)
Method: IFCC
37.2 U/L <55
Serum Total Protein
Method: Biuret
7.3 g/dl 6.6 - 8.3
SerumAlbumin
Method: Bromo Cresol Green(BCG)
4.4 g/dl 3.50 - 5.2
Serum Globulin
Method: Calculated
2.9 gm/dl 3.0 - 4.2
Albumin/GlobulinRatio
Method: Calculated
1.52 Ratio 1.2 - 2.0
SGOT/SGPT Ratio
Method: Calculated
1.06 Ratio 0.7 - 1.4
Bilirubin is a yellowish pigment found in bile and is a breakdown product of normal heme catabolism. Elevated levels results from increased bilirubin production (eg
hemolysis and ineffective erythropoiesis); decreased bilirubin excretion (eg; obstruction and hepatitis); and abnormal bilirubin metabolism (eg; hereditary and neonatal
jaundice). Conjugated (direct) bilirubin is elevated more than unconjugated (indirect) bilirubin in viral hepatitis; drug reactions, alcoholic liver disease conjugated (direct)
bilirubin is also elevated more than unconjugated (indirect) bilirubin when there is some kind of blockage of the bile ducts like in Gallstones getting into the bile ducts
tumors & Scarring of the bile ducts. Increased unconjugated (indirect) bilirubin may be a result of hemolytic or pernicious anemia, transfusion reaction & a common
metabolic condition termed Gilbert syndrome.
AST levels increase in viral hepatitis, blockage of the bile duct ,cirrhosis of the liver, liver cancer, kidney failure, hemolytic anemia, pancreatitis, hemochromatosis. Ast
levels may also increase after a heart attck or strenuous activity. ALT is commonly measured as a part of a diagnostic evaluation of hepatocellular injury, to determine
liver health. Elevated ALP levels are seen in Biliary Obstruction, Osteoblastic Bone Tumors, Osteomalacia, Hepatitis, Hyperparathyriodism, Leukemia, Lymphoma,
paget`s disease, Rickets, Sarcoidosis etc.
Elevated serum GGT activity can be found in diseases of the liver, Biliary system and pancreas. Conditions that increase serum GGT are obstructive liver disease, high
alcohol consumption and use of enzyme-including drugs etc.
Patient Name : Jabir Shaik 3695311166
Age/Gender : 32/Male
Order Id : 3695311166
Referred By : Self
Customer Since : 12/Sep/2021
Sample Type : Serum
Barcode : H4241869
Sample Collected On : 12/Sep/2021 07:21AM
Sample Received On : 12/Sep/2021 09:55AM
Report Generated On : 12/Sep/2021 07:53PM
Sample Temperature : Maintained
ReportStatus : Final Report
DEPARTMENT OF BIOCHEMISTRY
Test Name Value Unit Bio. Ref Interval
SIN No:H4241869
Page 5 of 14
Serum total protein, also known as total protein, is a biochemical test for measuring the total amount of protein in serum..Protein in the plasma is made up of albumin
and globulin. Higher-than-normal levels may be due to: Chronic inflammation or infection, including HIV and hepatitis B or C, Multiple myeloma,Waldenstrom's disease.
Lower-than-normal levels may be due to: Agammaglobulinemia, Bleeding (hemorrhage), Burns, Glomerulonephritis, Liver disease, Malabsorption, Malnutrition,
Nephrotic - Human serum albumin is the most abundant protein in human blood plasma. It is produced in the liver.Albumin constitutes about half of the blood serum
protein. Low blood albumin levels (hypoalbuminemia) can be caused by: Liver disease like cirrhosis of the liver, nephrotic syndrome, protein-losing enteropathy, Burns,
hemodilution, increased vascular permeability or decreased lymphatic clearance, malnutrition and wasting etc.
Patient Name : Jabir Shaik 3695311166
Age/Gender : 32/Male
Order Id : 3695311166
Referred By : Self
Customer Since : 12/Sep/2021
Sample Type : Serum
Barcode : H4241869
Sample Collected On : 12/Sep/2021 07:21AM
Sample Received On : 12/Sep/2021 09:55AM
Report Generated On : 12/Sep/2021 07:53PM
Sample Temperature : Maintained
ReportStatus : Final Report
DEPARTMENT OF BIOCHEMISTRY
Test Name Value Unit Bio. Ref Interval
SIN No:H4241869
Page 6 of 14
Iron study
Serum Iron
Method: TPTZ
131.0 ug/dl 70 - 180
UIBC
Method: Nitroso-PSAP
250.20 ug/dl 155 - 355
Serum Total Iron Binding Capicity (TIBC)
Method: FE+UIBC (saturation with iron)
381.2 µg/dl 250-400
Transferrin Saturation %
Method: Calculated
34.37 % 16 - 50
Iron participates in a variety of vital processes in the body varying from cellular oxidative mechanisms to the transport and delivery of oxygen to body cells. It is a
constituent of the oxygen-carrying chromoproteins, haemoglobin and myoglobin, as well as various enzymes, such as cytochrome oxidase and peroxidases.
Serum iron may be increased in hemolytic, megaloblastic and aplastic anemias, and in hemochromatosis acute leukemia, lead poisoning, pyridoxine deficiency,
thalassemia, excessive iron therapy, and after repeated transfusions. Drugs causing increased serum iron include chloramphenicol, cisplatin, estrogens (including oral
contraceptives), ethanol, iron dextran, and methotrexate. Iron can be decreased in iron-deficiency anemia, acute and chronic infections, carcinoma, nephrotic syndrome
hypothyroidism, in protein- calorie malnutrition, and after surgery.
Transferrin is the primary plasma iron transport protein, which binds iron strongly at physiological pH. Transferrin is generally only 25% to 30% saturated with iron.
The additional amount of iron that can be bound is the unsaturated iron-binding capacity (UIBC). Diurnal variation is seen in serum iron levels-normal values in
midmorning, low values in midafternoon, very low values (approximately 10 μg/dL) near midnight.
TIBC measures the blood’s capacity to bind iron with transferrin (TRF). Estrogens and oral contraceptives increase TIBC levels. Asparaginase, chloramphenicol,
corticotropin, cortisone, and testosterone decrease the TIBC levels.
% saturation represents the amount of iron-binding sites that are occupied. Iron saturation is a better index of iron stores than serum iron alone. % saturation is decreased
in iron deficiency anemia (usually <10% in established deficiency).
Transferrin is the primary plasma iron transport protein, which binds iron strongly at physiological pH. Transferrin is generally only 25% to 30% saturated with iron.
The additional amount of iron that can be bound is the unsaturated iron-binding capacity (UIBC). Diurnal variation is seen in serum iron levels- normal values in
midmorning, low values in midafternoon, very low values (approximately 10 μg/dL) near midnight.
TIBC measures the blood’s capacity to bind iron with transferrin (TRF). Estrogens and oral contraceptives increase TIBC levels. Asparaginase, chloramphenicol,
corticotropin, cortisone, and testosterone decrease the TIBC levels.
% saturation represents the amount of iron-binding sites that are occupied. Iron saturation is a better index of iron stores than serum iron alone. % saturation is decreased
in iron deficiency anemia (usually <10% in established deficiency).
Patient Name : Jabir Shaik 3695311166
Age/Gender : 32/Male
Order Id : 3695311166
Referred By : Self
Customer Since : 12/Sep/2021
Sample Type : SERUM
Barcode : H4241869
Sample Collected On : 12/Sep/2021 07:21AM
Sample Received On : 12/Sep/2021 09:55AM
Report Generated On : 12/Sep/2021 07:53PM
Sample Temperature : Maintained
ReportStatus : Final Report
DEPARTMENT OF BIOCHEMISTRY
IRON STUDY
Test Name Value Unit Bio. Ref Interval
SIN No:H4241869
Page 7 of 14
Kidney Function Test1 (KFT1)
Serum Creatinine
Method: Jaffes Kinetic
0.80 mg/dl 0.84-1.25
Serum Uric Acid
Method: Uricase
5.7 mg/dl 3.5 - 7.2
Serum Calcium
Method: Arsenazo
9.5 mg/dl 8.8 - 10.6
Serum Phosphorus
Method: Phosphomolybdate complex
3.4 mg/dl 2.5 -4.5
Serum Sodium
Method: ISE (Indirect)
137 mEq/L 135 - 145
Serum Chloride
Method: ISE (Indirect)
98 mEq/L 96 - 110
Blood Urea
Method: Urease
23 mg/dl 17-43
Blood Urea Nitrogen (BUN)
Method: Calculated
10.9 mg/dl 8 - 20
Bun/Creatinine Ratio
Method: Calculated
13.61 Ratio
Urea/Creatinine Ratio
Method: Calculated
29.13 Ratio
Patient Name : Jabir Shaik 3695311166
Age/Gender : 32/Male
Order Id : 3695311166
Referred By : Self
Customer Since : 12/Sep/2021
Sample Type : SERUM
Barcode : H4241869
Sample Collected On : 12/Sep/2021 07:21AM
Sample Received On : 12/Sep/2021 09:55AM
Report Generated On : 12/Sep/2021 07:53PM
Sample Temperature : Maintained
ReportStatus : Final Report
DEPARTMENT OF BIOCHEMISTRY
Test Name Value Unit Bio. Ref Interval
SIN No:H4241869
Page 8 of 14
Urine Routine & Microscopy Extended
PHYSICAL EXAMINATION
Colour
Method: Visual
Pale Yellow Pale Yellow
Volume 20.00 mL
Appearance
Method: Visual
Clear Clear
CHEMICAL EXAMINATION
Specific Gravity
Method: Dipstick-Ion exchange
1.025 1.001 - 1.035
pH
Method: Dipstick-Double indicator
5.0 4.5 - 7.5
Glucose
Method: Dipstick-oxidase peroxidas
Negative Negative
Urine Protein
Method: Dipstick-Bromophenol blue
Negative Negative
Ketones
Method: Sodium nitroprusside
Negative Negative
Urobilinogen
Method: Dipstick-Ehrlichs Test
Normal Normal
Bilirubin
Method: Dipstick-Ehrlichs Test
Negative Negative
Nitrite
Method: Dipstick-Griess test
Negative Negative
Blood
Method: Dipstick-Peroxidase
Negative Negative
Leucocyte Esterase
Method: Dipstick- Esterase
Negative Negative
MICROSCOPIC EXAMINATION
Pus Cells
Method: Microscopic Examination
2-3 /HPF 0 - 5
Epithelial cells
Method: Microscopic Examination
1-2 /HPF 0 - 5
RBCs
Method: Microscopic Examination
Nil /HPF Nil
Patient Name : Jabir Shaik 3695311166
Age/Gender : 32/Male
Order Id : 3695311166
Referred By : Self
Customer Since : 12/Sep/2021
Sample Type : URINE
Barcode : H4241869
Sample Collected On : 12/Sep/2021 07:21AM
Sample Received On : 12/Sep/2021 09:55AM
Report Generated On : 12/Sep/2021 03:45PM
Sample Temperature : Maintained
ReportStatus : Final Report
DEPARTMENT OF CLINICAL PATHOLOGY
Test Name Value Unit Bio. Ref Interval
SIN No:H4241869
Page 9 of 14
Casts
Method: Microscopic Examination
Nil Nil
Crystals
Method: Microscopic Examination
Nil Nil
Bacteria
Method: Microscopic Examination
Absent Absent
Yeast Cell Absent
Others (Non Specific) Nil NIL
Patient Name : Jabir Shaik 3695311166
Age/Gender : 32/Male
Order Id : 3695311166
Referred By : Self
Customer Since : 12/Sep/2021
Sample Type : URINE
Barcode : H4241869
Sample Collected On : 12/Sep/2021 07:21AM
Sample Received On : 12/Sep/2021 09:55AM
Report Generated On : 12/Sep/2021 03:45PM
Sample Temperature : Maintained
ReportStatus : Final Report
DEPARTMENT OF CLINICAL PATHOLOGY
Test Name Value Unit Bio. Ref Interval
SIN No:H4241869
Page 10 of 14
Complete Haemogram
Haemoglobin (HB)
Method: Modified Drabkins Method
17.6 g/dl 13.0-17.0
Total Leucocyte Count (TLC)
Method: Light scatter/Peroxidase
5.9 10^3/uL 4.0-10.0
Hematocrit (PCV)
Method: Calculated
51 % 40.0-50.0
Red Blood Cell Count (RBC) 6.30 millions/cumm 4.50-5.50
Mean Corp Volume (MCV)
Method: Calculated
81.0 FL 83.0-101.0
Mean Corp Hb (MCH)
Method: Calculated
28 pg 27.0-33.0
Mean Corp Hb Conc (MCHC)
Method: Calculated
34.5 gm% 31.5-34.5
RDW - CV
Method: Calculated
14.9 % 12.1-13.6
RDW - SD
Method: Calculated
42.40 FL 36.5-40.8
Mentzer Index 12.86
Differential Leucocyte Count
Neutrophils
Method: Light scatter/Peroxidase
51.0 % 40 - 75
Lymphocytes
Method: Light scatter/Peroxidase
36 % 20 - 45
Monocytes
Method: Light scatter/Peroxidase
8.9 % 01 - 10
Eosinophils
Method: Light scatter/Peroxidase
3.5 % 01 - 06
Basophils
Method: Light scatter/Basophil
0.6 % 00 - 02
Absolute Leucocyte Count
Absolute Neutrophil Count (ANC)
Method: Calculated
3.01 10^3/uL 2.0-7.0
Absolute Lymphocyte Count (ALC) 2.12 10^3/uL 1.0-3.0
Absolute Monocyte Count
Method: Calculated
0.53 10^3/uL 0.2-1.0
Patient Name : Jabir Shaik 3695311166
Age/Gender : 32/Male
Order Id : 3695311166
Referred By : Self
Customer Since : 12/Sep/2021
Sample Type : Whole Blood EDTA
Barcode : H4241869
Sample Collected On : 12/Sep/2021 07:21AM
Sample Received On : 12/Sep/2021 09:55AM
Report Generated On : 12/Sep/2021 01:47PM
Sample Temperature : Maintained
ReportStatus : Final Report
DEPARTMENT OF HAEMATOLOGY
Test Name Value Unit Bio. Ref Interval
SIN No:H4241869
Page 11 of 14
Absolute Eosinophil Count (AEC)
Method: Calculated
0.21 10^3/uL 0.02-0.5
Absolute Basophil Count
Method: Calculated
0.04 10^3/uL 0.02 - 0.10
Platelet Count(PLT)
Method: Automated Electrical Resistance/ Light Microscopy
261 10^3/µl 150-410
PDW 17.8 % 9.6 - 15.2
MPV
Method: Automated
8.0 FL 7.4-11.4
PCT 0.20 % 0.19 - 0.39
ESR 5
The International Council for Standardization in Haematology (ICSH) recommends reporting of absolute counts of various WBC
subsets for clinical decision making. This test has been performed on a fully automated 5 part differential cell counter which counts
over 10,000 WBCs to derive differential counts. A complete blood count is a blood panel that gives information about the cells in
a patient's blood, such as the cell count for each cell type and the concentrations of Hemoglobin and platelets. The cells that
circulate in the bloodstream are generally divided into three types: white blood cells (leukocytes), red blood cells (erythrocytes),
and platelets (thrombocytes). Abnormally high or low counts may be physiological or may indicate disease conditions, and hence
need to be interpreted clinically.
The Mentzer index is used to differentiate iron deficiency anaemia beta thalassemia trait. If a CBC indicates microcytic anaemia,
these are two of the most likely causes, making It necessary to distinguish between them.
If the quotient of the mean corpuscular volume divided by the red blood cell count is then 13, thalassemia is more likely. If the
result is greater than 13, then iron-deficiency anaemia is more likely.
ESR is a non-specific phenomenon, its measurement is clinically useful in disorders associated with an increased production of
acute-phase proteins. it provides an index of progress of the disease in rheumatoid arthritis or tuberculosis, and it is of considerable
value in diagnosis of temporal arteritis and polymyalgia rheumatica. It is often used if multiple myeloma is suspected, but when the
myeloma is non-secretory or light chain, a normal ESR does not exclude this diagnosis.
An elevated ESR occurs as an early feature in myocardial infarction. Although a normal ESR cannot be taken to exclude the
presence of organic disease, the vast majority of acute or chronic infections and most neoplastic and degenerative diseases are
associated with changes in the plasma proteins that increased ES values.
An increased ESR in subjects who are HIV seropositive seems to be an early predictive marker of progression toward acquired
immune deficiency syndrome (AIDS).
The ESR is influenced by age, stage of the menstrual cycle and medications taken (corticosteroids, contraceptive pills). It is
Patient Name : Jabir Shaik 3695311166
Age/Gender : 32/Male
Order Id : 3695311166
Referred By : Self
Customer Since : 12/Sep/2021
Sample Type : Whole Blood EDTA
Barcode : H4241869
Sample Collected On : 12/Sep/2021 07:21AM
Sample Received On : 12/Sep/2021 09:55AM
Report Generated On : 12/Sep/2021 01:47PM
Sample Temperature : Maintained
ReportStatus : Final Report
DEPARTMENT OF HAEMATOLOGY
Test Name Value Unit Bio. Ref Interval
SIN No:H4241869
Page 12 of 14
especially low (0–1 mm) in polycythaemia, hypofibrinogenaemia and congestive cardiac failure and when there are abnormalities of
the red cells such as poikilocytosis, spherocytosis, or sickle cells.
In cases of performance enhancing drug intake by athletes the ESR values are generally lower than the usual value for the
individual and as a result of the increase in haemoglobin (i.e. the effect of secondary polycythaemia).
Patient Name : Jabir Shaik 3695311166
Age/Gender : 32/Male
Order Id : 3695311166
Referred By : Self
Customer Since : 12/Sep/2021
Sample Type : Whole Blood EDTA
Barcode : H4241869
Sample Collected On : 12/Sep/2021 07:21AM
Sample Received On : 12/Sep/2021 09:55AM
Report Generated On : 12/Sep/2021 01:47PM
Sample Temperature : Maintained
ReportStatus : Final Report
DEPARTMENT OF HAEMATOLOGY
Test Name Value Unit Bio. Ref Interval
SIN No:H4241869
Page 13 of 14
Pregnancy interval Bio Ref Range for TSH in uIU/ml (As per American Thyroid Association)
First trimester 0.1 - 2.5
Second trimester 0.2 – 3.0
Third trimester 0.3 – 3.0
Thyroid Profile (Total T3,T4, TSH)
Tri-Iodothyronine (T3, Total)
Method: CLIA
1.11 ng/ml 0.87 - 1.78
Thyroxine (T4, Total)
Method: CLIA
9.26 ug/dl 5.48 - 14.28
Thyroid Stimulating Hormone (TSH)-Ultrasensitive
Method: CLIA
4.0780 uIU/ml 0.45-5.33
Healthians recommends that the following potential sources of variation should be considered while interpreting thyroid hormone results:
1. Thyroid hormones undergo rhythmic variation within the body this is called circadian variation in TSH secretion: Peak levels are seen between 2-4 am.
Minimum levels seen between 6-10 am. This variation may be as much as 50% thus, influence of sampling time needs to be considered for clinical interpretation.
2. Circulating forms of T3 and T4 are mostly reversibly bound with Thyroxine binding globulins (TBG), and to a lesser extent with albumin and Thyroid binding
Pre-Albumin. Thus the conditions in which TBG and protein levels alter such as chronic liver disorders, pregnancy, excess of estrogens, androgens, anabolic
steroids and glucocorticoids may cause misleading total T3, total T4 and TSH interpretations.
3. Total T3 and T4 levels are seen to have physiological rise during pregnancy and in patients on steroid treatment
4. T4 may be normal the presence of hyperthyroidism under the following conditions : T3 thyrotoxicosis, Hypoproteinemia related reduced binding, during intake
of certain drugs (eg Phenytoin, Salicylates etc)
5. Neonates and infants have higher levels of T4 due to increased concentration of TBG
6. TSH levels may be normal in central hypothyroidism, recent rapid correction of hypothyroidism or hyperthyroidism, pregnancy, phenytoin therapy etc.
7. TSH values of <0.03 uIU/mL must be clinically correlated to evaluate the presence of a rare TSH variant in certain individuals which is undetectable by
conventional methods.
8. Presence of Autoimmune disorders may lead to spurious results of thyroid hormones
9. Various drugs can lead to interference in test results
Healthians recommends evaluation of unbound fractions, that is free T3 (fT3) and free T4 (fT4) for clinic-pathologic correlation, as these are the metabolically active
forms.
*** End Of Report ***
Patient Name : Jabir Shaik 3695311166
Age/Gender : 32/Male
Order Id : 3695311166
Referred By : Self
Customer Since : 12/Sep/2021
Sample Type : Serum
Barcode : H4241869
Sample Collected On : 12/Sep/2021 07:21AM
Sample Received On : 12/Sep/2021 09:55AM
Report Generated On : 12/Sep/2021 07:27PM
Sample Temperature : Maintained
ReportStatus : Final Report
DEPARTMENT OF IMMUNOLOGY
Test Name Value Unit Bio. Ref Interval
SIN No:H4241869
Page 14 of 14
Terms & Conditions:
1) Machine Data is available for last 7 days only. In case of manual testing & outsourced testing, machine data will not be available.
2) CBC parameters may vary when it is manually reviewed by the Pathologists.
3) For Thyroid tests - Circulating TSH shows a normal circadian rhythm with a peak between 11pm-5am and a nadir between 5pm-8pm. TSH
values are also lowered after food when compared to fasting in a statistically significant manner. This variation is of the order of ±50%, hence
time of day and fasting status have influence on the reported TSH level.
4) For Lipid profile - Lipid and Lipoprotein concentrations vary during the normal course of daily activity. Also, certain drugs, diet and alcohol can
have lasting effects on Triglyceride levels. To obtain best results for Lipid testing, a strict fasting of 10-12 hours with a light meal on the previous
night is recommended.
5) For Covid19 testing, Healthians works with ICMR approved partner Labs only. The accuracy of the results are ensured by Partner Labs. Testing
lab name is mentioned on the report. We do not charge anything extra for sample collection.
6) Test results released pertain to the specimen submitted.
7) Test results are dependent on the quality of the sample received by the Lab.
8) The tests are carried out in the lab with the presumption that the specimen belongs to the patient named or identified in the bill/test request
form/booking ID.
9) The reported results are for information and are subject to confirmation and interpretation by the referring doctor to co-relate clinically.
10) Test results may show interlaboratory variations.
11) Liability of Healthians for deficiency of services or other errors and omissions shall be limited to the fee paid by the patient for the relevant
laboratory services.
12) This report is not subject to use for any medico-legal purposes.
Smart Report
ADVISORY
Health Advisory
Jabir Shaik
Booking ID : 3695311166
Body Mass Index
No Data
Height
No Data
Weight
No Data
Physical Activity
· No Data
Medication
·No Data Found
Smoke
No Data
Alcohol
No Data
Food Preference
No Data
Family History
No Data
Blood Pressure
No Data
Sugar levels
No Data
SUGGESTED
NUTRITION
SUGGESTED NUTRITION
Do's
Include seeds like flaxseeds, chia seeds, sunflower
seeds
Include fruits like apples, berries and melons in your
diet
Include nuts like almonds, walnuts and seeds like
flaxseeds, sunflower seeds
Have a balanced diet that includes whole grains,
pulses, dairy, fruits, vegetables, nuts and healthy fats
Have dates and figs
Take vitamin C rich foods like citrus fruits, strawberries
and green, leafy vegetables
Include fresh garlic and fenugreek seeds in your diet
Include whole grains in your diet like whole wheat
bread and other products, brown rice or hand
pounded rice, oats
Dont's
Limit sugar intake
Limit tea and coffee
Decrease intake of colas and sugary drinks
Avoid flavoured and seasoned foods
Avoid saturated fats, transfats, oily and greasy foods
like cakes, creamy or fried foods
Limit intake of salt
Avoid refined carbs, processed foods
Avoid the use of oil and avoid sauces and dressings
Avoid high cholesterol and calorie dense foods
Avoid red meat and organ meats
SUGGESTED
LIFESTYLE
SUGGESTED LIFESTYLE
Do's
Lose weight gradually and stay active
Maintain ideal weight
Sleep well at night and do relaxing activities
Dont's
Avoid late night heavy meals
Avoid overworking or being stressed for long time
Avoid smoking and alcohol
Avoid long periods of inactivity
Avoid overexertion without having food or drink
Avoid strenuous exercises
Avoid overeating or calorie rich food
SUGGESTED
FUTURE
TESTS
SUGGESTED FUTURE TESTS
Glycated Hemoglobin (HbA1c) - Every 3 Month
Blood Glucose Fasting - Every 1 Week
Glucose Postprandial - Every 1 Week
Liver Function Test - Every 3 Month
Kidney Function Test - Every 3 Month
Lipid Profile - Every 3 Month
Microalbumin, Urine spot - Every 6 Month
For any concern regarding this report, call our quality helpline at: 78 36 86 66 55 www.healthians.com
Smart Report
HEALTH ADVISORY
Suggestions for Health & Well-being
Jabir Shaik
Booking ID : 3695311166
PHYSICAL
ACTIVITY
PHYSICAL ACTIVITY
Physical activities can vary from Regular walks (Brisk or normal),
Jogging , Sports, Stretching, Yoga to light weight lifting etc. It is
recommended to partake in physical activity at least 30 minutes
a day for 3-4 days a week.
If regular workout is difficult, then we can adapt changes such as
using stairs instead of lift/escalators and doing household work!
BALANCED DIET
A balanced diet is the key to healthy lifestyle. Include Whole
grains, vegetables, whole fruits, nuts, seeds, beans, plant oils in
your diet.
It is recommended to always have a high protein breakfast and a
light dinner. Avoid items such as processed foods, potatoes and
high calorie/sugar products. Don't forget to drink water regularly!
BALANCED
DIET
STRESS
MANAGEMENT
STRESS MANAGEMENT
Managing stress is an essential part of well-being. Some day to
day changes can help such as having sufficient sleep (6-8 hours),
indulging yourself in meditation, positive attitude towards lifestyle,
using humor, traveling, talking to people whom you feel
comfortable with and making time for hobbies by doing what you
love to do.
BMI INFORMATION NOT AVAILABLE
Please fill your Health Karma to know your BMI results
For any concern regarding this report, call our quality helpline at: 78 36 86 66 55 www.healthians.com

52fa4d7ca11d1cf598bff16b44b4ab12613e0f5b92eec

  • 1.
    Booking ID :3695311166 Jabir Shaik Male, 32 Years A Comprehensive Health Analysis Report A I B a s e d P e r s o n a l i z e d R e p o r t f o r Y o u INDIA’S FIRST & ONLY CREDIBILITY CHECK FOR YOUR LAB REPORT Check the authenticity of your lab report with machine data Scan the QR using any QR code scanner or alternatively follow below steps : Go to bit.ly/verifyqr on your mobile Scan the QR Code For any concern regarding this report, call our quality helpline at: 78 36 86 66 55 www.healthians.com
  • 2.
    Smart Report Jabir ShaikI Booking ID : 3695311166 Healthians Smart Report A Self explanatory Health Diagnostics Report Healthians Smart report is India's most innovative and easy to understand report that describes all information in an intuitive way required for better health & lifestyle of customers Below are the sections which depict what you can expect from this report , how you can read this report and use it for your well-being. 1. Health Analysis This section summarizes your test results, your critical health parameters and on basis of them where you should draw your attention to. This has been determined by lab results & health karma questions which you answered regarding your lifestyle. 2. Historical Charts These charts are a way to measure and keep a track of how your health has progressed over time. We depict important parameters here and depending on your test history, the charts describe rise and fall of your health metrics. 3. Lab Test Results Comprehensive test results generated through use of latest technology and quality checks by health experts. This section provides an exhaustive view of which tests you have taken, ideal result and your actual result with highlighted focus points. 4. Health Advisory An Advisory section suggesting what modifications to bring in your nutrition & lifestyle, recommendations on your BMI along with regular tests and further consultations to pursue for a healthier future. 5. General Recommendations Brief view of general preventive test recommendations categorized by age groups. Refer this section to know at what age, which tests are necessary and at what frequency they should be booked. Disclaimer: This report is not intended to replace but to lead by providing comprehensive information. It is recommended that you consult your doctor/physician for interpretation of results. All reports might not be applicable for individuals less than 18, pregnant women or individuals suffering from diseases for which health test has not been performed or symptoms not diagnosed. This report is based on preventive health test screening and is meant for a healthy lifestyle. It does not provide any recommendation for life threatening situations. It is strongly recommended to take required precautions for allergic reactions or sensitivities. For any concern regarding this report, call our quality helpline at: 78 36 86 66 55 www.healthians.com
  • 3.
    Smart Report HEALTH ANALYSIS PersonalizedSummary & Vital Parameters Jabir Shaik Booking ID : 3695311166 Vitamin B12 Test not taken Liver Function Alanine Aminotransferase (ALT/SGPT) : 17 U/l Everything looks good Calcium Total 9.5 mg/dl Everything looks good Iron studies Serum Iron : 131.0 ug/dl Everything looks good Complete Hemogram Haemoglobin (HB) : 17.6 g/dl Concern Jabir Shaik, Congratulations, We have successfully completed your health diagnosis. This is a big step towards staying on top of your health and identify potential to improve! 10 Vital Health Parameters of a Human Body Ecosystem Below are the health parameters which require routine checkups for primary healthcare. The view also includes personalised information depending on the tests you have taken. Comorbidities: Yes * Adults of any age with Comorbidities are at increased risk of severe illness from the virus that causes COVID-19. Your Health Score 78 Out of 100 *Calculated from test reports Thyroid Function Thyroid Stimulating Hormone (TSH)-Ultrasensit : 4.0780 uIU/ml Everything looks good Cholesterol Total 230 mg/dl Concern Kidney Function Serum Creatinine : 0.80 mg/dl Concern Vitamin D Test not taken HbA1c 8.90 % Concern For any concern regarding this report, call our quality helpline at: 78 36 86 66 55 www.healthians.com
  • 4.
    Smart Report HEALTH ANALYSIS CriticalParameters Jabir Shaik Booking ID : 3695311166 Blood Glucose Fasting This test measures the blood sugar level in the fasting state. It is done as a part of routine health tests, for diabetes screening and to monitor diabetic treatment. This test helps to detect prediabetes, type 1 and type 2 diabetes and gestational diabetes. Impact on overall health? This test can assess your risk of diabetes and evaluate the effectiveness of any ongoing diabetes treatment. How to improve health conditions? For high or low blood glucose levels, consult a physician for further investigations. Follow a healthy diet, Be active and practice stress management techniques. Your Result Value 170.81mg/dl Concern Normal Value 70-100 mg/dl Creatinine, Serum Creatinine is a chemical waste in your blood, produced from muscle metabolism and excess meat consumption. It is normally removed from your blood by your kidneys, but when kidney function slows down, the creatinine level rises. The Creatinine Serum test is hence required to monitor kidney functions. Impact on overall health? This test assess your kidney function, determines your risk of kidney damage and renal complications of high blood pressure or diabetes. How to improve health conditions? In case of high creatinine levels, consult a doctor for clinical evaluation and discuss further tests. It is often advisable to reduce protein intake and avoid strenuous exercises. Your Result Value 0.8mg/dl Concern Normal Value 0.84-1.25 mg/dl We have observed that the below given critical parameters have shown out of range results, which can have negative impact on your health. For any concern regarding this report, call our quality helpline at: 78 36 86 66 55 www.healthians.com
  • 5.
    Smart Report HEALTH ANALYSIS HISTORICALCHARTS Jabir Shaik Booking ID : 3695311166 Concern Glycated Hemoglobin (HbA1c) Your Latest result 8.90 % 12th Sep 2021 Everything looks good Iron, Serum Your Latest result 131.0 ug/dl 12th Sep 2021 Everything looks good Calcium Total, Serum Your Latest result 9.5 mg/dl 12th Sep 2021 Borderline Result Creatinine, Serum Your Latest result 0.80 mg/dl 12th Sep 2021 Concern Hemoglobin Hb Your Latest result 17.6 g/dl 12th Sep 2021 Borderline Result Cholesterol-Total, Serum Your Latest result 230 mg/dl 12th Sep 2021 Everything looks good TSH Ultra - sensitive Your Latest result 4.0780 uIU/ml 12th Sep 2021 Everything looks good SGOT/SGPT Ratio Your Latest result 1.06 Ratio 12th Sep 2021 For any concern regarding this report, call our quality helpline at: 78 36 86 66 55 www.healthians.com 4.2 5.7 • Sep'21 8.9 70 180 • Sep'21 131 8.8 10.6 • Sep'21 9.5 0.84 1.25 • Sep'21 0.8 13.0 17.0 • Sep'21 17.6 0 200 • Sep'21 230 0.45 5.33 • Sep'21 4.078 0.7 1.4 • Sep'21 1.06
  • 6.
    HbA1c - GlycatedHemoglobin Hba1c (Glycosylated Hemoglobin) Method: HPLC 8.90 % 4.2 - 5.7 Average Estimated Glucose - plasma 208.73 mg/dl INTERPRETATION: AS PER AMERICAN DIABETES ASSOCIATION (ADA): REFERENCE GROUP GLYCOSYLATED HEMOGLOGIB (HBA1c) in % Non diabetic <5.7 At Risk (Prediabetes) 5.7 – 6.4 Diagnosing Diabetes >= 6.5 Therapeutic goals for glycemic control Age > 19 Years Goals of Therapy: < 7.0 Actions Suggested: >8.0 Age < 19 Years Goal of therapy: <7.5 REMARKS : 1. HbA1c is used for monitoring diabetic control. It reflects the mean plasma glucose over three months 2. HbA1c may be falsely low in diabetics with hemolytic disease. In these individuals a plasma fructosamine level may be used which evaluates diabetes over 15 days. 3. Inappropriately low HbA1c values may be reported due to hemolysis, recent blood transfusion, acute blood loss, hypertriglyceridemia, chronic liver disease. Drugs like dapsone, ribavirin, antiretroviral drugs, trimethoprim, may also cause interference with estimation of HbA1c, causing falsely low values. 4. HbA1c may be increased in patients with polycythemia or post-splenectomy. 5. Inappropriately higher values of HbA1c may be caused due to iron deficiency, vitamin B12 deficiency, alcohol intake, uremia, hyperbilirubinemia and large doses of aspirin. 6. Trends in HbA1c are a better indicator of diabetic control than a solitary test. 7. Any sample with >15% HbA1c should be suspected of having a hemoglobin variant, especially in a non-diabetic patient. Similarly, below 4% should prompt additional studies to determine the possible presence of variant hemoglobin. 8. HbA1c target in pregnancy is to attain level <6 % . 9. HbA1c target in paediatric age group is to attain level < 7.5 %. Method : Ion-exchange high-performance liquid chromatography (HPLC). Reference : American Diabetes Associations. Standards of Medical Care in Diabetes 2015 Patient Name : Jabir Shaik 3695311166 Age/Gender : 32/Male Order Id : 3695311166 Referred By : Self Customer Since : 12/Sep/2021 Sample Type : Whole Blood EDTA Barcode : H4241869 Sample Collected On : 12/Sep/2021 07:21AM Sample Received On : 12/Sep/2021 09:55AM Report Generated On : 12/Sep/2021 01:41PM Sample Temperature : Maintained ReportStatus : Final Report DEPARTMENT OF BIOCHEMISTRY HBA1C Test Name Value Unit Bio. Ref Interval SIN No:H4241869 Page 1 of 14
  • 7.
    Fasting Blood Sugar Glucose,Fasting Method: Hexokinase 170.81 mg/dl 70 - 100 American Diabetes Association Reference Range : Normal : < 100 mg/dl Impaired fasting glucose(Prediabetes) : 100 - 126 mg/dl Diabetes : >= 126 mg/dl Conditions that can result in an elevated blood glucose level include: Acromegaly, Acute stress (response to trauma, heart attack, and stroke for instance), Chronic kidney disease, Cushing syndrome, Excessive consumption of food, Hyperthyroidism, Pancreatitis A low level of glucose may indicate hypoglycemia, a condition characterized by a drop in blood glucose to a level where first it causes nervous system symptoms (sweating, palpitations, hunger, trembling, and anxiety), then begins to affect the brain (causing confusion, hallucinations, blurred vision, and sometimes even coma and death). A low blood glucose level (hypoglycemia) may be seen with:Adrenal insufficiency, Drinking excessive alcohol, Severe liver disease, Hypopituitarism, Hypothyroidism, Severe infections, Severe heart failure, Chronic kidney (renal) failure, Insulin overdose, Tumors that produce insulin (insulinomas), Starvation. Patient Name : Jabir Shaik 3695311166 Age/Gender : 32/Male Order Id : 3695311166 Referred By : Self Customer Since : 12/Sep/2021 Sample Type : Flouride Plasma Barcode : H4241869 Sample Collected On : 12/Sep/2021 07:21AM Sample Received On : 12/Sep/2021 09:55AM Report Generated On : 12/Sep/2021 06:02PM Sample Temperature : Maintained ReportStatus : Final Report DEPARTMENT OF BIOCHEMISTRY Test Name Value Unit Bio. Ref Interval SIN No:H4241869 Page 2 of 14
  • 8.
    Lipid Profile Total Cholesterol Method:CHO-POD 230 mg/dl Desirable : <200 Borderline: 200-239 High : >/=240 Serum Triglycerides Method: GPO-POD 569 mg/dl Desirable : <150 Borderline high : 150-199 High : 200-499 Very high : > 500 Serum HDL Cholesterol Method: Enzymatic immuno inhibition 42.2 mg/dl 40 - 59 Serum LDL Cholesterol Method: Enzymatic 149.2 mg/dl Optimal : <100 near /above Optimal:100 - 129 Borderline High:130 - 159 High : 160 - 189 Very High :>/=190 Serum VLDL Cholesterol Method: Calculated 113.8 mg/dl 06 - 30 Total CHOL / HDL Cholesterol Ratio Method: Calculated 5.46 Ratio 3.30 - 4.40 LDL / HDL Cholesterol Ratio Method: Calculated 3.54 Ratio Desirable/Low Risk: 0.5-3.0 Line/Moderate Risk: 3.0-6.0 Elevated/High Risk: >6.0 HDL / LDL Cholesterol Ratio 0.28 Ratio Desirable/Low Risk : 0.5 - 3.0 Border Line/Moderate Risk : 3.0 - 6.0 Elevated/High Risk: > 6.0 Non-HDL Cholesterol Method: Calculated 188.1 mg/dl 0.0 - 160.0 KINDLY CORRELATE CLINICALLY Dyslipidemia is a disorder of fat or lipoprotein metabolism in the body and includes lipoprotein overproduction or deficiency. Dyslipidemias means increase in the level Patient Name : Jabir Shaik 3695311166 Age/Gender : 32/Male Order Id : 3695311166 Referred By : Self Customer Since : 12/Sep/2021 Sample Type : SERUM Barcode : H4241869 Sample Collected On : 12/Sep/2021 07:21AM Sample Received On : 12/Sep/2021 09:55AM Report Generated On : 12/Sep/2021 07:53PM Sample Temperature : Maintained ReportStatus : Final Report DEPARTMENT OF BIOCHEMISTRY Test Name Value Unit Bio. Ref Interval SIN No:H4241869 Page 3 of 14
  • 9.
    of one ormore of the following: Total Cholesterol The "bad" cholesterol or low density lipoprotein (LDL) and/or triglyceride concentrations. Dyslipidemia also includes a decrease in the “good" cholesterol or high-density lipoprotein (HDL) concentration in the blood. Lipid level assessments must be made following 9 to 12 hours of fasting, otherwise assay results might lead to erroneous interpretation. Healthians labs report biological reference intervals (normal ranges) in accordance to the recommendations of The National Cholesterol Education Program (NCEP) & Adult Treatment Panel IV (ATP IV) Guidelines providing the most desirable targets of various circulating lipid fractions in the blood. NCEP recommends that all adults above 20 years of age must be screened for abnormal lipid levels. *NCEP recommends the assessment of 3 different samples drawn at intervals of 1 week for harmonizing biological variables that might be encountered in single assays. Hence a single result of Lipid Profile may not be adequate for clinical decision making. Healthians' counselling team will reach you shortly to explain implications of your report. You may reach out to customer support helpline as well. *NCEP recommends lowering of LDL Cholesterol as the primary therapeutic target with lipid lowering agents, however, if triglycerides remain >200 mg/dL after LDL goal is reached, set secondary goal for non-HDL cholesterol (total minus HDL) 30 mg/dL higher than LDL goal. *High Triglyceride and low HDL levels are independent risk factors for Coronary Heart disease and requires further clinical consultation. *Healthians lab performs direct LDL measurement which is more appropriate and may vary from other lab reports which provide calculated LDL values. Patient Name : Jabir Shaik 3695311166 Age/Gender : 32/Male Order Id : 3695311166 Referred By : Self Customer Since : 12/Sep/2021 Sample Type : SERUM Barcode : H4241869 Sample Collected On : 12/Sep/2021 07:21AM Sample Received On : 12/Sep/2021 09:55AM Report Generated On : 12/Sep/2021 07:53PM Sample Temperature : Maintained ReportStatus : Final Report DEPARTMENT OF BIOCHEMISTRY Test Name Value Unit Bio. Ref Interval SIN No:H4241869 Page 4 of 14
  • 10.
    Liver Function Test(LFT) Serum Bilirubin, (Total) Method: DPD 0.80 mg/dl 0.3 - 1.2 Serum Bilirubin, (Direct) Method: Diazo 0.11 mg/dl 0.0 - 0.2 Serum Bilirubin, (Indirect) Method: Calculated 0.69 0.0 - 0.8 Aspartate Aminotransferase (AST/SGOT) Method: IFCC 18 U/L < 50 Alanine Aminotransferase (ALT/SGPT) Method: IFCC 17 U/l < 50 Alkaline Phosphatase (ALP) Method: IFCC AMP Buffer 77 U/L 30-120 Gamma Glutamyl Transferase (GGT) Method: IFCC 37.2 U/L <55 Serum Total Protein Method: Biuret 7.3 g/dl 6.6 - 8.3 SerumAlbumin Method: Bromo Cresol Green(BCG) 4.4 g/dl 3.50 - 5.2 Serum Globulin Method: Calculated 2.9 gm/dl 3.0 - 4.2 Albumin/GlobulinRatio Method: Calculated 1.52 Ratio 1.2 - 2.0 SGOT/SGPT Ratio Method: Calculated 1.06 Ratio 0.7 - 1.4 Bilirubin is a yellowish pigment found in bile and is a breakdown product of normal heme catabolism. Elevated levels results from increased bilirubin production (eg hemolysis and ineffective erythropoiesis); decreased bilirubin excretion (eg; obstruction and hepatitis); and abnormal bilirubin metabolism (eg; hereditary and neonatal jaundice). Conjugated (direct) bilirubin is elevated more than unconjugated (indirect) bilirubin in viral hepatitis; drug reactions, alcoholic liver disease conjugated (direct) bilirubin is also elevated more than unconjugated (indirect) bilirubin when there is some kind of blockage of the bile ducts like in Gallstones getting into the bile ducts tumors & Scarring of the bile ducts. Increased unconjugated (indirect) bilirubin may be a result of hemolytic or pernicious anemia, transfusion reaction & a common metabolic condition termed Gilbert syndrome. AST levels increase in viral hepatitis, blockage of the bile duct ,cirrhosis of the liver, liver cancer, kidney failure, hemolytic anemia, pancreatitis, hemochromatosis. Ast levels may also increase after a heart attck or strenuous activity. ALT is commonly measured as a part of a diagnostic evaluation of hepatocellular injury, to determine liver health. Elevated ALP levels are seen in Biliary Obstruction, Osteoblastic Bone Tumors, Osteomalacia, Hepatitis, Hyperparathyriodism, Leukemia, Lymphoma, paget`s disease, Rickets, Sarcoidosis etc. Elevated serum GGT activity can be found in diseases of the liver, Biliary system and pancreas. Conditions that increase serum GGT are obstructive liver disease, high alcohol consumption and use of enzyme-including drugs etc. Patient Name : Jabir Shaik 3695311166 Age/Gender : 32/Male Order Id : 3695311166 Referred By : Self Customer Since : 12/Sep/2021 Sample Type : Serum Barcode : H4241869 Sample Collected On : 12/Sep/2021 07:21AM Sample Received On : 12/Sep/2021 09:55AM Report Generated On : 12/Sep/2021 07:53PM Sample Temperature : Maintained ReportStatus : Final Report DEPARTMENT OF BIOCHEMISTRY Test Name Value Unit Bio. Ref Interval SIN No:H4241869 Page 5 of 14
  • 11.
    Serum total protein,also known as total protein, is a biochemical test for measuring the total amount of protein in serum..Protein in the plasma is made up of albumin and globulin. Higher-than-normal levels may be due to: Chronic inflammation or infection, including HIV and hepatitis B or C, Multiple myeloma,Waldenstrom's disease. Lower-than-normal levels may be due to: Agammaglobulinemia, Bleeding (hemorrhage), Burns, Glomerulonephritis, Liver disease, Malabsorption, Malnutrition, Nephrotic - Human serum albumin is the most abundant protein in human blood plasma. It is produced in the liver.Albumin constitutes about half of the blood serum protein. Low blood albumin levels (hypoalbuminemia) can be caused by: Liver disease like cirrhosis of the liver, nephrotic syndrome, protein-losing enteropathy, Burns, hemodilution, increased vascular permeability or decreased lymphatic clearance, malnutrition and wasting etc. Patient Name : Jabir Shaik 3695311166 Age/Gender : 32/Male Order Id : 3695311166 Referred By : Self Customer Since : 12/Sep/2021 Sample Type : Serum Barcode : H4241869 Sample Collected On : 12/Sep/2021 07:21AM Sample Received On : 12/Sep/2021 09:55AM Report Generated On : 12/Sep/2021 07:53PM Sample Temperature : Maintained ReportStatus : Final Report DEPARTMENT OF BIOCHEMISTRY Test Name Value Unit Bio. Ref Interval SIN No:H4241869 Page 6 of 14
  • 12.
    Iron study Serum Iron Method:TPTZ 131.0 ug/dl 70 - 180 UIBC Method: Nitroso-PSAP 250.20 ug/dl 155 - 355 Serum Total Iron Binding Capicity (TIBC) Method: FE+UIBC (saturation with iron) 381.2 µg/dl 250-400 Transferrin Saturation % Method: Calculated 34.37 % 16 - 50 Iron participates in a variety of vital processes in the body varying from cellular oxidative mechanisms to the transport and delivery of oxygen to body cells. It is a constituent of the oxygen-carrying chromoproteins, haemoglobin and myoglobin, as well as various enzymes, such as cytochrome oxidase and peroxidases. Serum iron may be increased in hemolytic, megaloblastic and aplastic anemias, and in hemochromatosis acute leukemia, lead poisoning, pyridoxine deficiency, thalassemia, excessive iron therapy, and after repeated transfusions. Drugs causing increased serum iron include chloramphenicol, cisplatin, estrogens (including oral contraceptives), ethanol, iron dextran, and methotrexate. Iron can be decreased in iron-deficiency anemia, acute and chronic infections, carcinoma, nephrotic syndrome hypothyroidism, in protein- calorie malnutrition, and after surgery. Transferrin is the primary plasma iron transport protein, which binds iron strongly at physiological pH. Transferrin is generally only 25% to 30% saturated with iron. The additional amount of iron that can be bound is the unsaturated iron-binding capacity (UIBC). Diurnal variation is seen in serum iron levels-normal values in midmorning, low values in midafternoon, very low values (approximately 10 μg/dL) near midnight. TIBC measures the blood’s capacity to bind iron with transferrin (TRF). Estrogens and oral contraceptives increase TIBC levels. Asparaginase, chloramphenicol, corticotropin, cortisone, and testosterone decrease the TIBC levels. % saturation represents the amount of iron-binding sites that are occupied. Iron saturation is a better index of iron stores than serum iron alone. % saturation is decreased in iron deficiency anemia (usually <10% in established deficiency). Transferrin is the primary plasma iron transport protein, which binds iron strongly at physiological pH. Transferrin is generally only 25% to 30% saturated with iron. The additional amount of iron that can be bound is the unsaturated iron-binding capacity (UIBC). Diurnal variation is seen in serum iron levels- normal values in midmorning, low values in midafternoon, very low values (approximately 10 μg/dL) near midnight. TIBC measures the blood’s capacity to bind iron with transferrin (TRF). Estrogens and oral contraceptives increase TIBC levels. Asparaginase, chloramphenicol, corticotropin, cortisone, and testosterone decrease the TIBC levels. % saturation represents the amount of iron-binding sites that are occupied. Iron saturation is a better index of iron stores than serum iron alone. % saturation is decreased in iron deficiency anemia (usually <10% in established deficiency). Patient Name : Jabir Shaik 3695311166 Age/Gender : 32/Male Order Id : 3695311166 Referred By : Self Customer Since : 12/Sep/2021 Sample Type : SERUM Barcode : H4241869 Sample Collected On : 12/Sep/2021 07:21AM Sample Received On : 12/Sep/2021 09:55AM Report Generated On : 12/Sep/2021 07:53PM Sample Temperature : Maintained ReportStatus : Final Report DEPARTMENT OF BIOCHEMISTRY IRON STUDY Test Name Value Unit Bio. Ref Interval SIN No:H4241869 Page 7 of 14
  • 13.
    Kidney Function Test1(KFT1) Serum Creatinine Method: Jaffes Kinetic 0.80 mg/dl 0.84-1.25 Serum Uric Acid Method: Uricase 5.7 mg/dl 3.5 - 7.2 Serum Calcium Method: Arsenazo 9.5 mg/dl 8.8 - 10.6 Serum Phosphorus Method: Phosphomolybdate complex 3.4 mg/dl 2.5 -4.5 Serum Sodium Method: ISE (Indirect) 137 mEq/L 135 - 145 Serum Chloride Method: ISE (Indirect) 98 mEq/L 96 - 110 Blood Urea Method: Urease 23 mg/dl 17-43 Blood Urea Nitrogen (BUN) Method: Calculated 10.9 mg/dl 8 - 20 Bun/Creatinine Ratio Method: Calculated 13.61 Ratio Urea/Creatinine Ratio Method: Calculated 29.13 Ratio Patient Name : Jabir Shaik 3695311166 Age/Gender : 32/Male Order Id : 3695311166 Referred By : Self Customer Since : 12/Sep/2021 Sample Type : SERUM Barcode : H4241869 Sample Collected On : 12/Sep/2021 07:21AM Sample Received On : 12/Sep/2021 09:55AM Report Generated On : 12/Sep/2021 07:53PM Sample Temperature : Maintained ReportStatus : Final Report DEPARTMENT OF BIOCHEMISTRY Test Name Value Unit Bio. Ref Interval SIN No:H4241869 Page 8 of 14
  • 14.
    Urine Routine &Microscopy Extended PHYSICAL EXAMINATION Colour Method: Visual Pale Yellow Pale Yellow Volume 20.00 mL Appearance Method: Visual Clear Clear CHEMICAL EXAMINATION Specific Gravity Method: Dipstick-Ion exchange 1.025 1.001 - 1.035 pH Method: Dipstick-Double indicator 5.0 4.5 - 7.5 Glucose Method: Dipstick-oxidase peroxidas Negative Negative Urine Protein Method: Dipstick-Bromophenol blue Negative Negative Ketones Method: Sodium nitroprusside Negative Negative Urobilinogen Method: Dipstick-Ehrlichs Test Normal Normal Bilirubin Method: Dipstick-Ehrlichs Test Negative Negative Nitrite Method: Dipstick-Griess test Negative Negative Blood Method: Dipstick-Peroxidase Negative Negative Leucocyte Esterase Method: Dipstick- Esterase Negative Negative MICROSCOPIC EXAMINATION Pus Cells Method: Microscopic Examination 2-3 /HPF 0 - 5 Epithelial cells Method: Microscopic Examination 1-2 /HPF 0 - 5 RBCs Method: Microscopic Examination Nil /HPF Nil Patient Name : Jabir Shaik 3695311166 Age/Gender : 32/Male Order Id : 3695311166 Referred By : Self Customer Since : 12/Sep/2021 Sample Type : URINE Barcode : H4241869 Sample Collected On : 12/Sep/2021 07:21AM Sample Received On : 12/Sep/2021 09:55AM Report Generated On : 12/Sep/2021 03:45PM Sample Temperature : Maintained ReportStatus : Final Report DEPARTMENT OF CLINICAL PATHOLOGY Test Name Value Unit Bio. Ref Interval SIN No:H4241869 Page 9 of 14
  • 15.
    Casts Method: Microscopic Examination NilNil Crystals Method: Microscopic Examination Nil Nil Bacteria Method: Microscopic Examination Absent Absent Yeast Cell Absent Others (Non Specific) Nil NIL Patient Name : Jabir Shaik 3695311166 Age/Gender : 32/Male Order Id : 3695311166 Referred By : Self Customer Since : 12/Sep/2021 Sample Type : URINE Barcode : H4241869 Sample Collected On : 12/Sep/2021 07:21AM Sample Received On : 12/Sep/2021 09:55AM Report Generated On : 12/Sep/2021 03:45PM Sample Temperature : Maintained ReportStatus : Final Report DEPARTMENT OF CLINICAL PATHOLOGY Test Name Value Unit Bio. Ref Interval SIN No:H4241869 Page 10 of 14
  • 16.
    Complete Haemogram Haemoglobin (HB) Method:Modified Drabkins Method 17.6 g/dl 13.0-17.0 Total Leucocyte Count (TLC) Method: Light scatter/Peroxidase 5.9 10^3/uL 4.0-10.0 Hematocrit (PCV) Method: Calculated 51 % 40.0-50.0 Red Blood Cell Count (RBC) 6.30 millions/cumm 4.50-5.50 Mean Corp Volume (MCV) Method: Calculated 81.0 FL 83.0-101.0 Mean Corp Hb (MCH) Method: Calculated 28 pg 27.0-33.0 Mean Corp Hb Conc (MCHC) Method: Calculated 34.5 gm% 31.5-34.5 RDW - CV Method: Calculated 14.9 % 12.1-13.6 RDW - SD Method: Calculated 42.40 FL 36.5-40.8 Mentzer Index 12.86 Differential Leucocyte Count Neutrophils Method: Light scatter/Peroxidase 51.0 % 40 - 75 Lymphocytes Method: Light scatter/Peroxidase 36 % 20 - 45 Monocytes Method: Light scatter/Peroxidase 8.9 % 01 - 10 Eosinophils Method: Light scatter/Peroxidase 3.5 % 01 - 06 Basophils Method: Light scatter/Basophil 0.6 % 00 - 02 Absolute Leucocyte Count Absolute Neutrophil Count (ANC) Method: Calculated 3.01 10^3/uL 2.0-7.0 Absolute Lymphocyte Count (ALC) 2.12 10^3/uL 1.0-3.0 Absolute Monocyte Count Method: Calculated 0.53 10^3/uL 0.2-1.0 Patient Name : Jabir Shaik 3695311166 Age/Gender : 32/Male Order Id : 3695311166 Referred By : Self Customer Since : 12/Sep/2021 Sample Type : Whole Blood EDTA Barcode : H4241869 Sample Collected On : 12/Sep/2021 07:21AM Sample Received On : 12/Sep/2021 09:55AM Report Generated On : 12/Sep/2021 01:47PM Sample Temperature : Maintained ReportStatus : Final Report DEPARTMENT OF HAEMATOLOGY Test Name Value Unit Bio. Ref Interval SIN No:H4241869 Page 11 of 14
  • 17.
    Absolute Eosinophil Count(AEC) Method: Calculated 0.21 10^3/uL 0.02-0.5 Absolute Basophil Count Method: Calculated 0.04 10^3/uL 0.02 - 0.10 Platelet Count(PLT) Method: Automated Electrical Resistance/ Light Microscopy 261 10^3/µl 150-410 PDW 17.8 % 9.6 - 15.2 MPV Method: Automated 8.0 FL 7.4-11.4 PCT 0.20 % 0.19 - 0.39 ESR 5 The International Council for Standardization in Haematology (ICSH) recommends reporting of absolute counts of various WBC subsets for clinical decision making. This test has been performed on a fully automated 5 part differential cell counter which counts over 10,000 WBCs to derive differential counts. A complete blood count is a blood panel that gives information about the cells in a patient's blood, such as the cell count for each cell type and the concentrations of Hemoglobin and platelets. The cells that circulate in the bloodstream are generally divided into three types: white blood cells (leukocytes), red blood cells (erythrocytes), and platelets (thrombocytes). Abnormally high or low counts may be physiological or may indicate disease conditions, and hence need to be interpreted clinically. The Mentzer index is used to differentiate iron deficiency anaemia beta thalassemia trait. If a CBC indicates microcytic anaemia, these are two of the most likely causes, making It necessary to distinguish between them. If the quotient of the mean corpuscular volume divided by the red blood cell count is then 13, thalassemia is more likely. If the result is greater than 13, then iron-deficiency anaemia is more likely. ESR is a non-specific phenomenon, its measurement is clinically useful in disorders associated with an increased production of acute-phase proteins. it provides an index of progress of the disease in rheumatoid arthritis or tuberculosis, and it is of considerable value in diagnosis of temporal arteritis and polymyalgia rheumatica. It is often used if multiple myeloma is suspected, but when the myeloma is non-secretory or light chain, a normal ESR does not exclude this diagnosis. An elevated ESR occurs as an early feature in myocardial infarction. Although a normal ESR cannot be taken to exclude the presence of organic disease, the vast majority of acute or chronic infections and most neoplastic and degenerative diseases are associated with changes in the plasma proteins that increased ES values. An increased ESR in subjects who are HIV seropositive seems to be an early predictive marker of progression toward acquired immune deficiency syndrome (AIDS). The ESR is influenced by age, stage of the menstrual cycle and medications taken (corticosteroids, contraceptive pills). It is Patient Name : Jabir Shaik 3695311166 Age/Gender : 32/Male Order Id : 3695311166 Referred By : Self Customer Since : 12/Sep/2021 Sample Type : Whole Blood EDTA Barcode : H4241869 Sample Collected On : 12/Sep/2021 07:21AM Sample Received On : 12/Sep/2021 09:55AM Report Generated On : 12/Sep/2021 01:47PM Sample Temperature : Maintained ReportStatus : Final Report DEPARTMENT OF HAEMATOLOGY Test Name Value Unit Bio. Ref Interval SIN No:H4241869 Page 12 of 14
  • 18.
    especially low (0–1 mm) in polycythaemia, hypofibrinogenaemia and congestive cardiac failure and when there are abnormalities of the red cellssuch as poikilocytosis, spherocytosis, or sickle cells. In cases of performance enhancing drug intake by athletes the ESR values are generally lower than the usual value for the individual and as a result of the increase in haemoglobin (i.e. the effect of secondary polycythaemia). Patient Name : Jabir Shaik 3695311166 Age/Gender : 32/Male Order Id : 3695311166 Referred By : Self Customer Since : 12/Sep/2021 Sample Type : Whole Blood EDTA Barcode : H4241869 Sample Collected On : 12/Sep/2021 07:21AM Sample Received On : 12/Sep/2021 09:55AM Report Generated On : 12/Sep/2021 01:47PM Sample Temperature : Maintained ReportStatus : Final Report DEPARTMENT OF HAEMATOLOGY Test Name Value Unit Bio. Ref Interval SIN No:H4241869 Page 13 of 14
  • 19.
    Pregnancy interval BioRef Range for TSH in uIU/ml (As per American Thyroid Association) First trimester 0.1 - 2.5 Second trimester 0.2 – 3.0 Third trimester 0.3 – 3.0 Thyroid Profile (Total T3,T4, TSH) Tri-Iodothyronine (T3, Total) Method: CLIA 1.11 ng/ml 0.87 - 1.78 Thyroxine (T4, Total) Method: CLIA 9.26 ug/dl 5.48 - 14.28 Thyroid Stimulating Hormone (TSH)-Ultrasensitive Method: CLIA 4.0780 uIU/ml 0.45-5.33 Healthians recommends that the following potential sources of variation should be considered while interpreting thyroid hormone results: 1. Thyroid hormones undergo rhythmic variation within the body this is called circadian variation in TSH secretion: Peak levels are seen between 2-4 am. Minimum levels seen between 6-10 am. This variation may be as much as 50% thus, influence of sampling time needs to be considered for clinical interpretation. 2. Circulating forms of T3 and T4 are mostly reversibly bound with Thyroxine binding globulins (TBG), and to a lesser extent with albumin and Thyroid binding Pre-Albumin. Thus the conditions in which TBG and protein levels alter such as chronic liver disorders, pregnancy, excess of estrogens, androgens, anabolic steroids and glucocorticoids may cause misleading total T3, total T4 and TSH interpretations. 3. Total T3 and T4 levels are seen to have physiological rise during pregnancy and in patients on steroid treatment 4. T4 may be normal the presence of hyperthyroidism under the following conditions : T3 thyrotoxicosis, Hypoproteinemia related reduced binding, during intake of certain drugs (eg Phenytoin, Salicylates etc) 5. Neonates and infants have higher levels of T4 due to increased concentration of TBG 6. TSH levels may be normal in central hypothyroidism, recent rapid correction of hypothyroidism or hyperthyroidism, pregnancy, phenytoin therapy etc. 7. TSH values of <0.03 uIU/mL must be clinically correlated to evaluate the presence of a rare TSH variant in certain individuals which is undetectable by conventional methods. 8. Presence of Autoimmune disorders may lead to spurious results of thyroid hormones 9. Various drugs can lead to interference in test results Healthians recommends evaluation of unbound fractions, that is free T3 (fT3) and free T4 (fT4) for clinic-pathologic correlation, as these are the metabolically active forms. *** End Of Report *** Patient Name : Jabir Shaik 3695311166 Age/Gender : 32/Male Order Id : 3695311166 Referred By : Self Customer Since : 12/Sep/2021 Sample Type : Serum Barcode : H4241869 Sample Collected On : 12/Sep/2021 07:21AM Sample Received On : 12/Sep/2021 09:55AM Report Generated On : 12/Sep/2021 07:27PM Sample Temperature : Maintained ReportStatus : Final Report DEPARTMENT OF IMMUNOLOGY Test Name Value Unit Bio. Ref Interval SIN No:H4241869 Page 14 of 14
  • 20.
    Terms & Conditions: 1)Machine Data is available for last 7 days only. In case of manual testing & outsourced testing, machine data will not be available. 2) CBC parameters may vary when it is manually reviewed by the Pathologists. 3) For Thyroid tests - Circulating TSH shows a normal circadian rhythm with a peak between 11pm-5am and a nadir between 5pm-8pm. TSH values are also lowered after food when compared to fasting in a statistically significant manner. This variation is of the order of ±50%, hence time of day and fasting status have influence on the reported TSH level. 4) For Lipid profile - Lipid and Lipoprotein concentrations vary during the normal course of daily activity. Also, certain drugs, diet and alcohol can have lasting effects on Triglyceride levels. To obtain best results for Lipid testing, a strict fasting of 10-12 hours with a light meal on the previous night is recommended. 5) For Covid19 testing, Healthians works with ICMR approved partner Labs only. The accuracy of the results are ensured by Partner Labs. Testing lab name is mentioned on the report. We do not charge anything extra for sample collection. 6) Test results released pertain to the specimen submitted. 7) Test results are dependent on the quality of the sample received by the Lab. 8) The tests are carried out in the lab with the presumption that the specimen belongs to the patient named or identified in the bill/test request form/booking ID. 9) The reported results are for information and are subject to confirmation and interpretation by the referring doctor to co-relate clinically. 10) Test results may show interlaboratory variations. 11) Liability of Healthians for deficiency of services or other errors and omissions shall be limited to the fee paid by the patient for the relevant laboratory services. 12) This report is not subject to use for any medico-legal purposes.
  • 21.
    Smart Report ADVISORY Health Advisory JabirShaik Booking ID : 3695311166 Body Mass Index No Data Height No Data Weight No Data Physical Activity · No Data Medication ·No Data Found Smoke No Data Alcohol No Data Food Preference No Data Family History No Data Blood Pressure No Data Sugar levels No Data SUGGESTED NUTRITION SUGGESTED NUTRITION Do's Include seeds like flaxseeds, chia seeds, sunflower seeds Include fruits like apples, berries and melons in your diet Include nuts like almonds, walnuts and seeds like flaxseeds, sunflower seeds Have a balanced diet that includes whole grains, pulses, dairy, fruits, vegetables, nuts and healthy fats Have dates and figs Take vitamin C rich foods like citrus fruits, strawberries and green, leafy vegetables Include fresh garlic and fenugreek seeds in your diet Include whole grains in your diet like whole wheat bread and other products, brown rice or hand pounded rice, oats Dont's Limit sugar intake Limit tea and coffee Decrease intake of colas and sugary drinks Avoid flavoured and seasoned foods Avoid saturated fats, transfats, oily and greasy foods like cakes, creamy or fried foods Limit intake of salt Avoid refined carbs, processed foods Avoid the use of oil and avoid sauces and dressings Avoid high cholesterol and calorie dense foods Avoid red meat and organ meats SUGGESTED LIFESTYLE SUGGESTED LIFESTYLE Do's Lose weight gradually and stay active Maintain ideal weight Sleep well at night and do relaxing activities Dont's Avoid late night heavy meals Avoid overworking or being stressed for long time Avoid smoking and alcohol Avoid long periods of inactivity Avoid overexertion without having food or drink Avoid strenuous exercises Avoid overeating or calorie rich food SUGGESTED FUTURE TESTS SUGGESTED FUTURE TESTS Glycated Hemoglobin (HbA1c) - Every 3 Month Blood Glucose Fasting - Every 1 Week Glucose Postprandial - Every 1 Week Liver Function Test - Every 3 Month Kidney Function Test - Every 3 Month Lipid Profile - Every 3 Month Microalbumin, Urine spot - Every 6 Month For any concern regarding this report, call our quality helpline at: 78 36 86 66 55 www.healthians.com
  • 22.
    Smart Report HEALTH ADVISORY Suggestionsfor Health & Well-being Jabir Shaik Booking ID : 3695311166 PHYSICAL ACTIVITY PHYSICAL ACTIVITY Physical activities can vary from Regular walks (Brisk or normal), Jogging , Sports, Stretching, Yoga to light weight lifting etc. It is recommended to partake in physical activity at least 30 minutes a day for 3-4 days a week. If regular workout is difficult, then we can adapt changes such as using stairs instead of lift/escalators and doing household work! BALANCED DIET A balanced diet is the key to healthy lifestyle. Include Whole grains, vegetables, whole fruits, nuts, seeds, beans, plant oils in your diet. It is recommended to always have a high protein breakfast and a light dinner. Avoid items such as processed foods, potatoes and high calorie/sugar products. Don't forget to drink water regularly! BALANCED DIET STRESS MANAGEMENT STRESS MANAGEMENT Managing stress is an essential part of well-being. Some day to day changes can help such as having sufficient sleep (6-8 hours), indulging yourself in meditation, positive attitude towards lifestyle, using humor, traveling, talking to people whom you feel comfortable with and making time for hobbies by doing what you love to do. BMI INFORMATION NOT AVAILABLE Please fill your Health Karma to know your BMI results For any concern regarding this report, call our quality helpline at: 78 36 86 66 55 www.healthians.com