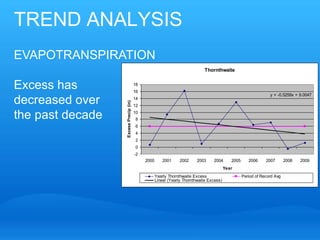
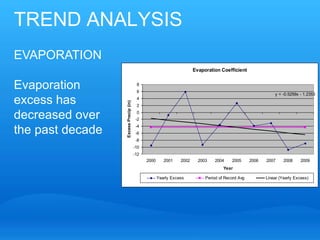
Evapotranspiration
Review Of Current Chapter

25” of PET annually (approx. 83% of annual ppt)

35” of Evaporation annually (UM value)

Growing Season:
     Operating deficit of 8.9” (2.7” PET + 6.2” EC)
TREND ANALYSIS
EVAPOTRANSPIRATION
                                                                            Thornthwaite


Excess has                             18
                                       16
                                                                                                                 y = -0.5259x + 9.0047
decreased over                         14


                  Excess Precip (in)
                                       12

the past decade                        10
                                       8
                                       6
                                       4
                                       2
                                       0
                                       -2
                                            2000       2001     2002    2003     2004       2005      2006     2007       2008   2009
                                                                                         Year
                                                   Yearly Thornthwaite Excess                      Period of Record Avg
                                                   Linear (Yearly Thornthwaite Excess)
TREND ANALYSIS
EVAPORATION
                                                                      Evaporation Coefficient


Evaporation                             8
                                        6
                                                                                                             y = -0.5259x - 1.2353
excess has                              4


                  Excess Precip (in)
                                        2

decreased over                          0
                                        -2
                                        -4
the past decade                         -6
                                        -8
                                       -10
                                       -12
                                             2000      2001    2002     2003   2004     2005      2006   2007     2008    2009
                                                                                    Year

                                                    Yearly Excess          Period of Record Avg          Linear (Yearly Excess)
Implications

Coefficients for the District are “published”
values but should be monitored


Excess precipitation is dependent on volume of
precipitation received
Expectations
Less Excess Precipitation
         = Less Natural Recharge


Less Excess Precipitation
         = Losing Lakes and Wetlands
Questions?


 Thank You


 Coon Creek Watershed District

#4- Comp Plan - Evaporation & Evapotranspiration

  • 1.
  • 2.
    Review Of CurrentChapter 25” of PET annually (approx. 83% of annual ppt) 35” of Evaporation annually (UM value) Growing Season: Operating deficit of 8.9” (2.7” PET + 6.2” EC)
  • 3.
    TREND ANALYSIS EVAPOTRANSPIRATION Thornthwaite Excess has 18 16 y = -0.5259x + 9.0047 decreased over 14 Excess Precip (in) 12 the past decade 10 8 6 4 2 0 -2 2000 2001 2002 2003 2004 2005 2006 2007 2008 2009 Year Yearly Thornthwaite Excess Period of Record Avg Linear (Yearly Thornthwaite Excess)
  • 4.
    TREND ANALYSIS EVAPORATION Evaporation Coefficient Evaporation 8 6 y = -0.5259x - 1.2353 excess has 4 Excess Precip (in) 2 decreased over 0 -2 -4 the past decade -6 -8 -10 -12 2000 2001 2002 2003 2004 2005 2006 2007 2008 2009 Year Yearly Excess Period of Record Avg Linear (Yearly Excess)
  • 5.
    Implications Coefficients for theDistrict are “published” values but should be monitored Excess precipitation is dependent on volume of precipitation received
  • 6.
    Expectations Less Excess Precipitation = Less Natural Recharge Less Excess Precipitation = Losing Lakes and Wetlands
  • 7.
    Questions? Thank You Coon Creek Watershed District