CHART
PATTERN
TRADING
Technical
Analysis
1
www.ThinkMarkets.com
|
support@thinkmarkets.com
|
+44
203
514
2374
Authorised
and
regulated
by
the
Financial
Conduct
Authority.
Table
of
Contents
Risk
Warning
....................................................................................................................................................
2
CHART
PATTERNS
EXPLAINED:
.........................................................................................................................
3
Introduction
.................................................................................................................................................
3
Why
do
chart
Patterns
Occur?
.....................................................................................................................
3
Long-‐Term
Patterns
(LT)
..............................................................................................................................
4
Short-‐Term
Patterns
(ST)
.............................................................................................................................
5
Short-‐Term
vs
Long-‐Term:
Which
is
better?
................................................................................................
6
Continuation,
Reversal,
Bullish
or
Bearish?
.................................................................................................
6
Pattern
Confirmation
...................................................................................................................................
7
LONG-‐TERM
PATTERNS
(LT):
............................................................................................................................
7
Continuation
Patterns
..................................................................................................................................
7
Reversal
Patterns
.........................................................................................................................................
9
What
they
Really
Look
Like
..........................................................................................................................
9
LT
Patterns:
Final
Pointers
.........................................................................................................................
10
SHORT-‐TERM
PATTERNS
(ST):
........................................................................................................................
10
Bar
Charts
vs
Candlesticks
.........................................................................................................................
11
Single
Bar
Patterns
.....................................................................................................................................
11
Multi-‐Bar
Patterns
.....................................................................................................................................
12
Rejection
Spikes
.........................................................................................................................................
13
Lower
timeframes
=
More
signals
false
signals!
(Potentially)
...................................................................
14
ST
Patterns:
Summary
....................................................................................................................................
15
REDUCE
YOUR
LEARNING
CURVE:
..................................................................................................................
15
3.
CHART
PATTERN
TRADING
Technical
Analysis
2
www.ThinkMarkets.com
|
support@thinkmarkets.com
|
+44
203
514
2374
Authorised
and
regulated
by
the
Financial
Conduct
Authority.
Risk
Warning
Trading
in
the
Foreign
Exchange
and
CFDs
market
involves
a
significant
and
substantial
risk
of
loss
and
may
not
be
suitable
for
everyone.
You
should
carefully
consider
whether
trading
is
suitable
for
you
in
light
of
your
age,
income,
personal
circumstances,
trading
knowledge,
and
financial
resources.
Only
true
discretionary
income
should
be
used
for
trading
in
the
Foreign
Exchange
and
CFDs
market.
Any
opinion,
market
analysis
or
other
information
of
any
kind
contained
is
subject
to
change
at
any
time.
Nothing
in
this
presentation
should
be
construed
as
a
solicitation
to
trade
in
the
Foreign
Exchange
or
CFDs
market.
If
you
are
considering
trading
in
the
Foreign
Exchange
or
CFDs
market,
before
you
trade,
make
sure
you
understand
how
the
spot
market
operates,
how
ThinkMarkets
is
compensated,
understand
the
ThinkMarkets
trading
contract,
rules
and
be
thoroughly
familiar
with
the
operation
of
and
the
limitations
of
the
platform
on
which
you
are
going
to
trade.
A
Financial
Services
Guide
(
FSG)
and
Product
Disclosure
Statements
(PDS)
for
these
products
is
available
from
TF
GLOBAL
MARKETS
(AUST)
PTY
LTD
by
emailing
compliance@thinkmarkets.com.au.
The
FSG
and
PDS
should
be
considered
before
deciding
to
enter
into
any
Derivative
transactions
with
TF
GLOBAL
MARKETS
(AUST)
PTY
LTD.
The
information
on
the
presentation
is
not
directed
at
residents
in
any
country
or
jurisdiction
where
such
distribution
or
use
would
be
contrary
to
local
law
or
regulation.
2015
TF
GLOBAL
MARKETS
(AUST)
PTY
LTD.
All
rights
reserved.
AFSL
424700.
ABN
69
158
361
561.
Please
note:
We
do
not
service
US
entities
or
residents.
Thank
you
for
downloading
this
Trading
Guide.
This
is
the
second
of
a
4-‐part
series
to
introduce
you
to
Technical
Analysis.
Each
part
has
a
video
and
accompanying
trading
guide
which
you
can
view
below.
Part
1:
Trends
Part
2:
High
Probability
Support
&
Resistance
Part
3:
Chart
Patterns
Trading
Part
4:
TA
Techniques
Combined
Chart
Pattern
Trading
By
Matt
Simpson
Copyright
@
2015
TF
GLOBAL
MARKETS
(AUST)
PTY
LTD
All
Rights
Reserved
4.
CHART
PATTERN
TRADING
Technical
Analysis
3
www.ThinkMarkets.com
|
support@thinkmarkets.com
|
+44
203
514
2374
Authorised
and
regulated
by
the
Financial
Conduct
Authority.
CHART
PATTERNS
EXPLAINED
Introduction
Out
of
all
the
topics
within
this
series,
this
is
by
far
the
hardest
one
to
fit
into
one
topic.
If
anything
this
should
be
split
into
two
topics
but
then
we
have
to
remember
this
is
an
introductory
guide.
It
was
not
until
I
came
to
write
this
section
and
host
the
webinars
that
I
realised
how
many
intricacies
and
areas
of
judgement
I
make
using
these
patterns.
There
are
many
textbooks
and
websites
that
will
bog
you
down
with
exotic
names
and
fancy
patterns
which
provide
little,
if
any,
practical
use
for
day-‐to-‐day
analysis
and
trading.
Therefor
I
have
tried
to
avoid
this
road,
and
instead
provide
the
basics
along
with
the
‘what
you
really
need
to
know
tips’
to
make
any
use
of
the
most
basic
patterns.
I
have
split
it
into
2
main
sections
by
their
style:
Long-‐term
patterns;
short-‐term
patterns;
Both
styles
possess
their
own
strengths
and,
weaknesses,
require
different
approaches
yet
at
the
same
time,
complement
each
other
as
though
they
were
always
meant
to
be.
If
you
have
to
take
one
piece
of
advice
from
this
guide
please
take
the
following:
You
will
significantly
increase
the
usability
of
each
style
by
combining
the
two
together.
Many
try
to
master
one
style
and
use
them
in
isolation
(as
I
did)
but
they
will
create
independent
problems
for
your
analysis
and
trading.
By
blending
the
two
together
you
will
create
a
more
structured
and
comprehensive
view
of
price.
Combine
these
two
styles
of
patterns
recognition
with
trends,
support
and
resistance
and
you
will
never
look
at
a
price
chart
the
same
way
again.
Why
do
chart
Patterns
Occur?
The
concept
is
similar
to
support
&
resistance:
At
any
one
time
market
participants
have
one
of
three
choices
-‐
to
buy,
sell
or
stand
aside.
As
this
ratio
between
the
three
groups
change
over
time,
so
does
the
supply
and
demand
for
any
given
market.
As
this
force
changes,
so
does
price.
This
is
all
based
upon
participants
(and
groups
of)
opinions
of
where
price
‘should’
be.
As
the
battle
towards
the
‘correct’
market
price
unfolds
we
see
trends
and
oscillations
develop,
which
when
combined
form
familiar
patterns.
If
we
can
identify
familiar
patterns,
technical
analysts
believe
that
[to
a
certain
degree]
price
can
become
predictable.
The
collective
individuals
within
any
market
constantly
changes,
along
with
personal
opinions
of
where
price
‘should
be’,
or
why
they
should
move
in
the
first
place.
Regardless…
a
Technical
Analyst
always
takes
comfort
in
the
fact
that
history
does
repeat
itself
as
long
as
prices
are
always
governed
by
supply
and
demand.
5.
CHART
PATTERN
TRADING
Technical
Analysis
4
www.ThinkMarkets.com
|
support@thinkmarkets.com
|
+44
203
514
2374
Authorised
and
regulated
by
the
Financial
Conduct
Authority.
Long-‐Term
Patterns
(LT)
I
refer
to
long-‐term
patterns
as
those
which
take
several
(and
usually
much
more)
bars
of
data
to
create
and
they
are
also
commonly
referred
to
as
Western
Chart
Patterns.
They
are
not
related
to
the
trading
timeframe
they
are
seen
on,
as
LT
patterns
can
be
seen
on
any
timeframe.
However
a
rule
of
thumb
is
that
the
higher
the
timeframe
you
see
a
chart
pattern
it
is
generally
consideredto
be
more
relable,
and
the
lower
the
timeframe
tends
to
generate
more
fale
signals.
You
can
see
the
same
(or
similar)
patterns
on
a
1-‐minute
chart
which
may
only
take
5
minutes
to
create,
whilst
also
seeing
patterns
which
last
years
or
decades
on
the
Monthly
timeframes.
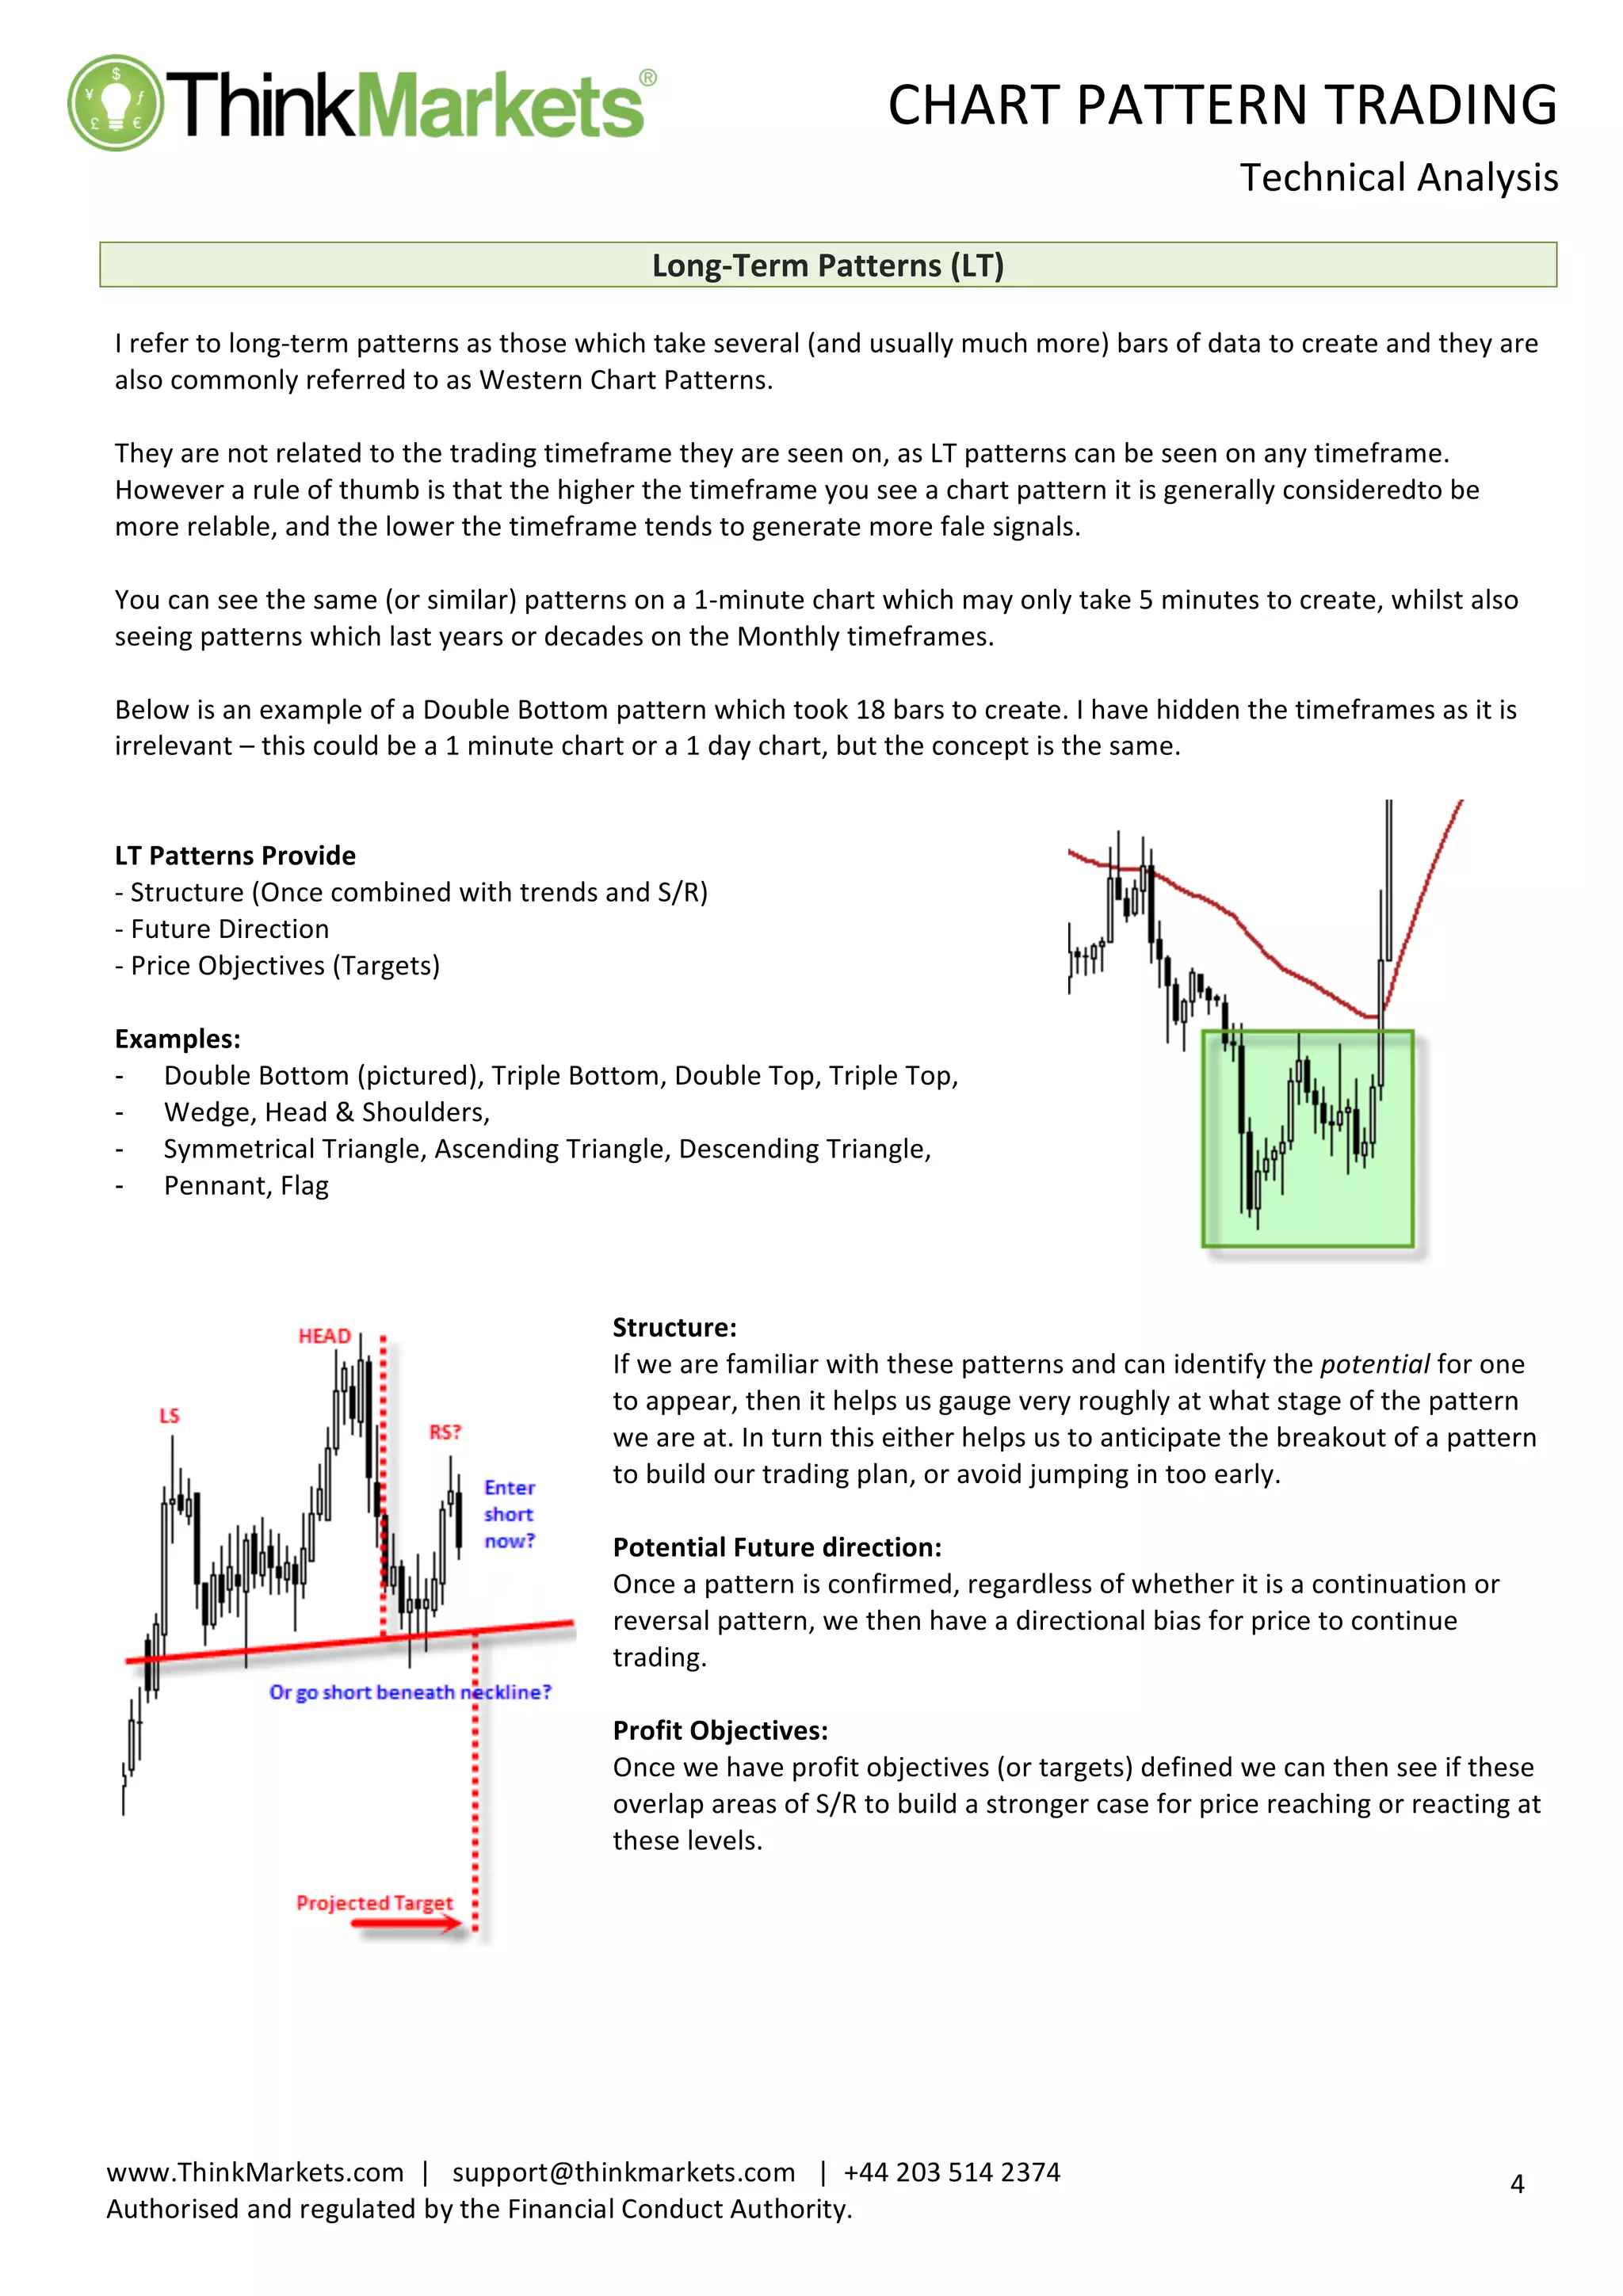
Below
is
an
example
of
a
Double
Bottom
pattern
which
took
18
bars
to
create.
I
have
hidden
the
timeframes
as
it
is
irrelevant
–
this
could
be
a
1
minute
chart
or
a
1
day
chart,
but
the
concept
is
the
same.
LT
Patterns
Provide
-‐
Structure
(Once
combined
with
trends
and
S/R)
-‐
Future
Direction
-‐
Price
Objectives
(Targets)
Examples:
-‐‑ Double
Bottom
(pictured),
Triple
Bottom,
Double
Top,
Triple
Top,
-‐‑ Wedge,
Head
&
Shoulders,
-‐‑ Symmetrical
Triangle,
Ascending
Triangle,
Descending
Triangle,
-‐‑ Pennant,
Flag
Structure:
If
we
are
familiar
with
these
patterns
and
can
identify
the
potential
for
one
to
appear,
then
it
helps
us
gauge
very
roughly
at
what
stage
of
the
pattern
we
are
at.
In
turn
this
either
helps
us
to
anticipate
the
breakout
of
a
pattern
to
build
our
trading
plan,
or
avoid
jumping
in
too
early.
Potential
Future
direction:
Once
a
pattern
is
confirmed,
regardless
of
whether
it
is
a
continuation
or
reversal
pattern,
we
then
have
a
directional
bias
for
price
to
continue
trading.
Profit
Objectives:
Once
we
have
profit
objectives
(or
targets)
defined
we
can
then
see
if
these
overlap
areas
of
S/R
to
build
a
stronger
case
for
price
reaching
or
reacting
at
these
levels.
6.
CHART
PATTERN
TRADING
Technical
Analysis
5
www.ThinkMarkets.com
|
support@thinkmarkets.com
|
+44
203
514
2374
Authorised
and
regulated
by
the
Financial
Conduct
Authority.
Short-‐Term
Patterns
(ST)
Short-‐term
patterns
can
be
produced
from
a
single
bar
of
data
or
more
and
require
either
Bar
Charts
or
Candlestick
charts
to
identify
them.
As
with
LT
patterns
they
appear
on
all
trading
timeframes
and
generally
considered
to
generate
more
reliable
signals
the
higher
the
timeframe.
Short-‐Term
Patterns
(ST)
For
example,
a
ST
pattern
can
be
made
up
from
1-‐3
bars
of
data,
and
may
form
on
any
tradable
timeframes
such
as
1
minute,
1
hour,
1
day
or
1
week
etc.
ST
Provide
- Signs
of
potential
strength
or
weakness
- Entry
Signals
- Exit
Signals
- Trade
Management
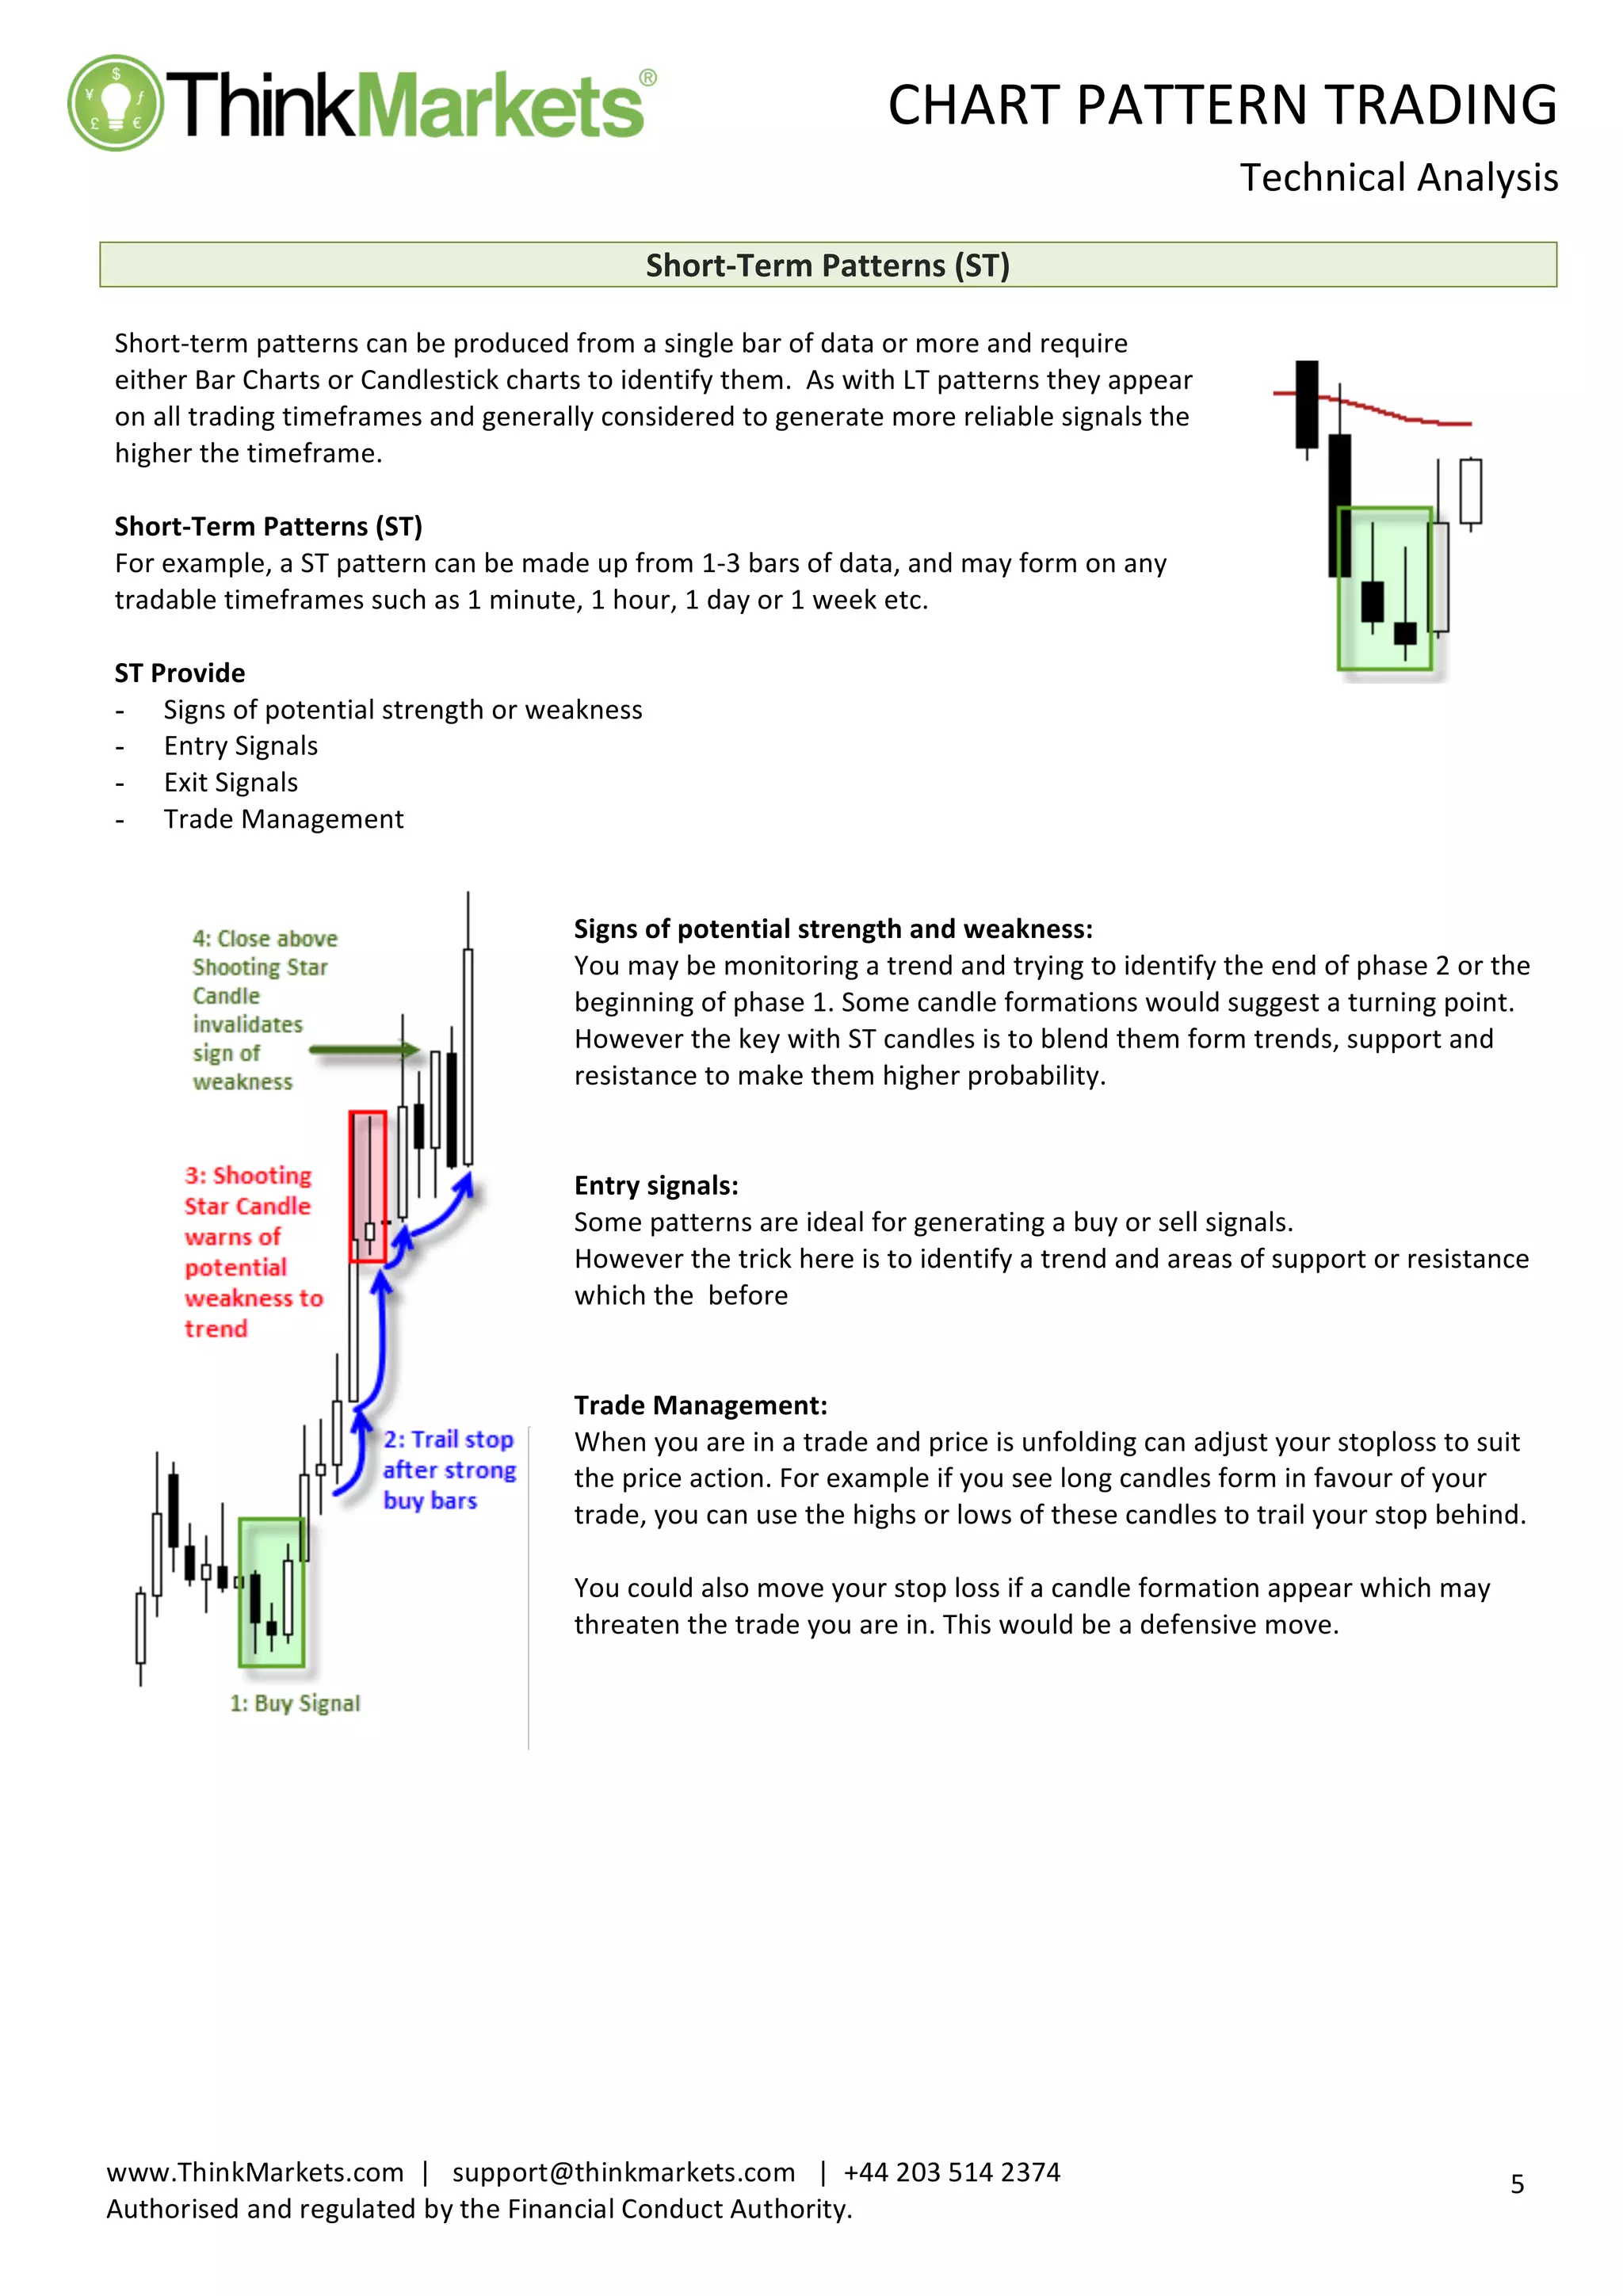
Signs
of
potential
strength
and
weakness:
You
may
be
monitoring
a
trend
and
trying
to
identify
the
end
of
phase
2
or
the
beginning
of
phase
1.
Some
candle
formations
would
suggest
a
turning
point.
However
the
key
with
ST
candles
is
to
blend
them
form
trends,
support
and
resistance
to
make
them
higher
probability.
Entry
signals:
Some
patterns
are
ideal
for
generating
a
buy
or
sell
signals.
However
the
trick
here
is
to
identify
a
trend
and
areas
of
support
or
resistance
which
the
before
Trade
Management:
When
you
are
in
a
trade
and
price
is
unfolding
can
adjust
your
stoploss
to
suit
the
price
action.
For
example
if
you
see
long
candles
form
in
favour
of
your
trade,
you
can
use
the
highs
or
lows
of
these
candles
to
trail
your
stop
behind.
You
could
also
move
your
stop
loss
if
a
candle
formation
appear
which
may
threaten
the
trade
you
are
in.
This
would
be
a
defensive
move.
7.
CHART
PATTERN
TRADING
Technical
Analysis
6
www.ThinkMarkets.com
|
support@thinkmarkets.com
|
+44
203
514
2374
Authorised
and
regulated
by
the
Financial
Conduct
Authority.
Short-‐Term
vs
Long-‐Term:
Which
is
better?
Many
Analysts
or
Traders
prefer
to
specialise
in
one
form
of
analysis.
However
I
believe
that
by
using
the
two
in
tandem
you
will
achieve
a
much
more
comprehensive
picture
as
their
strengths
and
weaknesses
complement
each
other
very
well.
For
example,
whilst
LT
patterns
project
future
direction
and
price
targets,
they
can
be
particularly
tricky
to
time
your
entrance
to
a
trade
whilst
maintaining
a
decent
reward/risk
ratio.
And
whilst
ST
patterns
generate
great
timing
for
entry
signals,
they
do
not
provide
you
with
a
profit
objective,
or
much
future
direction
beyond
the
candles
you
are
currently
looking
at.
For
those
reasons
I
would
strongly
urge
you
to
combine
the
two
for
a
fuller
picture
of
what
price
is
telling
you.
Continuation,
Reversal,
Bullish
or
Bearish?
As
the
name
implies,
continuation
patterns
assume
a
breakout
of
the
pattern
in
the
same
direction
in
which
it
entered
the
pattern.
Reversal
patterns
however
break
out
of
the
pattern
in
the
opposite
direction
to
which
it
entered
the
pattern.
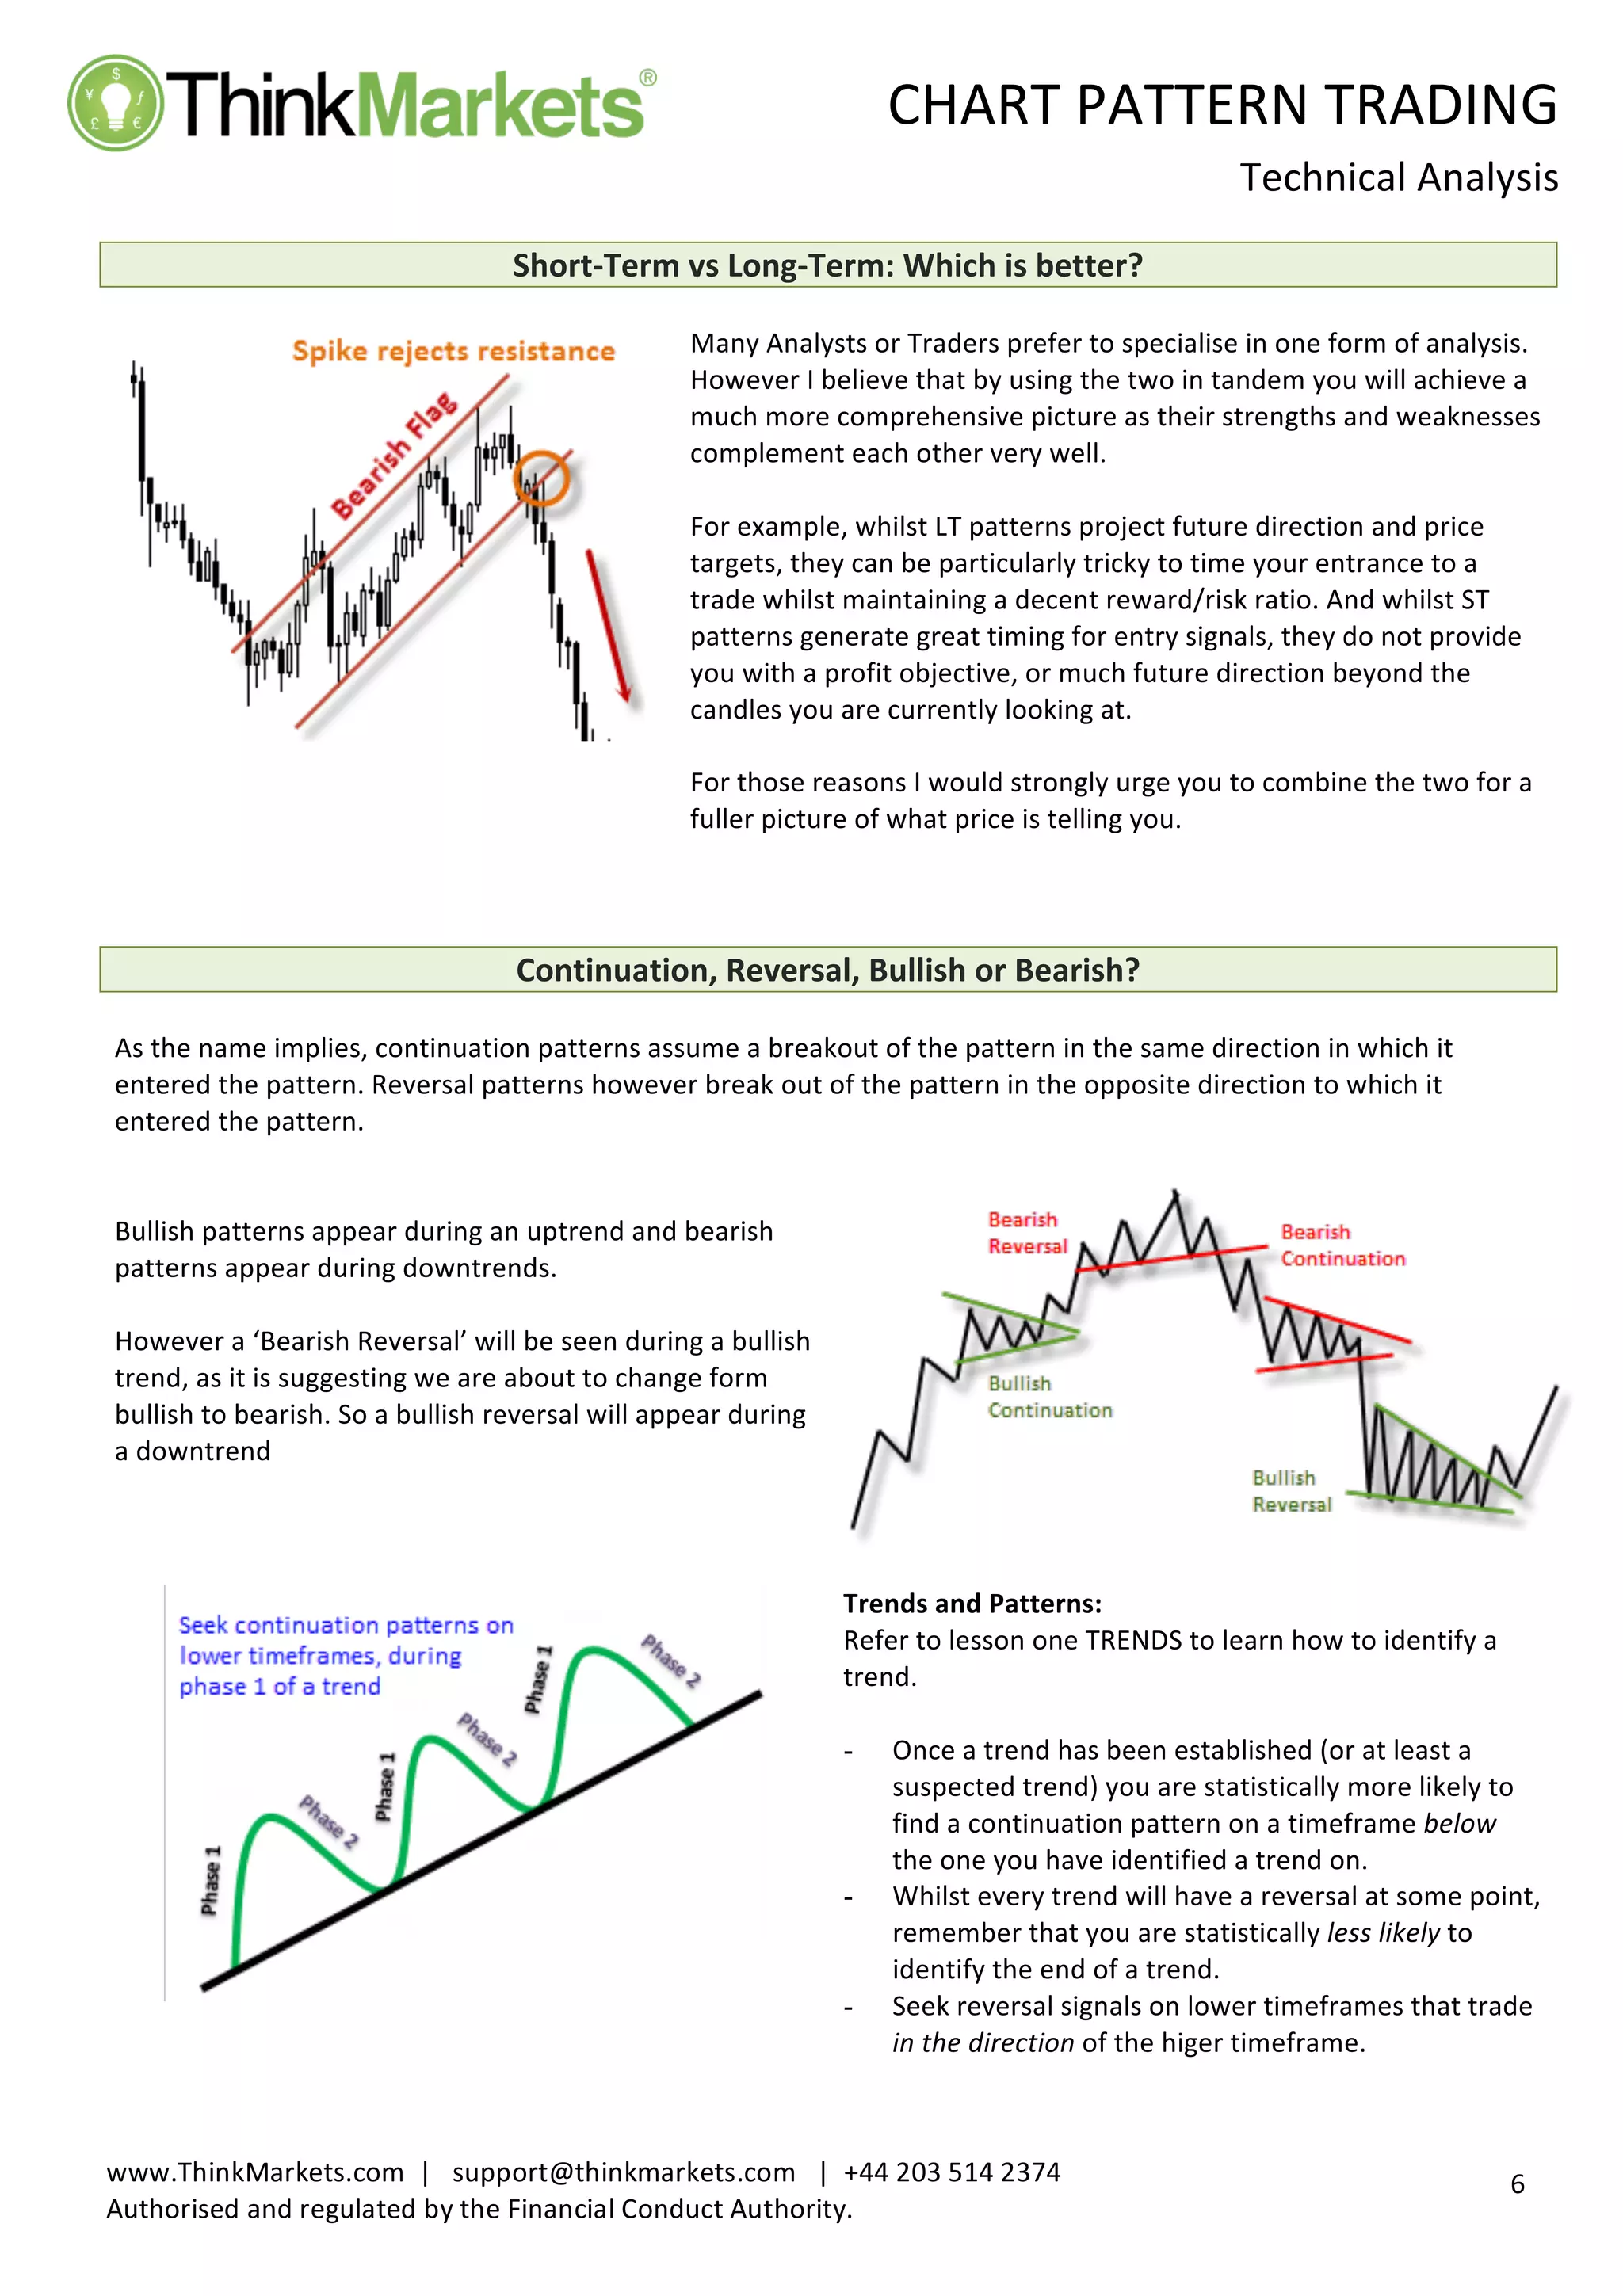
Bullish
patterns
appear
during
an
uptrend
and
bearish
patterns
appear
during
downtrends.
However
a
‘Bearish
Reversal’
will
be
seen
during
a
bullish
trend,
as
it
is
suggesting
we
are
about
to
change
form
bullish
to
bearish.
So
a
bullish
reversal
will
appear
during
a
downtrend
Trends
and
Patterns:
Refer
to
lesson
one
TRENDS
to
learn
how
to
identify
a
trend.
- Once
a
trend
has
been
established
(or
at
least
a
suspected
trend)
you
are
statistically
more
likely
to
find
a
continuation
pattern
on
a
timeframe
below
the
one
you
have
identified
a
trend
on.
- Whilst
every
trend
will
have
a
reversal
at
some
point,
remember
that
you
are
statistically
less
likely
to
identify
the
end
of
a
trend.
- Seek
reversal
signals
on
lower
timeframes
that
trade
in
the
direction
of
the
higer
timeframe.
8.
CHART
PATTERN
TRADING
Technical
Analysis
7
www.ThinkMarkets.com
|
support@thinkmarkets.com
|
+44
203
514
2374
Authorised
and
regulated
by
the
Financial
Conduct
Authority.
Pattern
Confirmation
So
how
do
we
confirm
a
pattern?
There
are
several
methods
and
it
is
down
to
personal
preference
as
to
how
you
decide
to
confirm
your
patterns.
However
please
be
warned
that
the
word
‘confirmation’
can
be
a
little
misleading
as
just
because
we
confirm
a
pattern
it
does
not
guarantee
that
the
pattern
will
be
fulfilled.
Confirmation
simply
means
‘a
point
on
the
chart
in
which
we
assume,
when
crossed,
the
pattern
may
reach
a
target’.
A
pattern
can
be
confirmed,
only
to
see
price
reverse
and
trade
back
into
the
suspected
pattern
to
make
it
a
‘failed
pattern’.
Each
pattern
has
a
breakout
line
which
is
similar
to
drawing
a
trendline
or
S/R
level.
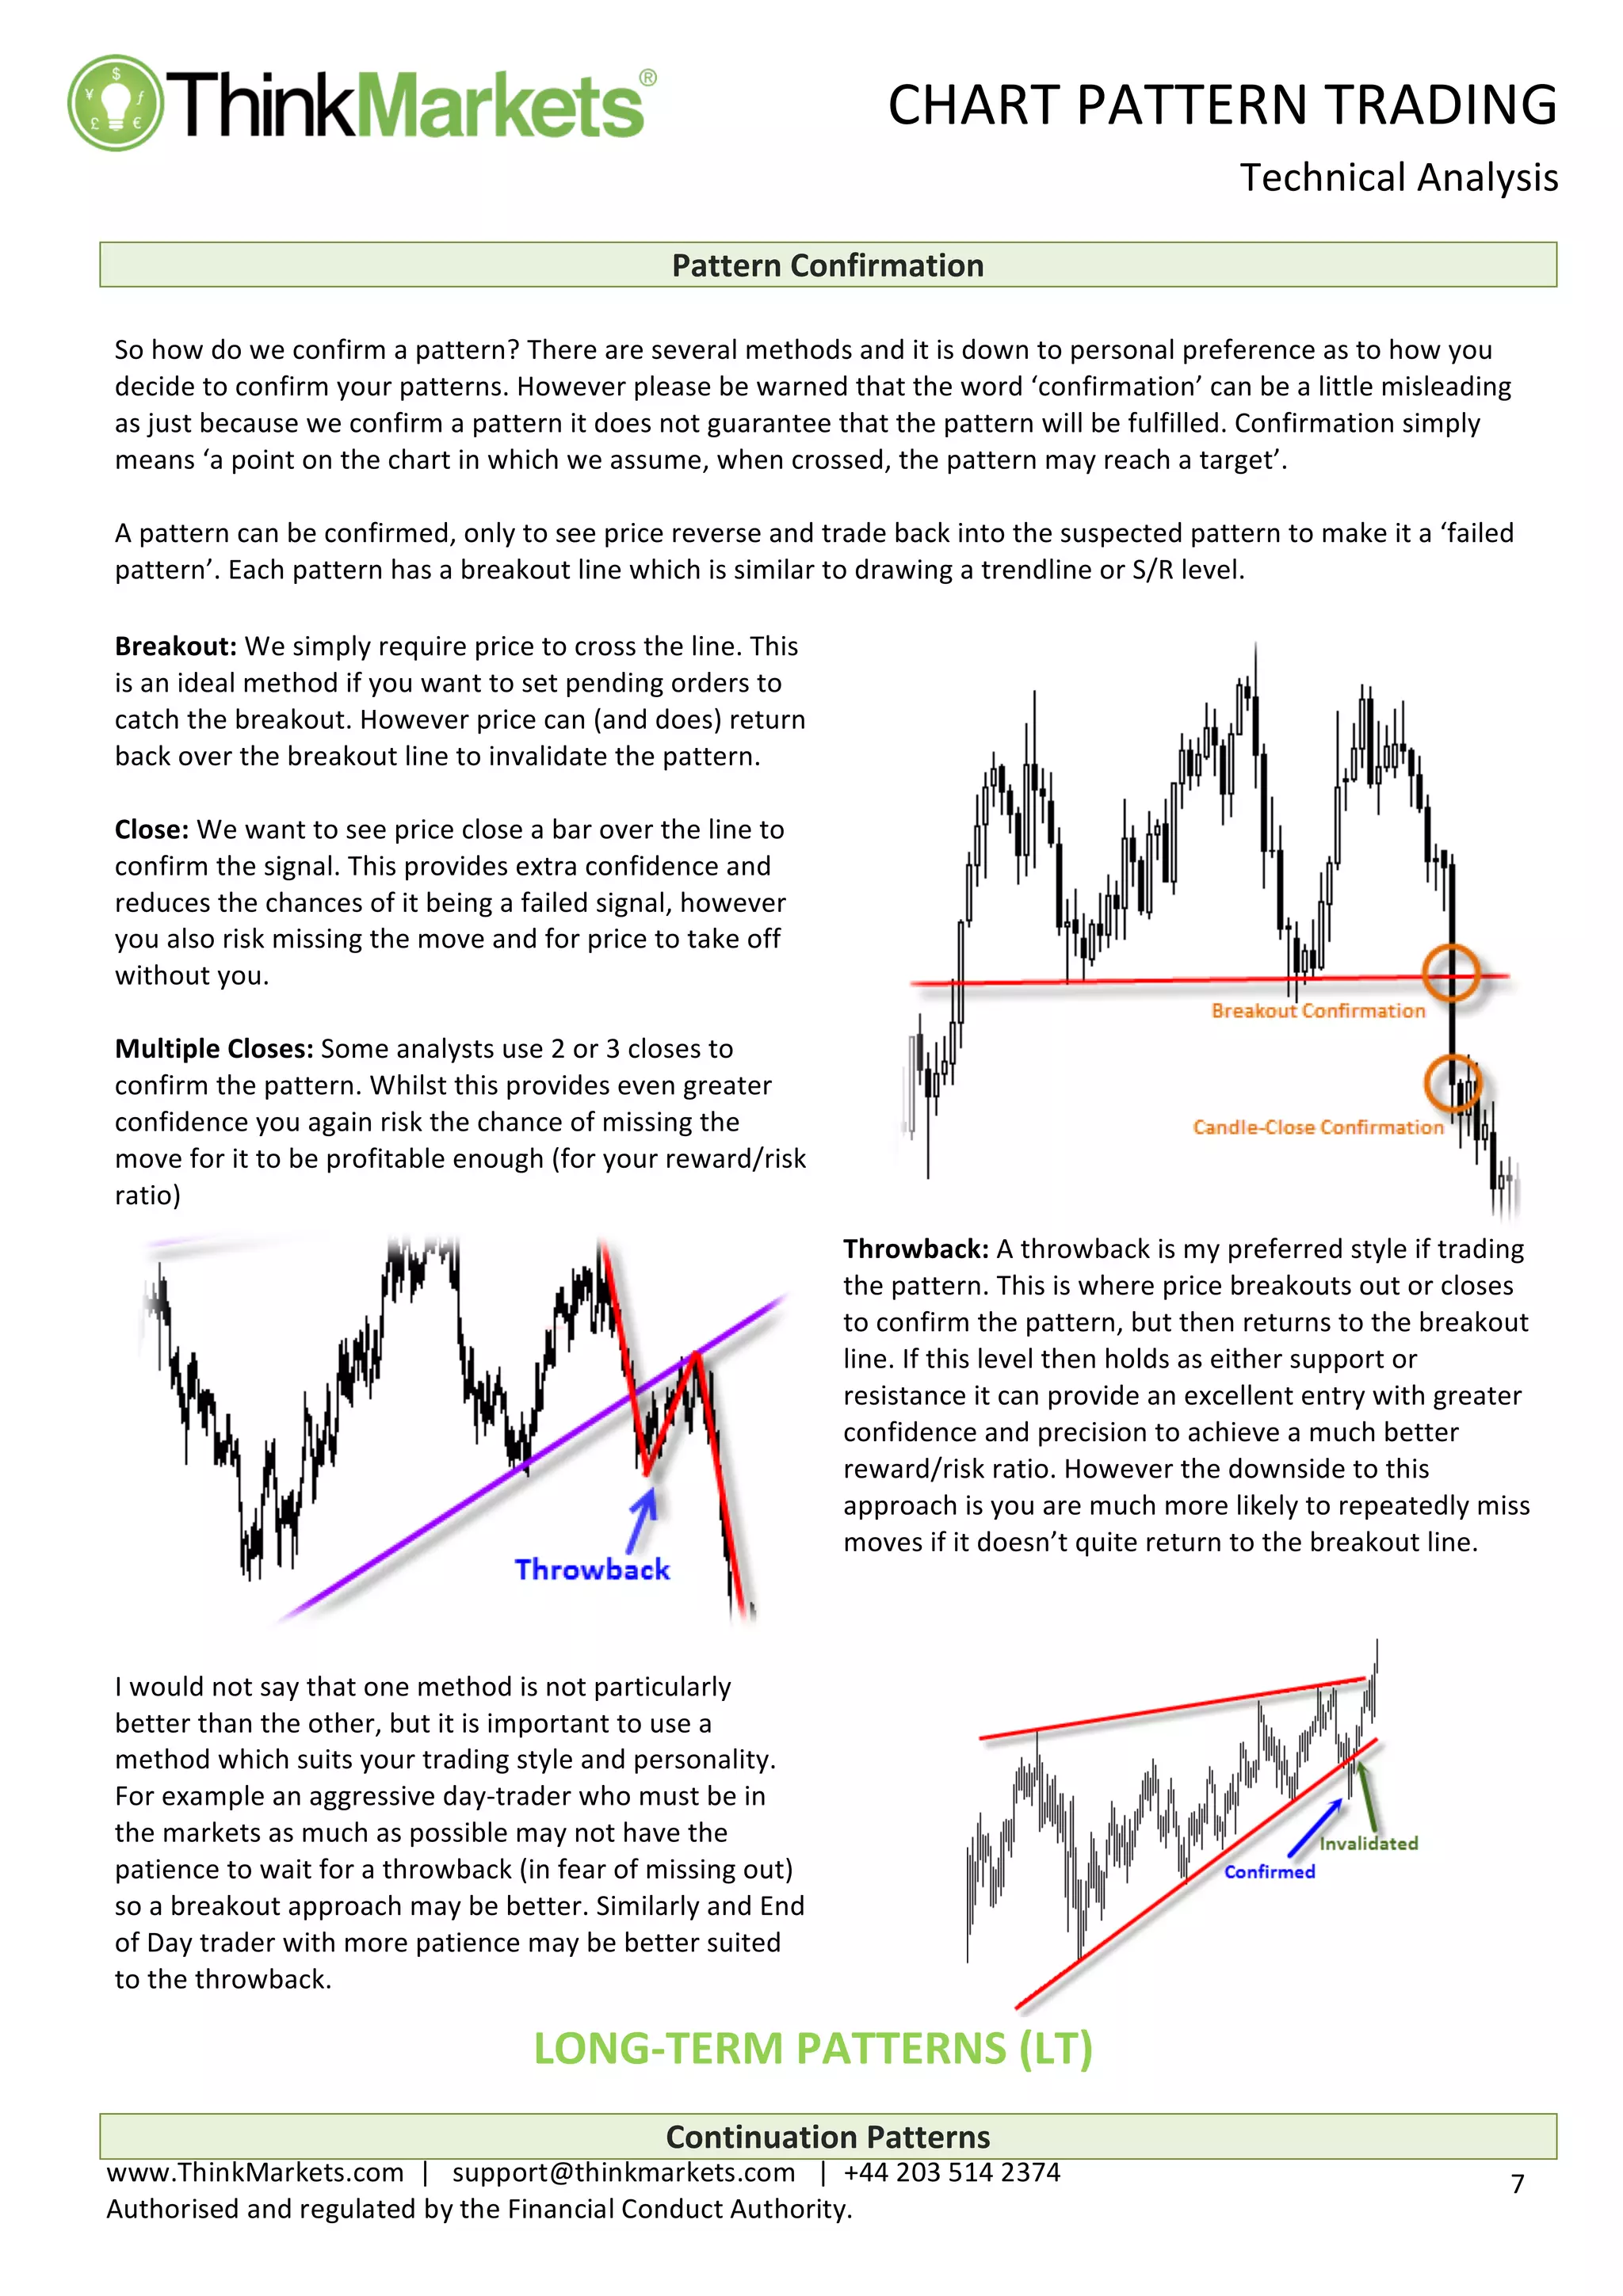
Breakout:
We
simply
require
price
to
cross
the
line.
This
is
an
ideal
method
if
you
want
to
set
pending
orders
to
catch
the
breakout.
However
price
can
(and
does)
return
back
over
the
breakout
line
to
invalidate
the
pattern.
Close:
We
want
to
see
price
close
a
bar
over
the
line
to
confirm
the
signal.
This
provides
extra
confidence
and
reduces
the
chances
of
it
being
a
failed
signal,
however
you
also
risk
missing
the
move
and
for
price
to
take
off
without
you.
Multiple
Closes:
Some
analysts
use
2
or
3
closes
to
confirm
the
pattern.
Whilst
this
provides
even
greater
confidence
you
again
risk
the
chance
of
missing
the
move
for
it
to
be
profitable
enough
(for
your
reward/risk
ratio)
Throwback:
A
throwback
is
my
preferred
style
if
trading
the
pattern.
This
is
where
price
breakouts
out
or
closes
to
confirm
the
pattern,
but
then
returns
to
the
breakout
line.
If
this
level
then
holds
as
either
support
or
resistance
it
can
provide
an
excellent
entry
with
greater
confidence
and
precision
to
achieve
a
much
better
reward/risk
ratio.
However
the
downside
to
this
approach
is
you
are
much
more
likely
to
repeatedly
miss
moves
if
it
doesn’t
quite
return
to
the
breakout
line.
I
would
not
say
that
one
method
is
not
particularly
better
than
the
other,
but
it
is
important
to
use
a
method
which
suits
your
trading
style
and
personality.
For
example
an
aggressive
day-‐trader
who
must
be
in
the
markets
as
much
as
possible
may
not
have
the
patience
to
wait
for
a
throwback
(in
fear
of
missing
out)
so
a
breakout
approach
may
be
better.
Similarly
and
End
of
Day
trader
with
more
patience
may
be
better
suited
to
the
throwback.
LONG-‐TERM
PATTERNS
(LT)
Continuation
Patterns
9.
CHART
PATTERN
TRADING
Technical
Analysis
8
www.ThinkMarkets.com
|
support@thinkmarkets.com
|
+44
203
514
2374
Authorised
and
regulated
by
the
Financial
Conduct
Authority.
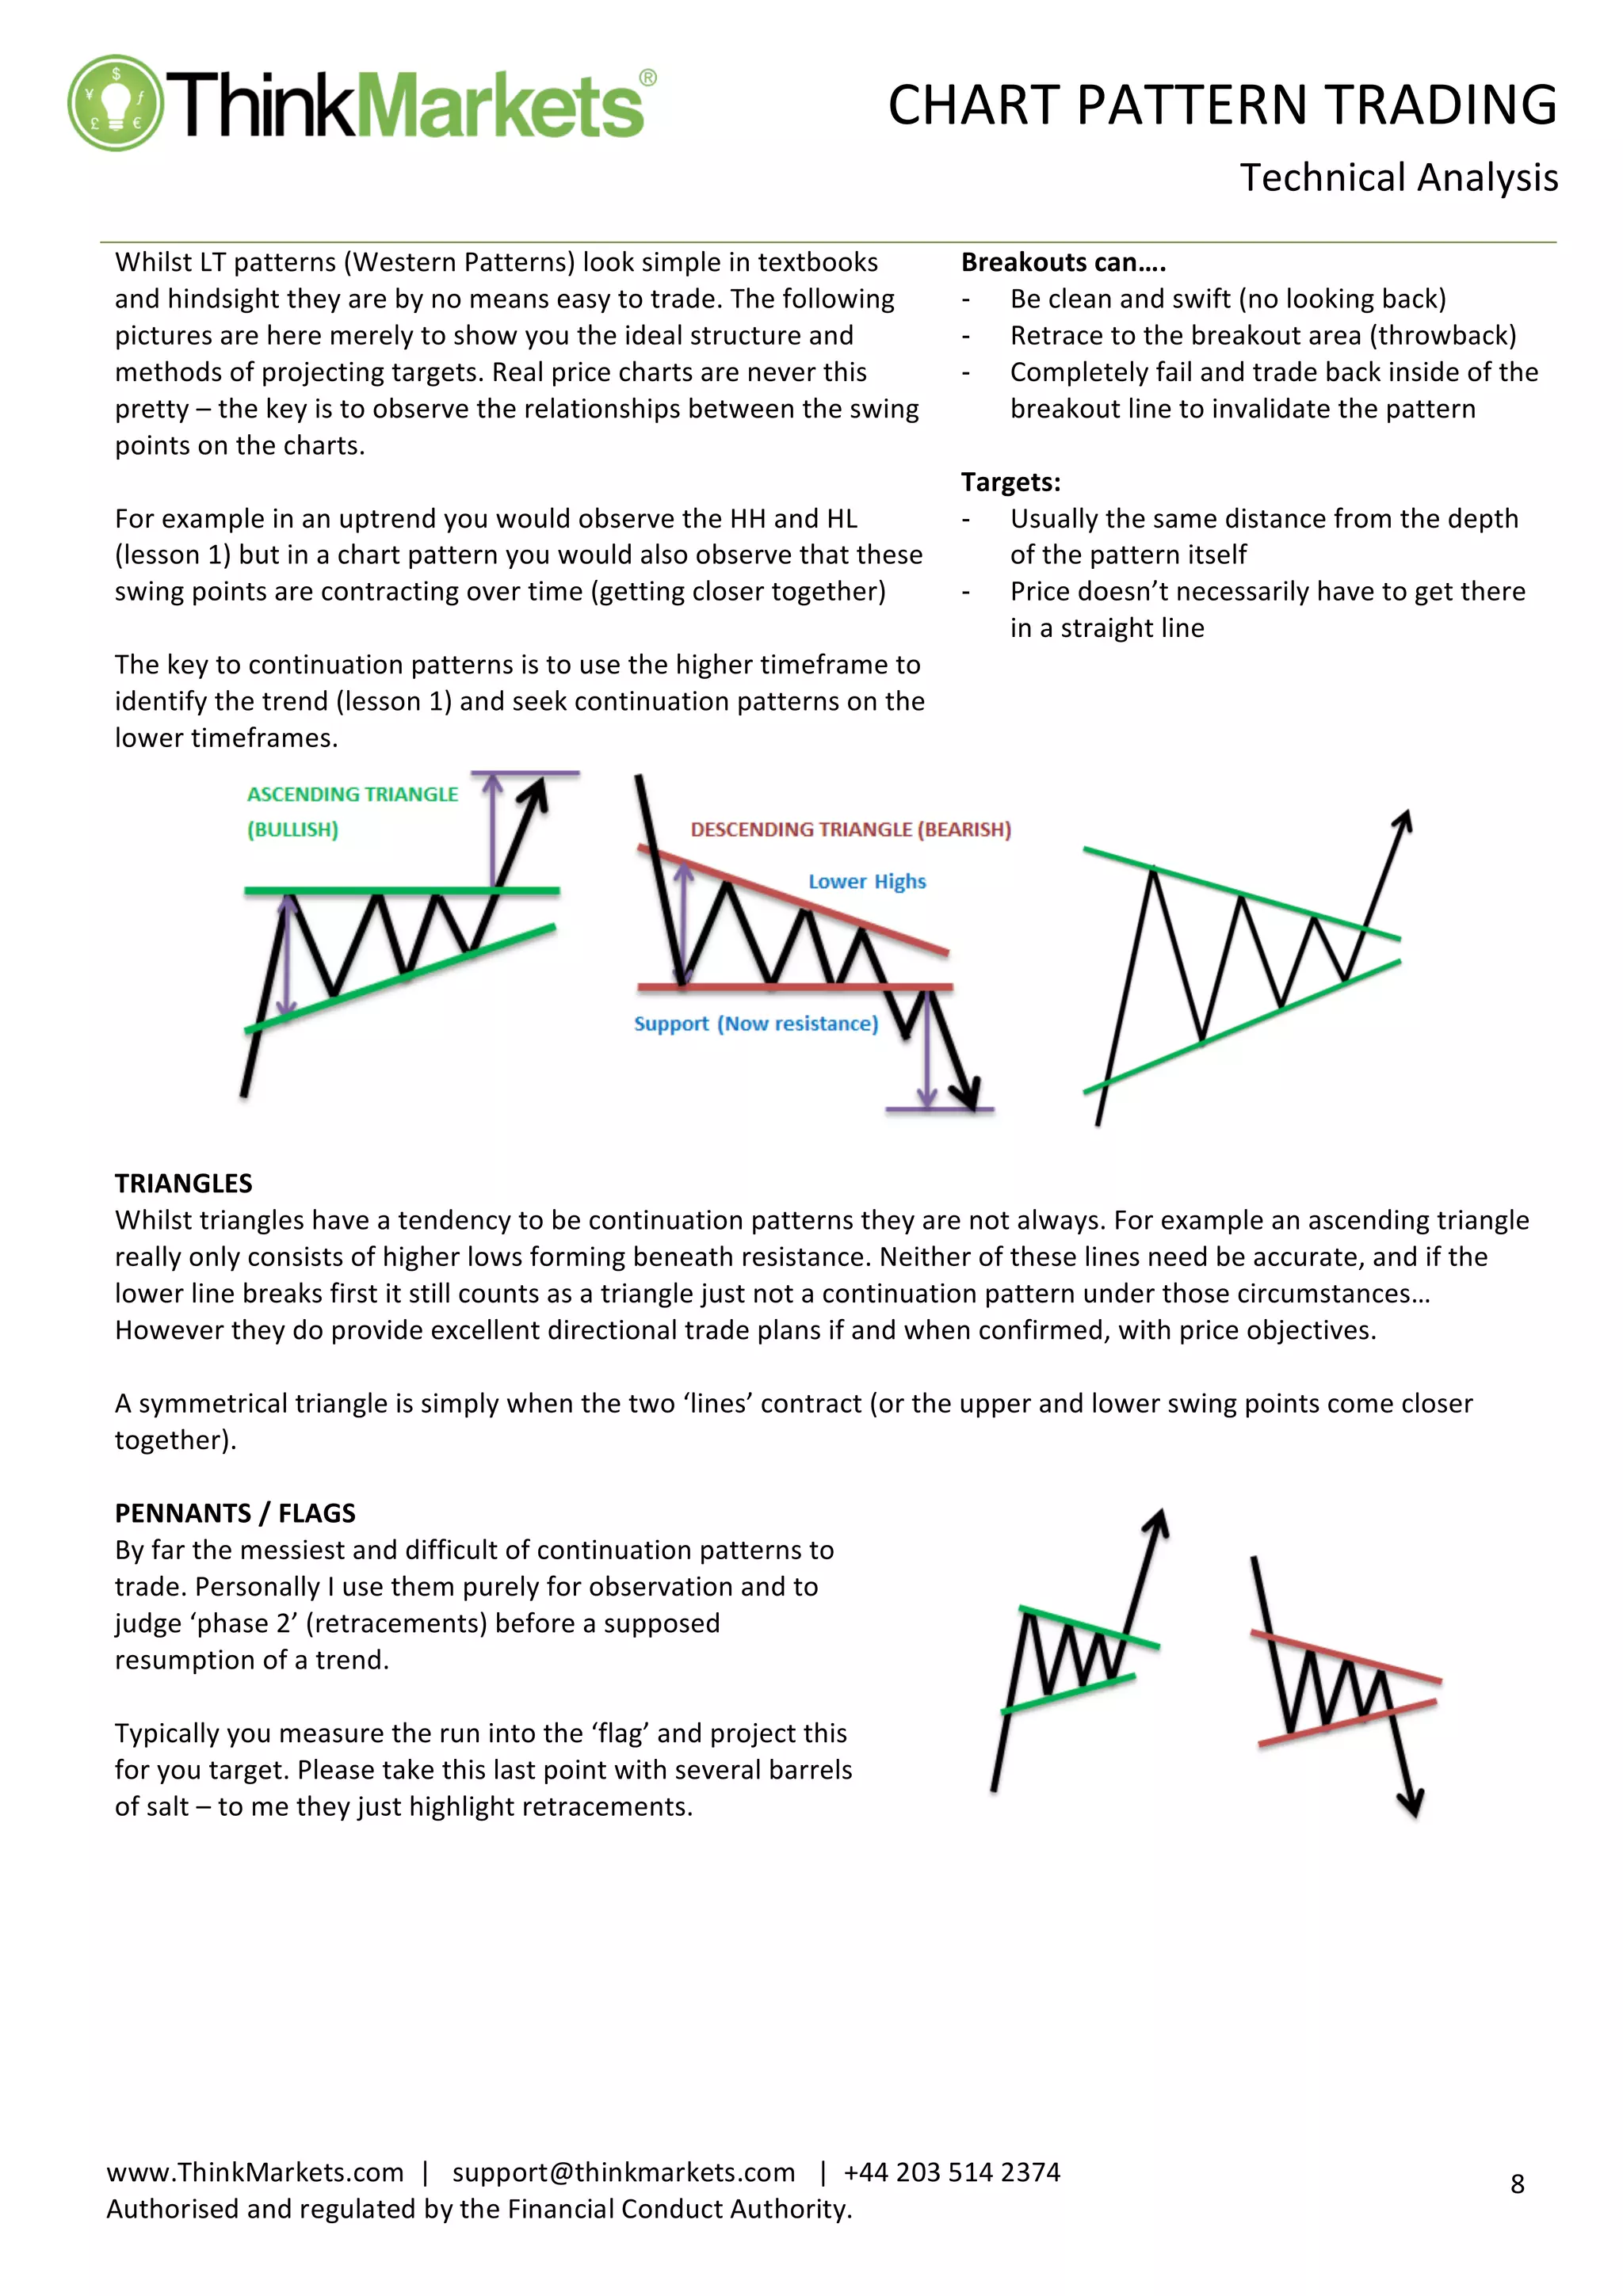
Whilst
LT
patterns
(Western
Patterns)
look
simple
in
textbooks
and
hindsight
they
are
by
no
means
easy
to
trade.
The
following
pictures
are
here
merely
to
show
you
the
ideal
structure
and
methods
of
projecting
targets.
Real
price
charts
are
never
this
pretty
–
the
key
is
to
observe
the
relationships
between
the
swing
points
on
the
charts.
For
example
in
an
uptrend
you
would
observe
the
HH
and
HL
(lesson
1)
but
in
a
chart
pattern
you
would
also
observe
that
these
swing
points
are
contracting
over
time
(getting
closer
together)
The
key
to
continuation
patterns
is
to
use
the
higher
timeframe
to
identify
the
trend
(lesson
1)
and
seek
continuation
patterns
on
the
lower
timeframes.
Breakouts
can….
-‐‑ Be
clean
and
swift
(no
looking
back)
-‐‑ Retrace
to
the
breakout
area
(throwback)
-‐‑ Completely
fail
and
trade
back
inside
of
the
breakout
line
to
invalidate
the
pattern
Targets:
-‐‑ Usually
the
same
distance
from
the
depth
of
the
pattern
itself
-‐‑ Price
doesn’t
necessarily
have
to
get
there
in
a
straight
line
TRIANGLES
Whilst
triangles
have
a
tendency
to
be
continuation
patterns
they
are
not
always.
For
example
an
ascending
triangle
really
only
consists
of
higher
lows
forming
beneath
resistance.
Neither
of
these
lines
need
be
accurate,
and
if
the
lower
line
breaks
first
it
still
counts
as
a
triangle
just
not
a
continuation
pattern
under
those
circumstances…
However
they
do
provide
excellent
directional
trade
plans
if
and
when
confirmed,
with
price
objectives.
A
symmetrical
triangle
is
simply
when
the
two
‘lines’
contract
(or
the
upper
and
lower
swing
points
come
closer
together).
PENNANTS
/
FLAGS
By
far
the
messiest
and
difficult
of
continuation
patterns
to
trade.
Personally
I
use
them
purely
for
observation
and
to
judge
‘phase
2’
(retracements)
before
a
supposed
resumption
of
a
trend.
Typically
you
measure
the
run
into
the
‘flag’
and
project
this
for
you
target.
Please
take
this
last
point
with
several
barrels
of
salt
–
to
me
they
just
highlight
retracements.
10.
CHART
PATTERN
TRADING
Technical
Analysis
9
www.ThinkMarkets.com
|
support@thinkmarkets.com
|
+44
203
514
2374
Authorised
and
regulated
by
the
Financial
Conduct
Authority.
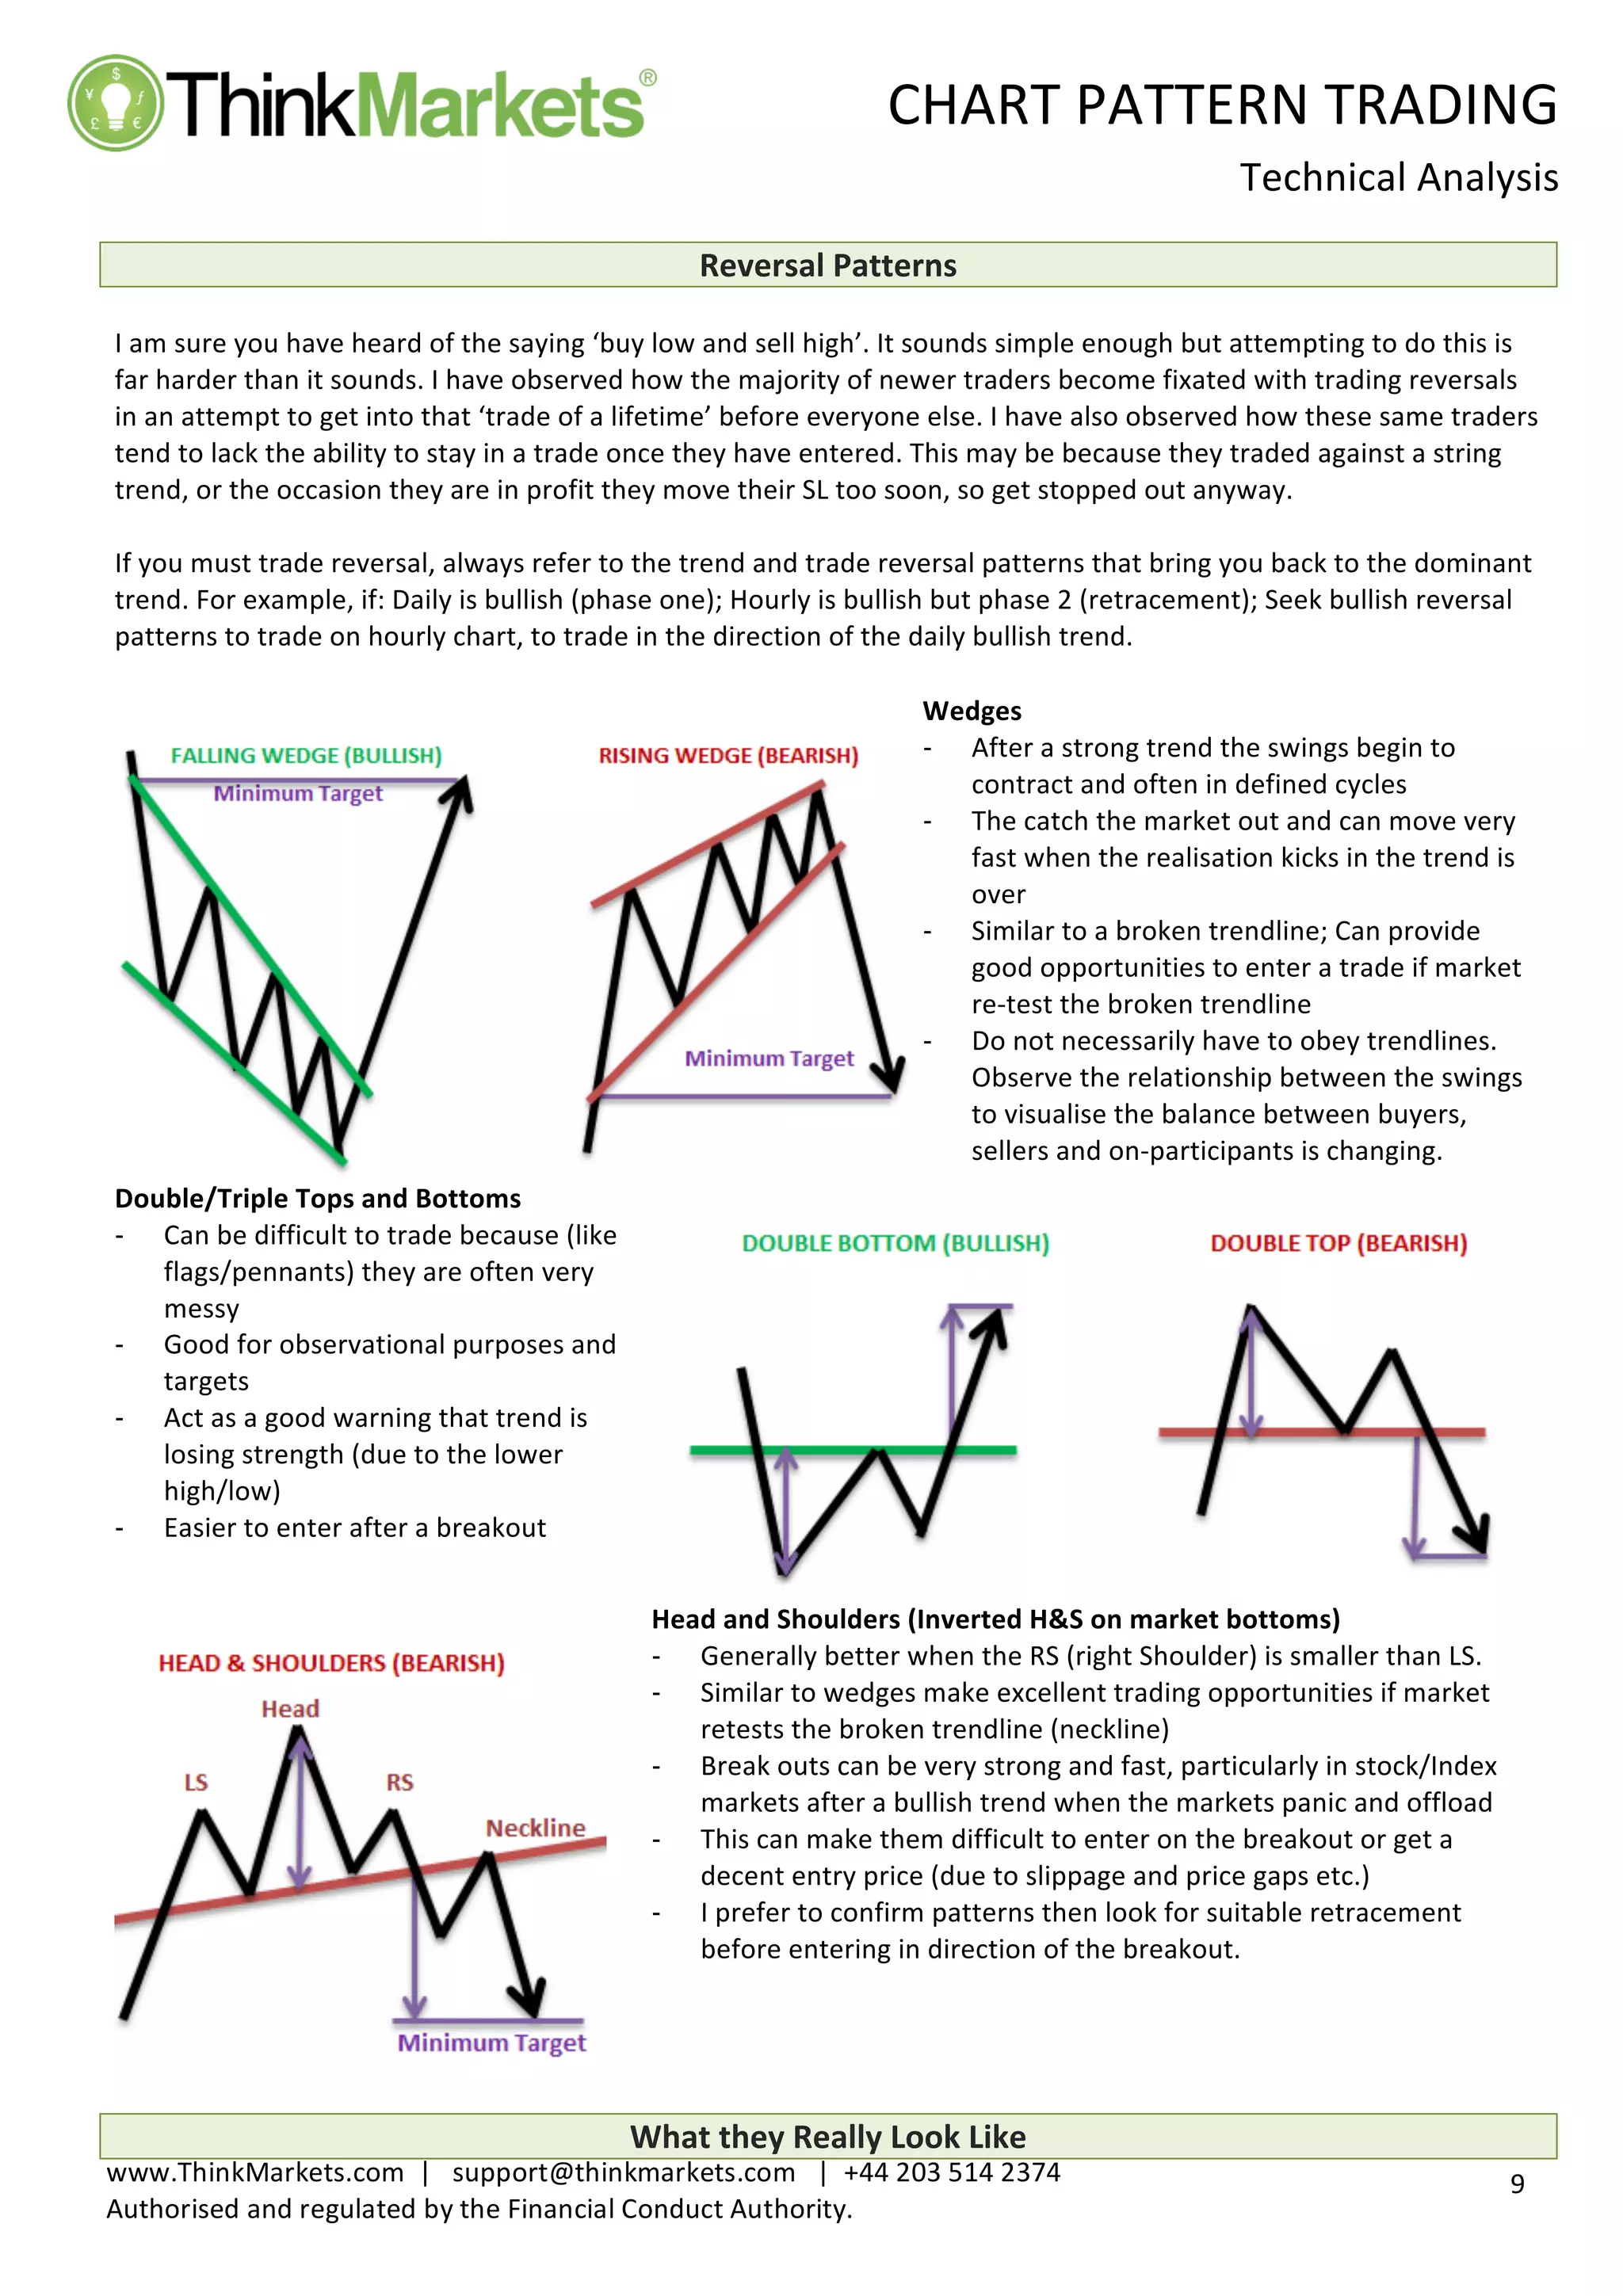
Reversal
Patterns
I
am
sure
you
have
heard
of
the
saying
‘buy
low
and
sell
high’.
It
sounds
simple
enough
but
attempting
to
do
this
is
far
harder
than
it
sounds.
I
have
observed
how
the
majority
of
newer
traders
become
fixated
with
trading
reversals
in
an
attempt
to
get
into
that
‘trade
of
a
lifetime’
before
everyone
else.
I
have
also
observed
how
these
same
traders
tend
to
lack
the
ability
to
stay
in
a
trade
once
they
have
entered.
This
may
be
because
they
traded
against
a
string
trend,
or
the
occasion
they
are
in
profit
they
move
their
SL
too
soon,
so
get
stopped
out
anyway.
If
you
must
trade
reversal,
always
refer
to
the
trend
and
trade
reversal
patterns
that
bring
you
back
to
the
dominant
trend.
For
example,
if:
Daily
is
bullish
(phase
one);
Hourly
is
bullish
but
phase
2
(retracement);
Seek
bullish
reversal
patterns
to
trade
on
hourly
chart,
to
trade
in
the
direction
of
the
daily
bullish
trend.
Wedges
-‐‑ After
a
strong
trend
the
swings
begin
to
contract
and
often
in
defined
cycles
-‐‑ The
catch
the
market
out
and
can
move
very
fast
when
the
realisation
kicks
in
the
trend
is
over
-‐‑ Similar
to
a
broken
trendline;
Can
provide
good
opportunities
to
enter
a
trade
if
market
re-‐test
the
broken
trendline
-‐‑ Do
not
necessarily
have
to
obey
trendlines.
Observe
the
relationship
between
the
swings
to
visualise
the
balance
between
buyers,
sellers
and
on-‐participants
is
changing.
Double/Triple
Tops
and
Bottoms
-‐‑ Can
be
difficult
to
trade
because
(like
flags/pennants)
they
are
often
very
messy
-‐‑ Good
for
observational
purposes
and
targets
-‐‑ Act
as
a
good
warning
that
trend
is
losing
strength
(due
to
the
lower
high/low)
-‐‑ Easier
to
enter
after
a
breakout
Head
and
Shoulders
(Inverted
H&S
on
market
bottoms)
-‐‑ Generally
better
when
the
RS
(right
Shoulder)
is
smaller
than
LS.
-‐‑ Similar
to
wedges
make
excellent
trading
opportunities
if
market
retests
the
broken
trendline
(neckline)
-‐‑ Break
outs
can
be
very
strong
and
fast,
particularly
in
stock/Index
markets
after
a
bullish
trend
when
the
markets
panic
and
offload
-‐‑ This
can
make
them
difficult
to
enter
on
the
breakout
or
get
a
decent
entry
price
(due
to
slippage
and
price
gaps
etc.)
-‐‑ I
prefer
to
confirm
patterns
then
look
for
suitable
retracement
before
entering
in
direction
of
the
breakout.
What
they
Really
Look
Like
11.
CHART
PATTERN
TRADING
Technical
Analysis
10
www.ThinkMarkets.com
|
support@thinkmarkets.com
|
+44
203
514
2374
Authorised
and
regulated
by
the
Financial
Conduct
Authority.
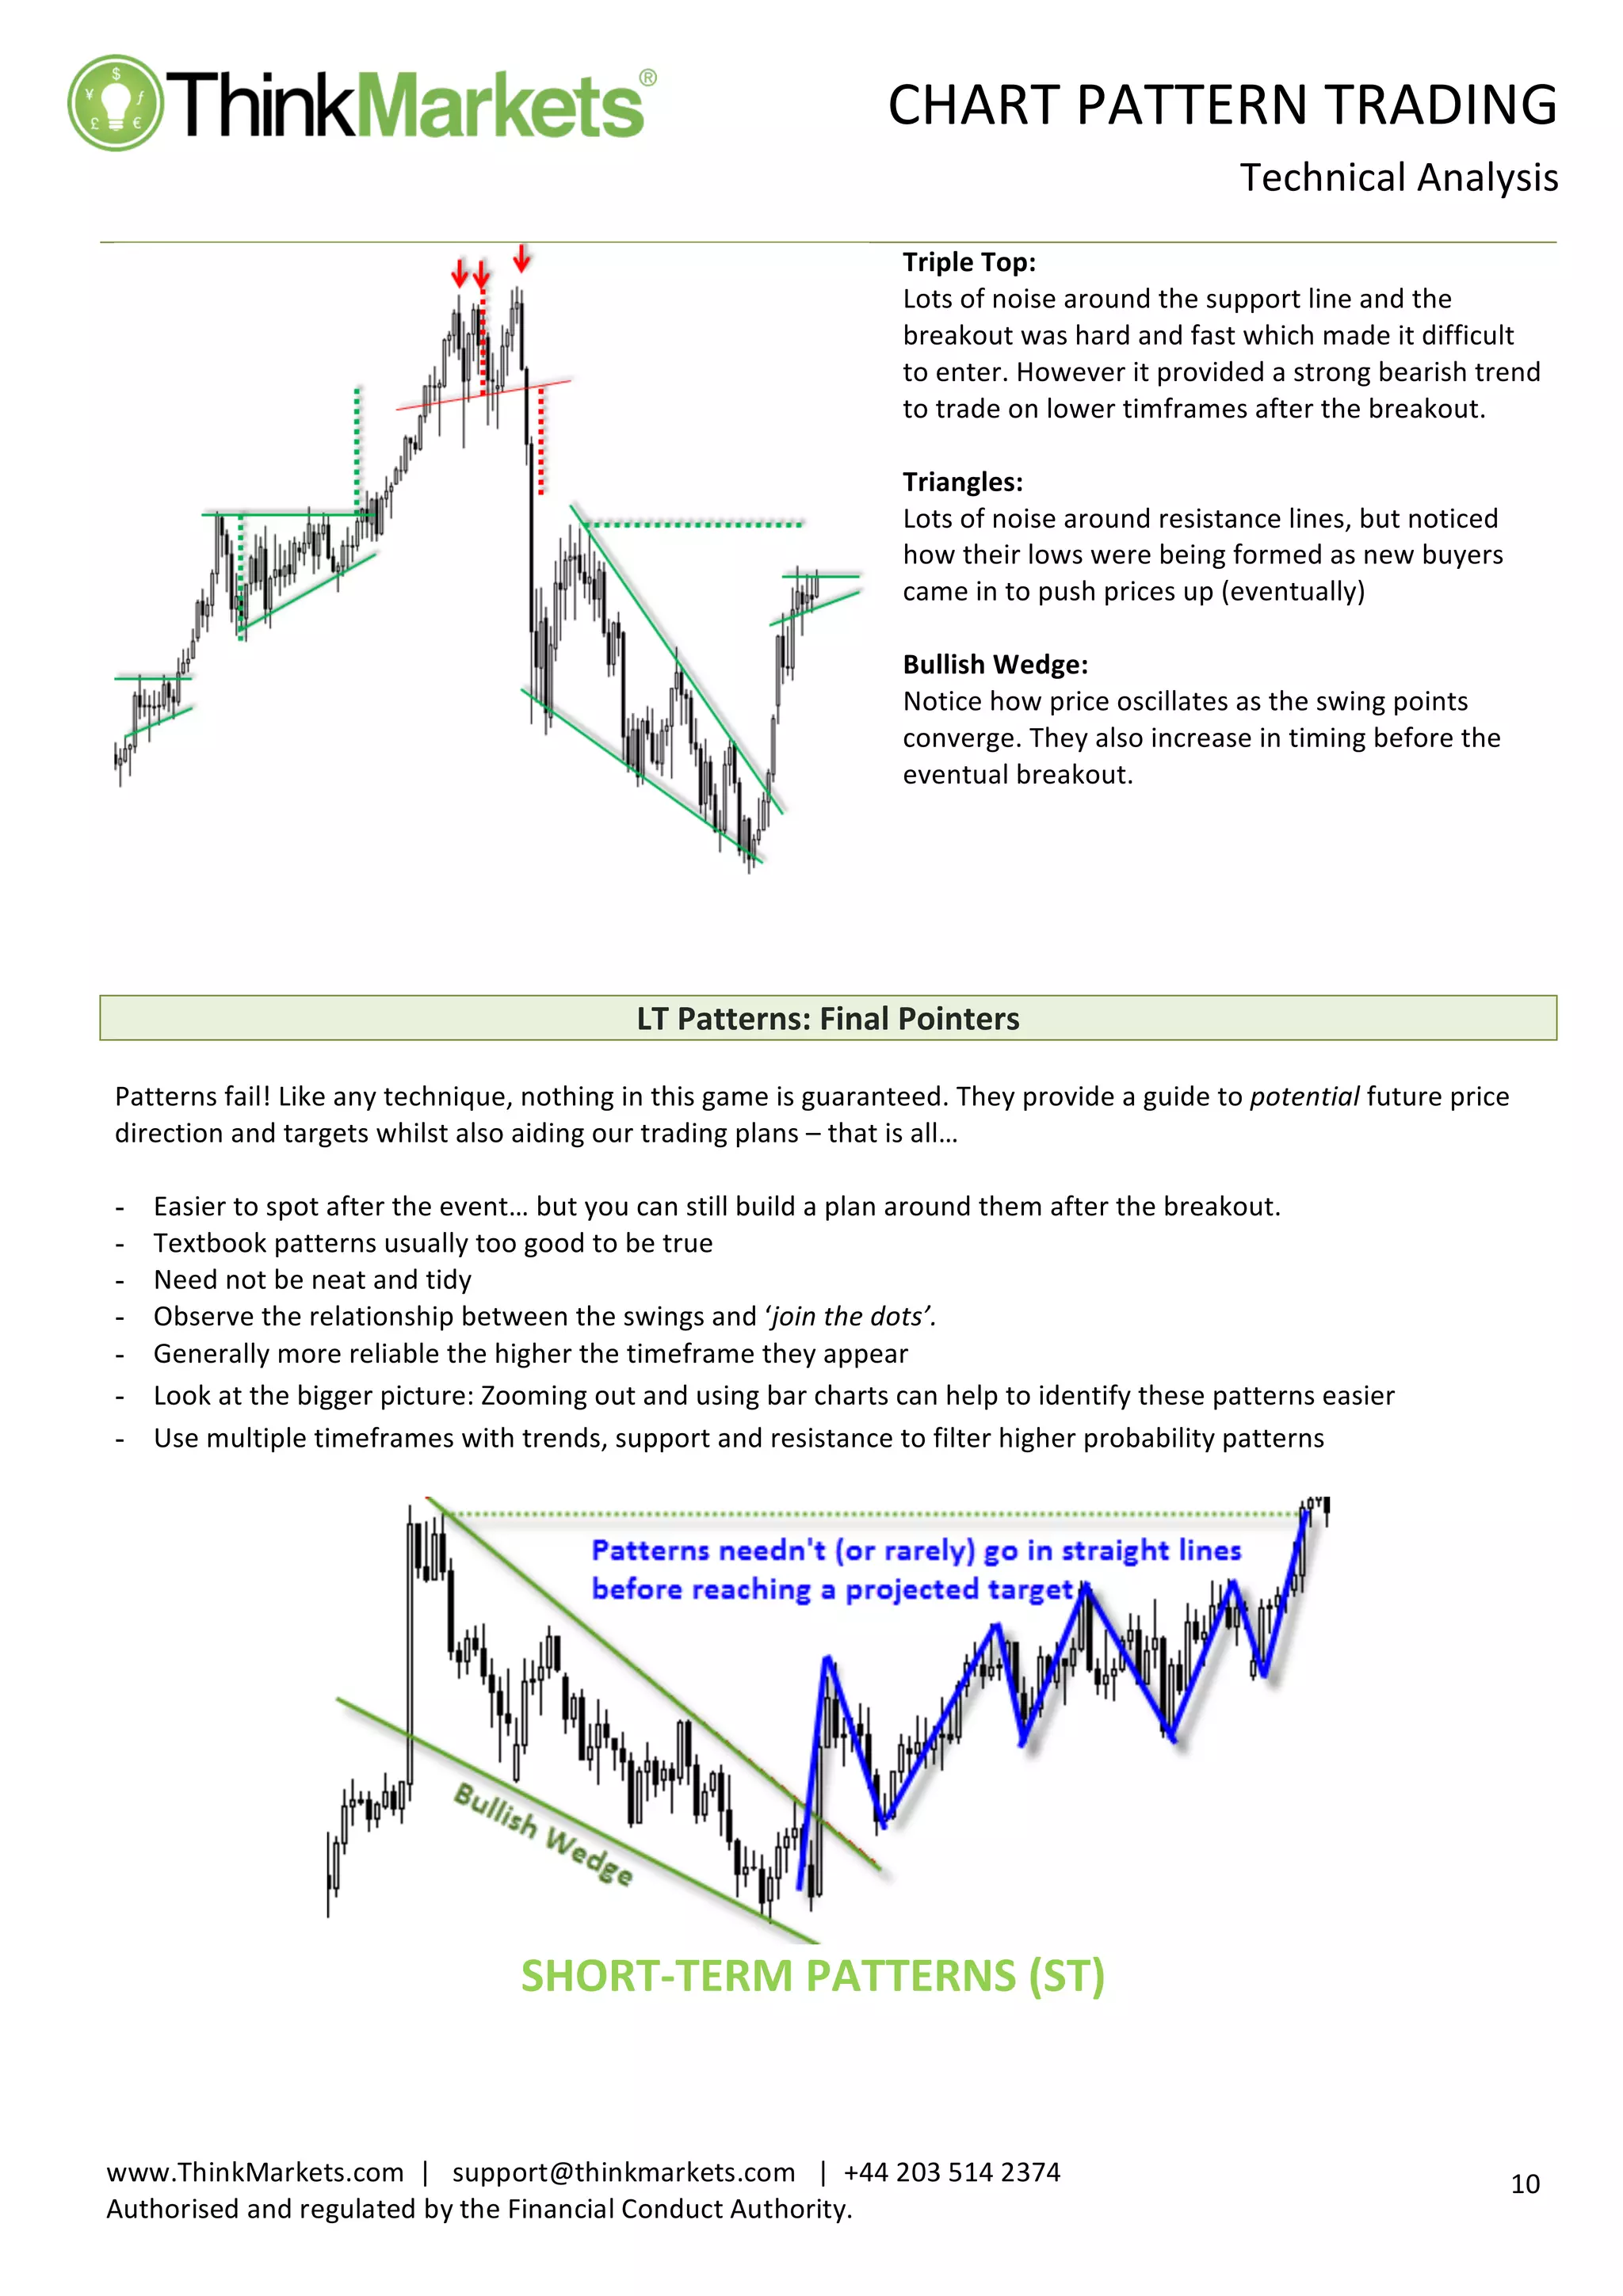
Triple
Top:
Lots
of
noise
around
the
support
line
and
the
breakout
was
hard
and
fast
which
made
it
difficult
to
enter.
However
it
provided
a
strong
bearish
trend
to
trade
on
lower
timframes
after
the
breakout.
Triangles:
Lots
of
noise
around
resistance
lines,
but
noticed
how
their
lows
were
being
formed
as
new
buyers
came
in
to
push
prices
up
(eventually)
Bullish
Wedge:
Notice
how
price
oscillates
as
the
swing
points
converge.
They
also
increase
in
timing
before
the
eventual
breakout.
LT
Patterns:
Final
Pointers
Patterns
fail!
Like
any
technique,
nothing
in
this
game
is
guaranteed.
They
provide
a
guide
to
potential
future
price
direction
and
targets
whilst
also
aiding
our
trading
plans
–
that
is
all…
- Easier
to
spot
after
the
event…
but
you
can
still
build
a
plan
around
them
after
the
breakout.
- Textbook
patterns
usually
too
good
to
be
true
- Need
not
be
neat
and
tidy
- Observe
the
relationship
between
the
swings
and
‘join
the
dots’.
- Generally
more
reliable
the
higher
the
timeframe
they
appear
- Look
at
the
bigger
picture:
Zooming
out
and
using
bar
charts
can
help
to
identify
these
patterns
easier
- Use
multiple
timeframes
with
trends,
support
and
resistance
to
filter
higher
probability
patterns
SHORT-‐TERM
PATTERNS
(ST)
12.
CHART
PATTERN
TRADING
Technical
Analysis
11
www.ThinkMarkets.com
|
support@thinkmarkets.com
|
+44
203
514
2374
Authorised
and
regulated
by
the
Financial
Conduct
Authority.
Bar
Charts
vs
Candlesticks
Japanese
Candlesticks
have
been
used
by
traders
since
the
1700s
and
very
popular
amongst
Forex
Traders.
When
you
consider
there
are
many
patterns
varying
from
1
candle
to
several
candles,
by
the
time
you
start
mixing
combinations
you
literally
have
hundreds
of
patterns
names
to
learn.
My
advice
here
is
that
by
learning
the
names
of
all
of
the
patterns
will
not
necessarily
make
a
better
trader.
In
fact
the
opposite
is
probably
true…
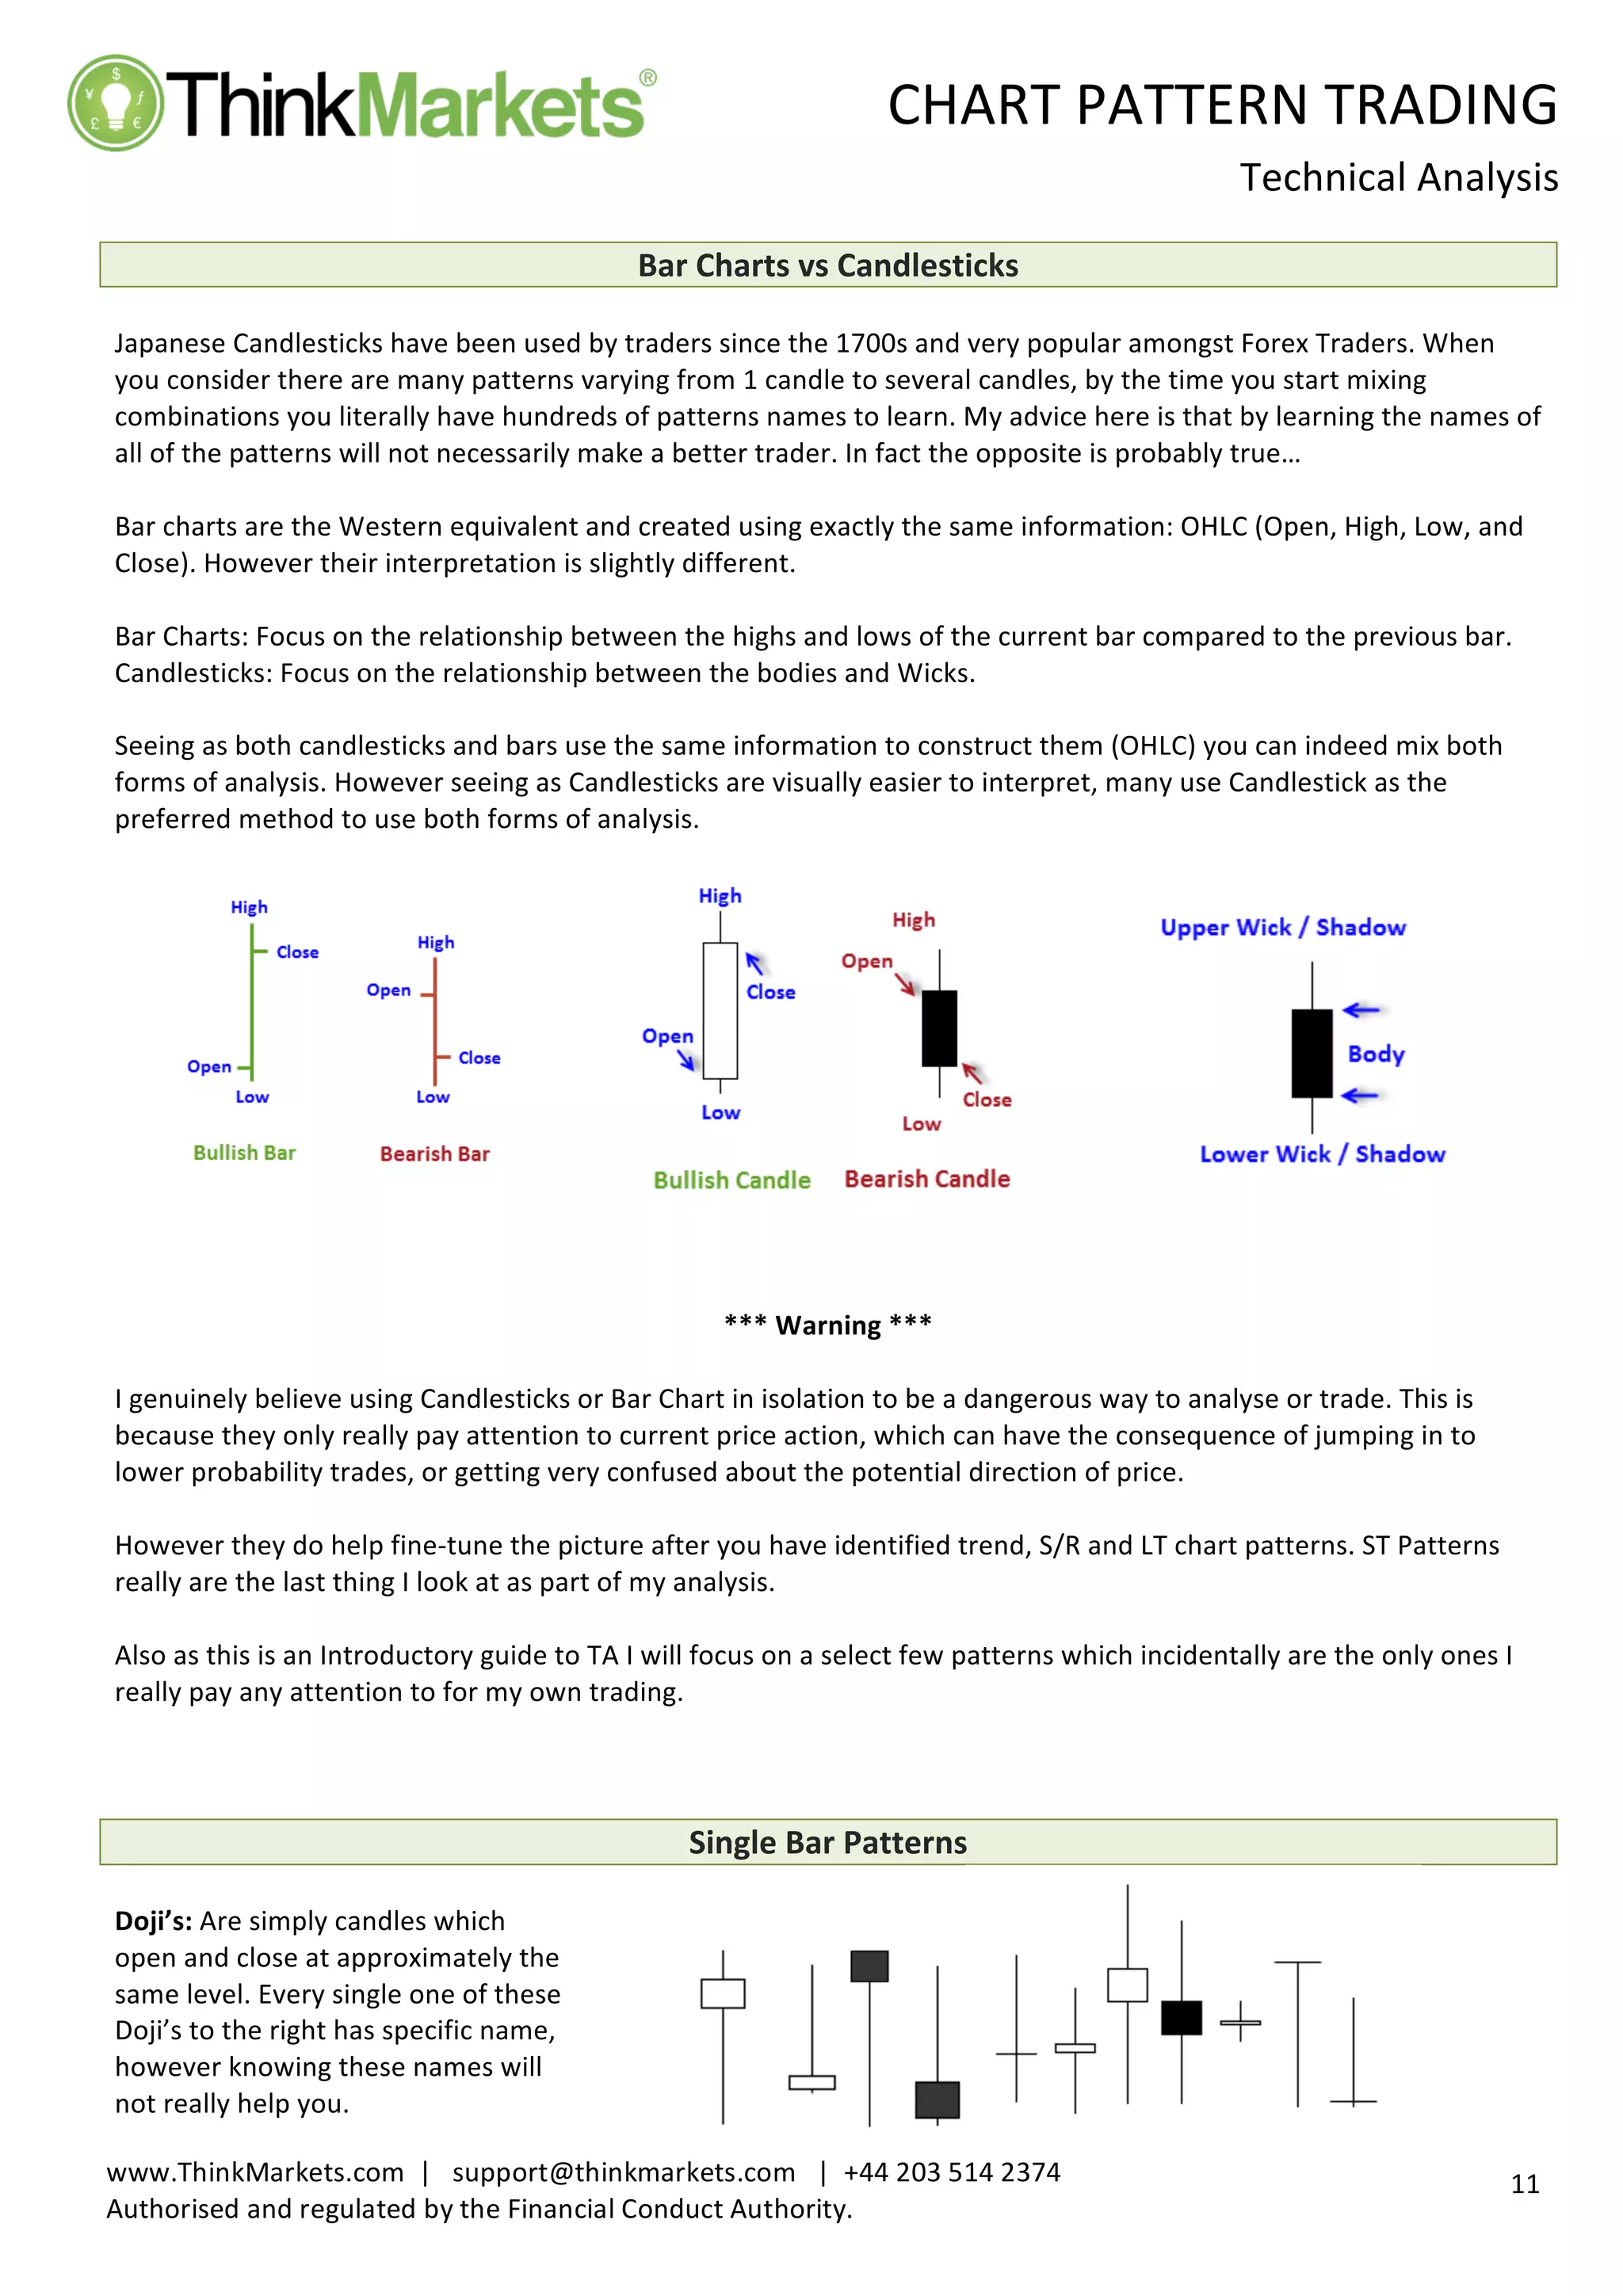
Bar
charts
are
the
Western
equivalent
and
created
using
exactly
the
same
information:
OHLC
(Open,
High,
Low,
and
Close).
However
their
interpretation
is
slightly
different.
Bar
Charts:
Focus
on
the
relationship
between
the
highs
and
lows
of
the
current
bar
compared
to
the
previous
bar.
Candlesticks:
Focus
on
the
relationship
between
the
bodies
and
Wicks.
Seeing
as
both
candlesticks
and
bars
use
the
same
information
to
construct
them
(OHLC)
you
can
indeed
mix
both
forms
of
analysis.
However
seeing
as
Candlesticks
are
visually
easier
to
interpret,
many
use
Candlestick
as
the
preferred
method
to
use
both
forms
of
analysis.
***
Warning
***
I
genuinely
believe
using
Candlesticks
or
Bar
Chart
in
isolation
to
be
a
dangerous
way
to
analyse
or
trade.
This
is
because
they
only
really
pay
attention
to
current
price
action,
which
can
have
the
consequence
of
jumping
in
to
lower
probability
trades,
or
getting
very
confused
about
the
potential
direction
of
price.
However
they
do
help
fine-‐tune
the
picture
after
you
have
identified
trend,
S/R
and
LT
chart
patterns.
ST
Patterns
really
are
the
last
thing
I
look
at
as
part
of
my
analysis.
Also
as
this
is
an
Introductory
guide
to
TA
I
will
focus
on
a
select
few
patterns
which
incidentally
are
the
only
ones
I
really
pay
any
attention
to
for
my
own
trading.
Single
Bar
Patterns
Doji’s:
Are
simply
candles
which
open
and
close
at
approximately
the
same
level.
Every
single
one
of
these
Doji’s
to
the
right
has
specific
name,
however
knowing
these
names
will
not
really
help
you.
13.
CHART
PATTERN
TRADING
Technical
Analysis
12
www.ThinkMarkets.com
|
support@thinkmarkets.com
|
+44
203
514
2374
Authorised
and
regulated
by
the
Financial
Conduct
Authority.
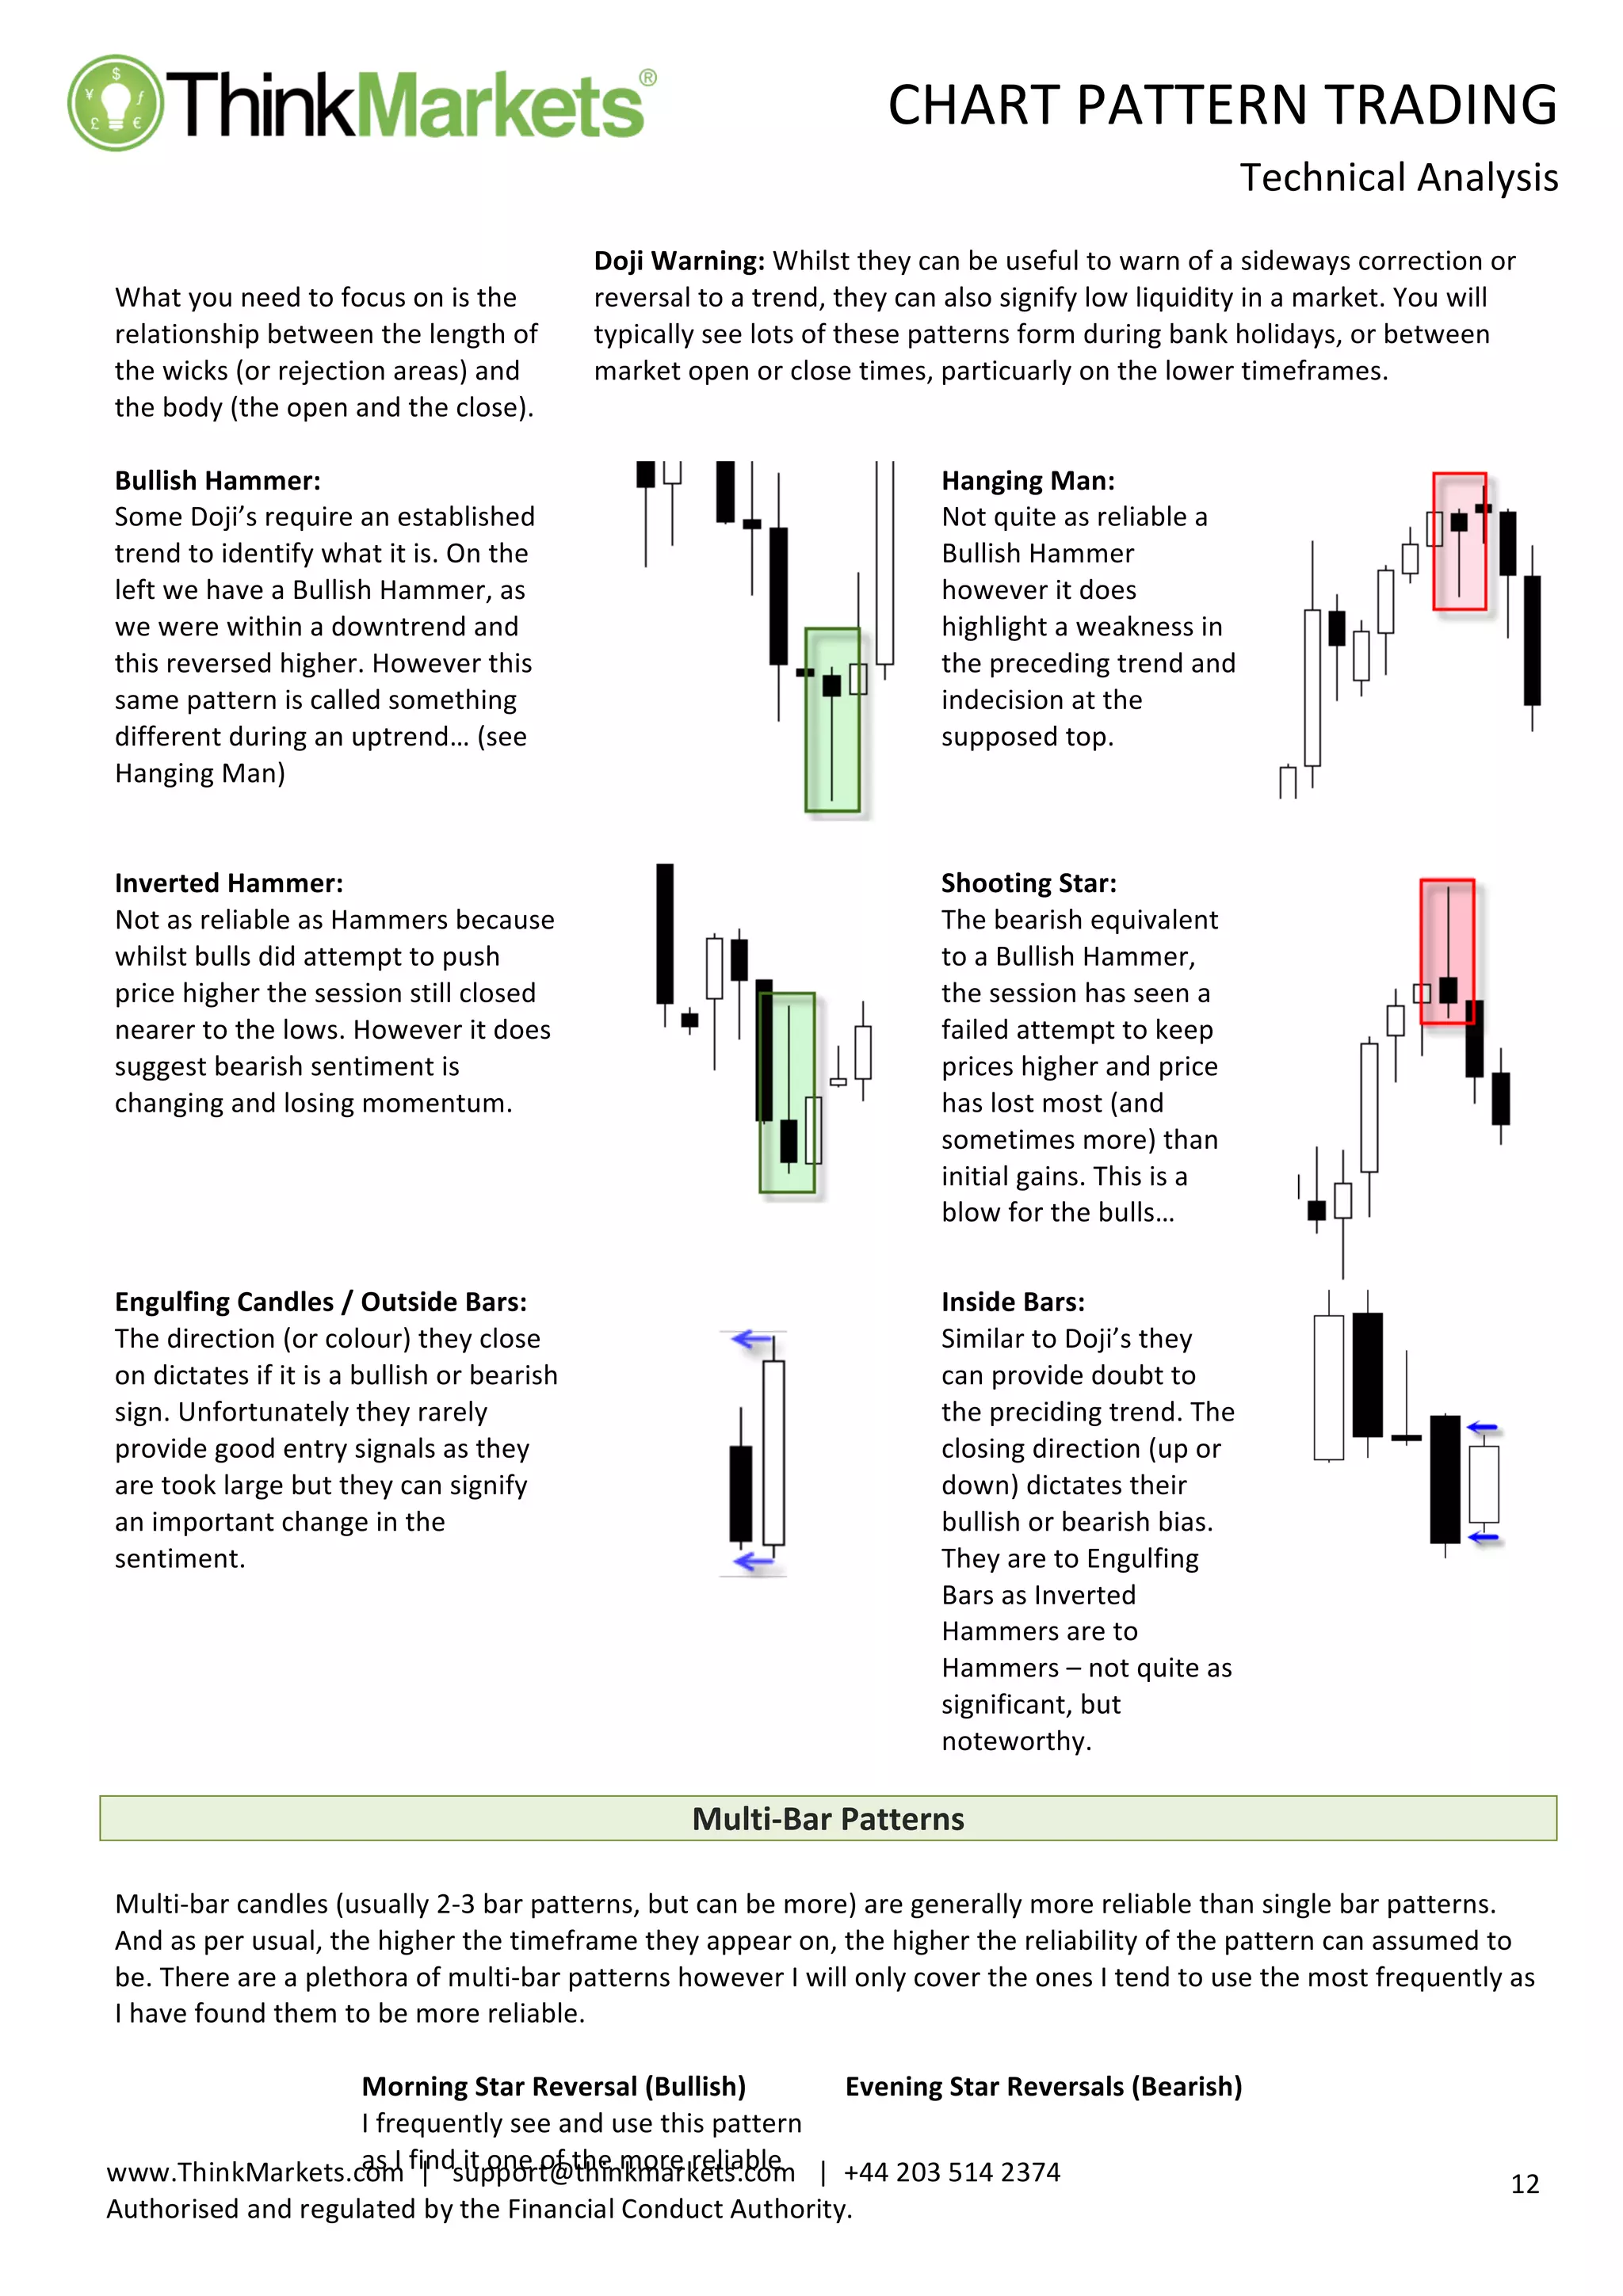
What
you
need
to
focus
on
is
the
relationship
between
the
length
of
the
wicks
(or
rejection
areas)
and
the
body
(the
open
and
the
close).
Doji
Warning:
Whilst
they
can
be
useful
to
warn
of
a
sideways
correction
or
reversal
to
a
trend,
they
can
also
signify
low
liquidity
in
a
market.
You
will
typically
see
lots
of
these
patterns
form
during
bank
holidays,
or
between
market
open
or
close
times,
particuarly
on
the
lower
timeframes.
Bullish
Hammer:
Some
Doji’s
require
an
established
trend
to
identify
what
it
is.
On
the
left
we
have
a
Bullish
Hammer,
as
we
were
within
a
downtrend
and
this
reversed
higher.
However
this
same
pattern
is
called
something
different
during
an
uptrend…
(see
Hanging
Man)
Hanging
Man:
Not
quite
as
reliable
a
Bullish
Hammer
however
it
does
highlight
a
weakness
in
the
preceding
trend
and
indecision
at
the
supposed
top.
Inverted
Hammer:
Not
as
reliable
as
Hammers
because
whilst
bulls
did
attempt
to
push
price
higher
the
session
still
closed
nearer
to
the
lows.
However
it
does
suggest
bearish
sentiment
is
changing
and
losing
momentum.
Shooting
Star:
The
bearish
equivalent
to
a
Bullish
Hammer,
the
session
has
seen
a
failed
attempt
to
keep
prices
higher
and
price
has
lost
most
(and
sometimes
more)
than
initial
gains.
This
is
a
blow
for
the
bulls…
Engulfing
Candles
/
Outside
Bars:
The
direction
(or
colour)
they
close
on
dictates
if
it
is
a
bullish
or
bearish
sign.
Unfortunately
they
rarely
provide
good
entry
signals
as
they
are
took
large
but
they
can
signify
an
important
change
in
the
sentiment.
Inside
Bars:
Similar
to
Doji’s
they
can
provide
doubt
to
the
preciding
trend.
The
closing
direction
(up
or
down)
dictates
their
bullish
or
bearish
bias.
They
are
to
Engulfing
Bars
as
Inverted
Hammers
are
to
Hammers
–
not
quite
as
significant,
but
noteworthy.
Multi-‐Bar
Patterns
Multi-‐bar
candles
(usually
2-‐3
bar
patterns,
but
can
be
more)
are
generally
more
reliable
than
single
bar
patterns.
And
as
per
usual,
the
higher
the
timeframe
they
appear
on,
the
higher
the
reliability
of
the
pattern
can
assumed
to
be.
There
are
a
plethora
of
multi-‐bar
patterns
however
I
will
only
cover
the
ones
I
tend
to
use
the
most
frequently
as
I
have
found
them
to
be
more
reliable.
Morning
Star
Reversal
(Bullish)
I
frequently
see
and
use
this
pattern
as
I
find
it
one
of
the
more
reliable
Evening
Star
Reversals
(Bearish)
14.
CHART
PATTERN
TRADING
Technical
Analysis
13
www.ThinkMarkets.com
|
support@thinkmarkets.com
|
+44
203
514
2374
Authorised
and
regulated
by
the
Financial
Conduct
Authority.
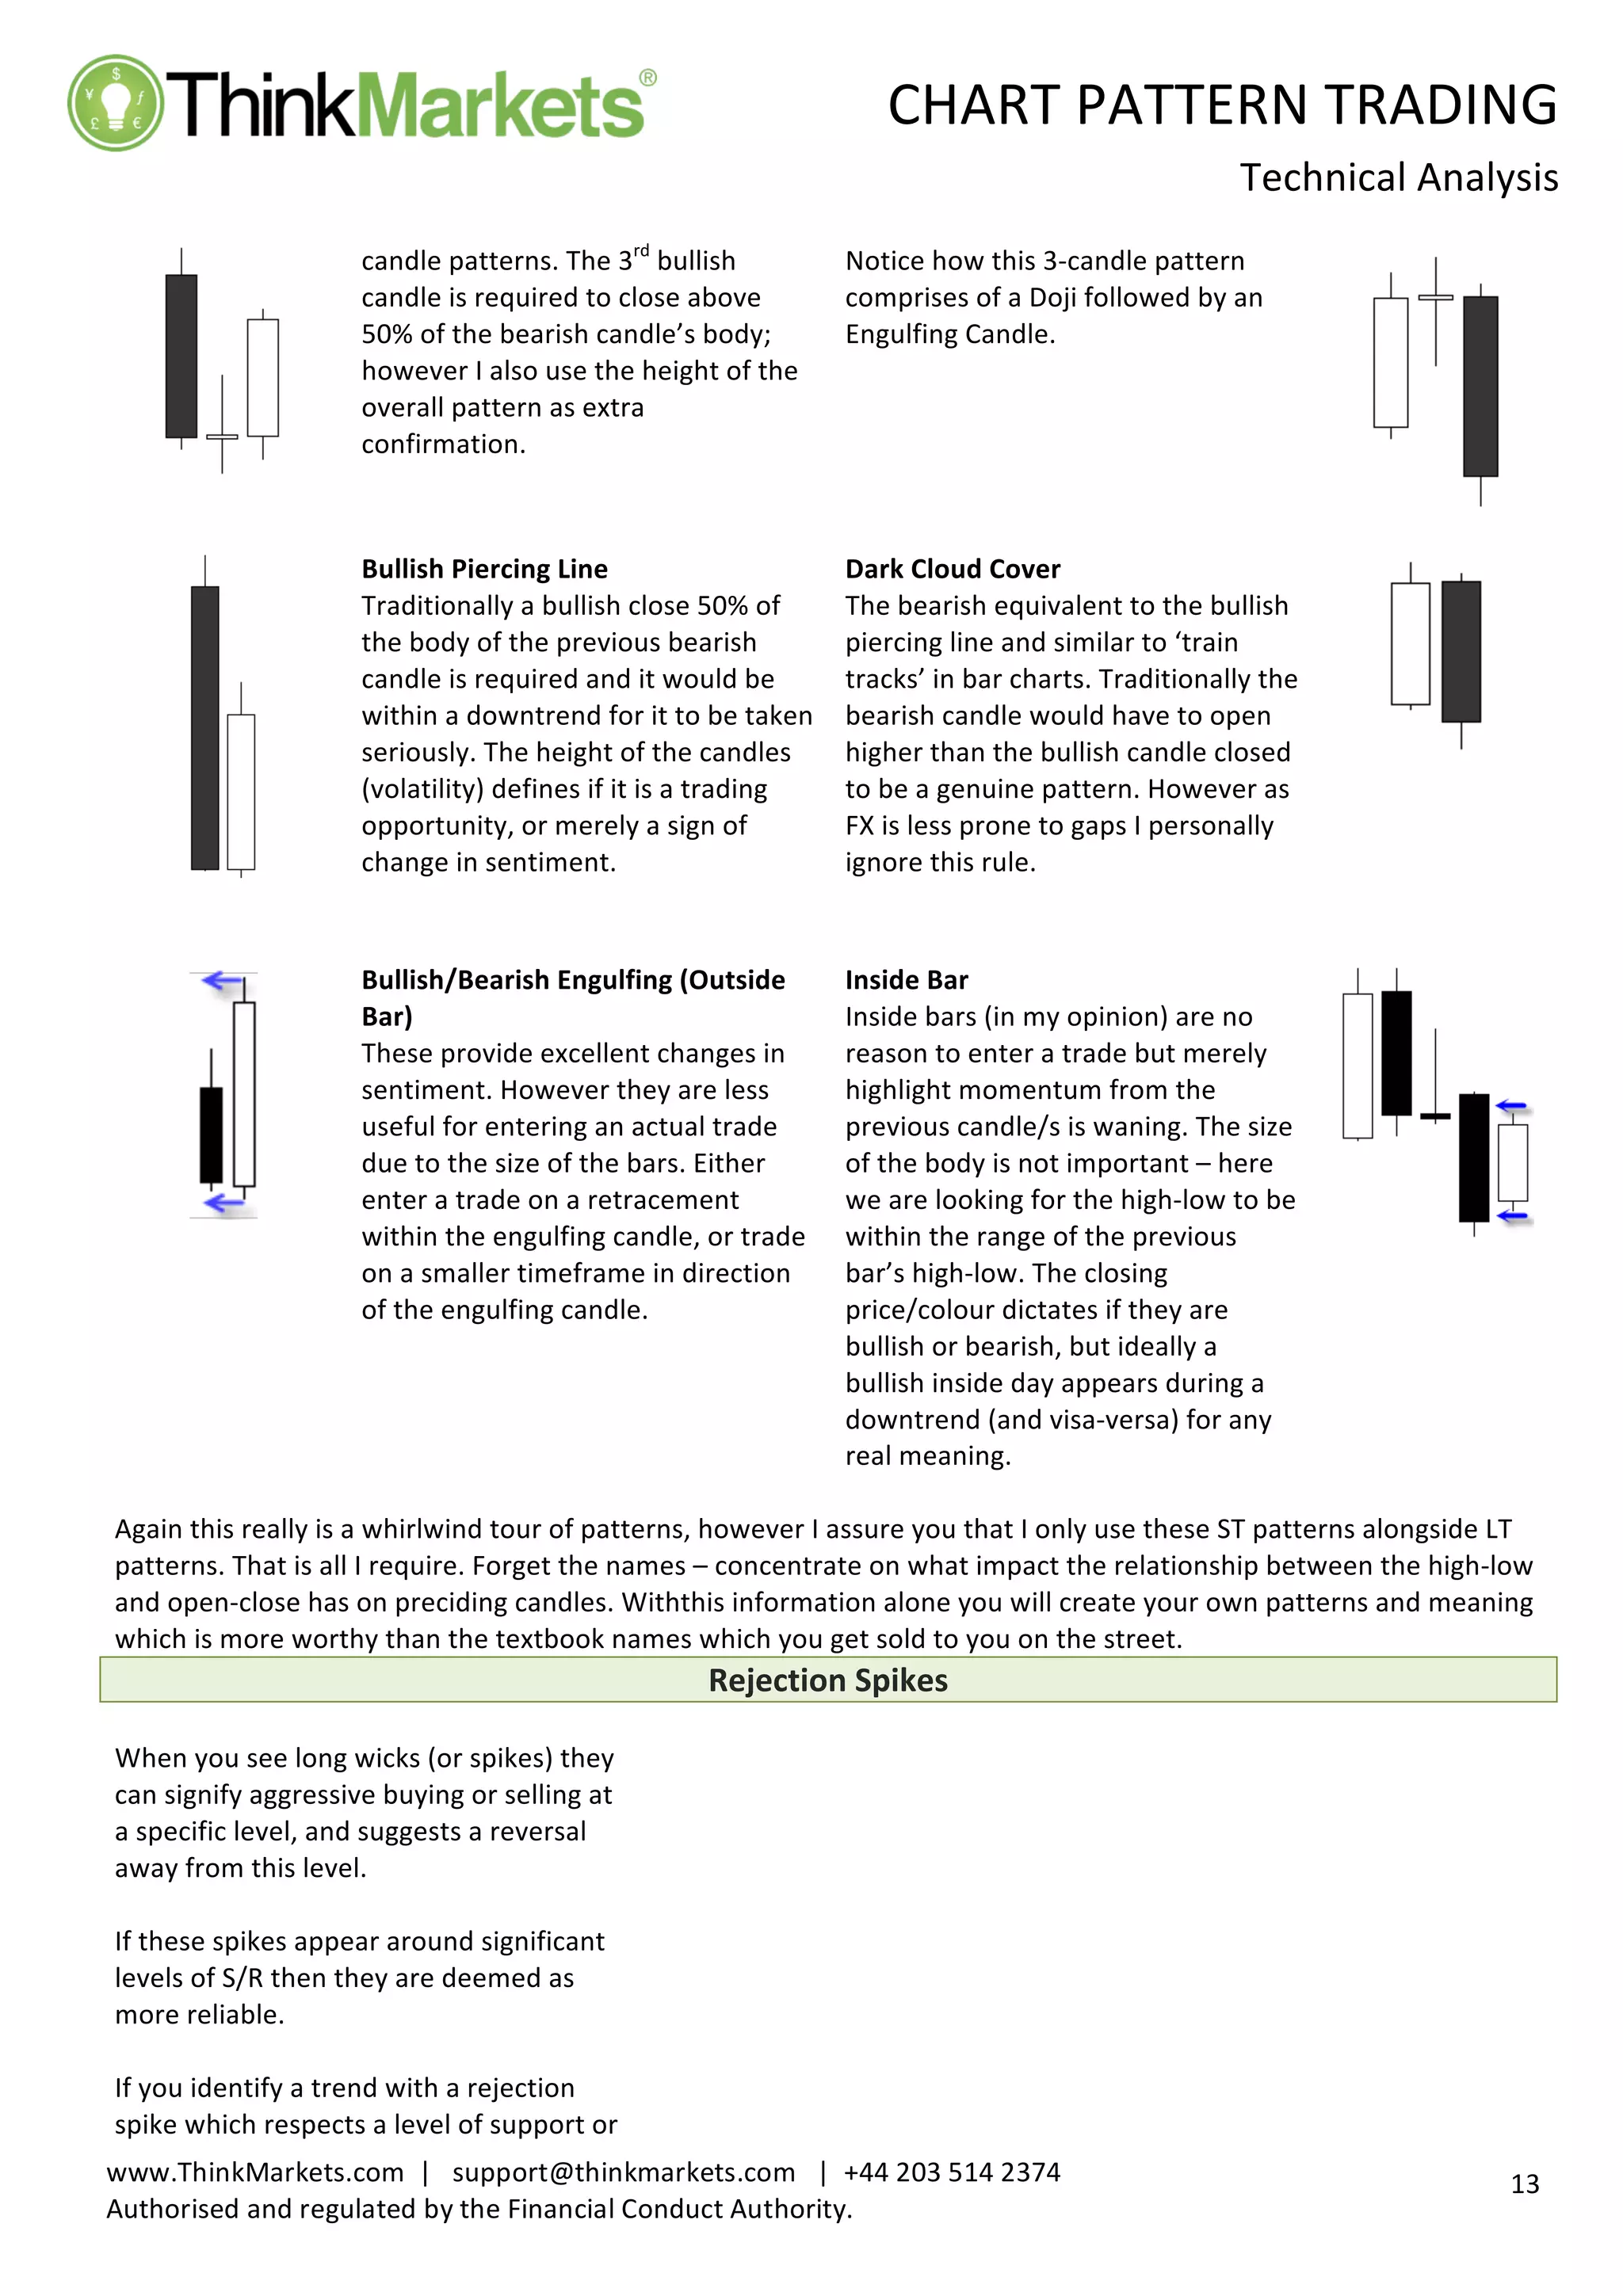
candle
patterns.
The
3rd
bullish
candle
is
required
to
close
above
50%
of
the
bearish
candle’s
body;
however
I
also
use
the
height
of
the
overall
pattern
as
extra
confirmation.
Notice
how
this
3-‐candle
pattern
comprises
of
a
Doji
followed
by
an
Engulfing
Candle.
Bullish
Piercing
Line
Traditionally
a
bullish
close
50%
of
the
body
of
the
previous
bearish
candle
is
required
and
it
would
be
within
a
downtrend
for
it
to
be
taken
seriously.
The
height
of
the
candles
(volatility)
defines
if
it
is
a
trading
opportunity,
or
merely
a
sign
of
change
in
sentiment.
Dark
Cloud
Cover
The
bearish
equivalent
to
the
bullish
piercing
line
and
similar
to
‘train
tracks’
in
bar
charts.
Traditionally
the
bearish
candle
would
have
to
open
higher
than
the
bullish
candle
closed
to
be
a
genuine
pattern.
However
as
FX
is
less
prone
to
gaps
I
personally
ignore
this
rule.
Bullish/Bearish
Engulfing
(Outside
Bar)
These
provide
excellent
changes
in
sentiment.
However
they
are
less
useful
for
entering
an
actual
trade
due
to
the
size
of
the
bars.
Either
enter
a
trade
on
a
retracement
within
the
engulfing
candle,
or
trade
on
a
smaller
timeframe
in
direction
of
the
engulfing
candle.
Inside
Bar
Inside
bars
(in
my
opinion)
are
no
reason
to
enter
a
trade
but
merely
highlight
momentum
from
the
previous
candle/s
is
waning.
The
size
of
the
body
is
not
important
–
here
we
are
looking
for
the
high-‐low
to
be
within
the
range
of
the
previous
bar’s
high-‐low.
The
closing
price/colour
dictates
if
they
are
bullish
or
bearish,
but
ideally
a
bullish
inside
day
appears
during
a
downtrend
(and
visa-‐versa)
for
any
real
meaning.
Again
this
really
is
a
whirlwind
tour
of
patterns,
however
I
assure
you
that
I
only
use
these
ST
patterns
alongside
LT
patterns.
That
is
all
I
require.
Forget
the
names
–
concentrate
on
what
impact
the
relationship
between
the
high-‐low
and
open-‐close
has
on
preciding
candles.
Withthis
information
alone
you
will
create
your
own
patterns
and
meaning
which
is
more
worthy
than
the
textbook
names
which
you
get
sold
to
you
on
the
street.
Rejection
Spikes
When
you
see
long
wicks
(or
spikes)
they
can
signify
aggressive
buying
or
selling
at
a
specific
level,
and
suggests
a
reversal
away
from
this
level.
If
these
spikes
appear
around
significant
levels
of
S/R
then
they
are
deemed
as
more
reliable.
If
you
identify
a
trend
with
a
rejection
spike
which
respects
a
level
of
support
or
15.
CHART
PATTERN
TRADING
Technical
Analysis
14
www.ThinkMarkets.com
|
support@thinkmarkets.com
|
+44
203
514
2374
Authorised
and
regulated
by
the
Financial
Conduct
Authority.
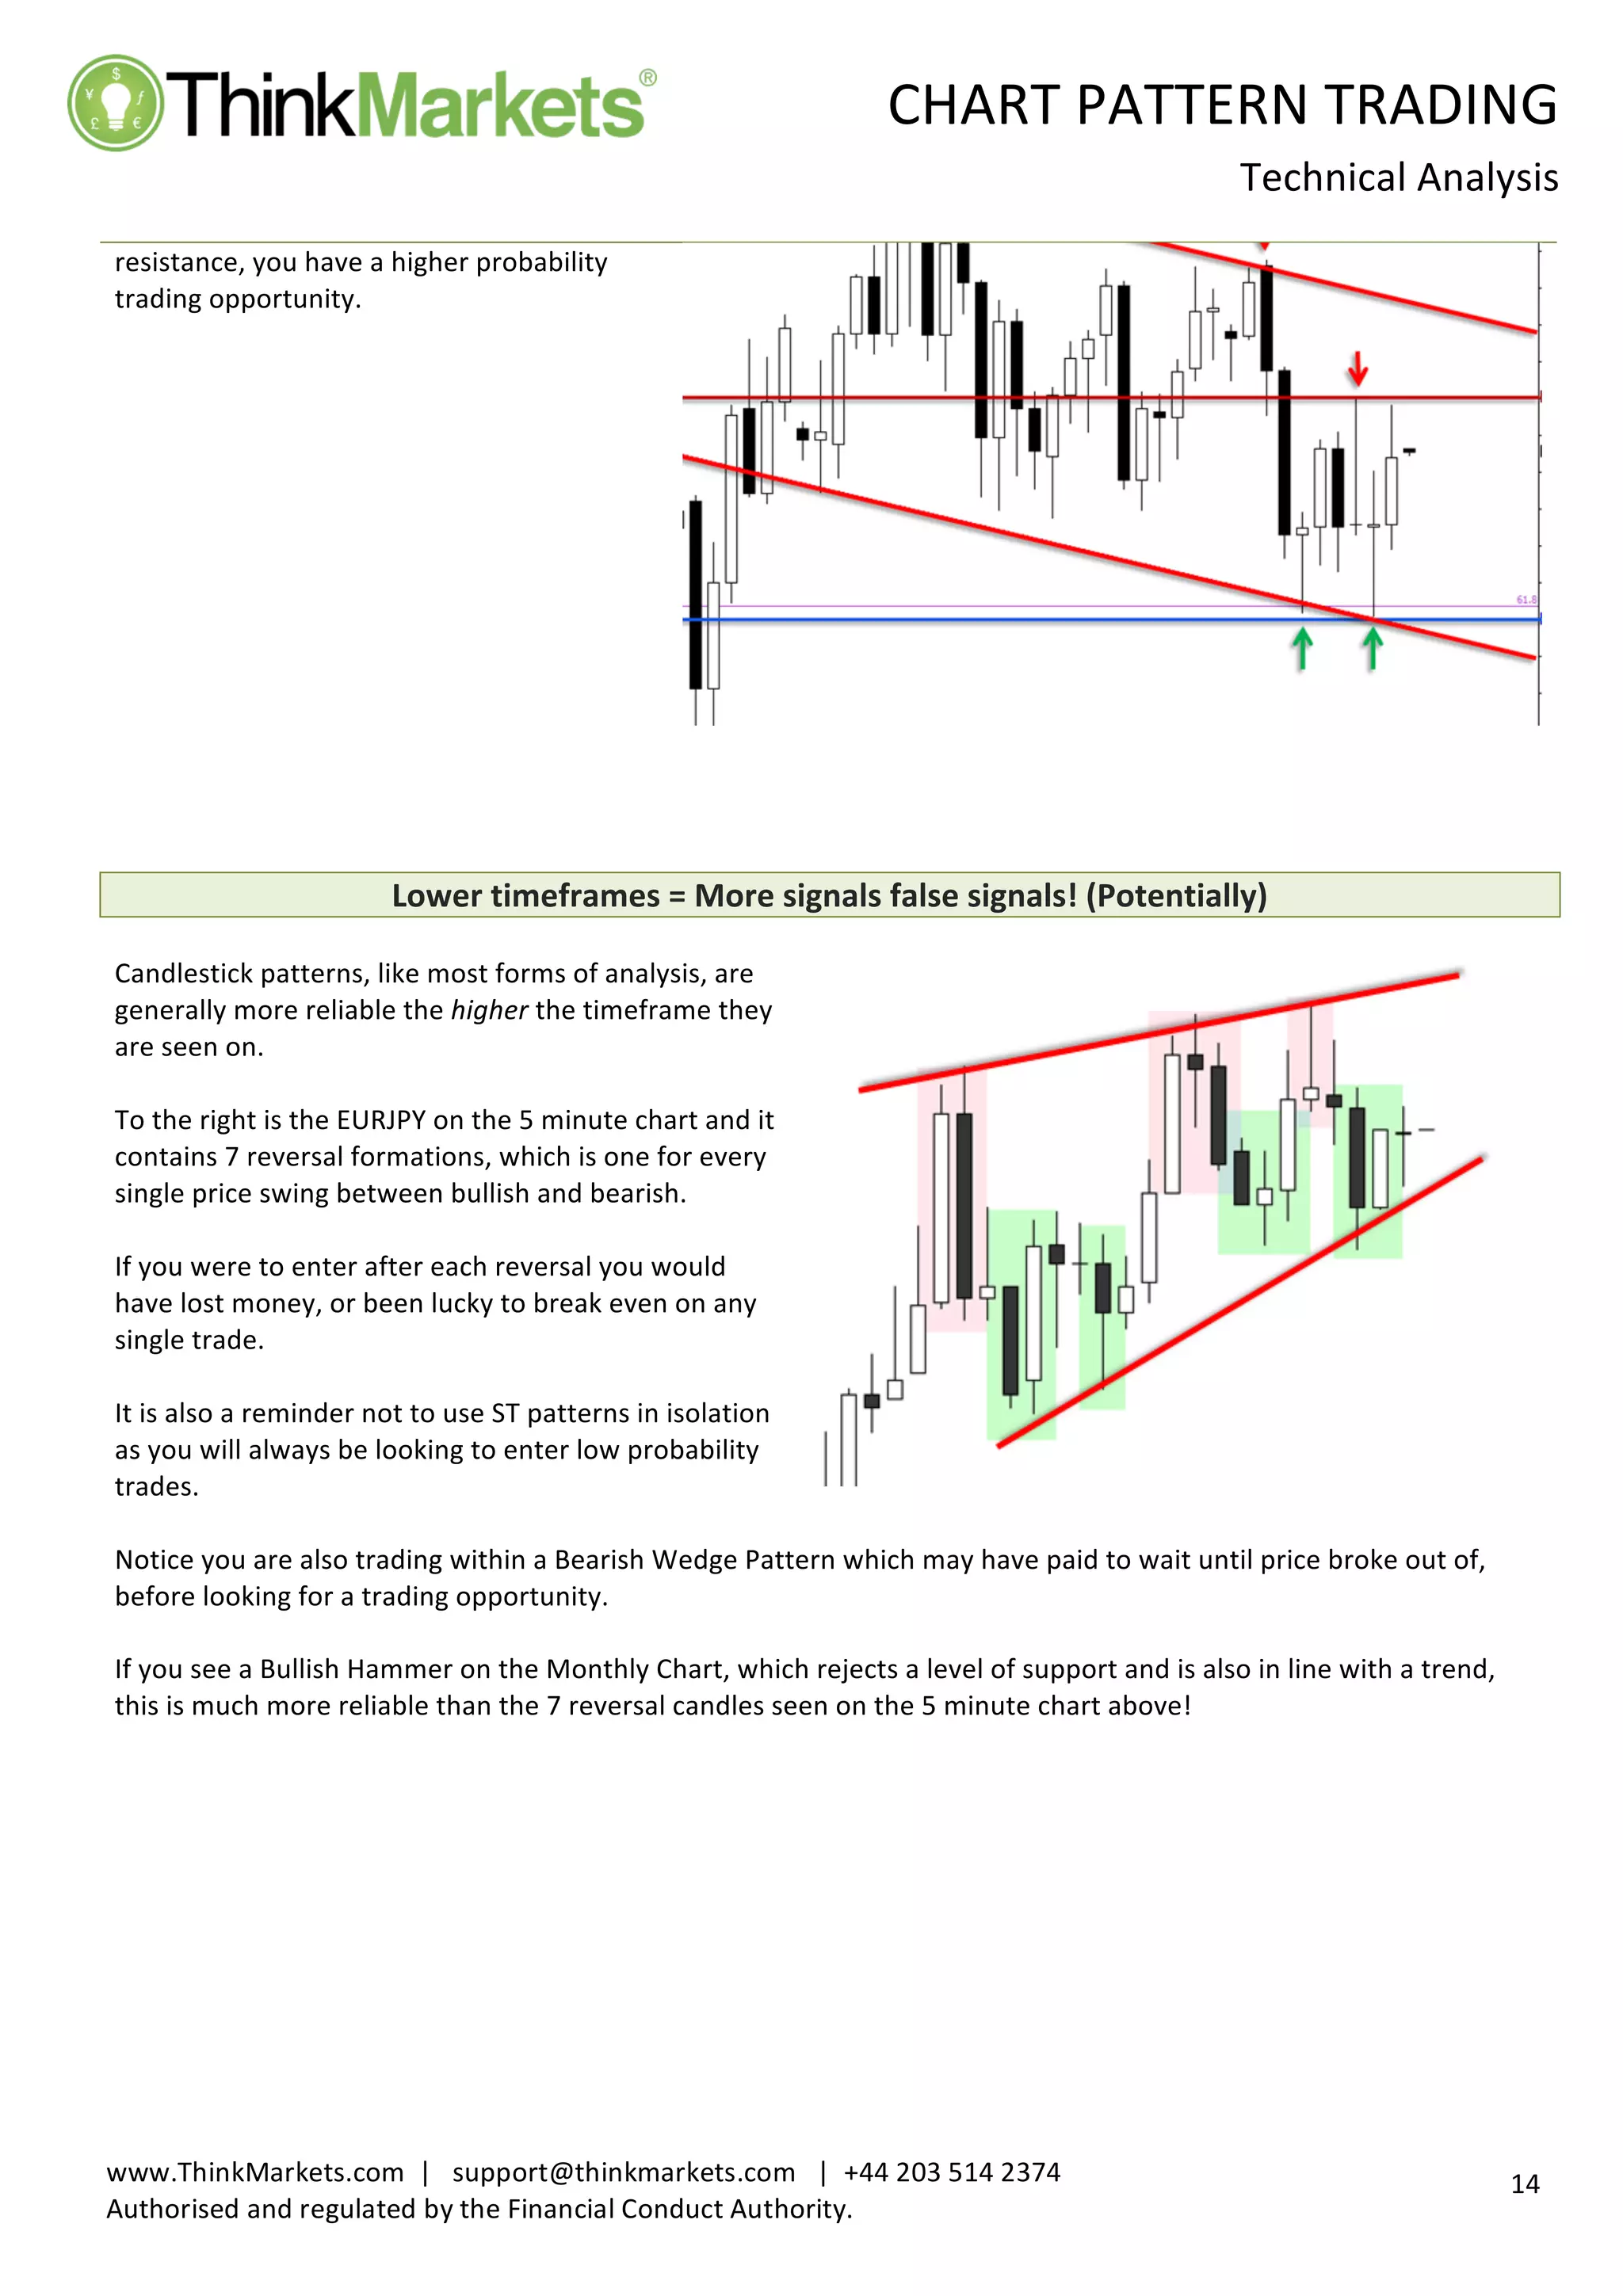
resistance,
you
have
a
higher
probability
trading
opportunity.
Lower
timeframes
=
More
signals
false
signals!
(Potentially)
Candlestick
patterns,
like
most
forms
of
analysis,
are
generally
more
reliable
the
higher
the
timeframe
they
are
seen
on.
To
the
right
is
the
EURJPY
on
the
5
minute
chart
and
it
contains
7
reversal
formations,
which
is
one
for
every
single
price
swing
between
bullish
and
bearish.
If
you
were
to
enter
after
each
reversal
you
would
have
lost
money,
or
been
lucky
to
break
even
on
any
single
trade.
It
is
also
a
reminder
not
to
use
ST
patterns
in
isolation
as
you
will
always
be
looking
to
enter
low
probability
trades.
Notice
you
are
also
trading
within
a
Bearish
Wedge
Pattern
which
may
have
paid
to
wait
until
price
broke
out
of,
before
looking
for
a
trading
opportunity.
If
you
see
a
Bullish
Hammer
on
the
Monthly
Chart,
which
rejects
a
level
of
support
and
is
also
in
line
with
a
trend,
this
is
much
more
reliable
than
the
7
reversal
candles
seen
on
the
5
minute
chart
above!
16.
CHART
PATTERN
TRADING
Technical
Analysis
15
www.ThinkMarkets.com
|
support@thinkmarkets.com
|
+44
203
514
2374
Authorised
and
regulated
by
the
Financial
Conduct
Authority.
ST
Patterns:
Summary
- Can
be
subjective,
but
easier
to
identify
than
Long-‐Term
Patterns
- Many
traders
place
too
much
emphasis
on
Short-‐Term
patterns
- Provide
more
false
signals
on
lower
timeframes
- Must
be
combined
with
other
forms
of
analysis
to
filter
false
signals
- Learning
the
names
of
exotically
named
patterns
does
NOT
make
you
a
better
trader
- The
LAST
part
of
the
puzzle
- Whilst
they
can
be
seen
at
market
turns,
trend
traders
would
be
wiser
to
trade
reversal
patterns
that
take
you
back
in
line
with
the
dominant
trend
Focus
on:
- Wickes,
Bodies
and
Candle
Range
- Relationship
between
these
- How
they
integrate
with
preceding
candles
- How
they
integrate
with
other
forms
of
analysis
REDUCE
YOUR
LEARNING
CURVE
I
hope
you
have
enjoyed
this
series
and
found
it
of
benefit.
Whilst
I
would
like
to
think
you
are
now
expert
analysts
just
from
reading
this
series,
like
anything
in
life,
it
will
take
time
to
master
which
will
require
practice
and
experimentation
-‐
however
a
great
way
of
speeding
up
the
process
is
to
watch
others
perform
analysis.
Newsroom
FaceBook
Twitter
YoutUbe
RSS
I
would
highly
encourage
you
to
subscribe
to
the
ThinkMarkets
YouTube
channel
and
attend
our
weekly
webinars
as
they
included
the
methods
used
throughout
the
series.

![CHART
PATTERN
TRADING
Technical
Analysis
3
www.ThinkMarkets.com
|
support@thinkmarkets.com
|
+44
203
514
2374
Authorised
and
regulated
by
the
Financial
Conduct
Authority.
CHART
PATTERNS
EXPLAINED
Introduction
Out
of
all
the
topics
within
this
series,
this
is
by
far
the
hardest
one
to
fit
into
one
topic.
If
anything
this
should
be
split
into
two
topics
but
then
we
have
to
remember
this
is
an
introductory
guide.
It
was
not
until
I
came
to
write
this
section
and
host
the
webinars
that
I
realised
how
many
intricacies
and
areas
of
judgement
I
make
using
these
patterns.
There
are
many
textbooks
and
websites
that
will
bog
you
down
with
exotic
names
and
fancy
patterns
which
provide
little,
if
any,
practical
use
for
day-‐to-‐day
analysis
and
trading.
Therefor
I
have
tried
to
avoid
this
road,
and
instead
provide
the
basics
along
with
the
‘what
you
really
need
to
know
tips’
to
make
any
use
of
the
most
basic
patterns.
I
have
split
it
into
2
main
sections
by
their
style:
Long-‐term
patterns;
short-‐term
patterns;
Both
styles
possess
their
own
strengths
and,
weaknesses,
require
different
approaches
yet
at
the
same
time,
complement
each
other
as
though
they
were
always
meant
to
be.
If
you
have
to
take
one
piece
of
advice
from
this
guide
please
take
the
following:
You
will
significantly
increase
the
usability
of
each
style
by
combining
the
two
together.
Many
try
to
master
one
style
and
use
them
in
isolation
(as
I
did)
but
they
will
create
independent
problems
for
your
analysis
and
trading.
By
blending
the
two
together
you
will
create
a
more
structured
and
comprehensive
view
of
price.
Combine
these
two
styles
of
patterns
recognition
with
trends,
support
and
resistance
and
you
will
never
look
at
a
price
chart
the
same
way
again.
Why
do
chart
Patterns
Occur?
The
concept
is
similar
to
support
&
resistance:
At
any
one
time
market
participants
have
one
of
three
choices
-‐
to
buy,
sell
or
stand
aside.
As
this
ratio
between
the
three
groups
change
over
time,
so
does
the
supply
and
demand
for
any
given
market.
As
this
force
changes,
so
does
price.
This
is
all
based
upon
participants
(and
groups
of)
opinions
of
where
price
‘should’
be.
As
the
battle
towards
the
‘correct’
market
price
unfolds
we
see
trends
and
oscillations
develop,
which
when
combined
form
familiar
patterns.
If
we
can
identify
familiar
patterns,
technical
analysts
believe
that
[to
a
certain
degree]
price
can
become
predictable.
The
collective
individuals
within
any
market
constantly
changes,
along
with
personal
opinions
of
where
price
‘should
be’,
or
why
they
should
move
in
the
first
place.
Regardless…
a
Technical
Analyst
always
takes
comfort
in
the
fact
that
history
does
repeat
itself
as
long
as
prices
are
always
governed
by
supply
and
demand.](https://image.slidesharecdn.com/3-chart-patterns-230901135949-6f8ba712/75/3-chart-patterns-pdf-4-2048.jpg)