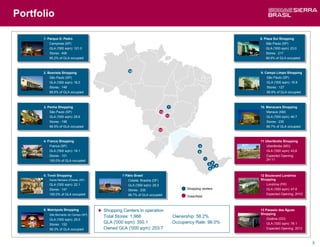
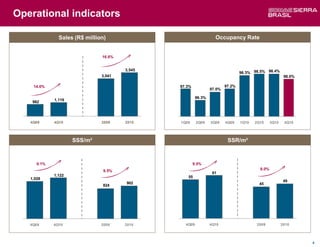
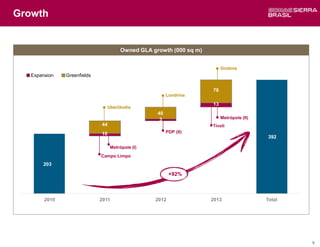
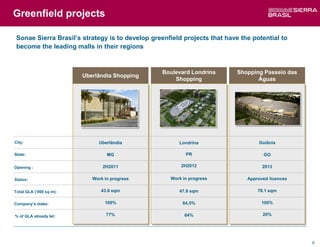
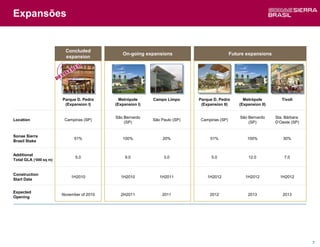
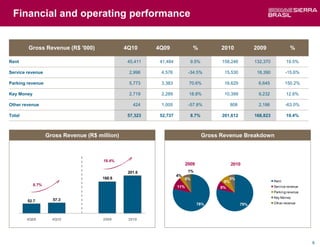
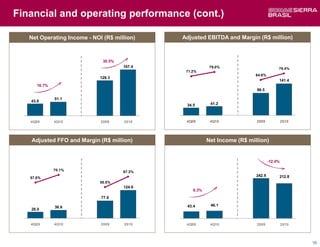
2. Sound track record
Sonae Sierra Brasil’s historical evolution | Owned GLA (‘000 sq m)
Acquisition
Development Acquisition of CAGR(01-10): 26.2%
Acquisition of a 20% additional stakes in
stake in Plaza Sul Metrópole, Plaza Sul
and Tivoli
200.0 203.7
Opening of PDP
Shopping
128.4
150.0 148.5
102.7
Opening of
Manauara Shopping
108.5 DDR become a
shareholder with
80.8 50% stake
79.9
Opening of Opening of Campo
Boavista Shopping Limpo
Acquisition of
25.1 additional stake in
Metrópole
1999… 2001 2002 2003 2004 2005 2006 2007 2008 2009 2010
Total GLA 111.7 219.0 220.9 242.1 273.8 297.8 298.8 296.8 343.5 350.1
(‘000 sq m)
Owned GLA as 22.5% 36.5% 36.6% 42.4% 39.6% 43.1% 50.2% 50.0% 58.2% 58.2%
% of total GLA
2
3. Portfolio
1. Parque D. Pedro 8. Plaza Sul Shopping
► Campinas (SP) ► São Paulo (SP)
► GLA ('000 sqm): 121.0 ► GLA ('000 sqm): 23.0
► Stores : 406 ► Stores : 217
► 95.2% of GLA occupied ► 99.9% of GLA occupied
10
2. Boavista Shopping 9. Campo Limpo Shopping
► São Paulo (SP) ► São Paulo (SP)
► GLA ('000 sqm): 16.0 ► GLA ('000 sqm): 19.9
► Stores : 148 ► Stores : 127
► 98.6% of GLA occupied ► 99.9% of GLA occupied
3. Penha Shopping 7 10. Manauara Shopping
► São Paulo (SP) 13 ► Manaus (AM)
► GLA ('000 sqm): 29.6 11 ► GLA ('000 sqm): 46.7
► Stores : 198 ► Stores : 235
► 99.5% of GLA occupied ► 99.7% of GLA occupied
12
4. Franca Shopping 11 Uberlândia Shopping
► Franca (SP) 4 ► Uberlândia (MG)
► GLA ('000 sqm): 18.1 5 ► GLA ('000 sqm): 43,6
► Stores : 101 ► Expected Opening:
1 2H 11
► 100.0% of GLA occupied
8
3
2 9
6
5. Tivoli Shopping 7 Pátio Brasil 12 Boulevard Londrina
► Santa Barbara d'Oeste (SP) ► Cidade: Brasília (DF) Shopping
► GLA ('000 sqm): 22.1 ► GLA ('000 sqm): 29.0 ► Londrina (PR)
► Stores : 147 ► Stores : 235 Shopping centers ► GLA ('000 sqm): 47.8
► 100.0% of GLA occupied ► 98.7% of GLA occupied ► Expected Opening; 2H12
Greenfield
6. Metrópole Shopping ► Shopping Centers in operation 13 Passeio das Águas
► São Bernardo do Campo (SP) Shopping
Total Stores: 1,966 Ownership: 58.2% ► Goiânia (GO)
► GLA ('000 sqm): 25.0
► Stores : 152
GLA ('000 sqm): 350.1 Occupancy Rate: 98.0% ► GLA ('000 sqm): 78.1
► 99.3% of GLA occupied Owned GLA ('000 sqm): 203.7 ► Expected Opening: 2013
3
5. Growth
Owned GLA growth (000 sq m)
Goiânia
Expansion Greenfields
78
Londrina
13
Uberlândia
40
3 Metrópole (II)
44 Tívoli
10 PDP (II)
392
Metrópole (I)
Campo Limpo
203
+92%
2010 2011 2012 2013 Total
5
6. Greenfield projects
Sonae Sierra Brasil’s strategy is to develop greenfield projects that have the potential to
become the leading malls in their regions
Boulevard Londrina Shopping Passeio das
Uberlândia Shopping
Shopping Águas
City: Uberlândia Londrina Goiânia
State: MG PR GO
Opening : 2H2011 2H2012 2013
Status: Work in progress Work in progress Approved licences
Total GLA (‘000 sq m): 43.6 sqm 47.8 sqm 78.1 sqm
Company’s stake: 100% 84,5% 100%
% of GLA already let: 77% 64% 20%
6
7. Expansões
Concluded
On-going expansions Future expansions
expansion
Parque D. Pedro Metrópole Campo Limpo Parque D. Pedro Metrópole Tivoli
(Expansion I) (Expansion I) (Expansion II) (Expansion II)
São Bernardo São Bernardo Sta. Bárbara
Location Campinas (SP) São Paulo (SP) Campinas (SP)
(SP) (SP) D’Oeste (SP)
Sonae Sierra
51% 100% 20% 51% 100% 30%
Brasil Stake
Additional
5.0 9.0 3.0 5.0 12.0 7.0
Total GLA (‘000 sq m)
Construction
1H2010 1H2010 1H2011 1H2012 1H2012 1H2012
Start Date
Expected
November of 2010 2H2011 2011 2012 2013 2013
Opening
7
10. Financial and operating performance (cont.)
Net Operating Income - NOI (R$ million) Adjusted EBITDA and Margin (R$ million)
30.5%
167.4 79.0% 76.4%
71.2%
64.6%
128.3
141.4
16.7% 111 111
99.5
51.1
43.8
34.5 41.2
4Q09 4Q10 2009 2010 4Q09 4Q10 2009 2010
Adjusted FFO and Margin (R$ million) Net Income (R$ million)
-12.4%
70.1% 67.3%
242.9 212.8
57.8%
50.5%
111 124.6
6.3%
111
77.8
36.6 43.4 46.1
28.0
4Q09 4Q10 2009 2010 4Q09 4Q10 2009 2010
10
11. Net income composition
In December 2010, Sonae Sierra Brasil adopted the IFRS, under which, the Company opted to
value its investment properties at fair value. The reduction in the Change in Fair Value of
Investment Properties account is due primarily to the extraordinary gain recognized in 2009 with
the opening of Manauara Shopping.
Cost of rent Equity income
and services 1.8 0.0
1.0
7.0 General and Taxes
administrative
expenses
30.9
Gain from fair value of
investment properties
Net operating
83.9
revenue from
rent, services Income and
and other social
contribution
Net financial taxes
242.9 result 5.5
3.8 7.5 212.8
Other operating
revenue (expenses),
net
2009 2010
Net income Net income
11
12. Financial and operating performance (cont.)
Bank Loans Debt Amortization Schedule (R$ million)
104.3
27.1 27.1 26.4
7.2 9.7
2011 2012 2013 2014 2015 2016 and
on
12
13. Questions & answers
Investors Relations
Carlos Alberto Correa
Investors Relations Officer
Murilo Hyai
Investors Relations Manager
Email:
ribrasil@sonaesierra.com
Phone:
Thank You
+55 (11) 3371-4188
14. Disclaimer
► The following material, on this date, is a presentation containing general information about Sonae Sierra Brasil.
We offer no guarantee and make no declaration, implicitly or explicitly, as to the accuracy, completeness or
scope of this information.
► This presentation may include forward-looking statements of future events or results according to the regulations
of the Brazilian and International securities and exchange commissions. These statements are based on certain
assumptions and analyses by the Company that reflect its experience, the economic environment, future market
conditions and expected events by the company, many of which are beyond the control of the Company.
Important factors that may lead to significant differences between the actual results and the statements of
expectations about future events or results include the company’s business strategy, Brazilian and International
economic conditions, technology, financial strategy, financial market conditions, uncertainty regarding the results
of its future operations, plans, objectives, expectations and intentions, among others. Considering these factors,
the actual results of the company may be significantly different from those shown or implicit in the statement of
expectations about future events or results.
► The information and opinions contained in this presentation should not be understood as a recommendation to
potential investors and no investment decision is to be based on the veracity, current events or completeness of
this information or these opinions. No advisors to the company or parties related to them or their representatives
should have any responsibility for any losses that may result from the use or contents of this presentation.
14