Download to read offline

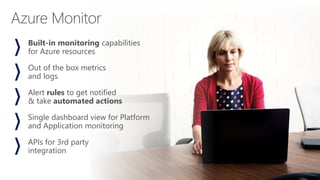
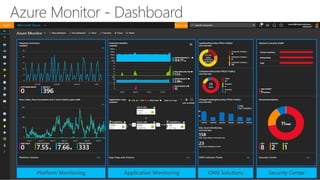
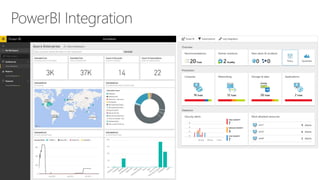
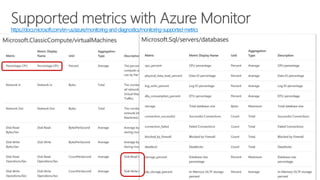
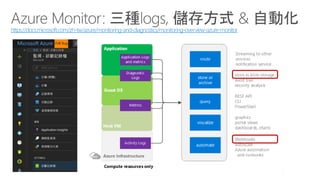
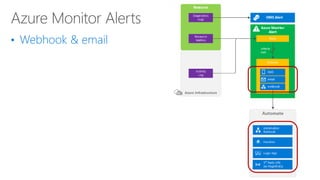
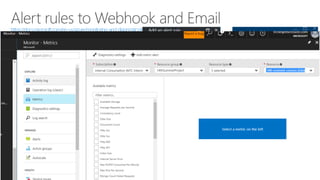
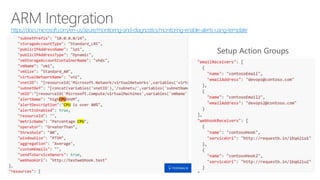
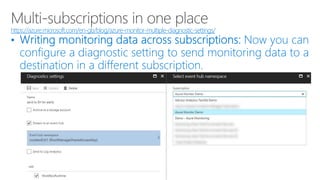
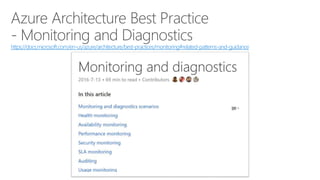
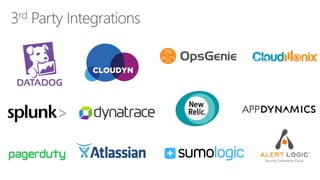


The document discusses Azure Monitor and its built-in monitoring capabilities for Azure resources. It provides out-of-the-box metrics and logs with alert rules to get notified and take automated actions. It allows for platform and application monitoring from a single dashboard view with APIs for third party integration. Links are provided for documentation on supported metrics, monitoring overview, enabling alerts using templates, and best practices for monitoring.