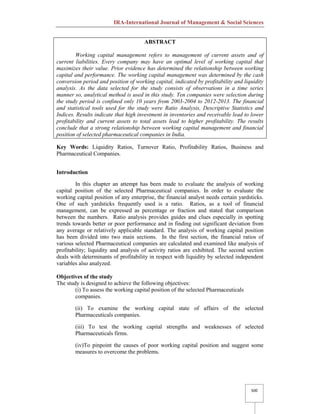
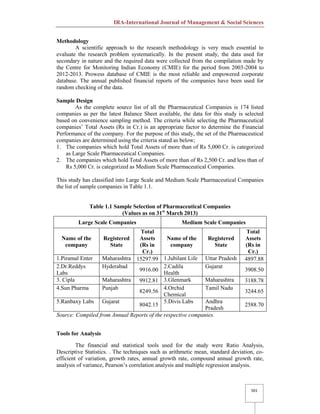
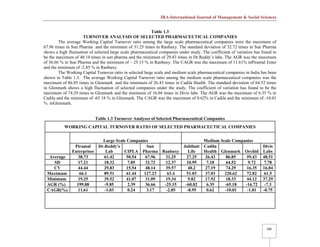
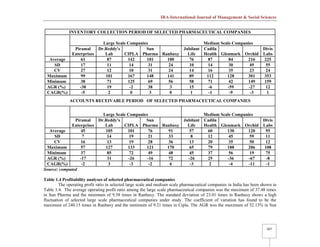
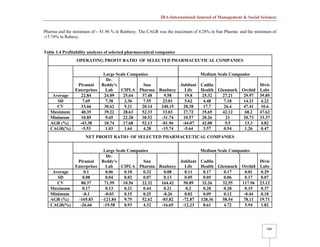
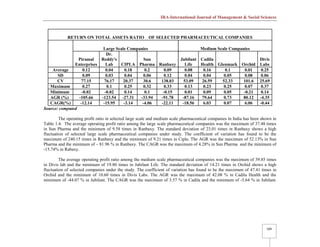
SlideShare a Scribd company logo
1 of 13
Download to read offline
499
IRA-International Journal of Management &
Social Sciences
ISSN 2455-2267; Vol.03, Issue 03 (2016)
Institute of Research Advances
http://research-advances.org/index.php/RAJMSS
A Comparitive Study on Working Capital
Management of Selected Pharmaceutical
Companies in India
Dr. M. Viswanathan
Principal (I/C) and Head, Department of Commerce,
Karuppannan Mariappan College, Muthur-638105, India.
Dr. A. Palanisamy
Assistant Professor, Department of Commerce (CA),
Karuppannan Mariappan College, Muthur-638105, India.
Mr. R. Mahesh
Assistant Professor, Department of Commerce (CA),
Karuppannan Mariappan College, Muthur-638105, India.
DOI: http://dx.doi.org/10.21013/jmss.v3.n3.p11
How to cite this paper:
Viswanathan, D., Palanisamy, D., & Mahesh, R. (2016). A Comparitive Study on
Working Capital Management of Selected Pharmaceutical Companies in India. IRA-
International Journal of Management & Social Sciences (ISSN 2455-2267), 3(3).
doi:http://dx.doi.org/10.21013/jmss.v3.n3.p11
© Institute of Research Advances
This works is licensed under a Creative Commons Attribution-Non Commercial 4.0
International License subject to proper citation to the publication source of the work.
Disclaimer: The scholarly papers as reviewed and published by the Institute of Research
Advances (IRA) are the views and opinions of their respective authors and are not the
views or opinions of the IRA. The IRA disclaims of any harm or loss caused due to the
published content to any party.
IRA-International Journal of Management & Social Sciences
500
ABSTRACT
Working capital management refers to management of current assets and of
current liabilities. Every company may have an optimal level of working capital that
maximizes their value. Prior evidence has determined the relationship between working
capital and performance. The working capital management was determined by the cash
conversion period and position of working capital, indicated by profitability and liquidity
analysis. As the data selected for the study consists of observations in a time series
manner so, analytical method is used in this study. Ten companies were selection during
the study period is confined only 10 years from 2003-2004 to 2012-2013. The financial
and statistical tools used for the study were Ratio Analysis, Descriptive Statistics and
Indices. Results indicate that high investment in inventories and receivable lead to lower
profitability and current assets to total assets lead to higher profitability. The results
conclude that a strong relationship between working capital management and financial
position of selected pharmaceutical companies in India.
Key Words: Liquidity Ratios, Turnover Ratio, Profitability Ratios, Business and
Pharmaceutical Companies.
Introduction
In this chapter an attempt has been made to evaluate the analysis of working
capital position of the selected Pharmaceutical companies. In order to evaluate the
working capital position of any enterprise, the financial analyst needs certain yardsticks.
One of such yardsticks frequently used is a ratio. Ratios, as a tool of financial
management, can be expressed as percentage or fraction and stated that comparison
between the numbers. Ratio analysis provides guides and clues especially in spotting
trends towards better or poor performance and in finding out significant deviation from
any average or relatively applicable standard. The analysis of working capital position
has been divided into two main sections. In the first section, the financial ratios of
various selected Pharmaceutical companies are calculated and examined like analysis of
profitability; liquidity and analysis of activity ratios are exhibited. The second section
deals with determinants of profitability in respect with liquidity by selected independent
variables also analyzed.
Objectives of the study
The study is designed to achieve the following objectives:
(i) To assess the working capital position of the selected Pharmaceuticals
companies.
(ii) To examine the working capital state of affairs of the selected
Pharmaceuticals companies.
(iii) To test the working capital strengths and weaknesses of selected
Pharmaceuticals firms.
(iv)To pinpoint the causes of poor working capital position and suggest some
measures to overcome the problems.
IRA-International Journal of Management & Social Sciences
501
Methodology
A scientific approach to the research methodology is very much essential to
evaluate the research problem systematically. In the present study, the data used for
secondary in nature and the required data were collected from the compilation made by
the Centre for Monitoring Indian Economy (CMIE) for the period from 2003-2004 to
2012-2013. Prowess database of CMIE is the most reliable and empowered corporate
database. The annual published financial reports of the companies have been used for
random checking of the data.
Sample Design
As the complete source list of all the Pharmaceutical Companies is 174 listed
companies as per the latest Balance Sheet available, the data for this study is selected
based on convenience sampling method. The criteria while selecting the Pharmaceutical
companies’ Total Assets (Rs in Cr.) is an appropriate factor to determine the Financial
Performance of the company. For the purpose of this study, the set of the Pharmaceutical
companies are determined using the criteria stated as below;
1. The companies which hold Total Assets of more than of Rs 5,000 Cr. is categorized
as Large Scale Pharmaceutical Companies.
2. The companies which hold Total Assets of more than of Rs 2,500 Cr. and less than of
Rs 5,000 Cr. is categorized as Medium Scale Pharmaceutical Companies.
This study has classified into Large Scale and Medium Scale Pharmaceutical Companies
the list of sample companies in Table 1.1.
Table 1.1 Sample Selection of Pharmaceutical Companies
(Values as on 31st
March 2013)
Large Scale Companies Medium Scale Companies
Name of the
company
Registered
State
Total
Assets
(Rs in
Cr.)
Name of the
company
Registered
State
Total
Assets
(Rs in
Cr.)
1.Piramal Enter Maharashtra 15297.99 1.Jubilant Life Uttar Pradesh 4897.88
2.Dr.Reddys
Labs
Hyderabad
9916.00
2.Cadila
Health
Gujarat
3908.50
3. Cipla Maharashtra 9912.81 3.Glenmark Maharashtra 3188.78
4.Sun Pharma Punjab
8249.56
4.Orchid
Chemical
Tamil Nadu
3244.65
5.Ranbaxy Labs Gujarat
8042.15
5.Divis Labs Andhra
Pradesh
2588.70
Source: Compiled from Annual Reports of the respective companies.
Tools for Analysis
The financial and statistical tools used for the study were Ratio Analysis,
Descriptive Statistics. . The techniques such as arithmetic mean, standard deviation, co-
efficient of variation, growth rates, annual growth rate, compound annual growth rate,
analysis of variance, Pearson’s correlation analysis and multiple regression analysis.
IRA-International Journal of Management & Social Sciences
502
Period of the Study
The study covers a period of ten years from the financial year 2003-2004 to
2012-2013.
Limitation of the study
1. The study is restricted and limited to sample size of 10 selected pharmaceutical
companies in India.
2. The effect of inflation has not been considered in the present study.
3. The result of analysis is subject to the same constraints as are applicable to
statistical tool.
4. The study period is confined only 10 years from 2003-2004 to 2012-2013.
Review of literature
Mobeen Ur Rehman and Naveed Anjum(2013)1
empirically examine the
effects of working capital management on the profitability of Pakistan cement
industry. Secondary Data was collected from Annual Reports and the sample size is
10 consisting of Pakistan cement Companies listed in KSE from 2003-2008. The
relationship between working capital management and profitability is examined using
statistical tools. The result accepts the hypothesis that there is a positive relationship
between working capital management and profitability on the cement sector of
Pakistan.
Gulshan Kumar (2013)2
in his study makes an effort to investigate growth
pattern and productivity trends of small-scale non-metallic mineral products industry
in Punjab. The growth of industry has been measured in terms of four variables
namely: number of units, fixed investment, direct employment and production.
Yearly growth rates have been computed to mirror year-to-year fluctuations in
growth and compound annual growth rates (CAGRs) have been worked out to find
the impact of the policies of liberalized regime on growth of this industry. The study
observed that the significant growth rate was observed in the variables namely
number of units, fixed investment and production. But the policies of liberalized
regime have resulted in qualitative rather than quantitative growth in the small scale
non-metallic minerals products industry in Punjab. Highly significant growth rate
was recorded in fixed investment and production, a slow growth was noticed in
number of units but insignificant growth was gauged in employment during the
liberalization period.
Muhammad FahadIftikhar (2013)3
his study was conducted to determine the
determinants of working capital management efficiency of automotive and
engineering firms listed in Karachi Stock Exchange of Pakistan. The Cash
1
Mobeen ur rehman,naveed anjum(2013), “determination of the impact of working
capital management on profitability” an empirical study from the cement sector in
pakistan asian economic and financial review,, 3(3):319- 332.
2
Dr.Gulshan Kumar Global (2013), “Journal of Science Frontier Research” Volume 11,
Issue 2, March 2012, pp: 99-120.
3
Muhammad FahadIftikhar, (2013)“Determinants of working capital management
efficiency: Case study of Pakistani automotive and engineering firms listed in Karachi
Stock Exchange”, Research Journal of Finance and Accounting, Vol.4, No.7, pp: 216-
236.
IRA-International Journal of Management & Social Sciences
503
Conversion Cycle, Days sales Inventory, Days Payable Outstanding and Days Sales
Outstanding are the explanatory variables. Whereas the descriptive statistics,
Pearson’s Bivariate correlation analysis and ordinary pooled least square with fixed
effect model were applied to investigate the significance of panel data set. It is
quarterly based and secondary data in nature that comprises of 9 firms for 5 years.
The observations were taken from financial years 2006 to 2010 of the listed firms. It
is concluded that to keep the working capital efficient cash conversion cycle must be
shortest. For this there is need of tight collection policy and liberal payment policy
while the inventory management must be efficient by reviewing the inventory policy.
It is concluded that it is also an efficient factor for efficient cash conversion cycle and
working capital management efficiency.
Theoretical Model Framework
The results of the selected companies financial ratios regarding to profitability,
liquidity and turnover ratios for the purpose to prove the hypothesis two-way ANOVA
has been applied for the following null hypothesis:
Ho: There is no significant difference between the selected ratios, among the
selected companies and between years.
IRA-International Journal of Management & Social Sciences
504
Table 1.2
LIQUIDITY RATIO OF SELECTED PHARMACEUTICAL COMPANIES
Table 1.2 Liquidity Ratios of Selected Pharmaceutical Companies
CURRENT RATIO OF SELECTED PHARMACEUTICAL COMPANIES
Large Scale Companies Medium Scale Companies
Piramal
Enterprises
Dr.
Reddy's
Lab CIPLA
Sun
Pharma Ranbaxy
Jubilant
Life
Cadila
Health Glenmark Orchid
Divis
Labs
Average 2.44 3.2 3.1 4.25 1.69 1.91 2.11 5.02 2.63 3.07
SD 0.62 0.69 0.63 2.02 0.37 0.37 0.3 2.74 0.73 0.4
CV 25.41 21.63 20.23 47.61 21.68 19.45 14.05 54.49 27.66 13.12
Maximum 3.4 3.91 3.72 7.92 2.19 2.46 2.58 8.88 3.64 3.76
Minimum 1.43 2.15 2.11 2.57 1.21 1.23 1.79 1.56 1.78 2.56
AGR (%) 52.96 -14.11 72.95 -2.22 -38.21 -47.51 3.58 -55.19 -20.22 -12.12
CAGR(%) 4.34 -1.51 5.63 -0.22 -4.7 -6.24 0.35 -7.71 -2.23 -1.28
QUICK RATIO OF SELECTED PHARMACEUTICAL COMPANIES
Large Scale Companies Medium Scale Companies
Piramal
Enterprises
Dr.
Reddy's
Lab CIPLA
Sun
Pharma Ranbaxy
Jubilant
Life
Cadila
Health Glenmark Orchid
Divis
Labs
Average 2.44 3.2 3.1 4.25 1.69 1.91 2.11 5.02 2.63 3.07
SD 0.62 0.69 0.63 2.02 0.37 0.37 0.3 2.74 0.73 0.4
CV 25.41 21.63 20.23 47.61 21.68 19.45 14.05 54.49 27.66 13.12
Maximum 3.4 3.91 3.72 7.92 2.19 2.46 2.58 8.88 3.64 3.76
Minimum 1.43 2.15 2.11 2.57 1.21 1.23 1.79 1.56 1.78 2.56
AGR (%) 52.96 -14.11 72.95 -2.22 -38.21 -47.51 3.58 -55.19 -20.22 -12.12
CAGR(%) 4.34 -1.51 5.63 -0.22 -4.7 -6.24 0.35 -7.71 -2.23 -1.28
IRA-International Journal of Management & Social Sciences
505
DEBT-EQUITY RATIO OF SELECTED PHARMACEUTICAL COMPANIES
Large Scale Companies Medium Scale Companies
Piramal
Enterprises
Dr.Reddy's
Lab CIPLA
Sun
Pharma Ranbaxy
Jubilant
Life
Cadila
Health Glenmark Orchid
Divis
Labs
Average 0.43 0.17 0.11 0.37 1.06 1.36 0.59 0.92 2.18 0.15
SD 0.26 0.12 0.08 0.58 0.84 0.44 0.2 0.75 0.85 0.15
CV 61.3 67.87 75.55 158.28 78.78 32.7 33.24 82.3 38.91 105.32
Maximum 0.82 0.41 0.24 1.64 2.5 1.99 0.96 2.29 3.87 0.44
Minimum 0.02 0.03 0 0 0.01 0.74 0.27 0.22 1.31 0.01
AGR (%) -41.96 84.64 -34.63 -62.55 168.69 -24.26 -47.53 -52.91 12.58 -95.5
CAGR(%) -5.3 2.52 -4.16 -9.36 6.7 -2.74 -6.25 -7.25 1.19 -26.66
Source: computed
The current ratio in selected large scale and medium scale pharmaceutical companies in India has been shown in Table
1.2.The average current ratio among the large scale pharmaceutical companies was the maximum of 4.25 times in sun pharma and
the minimum of 1.69 times in Ranbaxy. The standard deviation of 2.02 times in sun pharma shows a high fluctuation of selected
large scale pharmaceutical companies under study
The coefficient of variation has found to be the maximum of 47.61 times in sun pharma and the minimum of 20.23 times
in cipla. The AGR was the maximum of 72.95% in cipla and the minimum of -38.21 % in Ranbaxy. The CAGR was the
maximum of 5.63% in CIPLA and the minimum of -4.70% in Ranbaxy.
The average current ratio among the medium scale pharmaceutical companies was the maximum of 5.02 times in
Glenmark and the minimum of 1.91 times in Jubiliant life. The standard deviation of 2.74 times in Glenmark shows a high
fluctuation of selected companies under the study. The coefficient of variation has found to be the maximum of 54.49 times in
Glenmark and the minimum of 13.12 times in Divis labs. The AGR was the maximum of 12.12% in Divis Labs and the minimum
of -55.19% in Glenmark. The CAGR was the maximum of 0.35% in Cadila health and the minimum of -7.71% in Glenmark.
IRA-International Journal of Management & Social Sciences
506
Table 1.3
TURNOVER ANALYSIS OF SELECTED PHARMACEUTICAL COMPANIES
The average Working Capital Turnover ratio among the large scale pharmaceutical companies were the maximum of
67.96 times in Sun Pharma and the minimum of 31.25 times in Ranbaxy. The standard deviation of 32.72 times in Sun Pharma
shows a high fluctuation of selected large scale pharmaceutical companies under study. The coefficient of variation has found to
be the maximum of 48.14 times in sun pharma and the minimum of 29.83 times in Dr.Reddy’s labs. The AGR was the maximum
of 36.66 % in Sun Pharma and the minimum of – 25.15 % in Ranbaxy. The CAGR was the maximum of 11.61% inPiramal Enter
and the minimum of -2.85 % in Ranbaxy.
The Working Capital Turnover ratio in selected large scale and medium scale pharmaceutical companies in India has been
shown in Table 1.3. The average Working Capital Turnover ratio among the medium scale pharmaceutical companies was the
maximum of 86.85 times in Glenmark and the minimum of 26.43 times in Cadila Health. The standard deviation of 64.52 times
in Glenmark shows a high fluctuation of selected companies under the study. The coefficient of variation has found to be the
maximum of 74.29 times in Glenmark and the minimum of 16.04 times in Divis labs. The AGR was the maximum of 6.35 % in
Cadila and the minimum of -65.18 % in Glenmark. The CAGR was the maximum of 0.62% in Cadila and the minimum of -10.01
% inGlenmark.
Table 1.3 Turnover Analyses of Selected Pharmaceutical Companies
WORKING CAPITAL TURNOVER RATIO OF SELECTED PHARMACEUTICAL COMPANIES
Large Scale Companies Medium Scale Companies
Piramal
Enterprises
Dr.Reddy's
Lab CIPLA
Sun
Pharma Ranbaxy
Jubilant
Life
Cadila
Health Glenmark Orchid
Divis
Labs
Average 38.73 61.42 50.54 67.96 31.25 27.25 26.43 86.85 59.43 48.51
SD 17.21 18.32 7.85 32.72 12.37 10.95 7.18 64.52 9.72 7.78
CV 44.44 29.83 15.54 48.14 39.57 40.2 27.19 74.29 16.35 16.04
Maximum 66.1 89.51 61.44 127.23 63.4 51.03 37.03 220.62 72.82 61.5
Minimum 19.25 39.52 41.07 31.09 19.34 9.82 17.92 18.33 44.12 37.29
AGR (%) 199.88 -9.85 2.39 36.66 -25.15 -60.82 6.35 -65.18 -16.72 -7.3
CAGR(%) 11.61 -1.03 0.24 3.17 -2.85 -8.95 0.62 -10.01 -1.81 -0.75
IRA-International Journal of Management & Social Sciences
507
INVENTORY COLLECTION PERIOD OF SELECTED PHARMACEUTICAL COMPANIES
Large Scale Companies Medium Scale Companies
Piramal
Enterprises
Dr.Reddy's
Lab CIPLA
Sun
Pharma Ranbaxy
Jubilant
Life
Cadila
Health Glenmark Orchid
Divis
Labs
Average 61 87 142 101 100 76 87 84 216 225
SD 17 11 14 31 24 10 14 30 49 55
CV 27 12 10 31 24 14 16 35 23 24
Maximum 99 101 167 148 141 89 112 128 301 353
Minimum 38 71 125 69 56 58 71 42 149 159
AGR (%) -38 19 -2 38 3 15 -6 -59 -27 12
CAGR(%) -5 2 0 3 0 1 -1 -9 -3 1
ACCOUNTS RECEIVABLE PERIOD OF SELECTED PHARMACEUTICAL COMPANIES
Large Scale Companies Medium Scale Companies
Piramal
Enterprises
Dr.Reddy's
Lab CIPLA
Sun
Pharma Ranbaxy
Jubilant
Life
Cadila
Health Glenmark Orchid
Divis
Labs
Average 45 105 101 76 91 57 60 130 120 95
SD 7 14 19 21 33 8 12 45 59 11
CV 16 13 19 28 36 13 20 35 50 12
Maximum 57 127 133 121 170 65 79 188 206 108
Minimum 37 85 72 49 48 45 37 56 19 75
AGR (%) -17 31 -26 -16 72 -26 25 -36 -67 -8
CAGR(%) -2 3 -3 -2 6 -3 2 -4 -11 -1
Source: computed
Table 1.4 Profitability analyses of selected pharmaceutical companies
The operating profit ratio in selected large scale and medium scale pharmaceutical companies in India has been shown in
Table 1.4. The average operating profit ratio among the large scale pharmaceutical companies was the maximum of 37.48 times
in Sun Pharma and the minimum of 9.58 times in Ranbaxy. The standard deviation of 23.01 times in Ranbaxy shows a high
fluctuation of selected large scale pharmaceutical companies under study. The coefficient of variation has found to be the
maximum of 240.15 times in Ranbaxy and the minimum of 9.21 times in Cipla. The AGR was the maximum of 52.13% in Sun
IRA-International Journal of Management & Social Sciences
508
Pharma and the minimum of – 81.96 % in Ranbaxy. The CAGR was the maximum of 4.28% in Sun Pharma and the minimum of
-15.74% in Rabaxy.
Table 1.4 Profitability analyses of selected pharmaceutical companies
OPERATING PROFIT RATIO OF SELECTED PHARMACEUTICAL COMPANIES
Large Scale Companies Medium Scale Companies
Piramal
Enterprises
Dr.
Reddy's
Lab CIPLA
Sun
Pharma Ranbaxy
Jubilant
Life
Cadila
Health Glenmark Orchid
Divis
Labs
Average 22.84 24.09 25.64 37.48 9.58 19.8 25.32 27.21 29.97 39.85
SD 7.69 7.38 2.36 7.55 23.01 5.62 4.48 7.18 14.21 4.22
CV 33.66 30.62 9.21 20.14 240.15 28.38 17.7 26.4 47.41 10.6
Maximum 40.35 39.22 28.63 52.33 33.03 27.72 35.65 42.12 68.2 47.62
Minimum 10.85 9.65 22.28 30.52 -31.74 10.57 20.26 21 20.73 33.37
AGR (%) -43.38 10.74 17.68 52.13 -81.96 -44.07 42.08 5.5 13.3 4.82
CAGR(%) -5.53 1.03 1.64 4.28 -15.74 -5.64 3.57 0.54 1.26 0.47
NET PROFIT RATIO OF SELECTED PHARMACEUTICAL COMPANIES
Large Scale Companies Medium Scale Companies
Piramal
Enterprises
Dr.
Reddy's
Lab CIPLA
Sun
Pharma Ranbaxy
Jubilant
Life
Cadila
Health Glenmark Orchid
Divis
Labs
Average 0.1 0.06 0.18 0.32 0.08 0.11 0.17 0.17 0.01 0.29
SD 0.08 0.04 0.02 0.07 0.13 0.05 0.05 0.06 0.17 0.07
CV 80.37 71.59 10.56 22.32 164.42 50.89 32.26 32.55 117.96 23.12
Maximum 0.17 0.13 0.21 0.44 0.21 0.2 0.28 0.28 0.15 0.37
Minimum -0.1 -0.03 0.15 0.25 -0.26 0.02 0.09 0.12 -0.44 0.18
AGR (%) -165.83 -121.84 9.75 52.62 -83.82 -72.87 128.36 58.54 78.11 19.71
CAGR(%) -26.66 -19.58 0.93 4.32 -16.65 -12.23 8.61 4.72 5.94 1.82
IRA-International Journal of Management & Social Sciences
509
RETURN ON TOTAL ASSETS RATIO OF SELECTED PHARMACEUTICAL COMPANIES
Large Scale Companies Medium Scale Companies
Piramal
Enterprises
Dr.
Reddy's
Lab CIPLA
Sun
Pharma Ranbaxy
Jubilant
Life
Cadila
Health Glenmark Orchid
Divis
Labs
Average 0.12 0.04 0.18 0.2 0.09 0.08 0.16 0.1 0.01 0.25
SD 0.09 0.03 0.04 0.06 0.12 0.04 0.04 0.05 0.08 0.06
CV 77.15 76.17 20.37 30.6 138.03 53.09 26.59 52.33 101.6 25.69
Maximum 0.27 0.1 0.25 0.32 0.33 0.13 0.23 0.25 0.07 0.37
Minimum -0.02 -0.02 0.14 0.1 -0.15 0.01 0.09 0.05 -0.21 0.14
AGR (%) -105.66 -123.54 -27.31 -33.94 -91.78 -87.16 79.64 0.73 80.12 -4.35
CAGR(%) -12.14 -15.95 -3.14 -4.06 -22.11 -18.56 6.03 0.07 6.06 -0.44
Source: computed
The operating profit ratio in selected large scale and medium scale pharmaceutical companies in India has been shown in
Table 1.4. The average operating profit ratio among the large scale pharmaceutical companies was the maximum of 37.48 times
in Sun Pharma and the minimum of 9.58 times in Ranbaxy. The standard deviation of 23.01 times in Ranbaxy shows a high
fluctuation of selected large scale pharmaceutical companies under study. The coefficient of variation has found to be the
maximum of 240.15 times in Ranbaxy and the minimum of 9.21 times in Cipla. The AGR was the maximum of 52.13% in Sun
Pharma and the minimum of – 81.96 % in Ranbaxy. The CAGR was the maximum of 4.28% in Sun Pharma and the minimum of
-15.74% in Rabaxy.
The average operating profit ratio among the medium scale pharmaceutical companies was the maximum of 39.85 times
in Divis lab and the minimum of 19.80 times in Jubilant Life. The standard deviation of 14.21 times in Orchid shows a high
fluctuation of selected companies under the study. The coefficient of variation has found to be the maximum of 47.41 times in
Orchid and the minimum of 10.60 times in Divis Labs. The AGR was the maximum of 42.08 % in Cadila Health and the
minimum of -44.07 % in Jubilant. The CAGR was the maximum of 3.57 % in Cadila and the minimum of -5.64 % in Jubilant.
IRA-International Journal of Management & Social Sciences
510
Suggestion and Recommendation
Selected pharmaceutical companies should improve its current ratio above 2. To
improve the current ratio the companies should increase their current assets or decrease
their current liabilities. Sufficient quick ratio is maintained by all companies in large
scale and medium scale. They should maintain the same in the years to come. Selected
companies should increase their borrowing with minimum interest. It uses trading on
equity technique to increase wealth of equity shareholders. Working capital is a base for
day-to-day operation of business. Companies having low working capital should increase
their current assets, for interrupted production. Very high working capital also leads high
liquidity but low profitability. So companies should maintain moderate working capital
ratio, which leads to high liquidity and profitability. Number of days required to convert
inventory into cash is known as inventory collection period. Higher number of days
indicates that the company has poor inventory management system. Companies who have
highest collection period should concentrate on its inventory management technique, to
reduce number of days of inventory collection and then only they can increase their
profitability and maintain required working capital. Number of days required to collect
cash from debtors is calculated by account receivable period. Companies who have
higher days to collect cash from debtors fail to increase their profitability, fail to maintain
adequate working capital. So they should follow proper collection technique and increase
their liquidity position. Number of days required to pay creditors is calculated by
accounts payable period. Companies who have minimum number of days to pay its
suppliers, will increase the number of days by means of opting suitable buyer will lead to
increase profitability and minimize working capital requirements. Operating cycle period
is a period from selling inventories to collecting cash. Minimum number of days of
operating cycle indicates that the company has quickly converted its stock into cash. The
companies of higher operating cycle period should follow necessary debt collecting
techniques to reduce number of days for collecting money from debtors. Companies have
highest cash turnover ratio shows that it has good profitability position. It can easily
maintain required cash level. So low cash turnover ratio companies should concentrate on
increasing cash receipts and delaying cash position as it possible. Companies, who have
lowest current asset turnover ratio implies that, they are the companies did not have sales
in a quick time. It will decrease the rate of profitability so companies should concentrate
to increase the sales. The companies should maintain minimum current liability to total
asset ratio. Highest current liability to total asset ratio indicates that the companies need
to maintain higher amount of working capital to maintain its short term solvency position.
It automatically reduces profitability of companies. Operating profit reveals operational
efficiency of business concern. Low operating ratio companies like Ranbaxy, should
concentrate on controlling their cost of sales and other operating expenses to revamp its
operating ratio. Every stakeholder of business is mainly focusing on net profit of
company. It will increase goodwill among the stakeholders. Minimum net profit
companies like Orchid, should reduce its operating and non-operating expenses and also
adopt proper marketing techniques to increase their sales and profit margin. Return Total
Assets Ratio is an indicator, how effectively assets are used to increase its profitability.
Low ratio indicates that assets are not efficiently used in business so the companies
should plan properly and effectively use the idle assets to increase profitability.
Conclusions
The study has analyzed the working capital position of selected
pharmaceutical companies in India was satisfactory. It can be concluded that the
pharmaceutical companies have good liquidity position; their ratios were normally higher
IRA-International Journal of Management & Social Sciences
511
than ideal ratio. So they can easily meet their short term liabilities and working capital
requirement. Secondly solvency position of the pharmaceutical companies were not
satisfactory, it would suffer their long term borrowing. So they should improve their debt
equity ratio. Conversion periods of working capital components were also longer period
of time. It would affect the profitability of companies. So they should reduce their
conversion period of for working capital components. So the selected pharmaceutical
companies should control their cost of sales and other operating expenses to increase
their profitability.
Reference:
1. Mobeen ur rehman,naveed anjum(2013), “determination of the impact of
working capital management on profitability” an empirical study from the
cement sector in pakistan asian economic and financial review,, 3(3):319- 332.
2. Dr.Gulshan Kumar Global (2013), “Journal of Science Frontier Research”
Volume 11, Issue 2, March 2012, pp: 99-120.
3. Muhammad FahadIftikhar, (2013)“Determinants of working capital management
efficiency: Case study of Pakistani automotive and engineering firms listed in
Karachi Stock Exchange”, Research Journal of Finance and Accounting, Vol.4,
No.7, pp: 216-236.

More Related Content

Similar to 222-424-1-PB.pdf

Ayaz Defence Presentation -1.pptx
Ayaz Defence Presentation -1.pptxAyaz Defence Presentation -1.pptx
Ayaz Defence Presentation -1.pptxfayyazali20
 
Interfirm comparison on select private banking companies in india
Interfirm comparison on select private banking companies in indiaInterfirm comparison on select private banking companies in india
Interfirm comparison on select private banking companies in indiaIAEME Publication
 
FUNDAMENTAL ANALYSIS WITH SPECIAL REFERENCE TO PHARMACEUTICAL COMPANIES LISTE...
FUNDAMENTAL ANALYSIS WITH SPECIAL REFERENCE TO PHARMACEUTICAL COMPANIES LISTE...FUNDAMENTAL ANALYSIS WITH SPECIAL REFERENCE TO PHARMACEUTICAL COMPANIES LISTE...
FUNDAMENTAL ANALYSIS WITH SPECIAL REFERENCE TO PHARMACEUTICAL COMPANIES LISTE...IAEME Publication
 
A study to measures the financial health of
A study to measures the financial health ofA study to measures the financial health of
A study to measures the financial health ofAlexander Decker
 
A study to measures the financial health of
A study to measures the financial health ofA study to measures the financial health of
A study to measures the financial health ofAlexander Decker
 
A_study_on_financial_performance_analysi-48499831.pdf
A_study_on_financial_performance_analysi-48499831.pdfA_study_on_financial_performance_analysi-48499831.pdf
A_study_on_financial_performance_analysi-48499831.pdfblessing339324
 
Effect of Corporate Governance Committees and Financial Performance of Health...
Effect of Corporate Governance Committees and Financial Performance of Health...Effect of Corporate Governance Committees and Financial Performance of Health...
Effect of Corporate Governance Committees and Financial Performance of Health...ijtsrd
 
VALUE ADDED REPORTING
VALUE ADDED REPORTINGVALUE ADDED REPORTING
VALUE ADDED REPORTINGMo
 
E3103236
E3103236E3103236
E3103236aijbm
 
The effect of firm specific characteristics on segment information disclosure...
The effect of firm specific characteristics on segment information disclosure...The effect of firm specific characteristics on segment information disclosure...
The effect of firm specific characteristics on segment information disclosure...IAEME Publication
 
A Study of Performance Appraisal and Dimensions of Organizational climate in ...
A Study of Performance Appraisal and Dimensions of Organizational climate in ...A Study of Performance Appraisal and Dimensions of Organizational climate in ...
A Study of Performance Appraisal and Dimensions of Organizational climate in ...paperpublications3
 
project-report-on-working-capital
project-report-on-working-capitalproject-report-on-working-capital
project-report-on-working-capitalRamesh Ankathi
 
International Journal of Engineering Research and Development
International Journal of Engineering Research and DevelopmentInternational Journal of Engineering Research and Development
International Journal of Engineering Research and DevelopmentIJERD Editor
 
Idiosyncratic Effect of Corporate Solvency Management Strategies on Corporate...
Idiosyncratic Effect of Corporate Solvency Management Strategies on Corporate...Idiosyncratic Effect of Corporate Solvency Management Strategies on Corporate...
Idiosyncratic Effect of Corporate Solvency Management Strategies on Corporate...IOSR Journals
 
PMS LR -Bhakti.docx
PMS LR -Bhakti.docxPMS LR -Bhakti.docx
PMS LR -Bhakti.docxBhaktiChanchal1
 
H2125963
H2125963H2125963
H2125963aijbm
 
Effect of Supply Chain Management Practices on Organizational Performance of ...
Effect of Supply Chain Management Practices on Organizational Performance of ...Effect of Supply Chain Management Practices on Organizational Performance of ...
Effect of Supply Chain Management Practices on Organizational Performance of ...AJHSSR Journal
 
Competitive Profile Matrix of Selected Drug Stores at Jaen, Nueva Ecija, Phil...
Competitive Profile Matrix of Selected Drug Stores at Jaen, Nueva Ecija, Phil...Competitive Profile Matrix of Selected Drug Stores at Jaen, Nueva Ecija, Phil...
Competitive Profile Matrix of Selected Drug Stores at Jaen, Nueva Ecija, Phil...IJAEMSJORNAL
 

Similar to 222-424-1-PB.pdf (20)

Ayaz Defence Presentation -1.pptx
Ayaz Defence Presentation -1.pptxAyaz Defence Presentation -1.pptx
Ayaz Defence Presentation -1.pptx
 
Interfirm comparison on select private banking companies in india
Interfirm comparison on select private banking companies in indiaInterfirm comparison on select private banking companies in india
Interfirm comparison on select private banking companies in india
 
FUNDAMENTAL ANALYSIS WITH SPECIAL REFERENCE TO PHARMACEUTICAL COMPANIES LISTE...
FUNDAMENTAL ANALYSIS WITH SPECIAL REFERENCE TO PHARMACEUTICAL COMPANIES LISTE...FUNDAMENTAL ANALYSIS WITH SPECIAL REFERENCE TO PHARMACEUTICAL COMPANIES LISTE...
FUNDAMENTAL ANALYSIS WITH SPECIAL REFERENCE TO PHARMACEUTICAL COMPANIES LISTE...
 
A study to measures the financial health of
A study to measures the financial health ofA study to measures the financial health of
A study to measures the financial health of
 
A study to measures the financial health of
A study to measures the financial health ofA study to measures the financial health of
A study to measures the financial health of
 
A_study_on_financial_performance_analysi-48499831.pdf
A_study_on_financial_performance_analysi-48499831.pdfA_study_on_financial_performance_analysi-48499831.pdf
A_study_on_financial_performance_analysi-48499831.pdf
 
Effect of Corporate Governance Committees and Financial Performance of Health...
Effect of Corporate Governance Committees and Financial Performance of Health...Effect of Corporate Governance Committees and Financial Performance of Health...
Effect of Corporate Governance Committees and Financial Performance of Health...
 
Paper 4 (ali mansouri)
Paper 4 (ali mansouri)Paper 4 (ali mansouri)
Paper 4 (ali mansouri)
 
VALUE ADDED REPORTING
VALUE ADDED REPORTINGVALUE ADDED REPORTING
VALUE ADDED REPORTING
 
Literature Review on Performance Management System
Literature Review on Performance Management SystemLiterature Review on Performance Management System
Literature Review on Performance Management System
 
E3103236
E3103236E3103236
E3103236
 
The effect of firm specific characteristics on segment information disclosure...
The effect of firm specific characteristics on segment information disclosure...The effect of firm specific characteristics on segment information disclosure...
The effect of firm specific characteristics on segment information disclosure...
 
A Study of Performance Appraisal and Dimensions of Organizational climate in ...
A Study of Performance Appraisal and Dimensions of Organizational climate in ...A Study of Performance Appraisal and Dimensions of Organizational climate in ...
A Study of Performance Appraisal and Dimensions of Organizational climate in ...
 
project-report-on-working-capital
project-report-on-working-capitalproject-report-on-working-capital
project-report-on-working-capital
 
International Journal of Engineering Research and Development
International Journal of Engineering Research and DevelopmentInternational Journal of Engineering Research and Development
International Journal of Engineering Research and Development
 
Idiosyncratic Effect of Corporate Solvency Management Strategies on Corporate...
Idiosyncratic Effect of Corporate Solvency Management Strategies on Corporate...Idiosyncratic Effect of Corporate Solvency Management Strategies on Corporate...
Idiosyncratic Effect of Corporate Solvency Management Strategies on Corporate...
 
PMS LR -Bhakti.docx
PMS LR -Bhakti.docxPMS LR -Bhakti.docx
PMS LR -Bhakti.docx
 
H2125963
H2125963H2125963
H2125963
 
Effect of Supply Chain Management Practices on Organizational Performance of ...
Effect of Supply Chain Management Practices on Organizational Performance of ...Effect of Supply Chain Management Practices on Organizational Performance of ...
Effect of Supply Chain Management Practices on Organizational Performance of ...
 
Competitive Profile Matrix of Selected Drug Stores at Jaen, Nueva Ecija, Phil...
Competitive Profile Matrix of Selected Drug Stores at Jaen, Nueva Ecija, Phil...Competitive Profile Matrix of Selected Drug Stores at Jaen, Nueva Ecija, Phil...
Competitive Profile Matrix of Selected Drug Stores at Jaen, Nueva Ecija, Phil...
 

More from AnupamaKumari63

Natural Law Theory and the Is--Ought Problem_ A Critique of F.pdf
Natural Law Theory and the Is--Ought Problem_ A Critique of F.pdfNatural Law Theory and the Is--Ought Problem_ A Critique of F.pdf
Natural Law Theory and the Is--Ought Problem_ A Critique of F.pdfAnupamaKumari63
 
Environmental Pollution and Common Law Remedies.pdf
Environmental Pollution and Common Law Remedies.pdfEnvironmental Pollution and Common Law Remedies.pdf
Environmental Pollution and Common Law Remedies.pdfAnupamaKumari63
 
NewSyllabus_ddd28f5e-2274-4a78-a982-db501e2c8c8d (1).pdf
NewSyllabus_ddd28f5e-2274-4a78-a982-db501e2c8c8d (1).pdfNewSyllabus_ddd28f5e-2274-4a78-a982-db501e2c8c8d (1).pdf
NewSyllabus_ddd28f5e-2274-4a78-a982-db501e2c8c8d (1).pdfAnupamaKumari63
 
FIBA 211 internal questions.docx
FIBA 211 internal questions.docxFIBA 211 internal questions.docx
FIBA 211 internal questions.docxAnupamaKumari63
 
Rights and DUTIES of partner.docx
Rights and DUTIES of partner.docxRights and DUTIES of partner.docx
Rights and DUTIES of partner.docxAnupamaKumari63
 
Working capital management practiced in pharmaceutical companied.pdf
Working capital management practiced in pharmaceutical companied.pdfWorking capital management practiced in pharmaceutical companied.pdf
Working capital management practiced in pharmaceutical companied.pdfAnupamaKumari63
 
civil and criminal remedies for protection of environment.docx
civil and criminal remedies for protection of environment.docxcivil and criminal remedies for protection of environment.docx
civil and criminal remedies for protection of environment.docxAnupamaKumari63
 

More from AnupamaKumari63 (7)

Natural Law Theory and the Is--Ought Problem_ A Critique of F.pdf
Natural Law Theory and the Is--Ought Problem_ A Critique of F.pdfNatural Law Theory and the Is--Ought Problem_ A Critique of F.pdf
Natural Law Theory and the Is--Ought Problem_ A Critique of F.pdf
 
Environmental Pollution and Common Law Remedies.pdf
Environmental Pollution and Common Law Remedies.pdfEnvironmental Pollution and Common Law Remedies.pdf
Environmental Pollution and Common Law Remedies.pdf
 
NewSyllabus_ddd28f5e-2274-4a78-a982-db501e2c8c8d (1).pdf
NewSyllabus_ddd28f5e-2274-4a78-a982-db501e2c8c8d (1).pdfNewSyllabus_ddd28f5e-2274-4a78-a982-db501e2c8c8d (1).pdf
NewSyllabus_ddd28f5e-2274-4a78-a982-db501e2c8c8d (1).pdf
 
FIBA 211 internal questions.docx
FIBA 211 internal questions.docxFIBA 211 internal questions.docx
FIBA 211 internal questions.docx
 
Rights and DUTIES of partner.docx
Rights and DUTIES of partner.docxRights and DUTIES of partner.docx
Rights and DUTIES of partner.docx
 
Working capital management practiced in pharmaceutical companied.pdf
Working capital management practiced in pharmaceutical companied.pdfWorking capital management practiced in pharmaceutical companied.pdf
Working capital management practiced in pharmaceutical companied.pdf
 
civil and criminal remedies for protection of environment.docx
civil and criminal remedies for protection of environment.docxcivil and criminal remedies for protection of environment.docx
civil and criminal remedies for protection of environment.docx
 

Recently uploaded

High Class Call Girls Nagpur Grishma Call 7001035870 Meet With Nagpur Escorts
High Class Call Girls Nagpur Grishma Call 7001035870 Meet With Nagpur EscortsHigh Class Call Girls Nagpur Grishma Call 7001035870 Meet With Nagpur Escorts
High Class Call Girls Nagpur Grishma Call 7001035870 Meet With Nagpur Escortsranjana rawat
 
The Economic History of the U.S. Lecture 18.pdf
The Economic History of the U.S. Lecture 18.pdfThe Economic History of the U.S. Lecture 18.pdf
The Economic History of the U.S. Lecture 18.pdfGale Pooley
 
Call US đź“ž 9892124323 âś… Kurla Call Girls In Kurla ( Mumbai ) secure service
Call US đź“ž 9892124323 âś… Kurla Call Girls In Kurla ( Mumbai ) secure serviceCall US đź“ž 9892124323 âś… Kurla Call Girls In Kurla ( Mumbai ) secure service
Call US đź“ž 9892124323 âś… Kurla Call Girls In Kurla ( Mumbai ) secure servicePooja Nehwal
 
Vip Call US đź“ž 7738631006 âś…Call Girls In Sakinaka ( Mumbai )
Vip Call US đź“ž 7738631006 âś…Call Girls In Sakinaka ( Mumbai )Vip Call US đź“ž 7738631006 âś…Call Girls In Sakinaka ( Mumbai )
Vip Call US đź“ž 7738631006 âś…Call Girls In Sakinaka ( Mumbai )Pooja Nehwal
 
CALL ON ➥8923113531 🔝Call Girls Gomti Nagar Lucknow best sexual service
CALL ON ➥8923113531 🔝Call Girls Gomti Nagar Lucknow best sexual serviceCALL ON ➥8923113531 🔝Call Girls Gomti Nagar Lucknow best sexual service
CALL ON ➥8923113531 🔝Call Girls Gomti Nagar Lucknow best sexual serviceanilsa9823
 
03_Emmanuel Ndiaye_Degroof Petercam.pptx
03_Emmanuel Ndiaye_Degroof Petercam.pptx03_Emmanuel Ndiaye_Degroof Petercam.pptx
03_Emmanuel Ndiaye_Degroof Petercam.pptxFinTech Belgium
 
The Economic History of the U.S. Lecture 19.pdf
The Economic History of the U.S. Lecture 19.pdfThe Economic History of the U.S. Lecture 19.pdf
The Economic History of the U.S. Lecture 19.pdfGale Pooley
 
Dividend Policy and Dividend Decision Theories.pptx
Dividend Policy and Dividend Decision Theories.pptxDividend Policy and Dividend Decision Theories.pptx
Dividend Policy and Dividend Decision Theories.pptxanshikagoel52
 
VVIP Pune Call Girls Katraj (7001035870) Pune Escorts Nearby with Complete Sa...
VVIP Pune Call Girls Katraj (7001035870) Pune Escorts Nearby with Complete Sa...VVIP Pune Call Girls Katraj (7001035870) Pune Escorts Nearby with Complete Sa...
VVIP Pune Call Girls Katraj (7001035870) Pune Escorts Nearby with Complete Sa...Call Girls in Nagpur High Profile
 
Solution Manual for Financial Accounting, 11th Edition by Robert Libby, Patri...
Solution Manual for Financial Accounting, 11th Edition by Robert Libby, Patri...Solution Manual for Financial Accounting, 11th Edition by Robert Libby, Patri...
Solution Manual for Financial Accounting, 11th Edition by Robert Libby, Patri...ssifa0344
 
Stock Market Brief Deck (Under Pressure).pdf
Stock Market Brief Deck (Under Pressure).pdfStock Market Brief Deck (Under Pressure).pdf
Stock Market Brief Deck (Under Pressure).pdfMichael Silva
 
Best VIP Call Girls Noida Sector 18 Call Me: 8448380779
Best VIP Call Girls Noida Sector 18 Call Me: 8448380779Best VIP Call Girls Noida Sector 18 Call Me: 8448380779
Best VIP Call Girls Noida Sector 18 Call Me: 8448380779Delhi Call girls
 
Call Girls Koregaon Park Call Me 7737669865 Budget Friendly No Advance Booking
Call Girls Koregaon Park Call Me 7737669865 Budget Friendly No Advance BookingCall Girls Koregaon Park Call Me 7737669865 Budget Friendly No Advance Booking
Call Girls Koregaon Park Call Me 7737669865 Budget Friendly No Advance Bookingroncy bisnoi
 
WhatsApp đź“ž Call : 9892124323 âś…Call Girls In Chembur ( Mumbai ) secure service
WhatsApp đź“ž Call : 9892124323  âś…Call Girls In Chembur ( Mumbai ) secure serviceWhatsApp đź“ž Call : 9892124323  âś…Call Girls In Chembur ( Mumbai ) secure service
WhatsApp đź“ž Call : 9892124323 âś…Call Girls In Chembur ( Mumbai ) secure servicePooja Nehwal
 
(ANIKA) Budhwar Peth Call Girls Just Call 7001035870 [ Cash on Delivery ] Pun...
(ANIKA) Budhwar Peth Call Girls Just Call 7001035870 [ Cash on Delivery ] Pun...(ANIKA) Budhwar Peth Call Girls Just Call 7001035870 [ Cash on Delivery ] Pun...
(ANIKA) Budhwar Peth Call Girls Just Call 7001035870 [ Cash on Delivery ] Pun...ranjana rawat
 
Booking open Available Pune Call Girls Shivane 6297143586 Call Hot Indian Gi...
Booking open Available Pune Call Girls Shivane  6297143586 Call Hot Indian Gi...Booking open Available Pune Call Girls Shivane  6297143586 Call Hot Indian Gi...
Booking open Available Pune Call Girls Shivane 6297143586 Call Hot Indian Gi...Call Girls in Nagpur High Profile
 
02_Fabio Colombo_Accenture_MeetupDora&Cybersecurity.pptx
02_Fabio Colombo_Accenture_MeetupDora&Cybersecurity.pptx02_Fabio Colombo_Accenture_MeetupDora&Cybersecurity.pptx
02_Fabio Colombo_Accenture_MeetupDora&Cybersecurity.pptxFinTech Belgium
 
Instant Issue Debit Cards - High School Spirit
Instant Issue Debit Cards - High School SpiritInstant Issue Debit Cards - High School Spirit
Instant Issue Debit Cards - High School Spiritegoetzinger
 
TEST BANK For Corporate Finance, 13th Edition By Stephen Ross, Randolph Weste...
TEST BANK For Corporate Finance, 13th Edition By Stephen Ross, Randolph Weste...TEST BANK For Corporate Finance, 13th Edition By Stephen Ross, Randolph Weste...
TEST BANK For Corporate Finance, 13th Edition By Stephen Ross, Randolph Weste...ssifa0344
 

Recently uploaded (20)

High Class Call Girls Nagpur Grishma Call 7001035870 Meet With Nagpur Escorts
High Class Call Girls Nagpur Grishma Call 7001035870 Meet With Nagpur EscortsHigh Class Call Girls Nagpur Grishma Call 7001035870 Meet With Nagpur Escorts
High Class Call Girls Nagpur Grishma Call 7001035870 Meet With Nagpur Escorts
 
The Economic History of the U.S. Lecture 18.pdf
The Economic History of the U.S. Lecture 18.pdfThe Economic History of the U.S. Lecture 18.pdf
The Economic History of the U.S. Lecture 18.pdf
 
Call US đź“ž 9892124323 âś… Kurla Call Girls In Kurla ( Mumbai ) secure service
Call US đź“ž 9892124323 âś… Kurla Call Girls In Kurla ( Mumbai ) secure serviceCall US đź“ž 9892124323 âś… Kurla Call Girls In Kurla ( Mumbai ) secure service
Call US đź“ž 9892124323 âś… Kurla Call Girls In Kurla ( Mumbai ) secure service
 
Vip Call US đź“ž 7738631006 âś…Call Girls In Sakinaka ( Mumbai )
Vip Call US đź“ž 7738631006 âś…Call Girls In Sakinaka ( Mumbai )Vip Call US đź“ž 7738631006 âś…Call Girls In Sakinaka ( Mumbai )
Vip Call US đź“ž 7738631006 âś…Call Girls In Sakinaka ( Mumbai )
 
CALL ON ➥8923113531 🔝Call Girls Gomti Nagar Lucknow best sexual service
CALL ON ➥8923113531 🔝Call Girls Gomti Nagar Lucknow best sexual serviceCALL ON ➥8923113531 🔝Call Girls Gomti Nagar Lucknow best sexual service
CALL ON ➥8923113531 🔝Call Girls Gomti Nagar Lucknow best sexual service
 
03_Emmanuel Ndiaye_Degroof Petercam.pptx
03_Emmanuel Ndiaye_Degroof Petercam.pptx03_Emmanuel Ndiaye_Degroof Petercam.pptx
03_Emmanuel Ndiaye_Degroof Petercam.pptx
 
The Economic History of the U.S. Lecture 19.pdf
The Economic History of the U.S. Lecture 19.pdfThe Economic History of the U.S. Lecture 19.pdf
The Economic History of the U.S. Lecture 19.pdf
 
Dividend Policy and Dividend Decision Theories.pptx
Dividend Policy and Dividend Decision Theories.pptxDividend Policy and Dividend Decision Theories.pptx
Dividend Policy and Dividend Decision Theories.pptx
 
VVIP Pune Call Girls Katraj (7001035870) Pune Escorts Nearby with Complete Sa...
VVIP Pune Call Girls Katraj (7001035870) Pune Escorts Nearby with Complete Sa...VVIP Pune Call Girls Katraj (7001035870) Pune Escorts Nearby with Complete Sa...
VVIP Pune Call Girls Katraj (7001035870) Pune Escorts Nearby with Complete Sa...
 
Solution Manual for Financial Accounting, 11th Edition by Robert Libby, Patri...
Solution Manual for Financial Accounting, 11th Edition by Robert Libby, Patri...Solution Manual for Financial Accounting, 11th Edition by Robert Libby, Patri...
Solution Manual for Financial Accounting, 11th Edition by Robert Libby, Patri...
 
Stock Market Brief Deck (Under Pressure).pdf
Stock Market Brief Deck (Under Pressure).pdfStock Market Brief Deck (Under Pressure).pdf
Stock Market Brief Deck (Under Pressure).pdf
 
Best VIP Call Girls Noida Sector 18 Call Me: 8448380779
Best VIP Call Girls Noida Sector 18 Call Me: 8448380779Best VIP Call Girls Noida Sector 18 Call Me: 8448380779
Best VIP Call Girls Noida Sector 18 Call Me: 8448380779
 
Call Girls Koregaon Park Call Me 7737669865 Budget Friendly No Advance Booking
Call Girls Koregaon Park Call Me 7737669865 Budget Friendly No Advance BookingCall Girls Koregaon Park Call Me 7737669865 Budget Friendly No Advance Booking
Call Girls Koregaon Park Call Me 7737669865 Budget Friendly No Advance Booking
 
WhatsApp đź“ž Call : 9892124323 âś…Call Girls In Chembur ( Mumbai ) secure service
WhatsApp đź“ž Call : 9892124323  âś…Call Girls In Chembur ( Mumbai ) secure serviceWhatsApp đź“ž Call : 9892124323  âś…Call Girls In Chembur ( Mumbai ) secure service
WhatsApp đź“ž Call : 9892124323 âś…Call Girls In Chembur ( Mumbai ) secure service
 
(ANIKA) Budhwar Peth Call Girls Just Call 7001035870 [ Cash on Delivery ] Pun...
(ANIKA) Budhwar Peth Call Girls Just Call 7001035870 [ Cash on Delivery ] Pun...(ANIKA) Budhwar Peth Call Girls Just Call 7001035870 [ Cash on Delivery ] Pun...
(ANIKA) Budhwar Peth Call Girls Just Call 7001035870 [ Cash on Delivery ] Pun...
 
Booking open Available Pune Call Girls Shivane 6297143586 Call Hot Indian Gi...
Booking open Available Pune Call Girls Shivane  6297143586 Call Hot Indian Gi...Booking open Available Pune Call Girls Shivane  6297143586 Call Hot Indian Gi...
Booking open Available Pune Call Girls Shivane 6297143586 Call Hot Indian Gi...
 
Veritas Interim Report 1 January–31 March 2024
Veritas Interim Report 1 January–31 March 2024Veritas Interim Report 1 January–31 March 2024
Veritas Interim Report 1 January–31 March 2024
 
02_Fabio Colombo_Accenture_MeetupDora&Cybersecurity.pptx
02_Fabio Colombo_Accenture_MeetupDora&Cybersecurity.pptx02_Fabio Colombo_Accenture_MeetupDora&Cybersecurity.pptx
02_Fabio Colombo_Accenture_MeetupDora&Cybersecurity.pptx
 
Instant Issue Debit Cards - High School Spirit
Instant Issue Debit Cards - High School SpiritInstant Issue Debit Cards - High School Spirit
Instant Issue Debit Cards - High School Spirit
 
TEST BANK For Corporate Finance, 13th Edition By Stephen Ross, Randolph Weste...
TEST BANK For Corporate Finance, 13th Edition By Stephen Ross, Randolph Weste...TEST BANK For Corporate Finance, 13th Edition By Stephen Ross, Randolph Weste...
TEST BANK For Corporate Finance, 13th Edition By Stephen Ross, Randolph Weste...
 

222-424-1-PB.pdf

  • 1. 499 IRA-International Journal of Management & Social Sciences ISSN 2455-2267; Vol.03, Issue 03 (2016) Institute of Research Advances http://research-advances.org/index.php/RAJMSS A Comparitive Study on Working Capital Management of Selected Pharmaceutical Companies in India Dr. M. Viswanathan Principal (I/C) and Head, Department of Commerce, Karuppannan Mariappan College, Muthur-638105, India. Dr. A. Palanisamy Assistant Professor, Department of Commerce (CA), Karuppannan Mariappan College, Muthur-638105, India. Mr. R. Mahesh Assistant Professor, Department of Commerce (CA), Karuppannan Mariappan College, Muthur-638105, India. DOI: http://dx.doi.org/10.21013/jmss.v3.n3.p11 How to cite this paper: Viswanathan, D., Palanisamy, D., & Mahesh, R. (2016). A Comparitive Study on Working Capital Management of Selected Pharmaceutical Companies in India. IRA- International Journal of Management & Social Sciences (ISSN 2455-2267), 3(3). doi:http://dx.doi.org/10.21013/jmss.v3.n3.p11 © Institute of Research Advances This works is licensed under a Creative Commons Attribution-Non Commercial 4.0 International License subject to proper citation to the publication source of the work. Disclaimer: The scholarly papers as reviewed and published by the Institute of Research Advances (IRA) are the views and opinions of their respective authors and are not the views or opinions of the IRA. The IRA disclaims of any harm or loss caused due to the published content to any party.
  • 2. IRA-International Journal of Management & Social Sciences 500 ABSTRACT Working capital management refers to management of current assets and of current liabilities. Every company may have an optimal level of working capital that maximizes their value. Prior evidence has determined the relationship between working capital and performance. The working capital management was determined by the cash conversion period and position of working capital, indicated by profitability and liquidity analysis. As the data selected for the study consists of observations in a time series manner so, analytical method is used in this study. Ten companies were selection during the study period is confined only 10 years from 2003-2004 to 2012-2013. The financial and statistical tools used for the study were Ratio Analysis, Descriptive Statistics and Indices. Results indicate that high investment in inventories and receivable lead to lower profitability and current assets to total assets lead to higher profitability. The results conclude that a strong relationship between working capital management and financial position of selected pharmaceutical companies in India. Key Words: Liquidity Ratios, Turnover Ratio, Profitability Ratios, Business and Pharmaceutical Companies. Introduction In this chapter an attempt has been made to evaluate the analysis of working capital position of the selected Pharmaceutical companies. In order to evaluate the working capital position of any enterprise, the financial analyst needs certain yardsticks. One of such yardsticks frequently used is a ratio. Ratios, as a tool of financial management, can be expressed as percentage or fraction and stated that comparison between the numbers. Ratio analysis provides guides and clues especially in spotting trends towards better or poor performance and in finding out significant deviation from any average or relatively applicable standard. The analysis of working capital position has been divided into two main sections. In the first section, the financial ratios of various selected Pharmaceutical companies are calculated and examined like analysis of profitability; liquidity and analysis of activity ratios are exhibited. The second section deals with determinants of profitability in respect with liquidity by selected independent variables also analyzed. Objectives of the study The study is designed to achieve the following objectives: (i) To assess the working capital position of the selected Pharmaceuticals companies. (ii) To examine the working capital state of affairs of the selected Pharmaceuticals companies. (iii) To test the working capital strengths and weaknesses of selected Pharmaceuticals firms. (iv)To pinpoint the causes of poor working capital position and suggest some measures to overcome the problems.
  • 3. IRA-International Journal of Management & Social Sciences 501 Methodology A scientific approach to the research methodology is very much essential to evaluate the research problem systematically. In the present study, the data used for secondary in nature and the required data were collected from the compilation made by the Centre for Monitoring Indian Economy (CMIE) for the period from 2003-2004 to 2012-2013. Prowess database of CMIE is the most reliable and empowered corporate database. The annual published financial reports of the companies have been used for random checking of the data. Sample Design As the complete source list of all the Pharmaceutical Companies is 174 listed companies as per the latest Balance Sheet available, the data for this study is selected based on convenience sampling method. The criteria while selecting the Pharmaceutical companies’ Total Assets (Rs in Cr.) is an appropriate factor to determine the Financial Performance of the company. For the purpose of this study, the set of the Pharmaceutical companies are determined using the criteria stated as below; 1. The companies which hold Total Assets of more than of Rs 5,000 Cr. is categorized as Large Scale Pharmaceutical Companies. 2. The companies which hold Total Assets of more than of Rs 2,500 Cr. and less than of Rs 5,000 Cr. is categorized as Medium Scale Pharmaceutical Companies. This study has classified into Large Scale and Medium Scale Pharmaceutical Companies the list of sample companies in Table 1.1. Table 1.1 Sample Selection of Pharmaceutical Companies (Values as on 31st March 2013) Large Scale Companies Medium Scale Companies Name of the company Registered State Total Assets (Rs in Cr.) Name of the company Registered State Total Assets (Rs in Cr.) 1.Piramal Enter Maharashtra 15297.99 1.Jubilant Life Uttar Pradesh 4897.88 2.Dr.Reddys Labs Hyderabad 9916.00 2.Cadila Health Gujarat 3908.50 3. Cipla Maharashtra 9912.81 3.Glenmark Maharashtra 3188.78 4.Sun Pharma Punjab 8249.56 4.Orchid Chemical Tamil Nadu 3244.65 5.Ranbaxy Labs Gujarat 8042.15 5.Divis Labs Andhra Pradesh 2588.70 Source: Compiled from Annual Reports of the respective companies. Tools for Analysis The financial and statistical tools used for the study were Ratio Analysis, Descriptive Statistics. . The techniques such as arithmetic mean, standard deviation, co- efficient of variation, growth rates, annual growth rate, compound annual growth rate, analysis of variance, Pearson’s correlation analysis and multiple regression analysis.
  • 4. IRA-International Journal of Management & Social Sciences 502 Period of the Study The study covers a period of ten years from the financial year 2003-2004 to 2012-2013. Limitation of the study 1. The study is restricted and limited to sample size of 10 selected pharmaceutical companies in India. 2. The effect of inflation has not been considered in the present study. 3. The result of analysis is subject to the same constraints as are applicable to statistical tool. 4. The study period is confined only 10 years from 2003-2004 to 2012-2013. Review of literature Mobeen Ur Rehman and Naveed Anjum(2013)1 empirically examine the effects of working capital management on the profitability of Pakistan cement industry. Secondary Data was collected from Annual Reports and the sample size is 10 consisting of Pakistan cement Companies listed in KSE from 2003-2008. The relationship between working capital management and profitability is examined using statistical tools. The result accepts the hypothesis that there is a positive relationship between working capital management and profitability on the cement sector of Pakistan. Gulshan Kumar (2013)2 in his study makes an effort to investigate growth pattern and productivity trends of small-scale non-metallic mineral products industry in Punjab. The growth of industry has been measured in terms of four variables namely: number of units, fixed investment, direct employment and production. Yearly growth rates have been computed to mirror year-to-year fluctuations in growth and compound annual growth rates (CAGRs) have been worked out to find the impact of the policies of liberalized regime on growth of this industry. The study observed that the significant growth rate was observed in the variables namely number of units, fixed investment and production. But the policies of liberalized regime have resulted in qualitative rather than quantitative growth in the small scale non-metallic minerals products industry in Punjab. Highly significant growth rate was recorded in fixed investment and production, a slow growth was noticed in number of units but insignificant growth was gauged in employment during the liberalization period. Muhammad FahadIftikhar (2013)3 his study was conducted to determine the determinants of working capital management efficiency of automotive and engineering firms listed in Karachi Stock Exchange of Pakistan. The Cash 1 Mobeen ur rehman,naveed anjum(2013), “determination of the impact of working capital management on profitability” an empirical study from the cement sector in pakistan asian economic and financial review,, 3(3):319- 332. 2 Dr.Gulshan Kumar Global (2013), “Journal of Science Frontier Research” Volume 11, Issue 2, March 2012, pp: 99-120. 3 Muhammad FahadIftikhar, (2013)“Determinants of working capital management efficiency: Case study of Pakistani automotive and engineering firms listed in Karachi Stock Exchange”, Research Journal of Finance and Accounting, Vol.4, No.7, pp: 216- 236.
  • 5. IRA-International Journal of Management & Social Sciences 503 Conversion Cycle, Days sales Inventory, Days Payable Outstanding and Days Sales Outstanding are the explanatory variables. Whereas the descriptive statistics, Pearson’s Bivariate correlation analysis and ordinary pooled least square with fixed effect model were applied to investigate the significance of panel data set. It is quarterly based and secondary data in nature that comprises of 9 firms for 5 years. The observations were taken from financial years 2006 to 2010 of the listed firms. It is concluded that to keep the working capital efficient cash conversion cycle must be shortest. For this there is need of tight collection policy and liberal payment policy while the inventory management must be efficient by reviewing the inventory policy. It is concluded that it is also an efficient factor for efficient cash conversion cycle and working capital management efficiency. Theoretical Model Framework The results of the selected companies financial ratios regarding to profitability, liquidity and turnover ratios for the purpose to prove the hypothesis two-way ANOVA has been applied for the following null hypothesis: Ho: There is no significant difference between the selected ratios, among the selected companies and between years.
  • 6. IRA-International Journal of Management & Social Sciences 504 Table 1.2 LIQUIDITY RATIO OF SELECTED PHARMACEUTICAL COMPANIES Table 1.2 Liquidity Ratios of Selected Pharmaceutical Companies CURRENT RATIO OF SELECTED PHARMACEUTICAL COMPANIES Large Scale Companies Medium Scale Companies Piramal Enterprises Dr. Reddy's Lab CIPLA Sun Pharma Ranbaxy Jubilant Life Cadila Health Glenmark Orchid Divis Labs Average 2.44 3.2 3.1 4.25 1.69 1.91 2.11 5.02 2.63 3.07 SD 0.62 0.69 0.63 2.02 0.37 0.37 0.3 2.74 0.73 0.4 CV 25.41 21.63 20.23 47.61 21.68 19.45 14.05 54.49 27.66 13.12 Maximum 3.4 3.91 3.72 7.92 2.19 2.46 2.58 8.88 3.64 3.76 Minimum 1.43 2.15 2.11 2.57 1.21 1.23 1.79 1.56 1.78 2.56 AGR (%) 52.96 -14.11 72.95 -2.22 -38.21 -47.51 3.58 -55.19 -20.22 -12.12 CAGR(%) 4.34 -1.51 5.63 -0.22 -4.7 -6.24 0.35 -7.71 -2.23 -1.28 QUICK RATIO OF SELECTED PHARMACEUTICAL COMPANIES Large Scale Companies Medium Scale Companies Piramal Enterprises Dr. Reddy's Lab CIPLA Sun Pharma Ranbaxy Jubilant Life Cadila Health Glenmark Orchid Divis Labs Average 2.44 3.2 3.1 4.25 1.69 1.91 2.11 5.02 2.63 3.07 SD 0.62 0.69 0.63 2.02 0.37 0.37 0.3 2.74 0.73 0.4 CV 25.41 21.63 20.23 47.61 21.68 19.45 14.05 54.49 27.66 13.12 Maximum 3.4 3.91 3.72 7.92 2.19 2.46 2.58 8.88 3.64 3.76 Minimum 1.43 2.15 2.11 2.57 1.21 1.23 1.79 1.56 1.78 2.56 AGR (%) 52.96 -14.11 72.95 -2.22 -38.21 -47.51 3.58 -55.19 -20.22 -12.12 CAGR(%) 4.34 -1.51 5.63 -0.22 -4.7 -6.24 0.35 -7.71 -2.23 -1.28
  • 7. IRA-International Journal of Management & Social Sciences 505 DEBT-EQUITY RATIO OF SELECTED PHARMACEUTICAL COMPANIES Large Scale Companies Medium Scale Companies Piramal Enterprises Dr.Reddy's Lab CIPLA Sun Pharma Ranbaxy Jubilant Life Cadila Health Glenmark Orchid Divis Labs Average 0.43 0.17 0.11 0.37 1.06 1.36 0.59 0.92 2.18 0.15 SD 0.26 0.12 0.08 0.58 0.84 0.44 0.2 0.75 0.85 0.15 CV 61.3 67.87 75.55 158.28 78.78 32.7 33.24 82.3 38.91 105.32 Maximum 0.82 0.41 0.24 1.64 2.5 1.99 0.96 2.29 3.87 0.44 Minimum 0.02 0.03 0 0 0.01 0.74 0.27 0.22 1.31 0.01 AGR (%) -41.96 84.64 -34.63 -62.55 168.69 -24.26 -47.53 -52.91 12.58 -95.5 CAGR(%) -5.3 2.52 -4.16 -9.36 6.7 -2.74 -6.25 -7.25 1.19 -26.66 Source: computed The current ratio in selected large scale and medium scale pharmaceutical companies in India has been shown in Table 1.2.The average current ratio among the large scale pharmaceutical companies was the maximum of 4.25 times in sun pharma and the minimum of 1.69 times in Ranbaxy. The standard deviation of 2.02 times in sun pharma shows a high fluctuation of selected large scale pharmaceutical companies under study The coefficient of variation has found to be the maximum of 47.61 times in sun pharma and the minimum of 20.23 times in cipla. The AGR was the maximum of 72.95% in cipla and the minimum of -38.21 % in Ranbaxy. The CAGR was the maximum of 5.63% in CIPLA and the minimum of -4.70% in Ranbaxy. The average current ratio among the medium scale pharmaceutical companies was the maximum of 5.02 times in Glenmark and the minimum of 1.91 times in Jubiliant life. The standard deviation of 2.74 times in Glenmark shows a high fluctuation of selected companies under the study. The coefficient of variation has found to be the maximum of 54.49 times in Glenmark and the minimum of 13.12 times in Divis labs. The AGR was the maximum of 12.12% in Divis Labs and the minimum of -55.19% in Glenmark. The CAGR was the maximum of 0.35% in Cadila health and the minimum of -7.71% in Glenmark.
  • 8. IRA-International Journal of Management & Social Sciences 506 Table 1.3 TURNOVER ANALYSIS OF SELECTED PHARMACEUTICAL COMPANIES The average Working Capital Turnover ratio among the large scale pharmaceutical companies were the maximum of 67.96 times in Sun Pharma and the minimum of 31.25 times in Ranbaxy. The standard deviation of 32.72 times in Sun Pharma shows a high fluctuation of selected large scale pharmaceutical companies under study. The coefficient of variation has found to be the maximum of 48.14 times in sun pharma and the minimum of 29.83 times in Dr.Reddy’s labs. The AGR was the maximum of 36.66 % in Sun Pharma and the minimum of – 25.15 % in Ranbaxy. The CAGR was the maximum of 11.61% inPiramal Enter and the minimum of -2.85 % in Ranbaxy. The Working Capital Turnover ratio in selected large scale and medium scale pharmaceutical companies in India has been shown in Table 1.3. The average Working Capital Turnover ratio among the medium scale pharmaceutical companies was the maximum of 86.85 times in Glenmark and the minimum of 26.43 times in Cadila Health. The standard deviation of 64.52 times in Glenmark shows a high fluctuation of selected companies under the study. The coefficient of variation has found to be the maximum of 74.29 times in Glenmark and the minimum of 16.04 times in Divis labs. The AGR was the maximum of 6.35 % in Cadila and the minimum of -65.18 % in Glenmark. The CAGR was the maximum of 0.62% in Cadila and the minimum of -10.01 % inGlenmark. Table 1.3 Turnover Analyses of Selected Pharmaceutical Companies WORKING CAPITAL TURNOVER RATIO OF SELECTED PHARMACEUTICAL COMPANIES Large Scale Companies Medium Scale Companies Piramal Enterprises Dr.Reddy's Lab CIPLA Sun Pharma Ranbaxy Jubilant Life Cadila Health Glenmark Orchid Divis Labs Average 38.73 61.42 50.54 67.96 31.25 27.25 26.43 86.85 59.43 48.51 SD 17.21 18.32 7.85 32.72 12.37 10.95 7.18 64.52 9.72 7.78 CV 44.44 29.83 15.54 48.14 39.57 40.2 27.19 74.29 16.35 16.04 Maximum 66.1 89.51 61.44 127.23 63.4 51.03 37.03 220.62 72.82 61.5 Minimum 19.25 39.52 41.07 31.09 19.34 9.82 17.92 18.33 44.12 37.29 AGR (%) 199.88 -9.85 2.39 36.66 -25.15 -60.82 6.35 -65.18 -16.72 -7.3 CAGR(%) 11.61 -1.03 0.24 3.17 -2.85 -8.95 0.62 -10.01 -1.81 -0.75
  • 9. IRA-International Journal of Management & Social Sciences 507 INVENTORY COLLECTION PERIOD OF SELECTED PHARMACEUTICAL COMPANIES Large Scale Companies Medium Scale Companies Piramal Enterprises Dr.Reddy's Lab CIPLA Sun Pharma Ranbaxy Jubilant Life Cadila Health Glenmark Orchid Divis Labs Average 61 87 142 101 100 76 87 84 216 225 SD 17 11 14 31 24 10 14 30 49 55 CV 27 12 10 31 24 14 16 35 23 24 Maximum 99 101 167 148 141 89 112 128 301 353 Minimum 38 71 125 69 56 58 71 42 149 159 AGR (%) -38 19 -2 38 3 15 -6 -59 -27 12 CAGR(%) -5 2 0 3 0 1 -1 -9 -3 1 ACCOUNTS RECEIVABLE PERIOD OF SELECTED PHARMACEUTICAL COMPANIES Large Scale Companies Medium Scale Companies Piramal Enterprises Dr.Reddy's Lab CIPLA Sun Pharma Ranbaxy Jubilant Life Cadila Health Glenmark Orchid Divis Labs Average 45 105 101 76 91 57 60 130 120 95 SD 7 14 19 21 33 8 12 45 59 11 CV 16 13 19 28 36 13 20 35 50 12 Maximum 57 127 133 121 170 65 79 188 206 108 Minimum 37 85 72 49 48 45 37 56 19 75 AGR (%) -17 31 -26 -16 72 -26 25 -36 -67 -8 CAGR(%) -2 3 -3 -2 6 -3 2 -4 -11 -1 Source: computed Table 1.4 Profitability analyses of selected pharmaceutical companies The operating profit ratio in selected large scale and medium scale pharmaceutical companies in India has been shown in Table 1.4. The average operating profit ratio among the large scale pharmaceutical companies was the maximum of 37.48 times in Sun Pharma and the minimum of 9.58 times in Ranbaxy. The standard deviation of 23.01 times in Ranbaxy shows a high fluctuation of selected large scale pharmaceutical companies under study. The coefficient of variation has found to be the maximum of 240.15 times in Ranbaxy and the minimum of 9.21 times in Cipla. The AGR was the maximum of 52.13% in Sun
  • 10. IRA-International Journal of Management & Social Sciences 508 Pharma and the minimum of – 81.96 % in Ranbaxy. The CAGR was the maximum of 4.28% in Sun Pharma and the minimum of -15.74% in Rabaxy. Table 1.4 Profitability analyses of selected pharmaceutical companies OPERATING PROFIT RATIO OF SELECTED PHARMACEUTICAL COMPANIES Large Scale Companies Medium Scale Companies Piramal Enterprises Dr. Reddy's Lab CIPLA Sun Pharma Ranbaxy Jubilant Life Cadila Health Glenmark Orchid Divis Labs Average 22.84 24.09 25.64 37.48 9.58 19.8 25.32 27.21 29.97 39.85 SD 7.69 7.38 2.36 7.55 23.01 5.62 4.48 7.18 14.21 4.22 CV 33.66 30.62 9.21 20.14 240.15 28.38 17.7 26.4 47.41 10.6 Maximum 40.35 39.22 28.63 52.33 33.03 27.72 35.65 42.12 68.2 47.62 Minimum 10.85 9.65 22.28 30.52 -31.74 10.57 20.26 21 20.73 33.37 AGR (%) -43.38 10.74 17.68 52.13 -81.96 -44.07 42.08 5.5 13.3 4.82 CAGR(%) -5.53 1.03 1.64 4.28 -15.74 -5.64 3.57 0.54 1.26 0.47 NET PROFIT RATIO OF SELECTED PHARMACEUTICAL COMPANIES Large Scale Companies Medium Scale Companies Piramal Enterprises Dr. Reddy's Lab CIPLA Sun Pharma Ranbaxy Jubilant Life Cadila Health Glenmark Orchid Divis Labs Average 0.1 0.06 0.18 0.32 0.08 0.11 0.17 0.17 0.01 0.29 SD 0.08 0.04 0.02 0.07 0.13 0.05 0.05 0.06 0.17 0.07 CV 80.37 71.59 10.56 22.32 164.42 50.89 32.26 32.55 117.96 23.12 Maximum 0.17 0.13 0.21 0.44 0.21 0.2 0.28 0.28 0.15 0.37 Minimum -0.1 -0.03 0.15 0.25 -0.26 0.02 0.09 0.12 -0.44 0.18 AGR (%) -165.83 -121.84 9.75 52.62 -83.82 -72.87 128.36 58.54 78.11 19.71 CAGR(%) -26.66 -19.58 0.93 4.32 -16.65 -12.23 8.61 4.72 5.94 1.82
  • 11. IRA-International Journal of Management & Social Sciences 509 RETURN ON TOTAL ASSETS RATIO OF SELECTED PHARMACEUTICAL COMPANIES Large Scale Companies Medium Scale Companies Piramal Enterprises Dr. Reddy's Lab CIPLA Sun Pharma Ranbaxy Jubilant Life Cadila Health Glenmark Orchid Divis Labs Average 0.12 0.04 0.18 0.2 0.09 0.08 0.16 0.1 0.01 0.25 SD 0.09 0.03 0.04 0.06 0.12 0.04 0.04 0.05 0.08 0.06 CV 77.15 76.17 20.37 30.6 138.03 53.09 26.59 52.33 101.6 25.69 Maximum 0.27 0.1 0.25 0.32 0.33 0.13 0.23 0.25 0.07 0.37 Minimum -0.02 -0.02 0.14 0.1 -0.15 0.01 0.09 0.05 -0.21 0.14 AGR (%) -105.66 -123.54 -27.31 -33.94 -91.78 -87.16 79.64 0.73 80.12 -4.35 CAGR(%) -12.14 -15.95 -3.14 -4.06 -22.11 -18.56 6.03 0.07 6.06 -0.44 Source: computed The operating profit ratio in selected large scale and medium scale pharmaceutical companies in India has been shown in Table 1.4. The average operating profit ratio among the large scale pharmaceutical companies was the maximum of 37.48 times in Sun Pharma and the minimum of 9.58 times in Ranbaxy. The standard deviation of 23.01 times in Ranbaxy shows a high fluctuation of selected large scale pharmaceutical companies under study. The coefficient of variation has found to be the maximum of 240.15 times in Ranbaxy and the minimum of 9.21 times in Cipla. The AGR was the maximum of 52.13% in Sun Pharma and the minimum of – 81.96 % in Ranbaxy. The CAGR was the maximum of 4.28% in Sun Pharma and the minimum of -15.74% in Rabaxy. The average operating profit ratio among the medium scale pharmaceutical companies was the maximum of 39.85 times in Divis lab and the minimum of 19.80 times in Jubilant Life. The standard deviation of 14.21 times in Orchid shows a high fluctuation of selected companies under the study. The coefficient of variation has found to be the maximum of 47.41 times in Orchid and the minimum of 10.60 times in Divis Labs. The AGR was the maximum of 42.08 % in Cadila Health and the minimum of -44.07 % in Jubilant. The CAGR was the maximum of 3.57 % in Cadila and the minimum of -5.64 % in Jubilant.
  • 12. IRA-International Journal of Management & Social Sciences 510 Suggestion and Recommendation Selected pharmaceutical companies should improve its current ratio above 2. To improve the current ratio the companies should increase their current assets or decrease their current liabilities. Sufficient quick ratio is maintained by all companies in large scale and medium scale. They should maintain the same in the years to come. Selected companies should increase their borrowing with minimum interest. It uses trading on equity technique to increase wealth of equity shareholders. Working capital is a base for day-to-day operation of business. Companies having low working capital should increase their current assets, for interrupted production. Very high working capital also leads high liquidity but low profitability. So companies should maintain moderate working capital ratio, which leads to high liquidity and profitability. Number of days required to convert inventory into cash is known as inventory collection period. Higher number of days indicates that the company has poor inventory management system. Companies who have highest collection period should concentrate on its inventory management technique, to reduce number of days of inventory collection and then only they can increase their profitability and maintain required working capital. Number of days required to collect cash from debtors is calculated by account receivable period. Companies who have higher days to collect cash from debtors fail to increase their profitability, fail to maintain adequate working capital. So they should follow proper collection technique and increase their liquidity position. Number of days required to pay creditors is calculated by accounts payable period. Companies who have minimum number of days to pay its suppliers, will increase the number of days by means of opting suitable buyer will lead to increase profitability and minimize working capital requirements. Operating cycle period is a period from selling inventories to collecting cash. Minimum number of days of operating cycle indicates that the company has quickly converted its stock into cash. The companies of higher operating cycle period should follow necessary debt collecting techniques to reduce number of days for collecting money from debtors. Companies have highest cash turnover ratio shows that it has good profitability position. It can easily maintain required cash level. So low cash turnover ratio companies should concentrate on increasing cash receipts and delaying cash position as it possible. Companies, who have lowest current asset turnover ratio implies that, they are the companies did not have sales in a quick time. It will decrease the rate of profitability so companies should concentrate to increase the sales. The companies should maintain minimum current liability to total asset ratio. Highest current liability to total asset ratio indicates that the companies need to maintain higher amount of working capital to maintain its short term solvency position. It automatically reduces profitability of companies. Operating profit reveals operational efficiency of business concern. Low operating ratio companies like Ranbaxy, should concentrate on controlling their cost of sales and other operating expenses to revamp its operating ratio. Every stakeholder of business is mainly focusing on net profit of company. It will increase goodwill among the stakeholders. Minimum net profit companies like Orchid, should reduce its operating and non-operating expenses and also adopt proper marketing techniques to increase their sales and profit margin. Return Total Assets Ratio is an indicator, how effectively assets are used to increase its profitability. Low ratio indicates that assets are not efficiently used in business so the companies should plan properly and effectively use the idle assets to increase profitability. Conclusions The study has analyzed the working capital position of selected pharmaceutical companies in India was satisfactory. It can be concluded that the pharmaceutical companies have good liquidity position; their ratios were normally higher
  • 13. IRA-International Journal of Management & Social Sciences 511 than ideal ratio. So they can easily meet their short term liabilities and working capital requirement. Secondly solvency position of the pharmaceutical companies were not satisfactory, it would suffer their long term borrowing. So they should improve their debt equity ratio. Conversion periods of working capital components were also longer period of time. It would affect the profitability of companies. So they should reduce their conversion period of for working capital components. So the selected pharmaceutical companies should control their cost of sales and other operating expenses to increase their profitability. Reference: 1. Mobeen ur rehman,naveed anjum(2013), “determination of the impact of working capital management on profitability” an empirical study from the cement sector in pakistan asian economic and financial review,, 3(3):319- 332. 2. Dr.Gulshan Kumar Global (2013), “Journal of Science Frontier Research” Volume 11, Issue 2, March 2012, pp: 99-120. 3. Muhammad FahadIftikhar, (2013)“Determinants of working capital management efficiency: Case study of Pakistani automotive and engineering firms listed in Karachi Stock Exchange”, Research Journal of Finance and Accounting, Vol.4, No.7, pp: 216-236.