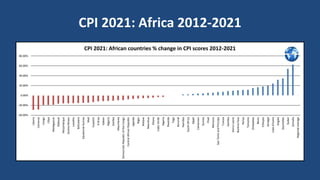
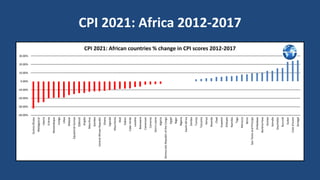
Download as PDF, PPTX
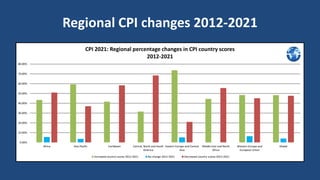
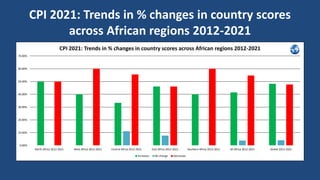
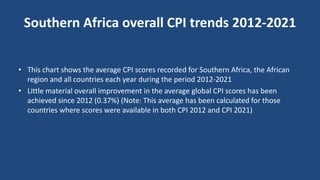
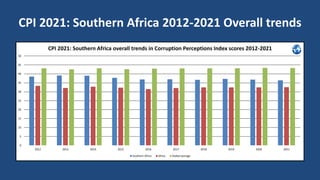
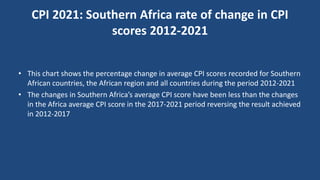
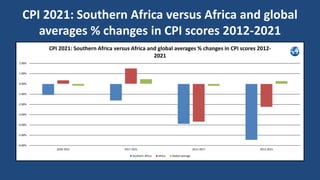
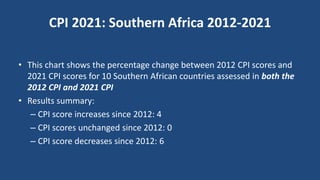
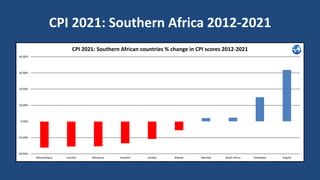


The 2021 Corruption Perceptions Index (CPI) analysis reveals that Southern Africa had the highest percentage of countries improving their CPI scores from 2012 to 2021 among African regions, although overall performance during this period was disappointing with most countries experiencing declines. While global CPI improvements since 2012 were minor, Southern Africa ranked third in regional performance in terms of score improvement rates. The report highlights a troubling trend of decreasing scores for many Southern African nations, contrasting with only four countries seeing score increases since 2012.


