SlideShare a Scribd company logo
1 of 28
Download to read offline
1
Net Zero Emissions Household
Becoming a Fossil Fuel Free Family
MARCH
2020
Dave
Southgate
2
Foreword
The world is in a climate emergency. Unfortunately, many governments around the world are either
unwilling, or unable, to take effective action against this existential threat.
I believe that in this policy vacuum individuals can make a useful contribution to reducing global
carbon emissions. However, in order to do this effectively we need to have a detailed knowledge of
the composition of our individual and household carbon footprints.
My family has spent a number of years reducing our direct carbon footprint and we have
dramatically cut, or eliminated, our purchases of grid electricity, gas and petrol. Given the current
circumstances I have decided that we now need to work on reducing our indirect carbon footprint –
reducing the CO2 emissions that are embedded in the things we buy and the services we use.
In order to do this we first need to understand the makeup of our indirect footprint. This report is
my first attempt at breaking down my family’s indirect footprint into its constituent parts. The aim is
to reveal the areas where we can take the most effective action to reduce our indirect emissions.
As an initial step I have analysed our total footprint for 2019 and have produced a ‘net zero
emissions’ outcome for the year by buying carbon offsets. In future years I propose to take more
concrete action to reduce our total carbon footprint.
Dave Southgate
Canberra
March 2020
3
Household Carbon Balance Sheet 2019
Debits Credits
5,743 kgCO2e carbon offsets
DIRECTINDIRECT
Net Zero Emissions achieved
through purchase of
TOTAL Carbon Credits
= 13,170 kgCO2e
TOTAL Carbon Debits
= 13,170 kg CO2e
DIRECTINDIRECT
Petrol
Grid
electricity
Food
(grocery
shopping)
NZ
Holiday
EV
(indirect)
Internet/computing
Clothes
Food (eating out)
Coffee (lattes)
Other
Solar PVExported
7,427 kgCO2e
Carbon Offsets
5,743 kgCO2e
4
Background
I retired in 2012 after a 31-year career as an environmental bureaucrat. I consider myself privileged
to have had the opportunity to spend the last decade of my career working on climate change issues
at both the national and international level. However, in the end I became very concerned about
the inability of the global governance system to take the steps necessary to control the polluting
impacts of carbon dioxide and other greenhouse gases.
Against this background, when I retired I determined that I would tackle the problem from the
bottom up and try to minimise, and hopefully eliminate, my family’s direct emissions of carbon
dioxide. My family began a journey to become fossil fuel free (FFF) by transitioning our household
energy use. I wrote about the beginning of this journey in my book Our Household Energy
Transition: Becoming a Fossil Fuel Free Family which I released in February 2016. I have
subsequently produced four Annual Reports which document, and discuss, the energy and carbon
footprint outcomes of our energy transition program.
Our project to be Fossil Fuel Free relates only to our direct carbon footprint. That is, our aim is to no
longer directly buy any fossil fuel based energy – gas, petrol or grid electricity. However, I have been
fully aware throughout our transition, and other people have often reminded me, that our direct
carbon footprint is only part of the problem. What about the carbon emissions embedded in our
consumption of goods and services – our indirect carbon footprint?
I initially focussed on our direct footprint because it is the part of our footprint that we directly
control. We know very accurately how much energy we are using. I can closely monitor this in real
time and adjust our behaviour accordingly. On the other hand, the indirect carbon footprint of our
consumption patterns is not clearly defined and it requires a lot of detailed (usually unknown)
information to compute its magnitude.
In my transition Annual Report for 2019 I indicated that I had decided to close Phase 1 of our energy
transition project at the end of 2019 and to open Phase 2 in 2020. In Phase 2 I intend to expand our
aims: while being Fossil Fuel Free (ie no direct purchase of fossil based fuels) will remain our primary
(and most difficult to achieve) goal; we will also aim to have ‘net zero emissions’ (NZE) for our
consumption on an ongoing annual basis. This means that from this point on, each year I will
attempt to compute, report and manage both our direct and indirect carbon footprints.
This change in direction was largely inspired by the recent surge in public interest in the implicit Paris
Agreement goal of the world having to reach ‘net zero emissions’ by 2050. Ideally the whole world
will be ‘fossil fuel free’ by this stage but I guess that is being overly ambitious. I see aiming to have
net zero emissions, which by definition involves the trading of carbon debits and credits, as being a
good transition compromise. It certainly beats the climate change inertia that has captured most of
the globe over the past few decades.
I have tried to keep discussion in this report to a minimum. My aim is to describe, as simply as
possible, the carbon accounting behind our household having net zero emissions for 2019.
In essence, this process involved computing both our direct and indirect carbon footprints (our
carbon debits) and then identifying ways in which we could negate those emissions (via carbon
credits) to achieve a balanced carbon budget.
5
Direct Carbon Footprint
6
Chapter 1 Direct Debits & Credits
Debits
As I’ve just discussed in the Background, we have been working for a number of years to reduce our
direct use of fossil fuel based energy as part of our project to become a Fossil Fuel Free Family.
Figure 1 gives a breakdown of our energy use over 2019. This Figure is extracted from my Annual
Report for 2019 and the reader is invited to look at this document if you want more detailed
information.
It can be seen that in 2019 we sourced about 40% of our household energy use from our solar PV
systems.
I have converted our fuel consumption data into CO2e emissions using the Government’s published
greenhouse accounts factors. The values for our petrol and grid electricity carbon footprints are
shown in Figure 2 in the next Section.
Credits
In my 2019 Annual Report I also discuss our solar PV production and export for the year. We
exported 9,169 kWh of solar PV electricity in 2019. I have converted this to a carbon credit of
7,427 kgCo2e using the published greenhouse accounts factors and assuming that each kWh of
solar PV (carbon zero) electricity that we exported displaced one kWh of grid (mainly coal based)
electricity. I discuss this conversion in my Annual Report.
Grid Electricity
7%
Self-consumed
direct solar PV
30%
Self-consumed
solar PV (via
battery)
11%
Petrol
52%
Total Grid Electricity
Consumption 2019 = 1,113 kWh
Figure 1: Breakdown of our household
energy use 2019
7
Indirect Carbon Footprint
8
Chapter 2
Introduction
Computing one’s direct carbon footprint is very straightforward. The energy user knows very
accurately, from their energy bills, how much fuel they have used over a period of time. The amount
of fuel used can easily be converted into carbon emissions through the application of the published
greenhouse accounts factors.
By way of contrast, computing one’s indirect carbon footprint is not straightforward. It generally
involves delving into many layers of data and making many assumptions. For example, if I buy a
widget I can normally find out which country it is ‘made’ in. However, the product may contain
many components which have been sourced from all over the world. Indeed, different batches of
the same product may have components from quite different origins or be made from different
materials. All these unknowns impact on the magnitude of a product’s carbon footprint. Unless one
is carrying out a detailed examination of a particular product one has to accept that the outcome of
indirect carbon footprinting computations is only likely to be a gross estimate.
This paper is a first attempt at computing an estimate of my family’s indirect carbon footprint.
I hope this will give us an indication of which of our patterns of consumption are the ones needing
most attention.
This document is not intended to be a scientific treatise. I have therefore tried to keep the language
and concepts simple by avoiding many of the niceties that the specialist carbon accountant would
use. I have done this not only to appeal to a wider audience but also because I see little value in
getting bogged down in detail when I am only seeking to obtain high level estimates of my family’s
indirect carbon footprint.
My Indirect Footprint is your Direct Footprint
While this may be self-evident to some readers, I think this topic is worth a short discussion.
If I buy a widget from small business manufacturer and distributor Fred, the CO2 emissions for my
widget, which add to my indirect carbon footprint, equal the widget’s CO2 contribution to Fred’s
direct footprint since he was the person that directly used the energy in the making and transport of
the product.
Problems can arise if for some reason Fred and I want to report our combined carbon footprint
(including both our direct and indirect footprints). If we simply sum up our individual footprints the
carbon footprint for the widget will be counted twice (once in my indirect footprint and once in
Fred’s direct footprint). Look out for double counting when venturing into the world of indirect
carbon footprinting!
What’s the value of indirect footprinting then if all CO2 emissions are reported somewhere in the
system as someone’s direct footprint? Let’s imagine after I bought my widget from Fred I need
another one and I become aware of manufacturer/distributor Freda. Unlike Fred who uses grid
electricity and a diesel delivery van, Freda uses solar PV electricity to manufacture the widget and
delivers it in an EV. Naturally I want to buy my next widget from Freda because of its low embedded
CO2 content (and probably much cheaper price). The outcome? My indirect, and therefore total,
carbon footprint is reduced and so is Fred’s. Poor Fred is now out of business because his carbon
intense business model (coal based electricity and diesel transport fuel) has failed – his direct carbon
9
footprint is now zero! My knowledge of my indirect carbon footprint has helped me to reduce the
size of the world’s carbon footprint.
Export of carbon footprint
Another aspect of indirect carbon footprinting which I believe is important relates to the export of
pollution. Over the past few decades, the west has outsourced much of its manufacturing to China
and other Asian countries. Instead of CO2 (and other pollutants) arising from the manufacture of
goods consumed in the west being registered against the western countries these are recorded
against the offshore countries. On a global scale the quantum of emissions may not have changed,
but the CO2 emissions are now registered as direct emissions against say China, rather than against
say Australia. A country can reduce its direct CO2 emissions simply by offshoring polluting industries.
I often find it sad when a commentator is berating China for its growing carbon footprint when at
least some (maybe quite a lot?) of that growth is associated with the manufacture of goods that are
exported to the west. I think it is doubly sad for Australia when much of an offshore country’s direct
carbon footprint derives from coal and/or gas which it has imported from Australia.
I think there are strong arguments for countries reporting both their direct and indirect carbon
footprints for information and transparency purposes (recognising double counting complexities).
Computing the Indirect Footprint
Unlike our direct footprint which I can monitor and report myself, I was totally reliant on the work of
other researchers to compute our indirect footprint for 2019.
To gain a background understanding of indirect footprinting I set out by reading the Mike
Berners-Lee book How Bad Are Bananas? The Carbon Footprint of Everything. While I certainly don’t
accept everything in the book, I found it gave me an excellent feeling for the task in hand.
Initially, I listed as best I could the main products which my family had bought, and the activities we
had been involved in, over 2019. I deliberately did not attempt to evaluate the carbon footprint of
products which we bought in earlier years (eg our house). Armed with this list I then attempted to
compute our annual carbon footprint for each of the identified products/activities based on factors
I could find in the published literature.
When starting my literature search, it very quickly became evident that there is no shortage of
material. I was quite surprised at the range of products and/or activities that have been carbon
footprinted over the past decade. On some topics, for example food, the range of papers and
references is almost overwhelming. Given this, it is not surprising that there are enormous
differences between the footprints being reported for the same items.
My approach to picking the ‘right’ answer was to: firstly look for work directly relating to Australia
(the computations in much of the published work relate to either the US or Europe); to give priority
to academic papers over those produced by parties with an apparent commercial interest (there is a
surprising number of these); and to give priority to the most recent work (carbon footprints can
evolve rapidly).
I worked through the list and arrived at the results shown in Figure 2. The Table also shows the
values for our direct footprint (see Chapter 1). I have included a list of references in Appendix 2 at
the end of the document. Not surprisingly, in developing the Table I came across many issues which
I could not resolve and therefore there were quite a number of items which I could not carbon
footprint. I discuss these briefly in the notes following the Table.
10
CO2
Emissions
Type
CO2e Source Amount
Wt CO2e
(kg)
Comments
DIRECT
Petrol 7,990 kWh 1,900
Grid Electricity 1,113 kWh 900
TOTAL Direct 2,800
INDIRECT
Food (grocery
shopping)
3,855 See Appendix 1
Flying (fuel)
4 seats
SYD-CHC
1,230
NZ Holiday Jan 2019
(includes indirect footprint for fuel)
New EV (Leaf) (mfr) 1 1,000 10tCO2e. Count over 10 years
Holidays/hotels 1 800
NZ holiday driving 2,000km +
30kgCO2e/night for hotels
Clothes 100 items 700 7 kgCO2e/garment
Food (eating out) 600 5 lunches + 1 family meal/week
Coffee 750 cups 380
Internet 4 persons 320 80 kgCO2e/person
Desk top computing 4 computers 300 60 kgCO2e/y + printer
Mobile phone 4 200 50kg/yr
Public Transport 5,000 km 200
Electricity (indirect for
both grid + solar PV)
190
100 kgCO2e for grid + 90 kgCO2e for
solar PV
Shoes 10 pairs 150
Newspapers 300 150 0.5 kgCO2e/edition
Library books 250 125 5 kgCO2e/book; book read 10 times
Petrol (indirect) 100 Scope 3 emission factors
Washing clothes 200 washes 45 220 gCO2e/wash for washing machine
New bike (mfr) 1 25 250 kgCO2e. Count over 10 years
TOTAL Indirect 10,370
TOTAL CARBON FOOTPRINT 13,170
Figure 2: Breakdown of my family’s direct and
indirect carbon footprints for 2019
11
Notes
1. In arriving at the numbers in the Table, I became acutely aware of the need to avoid ‘double
counting’. For example, the literature commonly identifies electricity use as one of the key
components of the indirect footprint of many domestic activities (eg washing clothes).
However, I have already counted our electricity use in our direct footprint and I therefore did
not include it again when reporting an indirect footprint.
2. I was not able to arrive at a quantitative value for the indirect footprint for some of the items I
had initially identified as being part of our family indirect carbon footprint:
Aviation: The figure for ‘flying’ in the Table for our NZ holiday includes indirect CO2 emissions for
the fuel but it does not include any CO2 allocation for infrastructure (eg for the
manufacture of the aircraft or the construction of the airports). Even if I knew the total
CO2 generated by these activities what would be my family’s contribution given there
are billions of aviation passengers flying round the world each year?
Cycling: Nearly all carbon footprinting of cycling that I found focusses on the amount of extra
food eaten by the cyclist. I did not want to compute this as it would be double counting
– this is already covered in my ‘Food’ category in the Table. To be complete one would
also need to compute the CO2 generated by the construction/maintenance of the bike
paths and roads which we ride on. This would capture most of the roads/paths in
Canberra. Again, even if I had this figure how would it be allocated between car drivers,
cyclists, walkers, etc?
Cleaning: There is a plethora of articles on the carbon footprint or ‘greenness’ of cleaning agents.
Unfortunately, I was unable to find any data that I could trust. We normally carry out
our cleaning using cold water. The electricity used by our cleaning machines
(eg vacuum cleaner) is captured by our direct footprint.
TV; videos: It is not hard to find references to studies that have been carried out into the carbon
footprint of producing TV programs; movies; etc. Clearly the CO2 emissions from
producing a major blockbuster movie are huge. However, the audiences are equally
huge. Major events are watched by billions of people. How do I work out my CO2
contribution if I, along with millions of others, watch one game of soccer on the TV?
Health: Clearly a visit to a doctor, dentist, or a hospital has a carbon footprint. The health
sector is one of the major sectors in our economy. The challenge is to break down the
footprint into digestible parts. How much carbon can be attributed to the training of
my doctor or dentist? What about their specialist equipment? If we knew the answer
to those questions how much could be allocated to us? Luckily my family has, to date,
not troubled the health services too much.
Electronics: As a family we always seem to buying lots of bits and pieces of electronic ‘stuff’. How
do you carbon footprint little odd gadgets? I must admit my main concern with a lot of
these small light items relates more to disposal than to the footprint of manufacture;
transport; etc
12
Tradies: We seem to have a lot of visits from trades people (mainly electricians). I imagine that
the main contribution to the CO2 emissions of these visits derives from the vehicles they
drive but I have no information on their travel routes (bring on the Tesla Cybertruck!).
I did not attempt to quantify this value.
Heaters; etc Over the year we bought a few electrical low energy heating/cooling devices as part
of our energy transition project. While it is not too hard to find the results of carbon
footprinting for this category of household appliances, it almost always focusses on
electricity use. As I’ve stated earlier this is not an issue for this exercise as our
electricity use is covered off in our direct carbon footprint. However, I was not able
to find any work relating to the carbon footprint of the manufacture/distribution of
these types of devices.
3. The data in the Table only includes our family’s private carbon footprint. My wife travels for
work, sometimes overseas; I have not included the CO2 from these trips. In my view employers
are responsible for managing the carbon footprints of their employees when they are at work.
Validation
Having a science/engineering background the first question I always ask myself after making some
computations is ‘are these numbers reasonable?’. This document contains my first attempt at
computing our total household footprint therefore I was particularly keen to validate the results
shown in Figure 2.
I have a great deal of confidence in my computations for our direct carbon footprint – after all, the
CO2 values are simply derived from our electricity bills and petrol dockets using the Government’s
published emission factors. Very solid energy/CO2 data!
On the other hand, after working through the literature I was very wary about the robustness of my
computations of our indirect carbon footprint. Many of the factors I used appeared to be little more
than guesstimates. Clearly there are many products/activities that I wasn’t able to include (see a
sample of a few of these in the notes under Figure 2). If I had included these, and made more
detailed examinations of the areas listed in the Table, would the total indirect carbon footprint be
materially different?
I was initially comforted by the fact that the ABC reports that in Australia ‘an average of 14 tonnes
(14,000 KG (sic)) [of CO2 is emitted] per household each year’. However, on closer examination it
appears that this figure simply relates to a household’s direct carbon footprint [I have not been able
to find a reliable estimate of the proportion of an Australian home’s carbon footprint that is direct,
but it appears this is typically around 50%]. A more comprehensive footprinting source indicates
that ‘A typical U.S. household has a carbon footprint [including both direct and indirect emissions] of
48 t CO2e/yr.’
With this information in mind I used two different carbon calculators (there are many of these on
the net) to compute our household carbon footprint. The first of these gave an answer of 12.9
tonnes of CO2/yr; the second produced a figure of 9.9 tonnes of CO2/yr.
Given the above, I’m happy that my indirect carbon footprint calculations are in the right ballpark.
These will of course need to be refined in the carbon footprint reports for future years.
13
Discussion
I have translated the indirect carbon data in Figure 2 into the visualisation in Figure 3. Food
immediately jumps out as the overwhelming contributor to our household indirect carbon footprint.
It makes up about 40% of this footprint. Given the importance of this component I have given a
detailed breakdown of food’s contribution to our family footprint in Appendix 1.
If the food carbon footprint is broken down into broad food groups an interesting picture emerges
(Figure 4). Almost 90% of our food carbon footprint falls into only three groups: meat/fish;
veg/fruit; and dairy. I’m not sure what a dietician would say about this. Anyway, it is easy to see
why a vegan diet is being promoted as a good way to reduce your carbon footprint!
Figure 4: Broad breakdown of my family’s food
carbon footprint for 2019
0 500 1,000 1,500 2,000 2,500 3,000 3,500 4,000 4,500
Food (grocery shopping)
Flying (NZ Holiday)
New EV (Leaf)
NZ Holiday (hire car + hotels)
Clothes
Food (eating out)
Coffee (lattes)
Internet
Desk top computing
Mobile phones
Public Transport
Electricity (indirect for both grid + solar PV)
Shoes
Newspapers
Library books
Petrol (Indirect)
Washing clothes
New bike
Figure 3: Breakdown of my family’s indirect
carbon footprint for 2019
Meat/fish
Veg/fruit
Dairy
Juices + non-dairy
milk
Cakes/biscuits
Eggs + margarine
Bread/cereals
14
It is also interesting to breakdown our total (direct + indirect) footprint into broad categories. This
picture is shown in Figure 5.
Amongst other things, this shows the significant contribution that is made by a short overseas
holiday taken relatively close to home. It is also interesting to note that apart from ‘clothes’ and ‘EV
(indirect)’ all the categories in the Figure involve products that are, to all intents and purposes,
immediate consumables. Sadly, these days even ‘clothes’ are often little more than short term
consumables. I see our New Nissan Leaf, which we bought in August 2019, as a long-term product
and it can be seen that its indirect footprint makes quite a sizeable contribution to our total
footprint. It is estimated that 10 tonnes of CO2 are generated in the manufacture of a Leaf. I intend
to allocate 1t CO2/yr to our carbon debits for 10 years to pay off this carbon debt.
Figure 5: Our total 2019 carbon footprint shown
in broad categories
Food (groceryshopping)
NZ Holiday
Petrol
Grid electricity Clothes
EV (indirect)
Internet/computing
Food (eatingout)
Coffee (lattes)
Other
15
Chapter 3
Managing Our Carbon Footprint
As indicated earlier, the key aims of our energy transition project is now to have net zero emissions,
computed on an annual basis, from this year going forward. In simple terms I will compute our
direct and indirect carbon footprints at the end of each year to work out our annual ‘carbon debt’.
At the same time, I will compute the carbon footprint of our total solar PV export to give us our
annual ‘carbon credit’ [see discussion below]. If our credit exceeds our debt, I will take no action. If
our debt exceeds our credit, I will buy some form of external carbon credits to provide us with a
balanced annual carbon budget.
Direct Footprint
We, as a family, have spent the last 6 years working to reduce our direct carbon footprint. As
mentioned in the Background to this document, you can find the reports I have written on this work
on my website. I have given some brief details of the magnitude and composition of our direct
footprint for 2019 in Chapter 1.
At the time of writing we are in the process of installing an additional 6kW of solar PV on the roof of
our house. The aim is to both reduce our use of grid electricity (which mainly occurs during three
months over winter) and to generate carbon credits which I intend to use to balance our carbon
account. Time will tell how successful this will be, but I anticipate that this additional solar PV will go
a very long way to wiping out our annual carbon deficit.
The main source of our annual direct carbon footprint over recent years has been petrol used in our
Hyundai i30. We have been slowly using this car less and our acquisition of the Gen 2 Nissan Leaf in
2019, with its larger battery compared to our previous 2012 Nissan Leaf, has enabled us to take
more of our family drives without using petrol. Nevertheless, I imagine that we will be using the i30
for a few years yet – hopefully a suitable EV or PHEV will present itself soon.
Indirect Footprint
Having just computed our indirect carbon footprint for the first time, I have yet to get my mind
around how we may reduce our indirect footprint.
The most obvious target for reducing our indirect carbon debts is the ‘food’ basket. I can’t envisage
us suddenly going vegan or vegetarian, but I will try to eat less beef and increase my consumption of
chicken. Maybe when it’s my turn to cook I’ll try to slip in a vegetarian meal or two. I would hope
that we can manage some carbon reductions in the meat segment of our indirect carbon pie.
One carbon segment that goes up and down from year to year is ‘holidays’. Sometimes we take
holidays in Australia; other times we go on long-haul trips. I originate from the UK and my wife is
from Malaysia and therefore family visits are important for us.
Overall I can’t see us making any great inroads into our indirect carbon footprint in the near term.
Having said that, I can think of ideas that would help us. For example, we (and I imagine many other
people) have no real idea about the size of the carbon footprint of an item we are buying – this value
is dependent on many variables – so it would be helpful if some form of carbon footprint labelling
scheme were introduced. A labelling scheme was going to introduced about a decade ago, but I
16
have no idea what happened. I’m certainly not aware of it being taken up. Nevertheless, articles
promoting the concept do still appear from time to time.
On a related theme, the issue of ‘food miles’ never seems to go away. There certainly seems to be a
perception that it is best to buy products that are made as close as possible to where you live. This
thinking is based on the not unreasonable assumption that transport makes up a significant
proportion of the indirect carbon footprint of most products and therefore ‘buying local’ will reduce
the size of the footprint. Unfortunately, as far as I can tell, this is often not the case and I have read
quite a few articles that suggest ‘food miles’ is a misleading concept. Bring on some verifiable
footprinting labels!
Carbon Credits
This is where things start to get messy. When you move into the world of ‘net’ carbon footprinting
you are, by definition, moving into an area where there is some form of trading between positive
and negative footprints. To achieve ‘net zero emissions’ some form of carbon credit will usually be
used to balance a carbon debit. This can be done in a number of ways, but it is often a contested
space which leaves many people feeling that any carbon reductions are ‘notional’ rather than
‘actual’.
Carbon credits under your direct control
I am most comfortable with using credits which I can physically generate and monitor myself. For
example, I can add a large solar PV system to the roof of my house and claim any exported (carbon
free) exports as credits.
I think this is fine, but some people would cry foul if I had sold my STC credits to my solar installer
when the system was installed – they would say that I had already sold my solar PV credits and
therefore I could not validly count them again to compute my net zero emissions status (back to
double counting). This could get into a long and tortuous debate but my current position (I’m happy
to be corrected) is that the annual Carbon Accounts contained in this document relate solely to a
private ‘carbon bubble’ that I have created for our household. I have done this solely to help us
understand, and take steps to reduce, our family carbon footprint. I am not trying to claim any
broader validity from this work (eg to get some form of monetary payment from a third party). In
these circumstances I have no problem with using our solar PV production as a credit in my informal
‘net zero emissions’ calculations.
Some may see planting and looking after trees as a form of ‘concrete’ carbon credit. They can
physically monitor the status of their credits. Some years ago I bought some biochar, with a view to
adding it to the soil in my garden, just to put my toe into the ‘sinks’ side of reducing the level of CO2
in the atmosphere. I found this extremely expensive (on a $/kg of CO2 basis), and not as satisfying as
installing solar PV but I think biochar is a technology that could play an important role in reducing
carbon impacts.
Buying offsets
This is an area that worries many people. You pay money and then it disappears! You simply have
to trust that your money will be used to take steps that will reduce atmospheric CO2 (eg build a wind
farm or create a plantation forest).
Putting the trust/transparency issue to one side, many environmentalists believe that buying offsets
is a cheap way to avoid taking necessary direct action to reduce your own carbon impacts. At one
level this is true, but if I have say $10,000 to spend is it better to spend this in my own backyard to
17
achieve a carbon reduction of xkt of CO2 or to spend it offshore and achieve a carbon reduction of
10xkt of CO2? Again putting aside any trust/transparency issues, clearly the latter option gives the
best carbon outcome for the planet.
This is a fraught topic, but I must admit that I can see merit in, and indeed do buy, carbon offsets.
I recently bought offsets for the flights we took on a short family holiday in January this year. I
believe the key to buying offsets is to make sure that they are being sold by a body with good
standing (with a reputation to lose if dodgy dealings are revealed) and they are backed by some
form of certified scheme (preferably government). For example, I am very comfortable buying
offsets from Qantas.
In the end I guess much of this debate goes to personal values. Some people will not buy offsets but
will do everything within their power to reduce their indirect carbon footprint by lifestyle change: go
vegan; no longer fly; only buy clothes from op shops; etc. I think this is terrific, but one key point for
me is that throughout our household energy transition project I have been trying to demonstrate
that one can both enjoy a ‘normal’ lifestyle and have a minimal carbon footprint. Offsets are likely
to play some part in this latter scenario if you want to have a net zero emissions impact.
Managing our Carbon Footprint going forward
You can see from the carbon balance sheet at the front of this document that I have arrived at zero
net emissions for our household for 2019 by purchasing CO2 offsets (see also Appendix 3). I did this
simply to establish a baseline for our total carbon footprint. Where do we go from here?
We will continue to work hard on our direct carbon footprint. The biggest target now is our indirect
carbon footprint. As I said a little earlier, I guess the most obvious response is to examine the
breakdown of our indirect footprint and start to tackle the major sources of CO2. Beef and cheese
clearly stand out as areas where we could make big carbon gains – I think we can probably cut down
on our consumption of these foods but I don’t think elimination is an option for us at the moment.
Having said that, I am much more attracted to looking at ways to increase our ‘footprint credits’
rather than decrease our ‘footprint debits’. In my experience, when trying to bring about change it
is always much easier to offer someone something new than it is to tell them to stop doing
something they enjoy. An indirect carbon footprint captures the essence of a person’s lifestyle.
If buying offsets is going to be part of the ‘something new’ then I think there are hurdles. When I
was going through the simple process of buying offsets to give us ‘net zero emissions’ for 2019, I was
very disappointed in the offset offerings for individual Australians. While there appear to be quite a
number of Australian companies offering corporate offsets, I was not able to find an Australian site
that provides a good service for individuals. In the end I bought my offsets from a US site which
appears to be credible (although the user interface certainly has some limitations (eg it only accepts
weights in pounds)). The price of the offsets (at approximately $10USD/kgCO2) appears worryingly
low – I paid approximately $110AUD to purchase my offsets (I bought a little bit more than
necessary to provide a small buffer). I also only have the broadest description of the types of
projects my money will be spent on – I find this particularly unsatisfactory.
As noted earlier, at the time of writing we are in the process of adding an additional 6kW of solar PV
to the roof of our house – this will take us to a total solar PV capacity of about 16kW. I’m hoping
that in a full year this should largely remove the need for us to buy any indirect carbon credits to
become ‘net zero carbon’.
If we do need to buy credits in the future, I plan on looking for a much more concrete offerings than
the usual ill-defined carbon offsets. For example, I would look to buy a share in a solar or wind farm
18
where I can be allocated a set proportion of the farm’s total annual output and receive notification
of, or at least be able to compute, the amount of renewable energy (carbon credits) that I have
generated each year. There are many community energy projects up and running in Australia (see
for example SolarShare which is a community solar company based in Canberra).
Finally, just to emphasise what I implied earlier in the paper, I don’t see ‘net zero emissions’ as being
the end of the game. The world needs to ultimately reach a state of being ‘Fossil Fuel Free’.
I envisage that once we, as a family, have a good handle of what we need to do to become ‘net zero
carbon’ we will push on and aim to develop an excess of credits so that we are able to make a
positive (ie negative) contribution to the world’s carbon budget.
19
Appendices
20
Appendix 1 Food
It can be seen from the information I have provided in Chapter 2 that for my family food dominates
our indirect carbon footprint. I imagine this is the same for most families. In fact for us, after years
of working on our direct carbon footprint, food also dominates our total carbon footprint.
Given this, I had little choice but do a more detailed assessment of the footprint contributions of the
all the different things in our grocery shopping basket. As with my analysis in Chapter 2, I relied on
searching the internet to find CO2 emission factors for each of the food types I needed to cover.
I have shown the outcomes of this work in Figure A1.
It is important to note that there are very diverse values in the literature for the carbon footprint of
any given food type. I tried to use the same priority as I mentioned before when selecting my
references: ideally Australia based; preferably academic research; and give preference to the most
recent work. In many cases in the end I just picked a value for the carbon footprint which was
somewhere in middle of the range of published values. Therefore I believe all of the CO2 values I
have computed need to be treated with some caution.
Description
Weight
(kg/wk)
Carbon
Intensity
(kg CO2e/kg)
Total CO2 e
(kg/year)
Meat: beef; lamb; chicken
Beef 1 23 1,100
Lamb/pork/other 0.5 12 300
Chicken 0.5 3.7 100
Fish 0.5 3.4 85
Vegies 3 1 150
Fruit 5 1 250
Dairy: yoghurt; milk; cheese
Milk 5 1.3 325
Cheese 0.5 20 500
Yoghurt 1 1.3 65
Figure A1: Itemised family food carbon
footprint for 2019
21
In order to get a better visualisation of the importance of the individual food types shown in the
Table, I have produced the bar graph shown in Figure A2.
The information in the Figure has been categorised into groups to provide the picture shown in
Figure 4.
When computing our food carbon footprint, I only tried to capture the foods which make up our
normal weekly shop. There are of course many other items which we use often in the kitchen but
only need to buy from time to time – eg herbs, spices, sauces, etc.
When transferring this data across to Figure 2 as ‘Food (grocery shopping)’, I separated ‘Coffee (in
cafes)’ from the other items.
Description
Weight
(kg/wk)
Carbon
Intensity
(kg CO2e/kg)
Total CO2e
(kg/year)
Non-dairy: milk; margarine
Almond milk, etc 5 0.6 150
Margarine 0.5 1 25
Coffee (in cafes) 15 cups 0.5kgCO2e/cup 380
Juices 3 0.6 90
Breakfast cereals 0.3 1.2 20
Cakes; biscuits; chocolate 1 1.5 75
Eggs 6 eggs 1.5 30
Bread 0.5 1 25
Spreads 0.1 2.9 15
Frozen: veg; ice cream
Veg 1 2 100
Ice cream 0.5 2 50
Tinned/bottled: beans; fruit; etc 4 2 400
TOTAL 4,235
22
0 200 400 600 800 1,000 1,2
Beef
Cheese
Tinned/bottled: beans; fruit; etc
Milk
Lamb/pork/other
Fruit
Vegies
Almond milk, etc
Chicken
Frozen veg
Juices
Fish
Cakes; biscuits; chocolate
Yoghurt
Ice cream
Eggs
Bread
Margarine
Breakfast cereals
Spreads
Figure A2: Visualisation of our itemised family
food carbon footprint for 2019
23
Appendix 2 References
When trying to ascertain the carbon emission factors I simply Googled for the activity/product
groups listed in Figure 2 and the food types listed in Figure A1. I did not do this in a particularly
rigorous way: I always selected at least three separate sites to ascertain the range of the claimed
emission factors; if the first few sites gave a similar answer I did not go further and I picked what I
thought was a good round number for the average value; if there was no apparent agreement I
opted for the figure that was shown on what I judged to be the most credible site. This process was
crude and involved lots of judgement – the figures in the Tables should therefore be considered to
be purely indicative.
When I was going through this process I noted down values and/or captured the links of particular
sites which I’ve listed below essentially unedited. These may, or may not, have been the sites which
I used to obtain the final emissions factor values which appear in the Tables. While my Googling
appears to be haphazard [I deliberately did not want to get too bogged down in this ‘first cut’ of
going through the research], I would draw the readers’ attention to the ‘Validation’ section in
Chapter 2. I was very happy with the outcomes of the validation – if this had not looked good, I
would have revisited my Googling and taken a much more painstaking approach. [Having said that, I
think it is self-evident that very carefully working through masses of poor and inaccurate data is not
likely to give you any more reliable results.]
My informal notes/web site links are listed below, this only represents a small sample of the sites
that I looked at:
Beef 50-60 kgCO2e/kg (at best): https://www.theland.com.au/story/6527876/beef-must-stop-
ignoring-its-large-co2-footprint/
Beef 75 kgCO2e/kg beef (derived from figure in article):
http://www.fao.org/news/story/en/item/197623/icode/
Beef massive variation in published figures most common figure about 25 kgCO2e/kg (most of these
studies not Australian). CSIRO similar figure: https://www.publish.csiro.au/an/an11030
Fruit and vegies (US): http://www.circularecology.com/news/wonky-fruit-and-veg-the-carbon-
footprint-of-food#.XlYJMWgzZhE
Food Australia (RMIT): https://www.rmit.edu.au/news/all-news/2016/november/new-study-
provides-carbon-footprint-league-table-for-food
Australian cheese: https://milkmaidmarian.com/2018/06/07/the-aussie-dairy-carbon-hoofprint/
Milk – major differences in different publications (could be global differences)
Margarine: https://www.bettermeetsreality.com/the-impact-footprint-of-producing-eating-butter-
margarine/
Coffee: https://www.ecowatch.com/coffees-invisible-carbon-footprint-1882175408.html
Food miles debate: https://www.theguardian.com/environment/2008/mar/23/food.ethicalliving
24
Eggs: https://www.australianeggs.org.au/dmsdocument/521-environmental-assessment-of-an-egg-
production-supply-chain-using-life-cycle-assessment
Bread: https://blog.csiro.au/how-green-is-your-bread/
Cakes etc detailed study: https://www.sciencedirect.com/science/article/pii/S2352550918303087
Sandwich: https://www.theguardian.com/lifeandstyle/2018/jan/25/scientists-calculate-carbon-
emissions-of-your-sandwich
Juices: https://stanfordmag.org/contents/getting-the-most-sustainable-squeeze-from-your-oj-
essential-answer
Peanut butter: https://www.farmprogress.com/peanut/peanut-s-environmental-footprint-stretches-
beyond-farm
Frozen veggies: https://stud.epsilon.slu.se/6377/7/gottfridsson_l_140304.pdf
Ice cream: https://www.benjerry.com/values/issues-we-care-about/climate-justice/life-cycle-
analysis
Nissan Leaf indirect: https://www.carbonbrief.org/factcheck-how-electric-vehicles-help-to-tackle-
climate-change
Latte 340g CO2: https://www.ecowatch.com/coffees-invisible-carbon-footprint-1882175408.html
List of footprints for food: https://www.greeneatz.com/foods-carbon-footprint.html
Australian study food list: http://www.australasianscience.com.au/article/issue-december-
2016/study-provides-carbon-footprint-table-food.html
Family footprint/year: http://shrinkthatfootprint.com/food-carbon-footprint-diet
Wooden furniture: https://www.panelsfurnitureasia.com/en/news-archive/un-wooden-furniture-
reduces-more-carbon-emissions-than-other-materials/462
Newspaper: https://www.theguardian.com/environment/green-living-blog/2010/nov/04/carbon-
footprint-newspaper
Bicycle: https://www.theguardian.com/environment/bike-blog/2012/mar/15/lifecycle-carbon-
footprint-bike-blog
Books: https://www.csbsju.edu/Documents/CSB%20Sustainability/SHM%20e-
readers%20vs.%20books%20poster(0).pdf
Shoes: http://news.mit.edu/2013/footwear-carbon-footprint-0522
Clothes: https://www.systain.com/wp-
content/uploads/2015/09/Systain_Studie_Carbon_Footprint_English.pdf
Internet shopping: https://ctl.mit.edu/sites/default/files/library/public/Dimitri-Weideli-
Environmental-Analysis-of-US-Online-Shopping_0.pdf
Use of internet:
https://www.researchgate.net/publication/238634031_Carbon_footprint_of_the_Internet
25
Mobile phone: https://www.theguardian.com/environment/green-living-blog/2010/jun/09/carbon-
footprint-mobile-phone
Desktop computers:
https://h22235.www2.hp.com/hpinfo/globalcitizenship/environment/productdata/Countries/_Multi
Country/productcarbonfootprint_deskto_2017104233915185.pdf
Washing clothes: https://www.theguardian.com/environment/green-living-
blog/2010/nov/25/carbon-footprint-load-laundry
Hotel room: https://considerategroup.com/carbon-emissions/
Buses efficiency: https://the-riotact.com/the-efficiency-of-buses/57534
Electrical appliances: https://pubs.acs.org/doi/abs/10.1021/es201459c
26
Appendix 3
Carbon Offset Certificate
14,000
K8YUKXAW-33086 March 8, 2020
Dave Southgate
27
About the Author
Dave Southgate retired from the Australian Government Public Service in July 2012 after a 31-year
career as an ‘environmental bureaucrat’. After working for 8 years in government environmental
agencies at both the State and Federal levels he joined the Australian Government Transport
Department in late 1989 and stayed there until he retired. Throughout his time in Transport he
specialised in aircraft noise; in the latter years he also became involved in aviation climate change
issues and developed a particular interest in carbon footprinting.
From 2004 to 2012 Dave was the Australian Government representative on the United Nations
International Civil Aviation Organization (ICAO) Committee on Aviation Environmental Protection
(CAEP). He pursued his interest in carbon footprinting while on CAEP and was a member of the
group that oversaw the development of the ICAO Carbon Calculator.
Not long after his retirement Dave began a process aimed at transforming the energy use patterns in
his 100% fossil fuelled house. This project is aimed at his family becoming ‘Fossil Fuel Free’ (in
essence the goal is for his household to no longer directly buy any fossil based fuels, namely grid
electricity, gas or petrol). Dave has written numerous reports and articles about this project. These
can be viewed and/or downloaded from his website.
Dave has a science/engineering background and has degrees from the Universities of Liverpool,
London (Imperial College) and Tasmania.
You can find consolidated information on our household energy transition project at my website:
https://netzeroemissions.net/

More Related Content

What's hot

Unburnable carbon-2-web-version
Unburnable carbon-2-web-versionUnburnable carbon-2-web-version
Unburnable carbon-2-web-versionwww.thiiink.com
 
Jet collab fx cnty va 2021+
Jet collab fx cnty va 2021+Jet collab fx cnty va 2021+
Jet collab fx cnty va 2021+Avi Dey
 
Letter from Edision Electric Institute 8.23.02
Letter from Edision Electric Institute 8.23.02Letter from Edision Electric Institute 8.23.02
Letter from Edision Electric Institute 8.23.02Obama White House
 
The evolution of the GDP with a scarcity of the natural resources
The evolution of the GDP with a scarcity of the natural resourcesThe evolution of the GDP with a scarcity of the natural resources
The evolution of the GDP with a scarcity of the natural resourcesEfraim Chababe
 
Carbon Tracker Presentation: Anthony Hobley at SITRA, Helsinki, 21 May 2014
Carbon Tracker Presentation: Anthony Hobley at SITRA, Helsinki, 21 May 2014Carbon Tracker Presentation: Anthony Hobley at SITRA, Helsinki, 21 May 2014
Carbon Tracker Presentation: Anthony Hobley at SITRA, Helsinki, 21 May 2014CarbonTracker
 

What's hot (8)

Unburnable carbon-2-web-version
Unburnable carbon-2-web-versionUnburnable carbon-2-web-version
Unburnable carbon-2-web-version
 
Jet collab fx cnty va 2021+
Jet collab fx cnty va 2021+Jet collab fx cnty va 2021+
Jet collab fx cnty va 2021+
 
Letter from Edision Electric Institute 8.23.02
Letter from Edision Electric Institute 8.23.02Letter from Edision Electric Institute 8.23.02
Letter from Edision Electric Institute 8.23.02
 
3 1 2010 New Combined Presentation Kdg[1]
3 1 2010 New Combined Presentation Kdg[1]3 1 2010 New Combined Presentation Kdg[1]
3 1 2010 New Combined Presentation Kdg[1]
 
The evolution of the GDP with a scarcity of the natural resources
The evolution of the GDP with a scarcity of the natural resourcesThe evolution of the GDP with a scarcity of the natural resources
The evolution of the GDP with a scarcity of the natural resources
 
Carbon Tracker Presentation: Anthony Hobley at SITRA, Helsinki, 21 May 2014
Carbon Tracker Presentation: Anthony Hobley at SITRA, Helsinki, 21 May 2014Carbon Tracker Presentation: Anthony Hobley at SITRA, Helsinki, 21 May 2014
Carbon Tracker Presentation: Anthony Hobley at SITRA, Helsinki, 21 May 2014
 
CEI Email 10.15.03
CEI Email 10.15.03CEI Email 10.15.03
CEI Email 10.15.03
 
Carbon footprint
Carbon footprintCarbon footprint
Carbon footprint
 

Similar to 2019 Household Carbon Footprint Report

2021 carbon footprint report
2021 carbon footprint report2021 carbon footprint report
2021 carbon footprint reportDave Southgate
 
2019 Annual Report: Household Energy Transition
2019 Annual Report: Household Energy Transition2019 Annual Report: Household Energy Transition
2019 Annual Report: Household Energy TransitionDave Southgate
 
Becoming a Fossil Fuel Free Family
Becoming a Fossil Fuel Free FamilyBecoming a Fossil Fuel Free Family
Becoming a Fossil Fuel Free FamilyDave Southgate
 
BP Energy Week 2020 : Energy Outlook 2020 presentation
BP  Energy Week 2020 : Energy Outlook 2020 presentationBP  Energy Week 2020 : Energy Outlook 2020 presentation
BP Energy Week 2020 : Energy Outlook 2020 presentationEnergy for One World
 
Integrating Climate into our Strategy
Integrating Climate into our StrategyIntegrating Climate into our Strategy
Integrating Climate into our StrategyTotal
 
2013 – 2014 Strategy and Sustainability Highlights Report
2013 – 2014 Strategy and Sustainability Highlights Report2013 – 2014 Strategy and Sustainability Highlights Report
2013 – 2014 Strategy and Sustainability Highlights ReportSchneider Electric
 
2016 Annual Report - Household energy transition
2016 Annual Report - Household energy transition2016 Annual Report - Household energy transition
2016 Annual Report - Household energy transitionDave Southgate
 
Transformational ownership presentation
Transformational ownership presentationTransformational ownership presentation
Transformational ownership presentationDavidKo66
 
Estimating consumptionbasedgh gemissions_sei2019
Estimating consumptionbasedgh gemissions_sei2019Estimating consumptionbasedgh gemissions_sei2019
Estimating consumptionbasedgh gemissions_sei2019PatrickTanz
 
Planet Positive Presentation
Planet Positive PresentationPlanet Positive Presentation
Planet Positive PresentationPlanetpositive
 
Hazard Presentation ICLEI
Hazard Presentation ICLEIHazard Presentation ICLEI
Hazard Presentation ICLEIcooppower
 
S57146154.pdf
S57146154.pdfS57146154.pdf
S57146154.pdfaijbm
 
Climate Change And The Community 1010
Climate Change And The Community 1010Climate Change And The Community 1010
Climate Change And The Community 1010MarcKarell
 
Bill gates innovating to zero
Bill gates  innovating to zeroBill gates  innovating to zero
Bill gates innovating to zeromzentenoc
 
Bill gates innovating to zero
Bill gates  innovating to zeroBill gates  innovating to zero
Bill gates innovating to zeromzentenoc
 

Similar to 2019 Household Carbon Footprint Report (20)

2021 carbon footprint report
2021 carbon footprint report2021 carbon footprint report
2021 carbon footprint report
 
Annual Report 2020
Annual Report 2020Annual Report 2020
Annual Report 2020
 
Annual report 2021
Annual report 2021Annual report 2021
Annual report 2021
 
2019 Annual Report: Household Energy Transition
2019 Annual Report: Household Energy Transition2019 Annual Report: Household Energy Transition
2019 Annual Report: Household Energy Transition
 
Becoming a Fossil Fuel Free Family
Becoming a Fossil Fuel Free FamilyBecoming a Fossil Fuel Free Family
Becoming a Fossil Fuel Free Family
 
BP Energy Week 2020 : Energy Outlook 2020 presentation
BP  Energy Week 2020 : Energy Outlook 2020 presentationBP  Energy Week 2020 : Energy Outlook 2020 presentation
BP Energy Week 2020 : Energy Outlook 2020 presentation
 
Integrating Climate into our Strategy
Integrating Climate into our StrategyIntegrating Climate into our Strategy
Integrating Climate into our Strategy
 
2013 – 2014 Strategy and Sustainability Highlights Report
2013 – 2014 Strategy and Sustainability Highlights Report2013 – 2014 Strategy and Sustainability Highlights Report
2013 – 2014 Strategy and Sustainability Highlights Report
 
2016 Annual Report - Household energy transition
2016 Annual Report - Household energy transition2016 Annual Report - Household energy transition
2016 Annual Report - Household energy transition
 
Transformational ownership presentation
Transformational ownership presentationTransformational ownership presentation
Transformational ownership presentation
 
Carbon Tax In Canada
Carbon Tax In CanadaCarbon Tax In Canada
Carbon Tax In Canada
 
Better Builder, Issue 31 / Fall 2019
Better Builder, Issue 31 / Fall 2019Better Builder, Issue 31 / Fall 2019
Better Builder, Issue 31 / Fall 2019
 
Estimating consumptionbasedgh gemissions_sei2019
Estimating consumptionbasedgh gemissions_sei2019Estimating consumptionbasedgh gemissions_sei2019
Estimating consumptionbasedgh gemissions_sei2019
 
Planet Positive Presentation
Planet Positive PresentationPlanet Positive Presentation
Planet Positive Presentation
 
Hazard Presentation ICLEI
Hazard Presentation ICLEIHazard Presentation ICLEI
Hazard Presentation ICLEI
 
S57146154.pdf
S57146154.pdfS57146154.pdf
S57146154.pdf
 
Annual Report 2018
Annual Report 2018 Annual Report 2018
Annual Report 2018
 
Climate Change And The Community 1010
Climate Change And The Community 1010Climate Change And The Community 1010
Climate Change And The Community 1010
 
Bill gates innovating to zero
Bill gates  innovating to zeroBill gates  innovating to zero
Bill gates innovating to zero
 
Bill gates innovating to zero
Bill gates  innovating to zeroBill gates  innovating to zero
Bill gates innovating to zero
 

Recently uploaded

(ANIKA) Call Girls Wagholi ( 7001035870 ) HI-Fi Pune Escorts Service
(ANIKA) Call Girls Wagholi ( 7001035870 ) HI-Fi Pune Escorts Service(ANIKA) Call Girls Wagholi ( 7001035870 ) HI-Fi Pune Escorts Service
(ANIKA) Call Girls Wagholi ( 7001035870 ) HI-Fi Pune Escorts Serviceranjana rawat
 
Call Girls South Delhi Delhi reach out to us at ☎ 9711199012
Call Girls South Delhi Delhi reach out to us at ☎ 9711199012Call Girls South Delhi Delhi reach out to us at ☎ 9711199012
Call Girls South Delhi Delhi reach out to us at ☎ 9711199012sapnasaifi408
 
Call Girls in Nagpur Bhavna Call 7001035870 Meet With Nagpur Escorts
Call Girls in Nagpur Bhavna Call 7001035870 Meet With Nagpur EscortsCall Girls in Nagpur Bhavna Call 7001035870 Meet With Nagpur Escorts
Call Girls in Nagpur Bhavna Call 7001035870 Meet With Nagpur Escortsranjana rawat
 
VIP Call Girl Gorakhpur Aashi 8250192130 Independent Escort Service Gorakhpur
VIP Call Girl Gorakhpur Aashi 8250192130 Independent Escort Service GorakhpurVIP Call Girl Gorakhpur Aashi 8250192130 Independent Escort Service Gorakhpur
VIP Call Girl Gorakhpur Aashi 8250192130 Independent Escort Service GorakhpurSuhani Kapoor
 
VIP Call Girls Service Chaitanyapuri Hyderabad Call +91-8250192130
VIP Call Girls Service Chaitanyapuri Hyderabad Call +91-8250192130VIP Call Girls Service Chaitanyapuri Hyderabad Call +91-8250192130
VIP Call Girls Service Chaitanyapuri Hyderabad Call +91-8250192130Suhani Kapoor
 
Russian Call Girls Nashik Anjali 7001305949 Independent Escort Service Nashik
Russian Call Girls Nashik Anjali 7001305949 Independent Escort Service NashikRussian Call Girls Nashik Anjali 7001305949 Independent Escort Service Nashik
Russian Call Girls Nashik Anjali 7001305949 Independent Escort Service Nashikranjana rawat
 
Sustainable Clothing Strategies and Challenges
Sustainable Clothing Strategies and ChallengesSustainable Clothing Strategies and Challenges
Sustainable Clothing Strategies and ChallengesDr. Salem Baidas
 
(NANDITA) Hadapsar Call Girls Just Call 7001035870 [ Cash on Delivery ] Pune ...
(NANDITA) Hadapsar Call Girls Just Call 7001035870 [ Cash on Delivery ] Pune ...(NANDITA) Hadapsar Call Girls Just Call 7001035870 [ Cash on Delivery ] Pune ...
(NANDITA) Hadapsar Call Girls Just Call 7001035870 [ Cash on Delivery ] Pune ...ranjana rawat
 
VIP Call Girls Service Bandlaguda Hyderabad Call +91-8250192130
VIP Call Girls Service Bandlaguda Hyderabad Call +91-8250192130VIP Call Girls Service Bandlaguda Hyderabad Call +91-8250192130
VIP Call Girls Service Bandlaguda Hyderabad Call +91-8250192130Suhani Kapoor
 
Mumbai Call Girls, 💞 Prity 9892124323, Navi Mumbai Call girls
Mumbai Call Girls, 💞  Prity 9892124323, Navi Mumbai Call girlsMumbai Call Girls, 💞  Prity 9892124323, Navi Mumbai Call girls
Mumbai Call Girls, 💞 Prity 9892124323, Navi Mumbai Call girlsPooja Nehwal
 
VIP Call Girls Service Tolichowki Hyderabad Call +91-8250192130
VIP Call Girls Service Tolichowki Hyderabad Call +91-8250192130VIP Call Girls Service Tolichowki Hyderabad Call +91-8250192130
VIP Call Girls Service Tolichowki Hyderabad Call +91-8250192130Suhani Kapoor
 
VIP Call Girls Moti Ganpur ( Hyderabad ) Phone 8250192130 | ₹5k To 25k With R...
VIP Call Girls Moti Ganpur ( Hyderabad ) Phone 8250192130 | ₹5k To 25k With R...VIP Call Girls Moti Ganpur ( Hyderabad ) Phone 8250192130 | ₹5k To 25k With R...
VIP Call Girls Moti Ganpur ( Hyderabad ) Phone 8250192130 | ₹5k To 25k With R...Suhani Kapoor
 
Low Rate Call Girls Bikaner Anika 8250192130 Independent Escort Service Bikaner
Low Rate Call Girls Bikaner Anika 8250192130 Independent Escort Service BikanerLow Rate Call Girls Bikaner Anika 8250192130 Independent Escort Service Bikaner
Low Rate Call Girls Bikaner Anika 8250192130 Independent Escort Service BikanerSuhani Kapoor
 
VIP Call Girls Ramanthapur ( Hyderabad ) Phone 8250192130 | ₹5k To 25k With R...
VIP Call Girls Ramanthapur ( Hyderabad ) Phone 8250192130 | ₹5k To 25k With R...VIP Call Girls Ramanthapur ( Hyderabad ) Phone 8250192130 | ₹5k To 25k With R...
VIP Call Girls Ramanthapur ( Hyderabad ) Phone 8250192130 | ₹5k To 25k With R...Suhani Kapoor
 
History, principles and use for biopesticide risk assessment: Boet Glandorf a...
History, principles and use for biopesticide risk assessment: Boet Glandorf a...History, principles and use for biopesticide risk assessment: Boet Glandorf a...
History, principles and use for biopesticide risk assessment: Boet Glandorf a...OECD Environment
 

Recently uploaded (20)

(ANIKA) Call Girls Wagholi ( 7001035870 ) HI-Fi Pune Escorts Service
(ANIKA) Call Girls Wagholi ( 7001035870 ) HI-Fi Pune Escorts Service(ANIKA) Call Girls Wagholi ( 7001035870 ) HI-Fi Pune Escorts Service
(ANIKA) Call Girls Wagholi ( 7001035870 ) HI-Fi Pune Escorts Service
 
Call Girls South Delhi Delhi reach out to us at ☎ 9711199012
Call Girls South Delhi Delhi reach out to us at ☎ 9711199012Call Girls South Delhi Delhi reach out to us at ☎ 9711199012
Call Girls South Delhi Delhi reach out to us at ☎ 9711199012
 
Call Girls in Nagpur Bhavna Call 7001035870 Meet With Nagpur Escorts
Call Girls in Nagpur Bhavna Call 7001035870 Meet With Nagpur EscortsCall Girls in Nagpur Bhavna Call 7001035870 Meet With Nagpur Escorts
Call Girls in Nagpur Bhavna Call 7001035870 Meet With Nagpur Escorts
 
VIP Call Girl Gorakhpur Aashi 8250192130 Independent Escort Service Gorakhpur
VIP Call Girl Gorakhpur Aashi 8250192130 Independent Escort Service GorakhpurVIP Call Girl Gorakhpur Aashi 8250192130 Independent Escort Service Gorakhpur
VIP Call Girl Gorakhpur Aashi 8250192130 Independent Escort Service Gorakhpur
 
VIP Call Girls Service Chaitanyapuri Hyderabad Call +91-8250192130
VIP Call Girls Service Chaitanyapuri Hyderabad Call +91-8250192130VIP Call Girls Service Chaitanyapuri Hyderabad Call +91-8250192130
VIP Call Girls Service Chaitanyapuri Hyderabad Call +91-8250192130
 
Russian Call Girls Nashik Anjali 7001305949 Independent Escort Service Nashik
Russian Call Girls Nashik Anjali 7001305949 Independent Escort Service NashikRussian Call Girls Nashik Anjali 7001305949 Independent Escort Service Nashik
Russian Call Girls Nashik Anjali 7001305949 Independent Escort Service Nashik
 
E Waste Management
E Waste ManagementE Waste Management
E Waste Management
 
Sustainable Clothing Strategies and Challenges
Sustainable Clothing Strategies and ChallengesSustainable Clothing Strategies and Challenges
Sustainable Clothing Strategies and Challenges
 
(NANDITA) Hadapsar Call Girls Just Call 7001035870 [ Cash on Delivery ] Pune ...
(NANDITA) Hadapsar Call Girls Just Call 7001035870 [ Cash on Delivery ] Pune ...(NANDITA) Hadapsar Call Girls Just Call 7001035870 [ Cash on Delivery ] Pune ...
(NANDITA) Hadapsar Call Girls Just Call 7001035870 [ Cash on Delivery ] Pune ...
 
VIP Call Girls Service Bandlaguda Hyderabad Call +91-8250192130
VIP Call Girls Service Bandlaguda Hyderabad Call +91-8250192130VIP Call Girls Service Bandlaguda Hyderabad Call +91-8250192130
VIP Call Girls Service Bandlaguda Hyderabad Call +91-8250192130
 
Call Girls In R.K. Puram 9953056974 Escorts ServiCe In Delhi Ncr
Call Girls In R.K. Puram 9953056974 Escorts ServiCe In Delhi NcrCall Girls In R.K. Puram 9953056974 Escorts ServiCe In Delhi Ncr
Call Girls In R.K. Puram 9953056974 Escorts ServiCe In Delhi Ncr
 
Mumbai Call Girls, 💞 Prity 9892124323, Navi Mumbai Call girls
Mumbai Call Girls, 💞  Prity 9892124323, Navi Mumbai Call girlsMumbai Call Girls, 💞  Prity 9892124323, Navi Mumbai Call girls
Mumbai Call Girls, 💞 Prity 9892124323, Navi Mumbai Call girls
 
Model Call Girl in Rajiv Chowk Delhi reach out to us at 🔝9953056974🔝
Model Call Girl in Rajiv Chowk Delhi reach out to us at 🔝9953056974🔝Model Call Girl in Rajiv Chowk Delhi reach out to us at 🔝9953056974🔝
Model Call Girl in Rajiv Chowk Delhi reach out to us at 🔝9953056974🔝
 
VIP Call Girls Service Tolichowki Hyderabad Call +91-8250192130
VIP Call Girls Service Tolichowki Hyderabad Call +91-8250192130VIP Call Girls Service Tolichowki Hyderabad Call +91-8250192130
VIP Call Girls Service Tolichowki Hyderabad Call +91-8250192130
 
VIP Call Girls Moti Ganpur ( Hyderabad ) Phone 8250192130 | ₹5k To 25k With R...
VIP Call Girls Moti Ganpur ( Hyderabad ) Phone 8250192130 | ₹5k To 25k With R...VIP Call Girls Moti Ganpur ( Hyderabad ) Phone 8250192130 | ₹5k To 25k With R...
VIP Call Girls Moti Ganpur ( Hyderabad ) Phone 8250192130 | ₹5k To 25k With R...
 
Low Rate Call Girls Bikaner Anika 8250192130 Independent Escort Service Bikaner
Low Rate Call Girls Bikaner Anika 8250192130 Independent Escort Service BikanerLow Rate Call Girls Bikaner Anika 8250192130 Independent Escort Service Bikaner
Low Rate Call Girls Bikaner Anika 8250192130 Independent Escort Service Bikaner
 
VIP Call Girls Ramanthapur ( Hyderabad ) Phone 8250192130 | ₹5k To 25k With R...
VIP Call Girls Ramanthapur ( Hyderabad ) Phone 8250192130 | ₹5k To 25k With R...VIP Call Girls Ramanthapur ( Hyderabad ) Phone 8250192130 | ₹5k To 25k With R...
VIP Call Girls Ramanthapur ( Hyderabad ) Phone 8250192130 | ₹5k To 25k With R...
 
History, principles and use for biopesticide risk assessment: Boet Glandorf a...
History, principles and use for biopesticide risk assessment: Boet Glandorf a...History, principles and use for biopesticide risk assessment: Boet Glandorf a...
History, principles and use for biopesticide risk assessment: Boet Glandorf a...
 
Call Girls In Delhi 9953056974 (Low Price) Escort Service Pushp Vihar
Call Girls In Delhi 9953056974 (Low Price) Escort Service Pushp ViharCall Girls In Delhi 9953056974 (Low Price) Escort Service Pushp Vihar
Call Girls In Delhi 9953056974 (Low Price) Escort Service Pushp Vihar
 
Green Banking
Green Banking Green Banking
Green Banking
 

2019 Household Carbon Footprint Report

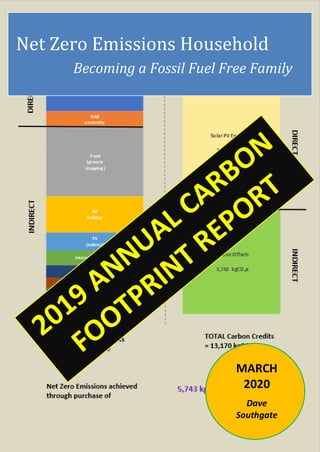
  • 1. 1 Net Zero Emissions Household Becoming a Fossil Fuel Free Family MARCH 2020 Dave Southgate
  • 2. 2 Foreword The world is in a climate emergency. Unfortunately, many governments around the world are either unwilling, or unable, to take effective action against this existential threat. I believe that in this policy vacuum individuals can make a useful contribution to reducing global carbon emissions. However, in order to do this effectively we need to have a detailed knowledge of the composition of our individual and household carbon footprints. My family has spent a number of years reducing our direct carbon footprint and we have dramatically cut, or eliminated, our purchases of grid electricity, gas and petrol. Given the current circumstances I have decided that we now need to work on reducing our indirect carbon footprint – reducing the CO2 emissions that are embedded in the things we buy and the services we use. In order to do this we first need to understand the makeup of our indirect footprint. This report is my first attempt at breaking down my family’s indirect footprint into its constituent parts. The aim is to reveal the areas where we can take the most effective action to reduce our indirect emissions. As an initial step I have analysed our total footprint for 2019 and have produced a ‘net zero emissions’ outcome for the year by buying carbon offsets. In future years I propose to take more concrete action to reduce our total carbon footprint. Dave Southgate Canberra March 2020
  • 3. 3 Household Carbon Balance Sheet 2019 Debits Credits 5,743 kgCO2e carbon offsets DIRECTINDIRECT Net Zero Emissions achieved through purchase of TOTAL Carbon Credits = 13,170 kgCO2e TOTAL Carbon Debits = 13,170 kg CO2e DIRECTINDIRECT Petrol Grid electricity Food (grocery shopping) NZ Holiday EV (indirect) Internet/computing Clothes Food (eating out) Coffee (lattes) Other Solar PVExported 7,427 kgCO2e Carbon Offsets 5,743 kgCO2e
  • 4. 4 Background I retired in 2012 after a 31-year career as an environmental bureaucrat. I consider myself privileged to have had the opportunity to spend the last decade of my career working on climate change issues at both the national and international level. However, in the end I became very concerned about the inability of the global governance system to take the steps necessary to control the polluting impacts of carbon dioxide and other greenhouse gases. Against this background, when I retired I determined that I would tackle the problem from the bottom up and try to minimise, and hopefully eliminate, my family’s direct emissions of carbon dioxide. My family began a journey to become fossil fuel free (FFF) by transitioning our household energy use. I wrote about the beginning of this journey in my book Our Household Energy Transition: Becoming a Fossil Fuel Free Family which I released in February 2016. I have subsequently produced four Annual Reports which document, and discuss, the energy and carbon footprint outcomes of our energy transition program. Our project to be Fossil Fuel Free relates only to our direct carbon footprint. That is, our aim is to no longer directly buy any fossil fuel based energy – gas, petrol or grid electricity. However, I have been fully aware throughout our transition, and other people have often reminded me, that our direct carbon footprint is only part of the problem. What about the carbon emissions embedded in our consumption of goods and services – our indirect carbon footprint? I initially focussed on our direct footprint because it is the part of our footprint that we directly control. We know very accurately how much energy we are using. I can closely monitor this in real time and adjust our behaviour accordingly. On the other hand, the indirect carbon footprint of our consumption patterns is not clearly defined and it requires a lot of detailed (usually unknown) information to compute its magnitude. In my transition Annual Report for 2019 I indicated that I had decided to close Phase 1 of our energy transition project at the end of 2019 and to open Phase 2 in 2020. In Phase 2 I intend to expand our aims: while being Fossil Fuel Free (ie no direct purchase of fossil based fuels) will remain our primary (and most difficult to achieve) goal; we will also aim to have ‘net zero emissions’ (NZE) for our consumption on an ongoing annual basis. This means that from this point on, each year I will attempt to compute, report and manage both our direct and indirect carbon footprints. This change in direction was largely inspired by the recent surge in public interest in the implicit Paris Agreement goal of the world having to reach ‘net zero emissions’ by 2050. Ideally the whole world will be ‘fossil fuel free’ by this stage but I guess that is being overly ambitious. I see aiming to have net zero emissions, which by definition involves the trading of carbon debits and credits, as being a good transition compromise. It certainly beats the climate change inertia that has captured most of the globe over the past few decades. I have tried to keep discussion in this report to a minimum. My aim is to describe, as simply as possible, the carbon accounting behind our household having net zero emissions for 2019. In essence, this process involved computing both our direct and indirect carbon footprints (our carbon debits) and then identifying ways in which we could negate those emissions (via carbon credits) to achieve a balanced carbon budget.
  • 6. 6 Chapter 1 Direct Debits & Credits Debits As I’ve just discussed in the Background, we have been working for a number of years to reduce our direct use of fossil fuel based energy as part of our project to become a Fossil Fuel Free Family. Figure 1 gives a breakdown of our energy use over 2019. This Figure is extracted from my Annual Report for 2019 and the reader is invited to look at this document if you want more detailed information. It can be seen that in 2019 we sourced about 40% of our household energy use from our solar PV systems. I have converted our fuel consumption data into CO2e emissions using the Government’s published greenhouse accounts factors. The values for our petrol and grid electricity carbon footprints are shown in Figure 2 in the next Section. Credits In my 2019 Annual Report I also discuss our solar PV production and export for the year. We exported 9,169 kWh of solar PV electricity in 2019. I have converted this to a carbon credit of 7,427 kgCo2e using the published greenhouse accounts factors and assuming that each kWh of solar PV (carbon zero) electricity that we exported displaced one kWh of grid (mainly coal based) electricity. I discuss this conversion in my Annual Report. Grid Electricity 7% Self-consumed direct solar PV 30% Self-consumed solar PV (via battery) 11% Petrol 52% Total Grid Electricity Consumption 2019 = 1,113 kWh Figure 1: Breakdown of our household energy use 2019
  • 8. 8 Chapter 2 Introduction Computing one’s direct carbon footprint is very straightforward. The energy user knows very accurately, from their energy bills, how much fuel they have used over a period of time. The amount of fuel used can easily be converted into carbon emissions through the application of the published greenhouse accounts factors. By way of contrast, computing one’s indirect carbon footprint is not straightforward. It generally involves delving into many layers of data and making many assumptions. For example, if I buy a widget I can normally find out which country it is ‘made’ in. However, the product may contain many components which have been sourced from all over the world. Indeed, different batches of the same product may have components from quite different origins or be made from different materials. All these unknowns impact on the magnitude of a product’s carbon footprint. Unless one is carrying out a detailed examination of a particular product one has to accept that the outcome of indirect carbon footprinting computations is only likely to be a gross estimate. This paper is a first attempt at computing an estimate of my family’s indirect carbon footprint. I hope this will give us an indication of which of our patterns of consumption are the ones needing most attention. This document is not intended to be a scientific treatise. I have therefore tried to keep the language and concepts simple by avoiding many of the niceties that the specialist carbon accountant would use. I have done this not only to appeal to a wider audience but also because I see little value in getting bogged down in detail when I am only seeking to obtain high level estimates of my family’s indirect carbon footprint. My Indirect Footprint is your Direct Footprint While this may be self-evident to some readers, I think this topic is worth a short discussion. If I buy a widget from small business manufacturer and distributor Fred, the CO2 emissions for my widget, which add to my indirect carbon footprint, equal the widget’s CO2 contribution to Fred’s direct footprint since he was the person that directly used the energy in the making and transport of the product. Problems can arise if for some reason Fred and I want to report our combined carbon footprint (including both our direct and indirect footprints). If we simply sum up our individual footprints the carbon footprint for the widget will be counted twice (once in my indirect footprint and once in Fred’s direct footprint). Look out for double counting when venturing into the world of indirect carbon footprinting! What’s the value of indirect footprinting then if all CO2 emissions are reported somewhere in the system as someone’s direct footprint? Let’s imagine after I bought my widget from Fred I need another one and I become aware of manufacturer/distributor Freda. Unlike Fred who uses grid electricity and a diesel delivery van, Freda uses solar PV electricity to manufacture the widget and delivers it in an EV. Naturally I want to buy my next widget from Freda because of its low embedded CO2 content (and probably much cheaper price). The outcome? My indirect, and therefore total, carbon footprint is reduced and so is Fred’s. Poor Fred is now out of business because his carbon intense business model (coal based electricity and diesel transport fuel) has failed – his direct carbon
  • 9. 9 footprint is now zero! My knowledge of my indirect carbon footprint has helped me to reduce the size of the world’s carbon footprint. Export of carbon footprint Another aspect of indirect carbon footprinting which I believe is important relates to the export of pollution. Over the past few decades, the west has outsourced much of its manufacturing to China and other Asian countries. Instead of CO2 (and other pollutants) arising from the manufacture of goods consumed in the west being registered against the western countries these are recorded against the offshore countries. On a global scale the quantum of emissions may not have changed, but the CO2 emissions are now registered as direct emissions against say China, rather than against say Australia. A country can reduce its direct CO2 emissions simply by offshoring polluting industries. I often find it sad when a commentator is berating China for its growing carbon footprint when at least some (maybe quite a lot?) of that growth is associated with the manufacture of goods that are exported to the west. I think it is doubly sad for Australia when much of an offshore country’s direct carbon footprint derives from coal and/or gas which it has imported from Australia. I think there are strong arguments for countries reporting both their direct and indirect carbon footprints for information and transparency purposes (recognising double counting complexities). Computing the Indirect Footprint Unlike our direct footprint which I can monitor and report myself, I was totally reliant on the work of other researchers to compute our indirect footprint for 2019. To gain a background understanding of indirect footprinting I set out by reading the Mike Berners-Lee book How Bad Are Bananas? The Carbon Footprint of Everything. While I certainly don’t accept everything in the book, I found it gave me an excellent feeling for the task in hand. Initially, I listed as best I could the main products which my family had bought, and the activities we had been involved in, over 2019. I deliberately did not attempt to evaluate the carbon footprint of products which we bought in earlier years (eg our house). Armed with this list I then attempted to compute our annual carbon footprint for each of the identified products/activities based on factors I could find in the published literature. When starting my literature search, it very quickly became evident that there is no shortage of material. I was quite surprised at the range of products and/or activities that have been carbon footprinted over the past decade. On some topics, for example food, the range of papers and references is almost overwhelming. Given this, it is not surprising that there are enormous differences between the footprints being reported for the same items. My approach to picking the ‘right’ answer was to: firstly look for work directly relating to Australia (the computations in much of the published work relate to either the US or Europe); to give priority to academic papers over those produced by parties with an apparent commercial interest (there is a surprising number of these); and to give priority to the most recent work (carbon footprints can evolve rapidly). I worked through the list and arrived at the results shown in Figure 2. The Table also shows the values for our direct footprint (see Chapter 1). I have included a list of references in Appendix 2 at the end of the document. Not surprisingly, in developing the Table I came across many issues which I could not resolve and therefore there were quite a number of items which I could not carbon footprint. I discuss these briefly in the notes following the Table.
  • 10. 10 CO2 Emissions Type CO2e Source Amount Wt CO2e (kg) Comments DIRECT Petrol 7,990 kWh 1,900 Grid Electricity 1,113 kWh 900 TOTAL Direct 2,800 INDIRECT Food (grocery shopping) 3,855 See Appendix 1 Flying (fuel) 4 seats SYD-CHC 1,230 NZ Holiday Jan 2019 (includes indirect footprint for fuel) New EV (Leaf) (mfr) 1 1,000 10tCO2e. Count over 10 years Holidays/hotels 1 800 NZ holiday driving 2,000km + 30kgCO2e/night for hotels Clothes 100 items 700 7 kgCO2e/garment Food (eating out) 600 5 lunches + 1 family meal/week Coffee 750 cups 380 Internet 4 persons 320 80 kgCO2e/person Desk top computing 4 computers 300 60 kgCO2e/y + printer Mobile phone 4 200 50kg/yr Public Transport 5,000 km 200 Electricity (indirect for both grid + solar PV) 190 100 kgCO2e for grid + 90 kgCO2e for solar PV Shoes 10 pairs 150 Newspapers 300 150 0.5 kgCO2e/edition Library books 250 125 5 kgCO2e/book; book read 10 times Petrol (indirect) 100 Scope 3 emission factors Washing clothes 200 washes 45 220 gCO2e/wash for washing machine New bike (mfr) 1 25 250 kgCO2e. Count over 10 years TOTAL Indirect 10,370 TOTAL CARBON FOOTPRINT 13,170 Figure 2: Breakdown of my family’s direct and indirect carbon footprints for 2019
  • 11. 11 Notes 1. In arriving at the numbers in the Table, I became acutely aware of the need to avoid ‘double counting’. For example, the literature commonly identifies electricity use as one of the key components of the indirect footprint of many domestic activities (eg washing clothes). However, I have already counted our electricity use in our direct footprint and I therefore did not include it again when reporting an indirect footprint. 2. I was not able to arrive at a quantitative value for the indirect footprint for some of the items I had initially identified as being part of our family indirect carbon footprint: Aviation: The figure for ‘flying’ in the Table for our NZ holiday includes indirect CO2 emissions for the fuel but it does not include any CO2 allocation for infrastructure (eg for the manufacture of the aircraft or the construction of the airports). Even if I knew the total CO2 generated by these activities what would be my family’s contribution given there are billions of aviation passengers flying round the world each year? Cycling: Nearly all carbon footprinting of cycling that I found focusses on the amount of extra food eaten by the cyclist. I did not want to compute this as it would be double counting – this is already covered in my ‘Food’ category in the Table. To be complete one would also need to compute the CO2 generated by the construction/maintenance of the bike paths and roads which we ride on. This would capture most of the roads/paths in Canberra. Again, even if I had this figure how would it be allocated between car drivers, cyclists, walkers, etc? Cleaning: There is a plethora of articles on the carbon footprint or ‘greenness’ of cleaning agents. Unfortunately, I was unable to find any data that I could trust. We normally carry out our cleaning using cold water. The electricity used by our cleaning machines (eg vacuum cleaner) is captured by our direct footprint. TV; videos: It is not hard to find references to studies that have been carried out into the carbon footprint of producing TV programs; movies; etc. Clearly the CO2 emissions from producing a major blockbuster movie are huge. However, the audiences are equally huge. Major events are watched by billions of people. How do I work out my CO2 contribution if I, along with millions of others, watch one game of soccer on the TV? Health: Clearly a visit to a doctor, dentist, or a hospital has a carbon footprint. The health sector is one of the major sectors in our economy. The challenge is to break down the footprint into digestible parts. How much carbon can be attributed to the training of my doctor or dentist? What about their specialist equipment? If we knew the answer to those questions how much could be allocated to us? Luckily my family has, to date, not troubled the health services too much. Electronics: As a family we always seem to buying lots of bits and pieces of electronic ‘stuff’. How do you carbon footprint little odd gadgets? I must admit my main concern with a lot of these small light items relates more to disposal than to the footprint of manufacture; transport; etc
  • 12. 12 Tradies: We seem to have a lot of visits from trades people (mainly electricians). I imagine that the main contribution to the CO2 emissions of these visits derives from the vehicles they drive but I have no information on their travel routes (bring on the Tesla Cybertruck!). I did not attempt to quantify this value. Heaters; etc Over the year we bought a few electrical low energy heating/cooling devices as part of our energy transition project. While it is not too hard to find the results of carbon footprinting for this category of household appliances, it almost always focusses on electricity use. As I’ve stated earlier this is not an issue for this exercise as our electricity use is covered off in our direct carbon footprint. However, I was not able to find any work relating to the carbon footprint of the manufacture/distribution of these types of devices. 3. The data in the Table only includes our family’s private carbon footprint. My wife travels for work, sometimes overseas; I have not included the CO2 from these trips. In my view employers are responsible for managing the carbon footprints of their employees when they are at work. Validation Having a science/engineering background the first question I always ask myself after making some computations is ‘are these numbers reasonable?’. This document contains my first attempt at computing our total household footprint therefore I was particularly keen to validate the results shown in Figure 2. I have a great deal of confidence in my computations for our direct carbon footprint – after all, the CO2 values are simply derived from our electricity bills and petrol dockets using the Government’s published emission factors. Very solid energy/CO2 data! On the other hand, after working through the literature I was very wary about the robustness of my computations of our indirect carbon footprint. Many of the factors I used appeared to be little more than guesstimates. Clearly there are many products/activities that I wasn’t able to include (see a sample of a few of these in the notes under Figure 2). If I had included these, and made more detailed examinations of the areas listed in the Table, would the total indirect carbon footprint be materially different? I was initially comforted by the fact that the ABC reports that in Australia ‘an average of 14 tonnes (14,000 KG (sic)) [of CO2 is emitted] per household each year’. However, on closer examination it appears that this figure simply relates to a household’s direct carbon footprint [I have not been able to find a reliable estimate of the proportion of an Australian home’s carbon footprint that is direct, but it appears this is typically around 50%]. A more comprehensive footprinting source indicates that ‘A typical U.S. household has a carbon footprint [including both direct and indirect emissions] of 48 t CO2e/yr.’ With this information in mind I used two different carbon calculators (there are many of these on the net) to compute our household carbon footprint. The first of these gave an answer of 12.9 tonnes of CO2/yr; the second produced a figure of 9.9 tonnes of CO2/yr. Given the above, I’m happy that my indirect carbon footprint calculations are in the right ballpark. These will of course need to be refined in the carbon footprint reports for future years.
  • 13. 13 Discussion I have translated the indirect carbon data in Figure 2 into the visualisation in Figure 3. Food immediately jumps out as the overwhelming contributor to our household indirect carbon footprint. It makes up about 40% of this footprint. Given the importance of this component I have given a detailed breakdown of food’s contribution to our family footprint in Appendix 1. If the food carbon footprint is broken down into broad food groups an interesting picture emerges (Figure 4). Almost 90% of our food carbon footprint falls into only three groups: meat/fish; veg/fruit; and dairy. I’m not sure what a dietician would say about this. Anyway, it is easy to see why a vegan diet is being promoted as a good way to reduce your carbon footprint! Figure 4: Broad breakdown of my family’s food carbon footprint for 2019 0 500 1,000 1,500 2,000 2,500 3,000 3,500 4,000 4,500 Food (grocery shopping) Flying (NZ Holiday) New EV (Leaf) NZ Holiday (hire car + hotels) Clothes Food (eating out) Coffee (lattes) Internet Desk top computing Mobile phones Public Transport Electricity (indirect for both grid + solar PV) Shoes Newspapers Library books Petrol (Indirect) Washing clothes New bike Figure 3: Breakdown of my family’s indirect carbon footprint for 2019 Meat/fish Veg/fruit Dairy Juices + non-dairy milk Cakes/biscuits Eggs + margarine Bread/cereals
  • 14. 14 It is also interesting to breakdown our total (direct + indirect) footprint into broad categories. This picture is shown in Figure 5. Amongst other things, this shows the significant contribution that is made by a short overseas holiday taken relatively close to home. It is also interesting to note that apart from ‘clothes’ and ‘EV (indirect)’ all the categories in the Figure involve products that are, to all intents and purposes, immediate consumables. Sadly, these days even ‘clothes’ are often little more than short term consumables. I see our New Nissan Leaf, which we bought in August 2019, as a long-term product and it can be seen that its indirect footprint makes quite a sizeable contribution to our total footprint. It is estimated that 10 tonnes of CO2 are generated in the manufacture of a Leaf. I intend to allocate 1t CO2/yr to our carbon debits for 10 years to pay off this carbon debt. Figure 5: Our total 2019 carbon footprint shown in broad categories Food (groceryshopping) NZ Holiday Petrol Grid electricity Clothes EV (indirect) Internet/computing Food (eatingout) Coffee (lattes) Other
  • 15. 15 Chapter 3 Managing Our Carbon Footprint As indicated earlier, the key aims of our energy transition project is now to have net zero emissions, computed on an annual basis, from this year going forward. In simple terms I will compute our direct and indirect carbon footprints at the end of each year to work out our annual ‘carbon debt’. At the same time, I will compute the carbon footprint of our total solar PV export to give us our annual ‘carbon credit’ [see discussion below]. If our credit exceeds our debt, I will take no action. If our debt exceeds our credit, I will buy some form of external carbon credits to provide us with a balanced annual carbon budget. Direct Footprint We, as a family, have spent the last 6 years working to reduce our direct carbon footprint. As mentioned in the Background to this document, you can find the reports I have written on this work on my website. I have given some brief details of the magnitude and composition of our direct footprint for 2019 in Chapter 1. At the time of writing we are in the process of installing an additional 6kW of solar PV on the roof of our house. The aim is to both reduce our use of grid electricity (which mainly occurs during three months over winter) and to generate carbon credits which I intend to use to balance our carbon account. Time will tell how successful this will be, but I anticipate that this additional solar PV will go a very long way to wiping out our annual carbon deficit. The main source of our annual direct carbon footprint over recent years has been petrol used in our Hyundai i30. We have been slowly using this car less and our acquisition of the Gen 2 Nissan Leaf in 2019, with its larger battery compared to our previous 2012 Nissan Leaf, has enabled us to take more of our family drives without using petrol. Nevertheless, I imagine that we will be using the i30 for a few years yet – hopefully a suitable EV or PHEV will present itself soon. Indirect Footprint Having just computed our indirect carbon footprint for the first time, I have yet to get my mind around how we may reduce our indirect footprint. The most obvious target for reducing our indirect carbon debts is the ‘food’ basket. I can’t envisage us suddenly going vegan or vegetarian, but I will try to eat less beef and increase my consumption of chicken. Maybe when it’s my turn to cook I’ll try to slip in a vegetarian meal or two. I would hope that we can manage some carbon reductions in the meat segment of our indirect carbon pie. One carbon segment that goes up and down from year to year is ‘holidays’. Sometimes we take holidays in Australia; other times we go on long-haul trips. I originate from the UK and my wife is from Malaysia and therefore family visits are important for us. Overall I can’t see us making any great inroads into our indirect carbon footprint in the near term. Having said that, I can think of ideas that would help us. For example, we (and I imagine many other people) have no real idea about the size of the carbon footprint of an item we are buying – this value is dependent on many variables – so it would be helpful if some form of carbon footprint labelling scheme were introduced. A labelling scheme was going to introduced about a decade ago, but I
  • 16. 16 have no idea what happened. I’m certainly not aware of it being taken up. Nevertheless, articles promoting the concept do still appear from time to time. On a related theme, the issue of ‘food miles’ never seems to go away. There certainly seems to be a perception that it is best to buy products that are made as close as possible to where you live. This thinking is based on the not unreasonable assumption that transport makes up a significant proportion of the indirect carbon footprint of most products and therefore ‘buying local’ will reduce the size of the footprint. Unfortunately, as far as I can tell, this is often not the case and I have read quite a few articles that suggest ‘food miles’ is a misleading concept. Bring on some verifiable footprinting labels! Carbon Credits This is where things start to get messy. When you move into the world of ‘net’ carbon footprinting you are, by definition, moving into an area where there is some form of trading between positive and negative footprints. To achieve ‘net zero emissions’ some form of carbon credit will usually be used to balance a carbon debit. This can be done in a number of ways, but it is often a contested space which leaves many people feeling that any carbon reductions are ‘notional’ rather than ‘actual’. Carbon credits under your direct control I am most comfortable with using credits which I can physically generate and monitor myself. For example, I can add a large solar PV system to the roof of my house and claim any exported (carbon free) exports as credits. I think this is fine, but some people would cry foul if I had sold my STC credits to my solar installer when the system was installed – they would say that I had already sold my solar PV credits and therefore I could not validly count them again to compute my net zero emissions status (back to double counting). This could get into a long and tortuous debate but my current position (I’m happy to be corrected) is that the annual Carbon Accounts contained in this document relate solely to a private ‘carbon bubble’ that I have created for our household. I have done this solely to help us understand, and take steps to reduce, our family carbon footprint. I am not trying to claim any broader validity from this work (eg to get some form of monetary payment from a third party). In these circumstances I have no problem with using our solar PV production as a credit in my informal ‘net zero emissions’ calculations. Some may see planting and looking after trees as a form of ‘concrete’ carbon credit. They can physically monitor the status of their credits. Some years ago I bought some biochar, with a view to adding it to the soil in my garden, just to put my toe into the ‘sinks’ side of reducing the level of CO2 in the atmosphere. I found this extremely expensive (on a $/kg of CO2 basis), and not as satisfying as installing solar PV but I think biochar is a technology that could play an important role in reducing carbon impacts. Buying offsets This is an area that worries many people. You pay money and then it disappears! You simply have to trust that your money will be used to take steps that will reduce atmospheric CO2 (eg build a wind farm or create a plantation forest). Putting the trust/transparency issue to one side, many environmentalists believe that buying offsets is a cheap way to avoid taking necessary direct action to reduce your own carbon impacts. At one level this is true, but if I have say $10,000 to spend is it better to spend this in my own backyard to
  • 17. 17 achieve a carbon reduction of xkt of CO2 or to spend it offshore and achieve a carbon reduction of 10xkt of CO2? Again putting aside any trust/transparency issues, clearly the latter option gives the best carbon outcome for the planet. This is a fraught topic, but I must admit that I can see merit in, and indeed do buy, carbon offsets. I recently bought offsets for the flights we took on a short family holiday in January this year. I believe the key to buying offsets is to make sure that they are being sold by a body with good standing (with a reputation to lose if dodgy dealings are revealed) and they are backed by some form of certified scheme (preferably government). For example, I am very comfortable buying offsets from Qantas. In the end I guess much of this debate goes to personal values. Some people will not buy offsets but will do everything within their power to reduce their indirect carbon footprint by lifestyle change: go vegan; no longer fly; only buy clothes from op shops; etc. I think this is terrific, but one key point for me is that throughout our household energy transition project I have been trying to demonstrate that one can both enjoy a ‘normal’ lifestyle and have a minimal carbon footprint. Offsets are likely to play some part in this latter scenario if you want to have a net zero emissions impact. Managing our Carbon Footprint going forward You can see from the carbon balance sheet at the front of this document that I have arrived at zero net emissions for our household for 2019 by purchasing CO2 offsets (see also Appendix 3). I did this simply to establish a baseline for our total carbon footprint. Where do we go from here? We will continue to work hard on our direct carbon footprint. The biggest target now is our indirect carbon footprint. As I said a little earlier, I guess the most obvious response is to examine the breakdown of our indirect footprint and start to tackle the major sources of CO2. Beef and cheese clearly stand out as areas where we could make big carbon gains – I think we can probably cut down on our consumption of these foods but I don’t think elimination is an option for us at the moment. Having said that, I am much more attracted to looking at ways to increase our ‘footprint credits’ rather than decrease our ‘footprint debits’. In my experience, when trying to bring about change it is always much easier to offer someone something new than it is to tell them to stop doing something they enjoy. An indirect carbon footprint captures the essence of a person’s lifestyle. If buying offsets is going to be part of the ‘something new’ then I think there are hurdles. When I was going through the simple process of buying offsets to give us ‘net zero emissions’ for 2019, I was very disappointed in the offset offerings for individual Australians. While there appear to be quite a number of Australian companies offering corporate offsets, I was not able to find an Australian site that provides a good service for individuals. In the end I bought my offsets from a US site which appears to be credible (although the user interface certainly has some limitations (eg it only accepts weights in pounds)). The price of the offsets (at approximately $10USD/kgCO2) appears worryingly low – I paid approximately $110AUD to purchase my offsets (I bought a little bit more than necessary to provide a small buffer). I also only have the broadest description of the types of projects my money will be spent on – I find this particularly unsatisfactory. As noted earlier, at the time of writing we are in the process of adding an additional 6kW of solar PV to the roof of our house – this will take us to a total solar PV capacity of about 16kW. I’m hoping that in a full year this should largely remove the need for us to buy any indirect carbon credits to become ‘net zero carbon’. If we do need to buy credits in the future, I plan on looking for a much more concrete offerings than the usual ill-defined carbon offsets. For example, I would look to buy a share in a solar or wind farm
  • 18. 18 where I can be allocated a set proportion of the farm’s total annual output and receive notification of, or at least be able to compute, the amount of renewable energy (carbon credits) that I have generated each year. There are many community energy projects up and running in Australia (see for example SolarShare which is a community solar company based in Canberra). Finally, just to emphasise what I implied earlier in the paper, I don’t see ‘net zero emissions’ as being the end of the game. The world needs to ultimately reach a state of being ‘Fossil Fuel Free’. I envisage that once we, as a family, have a good handle of what we need to do to become ‘net zero carbon’ we will push on and aim to develop an excess of credits so that we are able to make a positive (ie negative) contribution to the world’s carbon budget.
  • 20. 20 Appendix 1 Food It can be seen from the information I have provided in Chapter 2 that for my family food dominates our indirect carbon footprint. I imagine this is the same for most families. In fact for us, after years of working on our direct carbon footprint, food also dominates our total carbon footprint. Given this, I had little choice but do a more detailed assessment of the footprint contributions of the all the different things in our grocery shopping basket. As with my analysis in Chapter 2, I relied on searching the internet to find CO2 emission factors for each of the food types I needed to cover. I have shown the outcomes of this work in Figure A1. It is important to note that there are very diverse values in the literature for the carbon footprint of any given food type. I tried to use the same priority as I mentioned before when selecting my references: ideally Australia based; preferably academic research; and give preference to the most recent work. In many cases in the end I just picked a value for the carbon footprint which was somewhere in middle of the range of published values. Therefore I believe all of the CO2 values I have computed need to be treated with some caution. Description Weight (kg/wk) Carbon Intensity (kg CO2e/kg) Total CO2 e (kg/year) Meat: beef; lamb; chicken Beef 1 23 1,100 Lamb/pork/other 0.5 12 300 Chicken 0.5 3.7 100 Fish 0.5 3.4 85 Vegies 3 1 150 Fruit 5 1 250 Dairy: yoghurt; milk; cheese Milk 5 1.3 325 Cheese 0.5 20 500 Yoghurt 1 1.3 65 Figure A1: Itemised family food carbon footprint for 2019
  • 21. 21 In order to get a better visualisation of the importance of the individual food types shown in the Table, I have produced the bar graph shown in Figure A2. The information in the Figure has been categorised into groups to provide the picture shown in Figure 4. When computing our food carbon footprint, I only tried to capture the foods which make up our normal weekly shop. There are of course many other items which we use often in the kitchen but only need to buy from time to time – eg herbs, spices, sauces, etc. When transferring this data across to Figure 2 as ‘Food (grocery shopping)’, I separated ‘Coffee (in cafes)’ from the other items. Description Weight (kg/wk) Carbon Intensity (kg CO2e/kg) Total CO2e (kg/year) Non-dairy: milk; margarine Almond milk, etc 5 0.6 150 Margarine 0.5 1 25 Coffee (in cafes) 15 cups 0.5kgCO2e/cup 380 Juices 3 0.6 90 Breakfast cereals 0.3 1.2 20 Cakes; biscuits; chocolate 1 1.5 75 Eggs 6 eggs 1.5 30 Bread 0.5 1 25 Spreads 0.1 2.9 15 Frozen: veg; ice cream Veg 1 2 100 Ice cream 0.5 2 50 Tinned/bottled: beans; fruit; etc 4 2 400 TOTAL 4,235
  • 22. 22 0 200 400 600 800 1,000 1,2 Beef Cheese Tinned/bottled: beans; fruit; etc Milk Lamb/pork/other Fruit Vegies Almond milk, etc Chicken Frozen veg Juices Fish Cakes; biscuits; chocolate Yoghurt Ice cream Eggs Bread Margarine Breakfast cereals Spreads Figure A2: Visualisation of our itemised family food carbon footprint for 2019
  • 23. 23 Appendix 2 References When trying to ascertain the carbon emission factors I simply Googled for the activity/product groups listed in Figure 2 and the food types listed in Figure A1. I did not do this in a particularly rigorous way: I always selected at least three separate sites to ascertain the range of the claimed emission factors; if the first few sites gave a similar answer I did not go further and I picked what I thought was a good round number for the average value; if there was no apparent agreement I opted for the figure that was shown on what I judged to be the most credible site. This process was crude and involved lots of judgement – the figures in the Tables should therefore be considered to be purely indicative. When I was going through this process I noted down values and/or captured the links of particular sites which I’ve listed below essentially unedited. These may, or may not, have been the sites which I used to obtain the final emissions factor values which appear in the Tables. While my Googling appears to be haphazard [I deliberately did not want to get too bogged down in this ‘first cut’ of going through the research], I would draw the readers’ attention to the ‘Validation’ section in Chapter 2. I was very happy with the outcomes of the validation – if this had not looked good, I would have revisited my Googling and taken a much more painstaking approach. [Having said that, I think it is self-evident that very carefully working through masses of poor and inaccurate data is not likely to give you any more reliable results.] My informal notes/web site links are listed below, this only represents a small sample of the sites that I looked at: Beef 50-60 kgCO2e/kg (at best): https://www.theland.com.au/story/6527876/beef-must-stop- ignoring-its-large-co2-footprint/ Beef 75 kgCO2e/kg beef (derived from figure in article): http://www.fao.org/news/story/en/item/197623/icode/ Beef massive variation in published figures most common figure about 25 kgCO2e/kg (most of these studies not Australian). CSIRO similar figure: https://www.publish.csiro.au/an/an11030 Fruit and vegies (US): http://www.circularecology.com/news/wonky-fruit-and-veg-the-carbon- footprint-of-food#.XlYJMWgzZhE Food Australia (RMIT): https://www.rmit.edu.au/news/all-news/2016/november/new-study- provides-carbon-footprint-league-table-for-food Australian cheese: https://milkmaidmarian.com/2018/06/07/the-aussie-dairy-carbon-hoofprint/ Milk – major differences in different publications (could be global differences) Margarine: https://www.bettermeetsreality.com/the-impact-footprint-of-producing-eating-butter- margarine/ Coffee: https://www.ecowatch.com/coffees-invisible-carbon-footprint-1882175408.html Food miles debate: https://www.theguardian.com/environment/2008/mar/23/food.ethicalliving
  • 24. 24 Eggs: https://www.australianeggs.org.au/dmsdocument/521-environmental-assessment-of-an-egg- production-supply-chain-using-life-cycle-assessment Bread: https://blog.csiro.au/how-green-is-your-bread/ Cakes etc detailed study: https://www.sciencedirect.com/science/article/pii/S2352550918303087 Sandwich: https://www.theguardian.com/lifeandstyle/2018/jan/25/scientists-calculate-carbon- emissions-of-your-sandwich Juices: https://stanfordmag.org/contents/getting-the-most-sustainable-squeeze-from-your-oj- essential-answer Peanut butter: https://www.farmprogress.com/peanut/peanut-s-environmental-footprint-stretches- beyond-farm Frozen veggies: https://stud.epsilon.slu.se/6377/7/gottfridsson_l_140304.pdf Ice cream: https://www.benjerry.com/values/issues-we-care-about/climate-justice/life-cycle- analysis Nissan Leaf indirect: https://www.carbonbrief.org/factcheck-how-electric-vehicles-help-to-tackle- climate-change Latte 340g CO2: https://www.ecowatch.com/coffees-invisible-carbon-footprint-1882175408.html List of footprints for food: https://www.greeneatz.com/foods-carbon-footprint.html Australian study food list: http://www.australasianscience.com.au/article/issue-december- 2016/study-provides-carbon-footprint-table-food.html Family footprint/year: http://shrinkthatfootprint.com/food-carbon-footprint-diet Wooden furniture: https://www.panelsfurnitureasia.com/en/news-archive/un-wooden-furniture- reduces-more-carbon-emissions-than-other-materials/462 Newspaper: https://www.theguardian.com/environment/green-living-blog/2010/nov/04/carbon- footprint-newspaper Bicycle: https://www.theguardian.com/environment/bike-blog/2012/mar/15/lifecycle-carbon- footprint-bike-blog Books: https://www.csbsju.edu/Documents/CSB%20Sustainability/SHM%20e- readers%20vs.%20books%20poster(0).pdf Shoes: http://news.mit.edu/2013/footwear-carbon-footprint-0522 Clothes: https://www.systain.com/wp- content/uploads/2015/09/Systain_Studie_Carbon_Footprint_English.pdf Internet shopping: https://ctl.mit.edu/sites/default/files/library/public/Dimitri-Weideli- Environmental-Analysis-of-US-Online-Shopping_0.pdf Use of internet: https://www.researchgate.net/publication/238634031_Carbon_footprint_of_the_Internet
  • 25. 25 Mobile phone: https://www.theguardian.com/environment/green-living-blog/2010/jun/09/carbon- footprint-mobile-phone Desktop computers: https://h22235.www2.hp.com/hpinfo/globalcitizenship/environment/productdata/Countries/_Multi Country/productcarbonfootprint_deskto_2017104233915185.pdf Washing clothes: https://www.theguardian.com/environment/green-living- blog/2010/nov/25/carbon-footprint-load-laundry Hotel room: https://considerategroup.com/carbon-emissions/ Buses efficiency: https://the-riotact.com/the-efficiency-of-buses/57534 Electrical appliances: https://pubs.acs.org/doi/abs/10.1021/es201459c
  • 27. 14,000 K8YUKXAW-33086 March 8, 2020 Dave Southgate
  • 28. 27 About the Author Dave Southgate retired from the Australian Government Public Service in July 2012 after a 31-year career as an ‘environmental bureaucrat’. After working for 8 years in government environmental agencies at both the State and Federal levels he joined the Australian Government Transport Department in late 1989 and stayed there until he retired. Throughout his time in Transport he specialised in aircraft noise; in the latter years he also became involved in aviation climate change issues and developed a particular interest in carbon footprinting. From 2004 to 2012 Dave was the Australian Government representative on the United Nations International Civil Aviation Organization (ICAO) Committee on Aviation Environmental Protection (CAEP). He pursued his interest in carbon footprinting while on CAEP and was a member of the group that oversaw the development of the ICAO Carbon Calculator. Not long after his retirement Dave began a process aimed at transforming the energy use patterns in his 100% fossil fuelled house. This project is aimed at his family becoming ‘Fossil Fuel Free’ (in essence the goal is for his household to no longer directly buy any fossil based fuels, namely grid electricity, gas or petrol). Dave has written numerous reports and articles about this project. These can be viewed and/or downloaded from his website. Dave has a science/engineering background and has degrees from the Universities of Liverpool, London (Imperial College) and Tasmania. You can find consolidated information on our household energy transition project at my website: https://netzeroemissions.net/