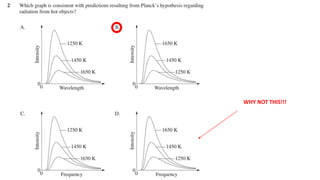
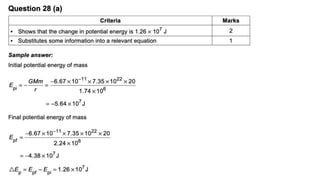
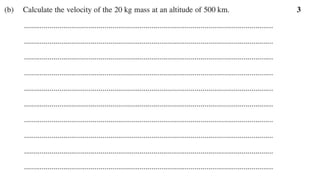
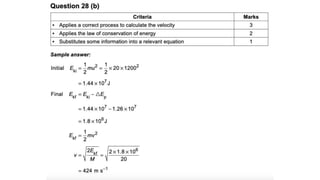
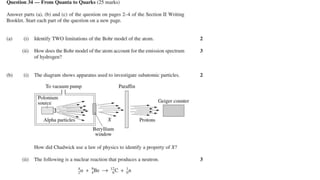
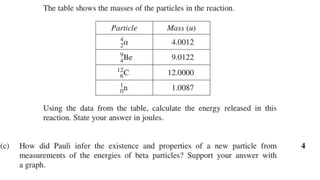
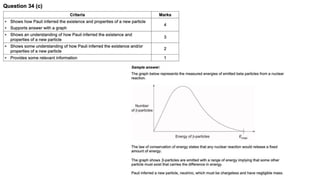
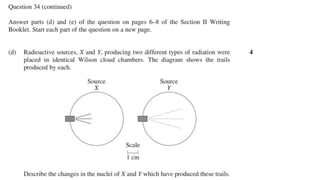
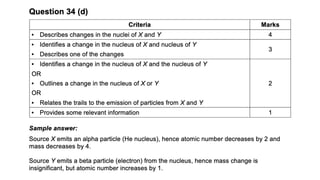
WHY NOT THIS!!!
Not a Syllabus
dot point
• Sample answer: The increased demand for energy can be
analysed in terms of the effect on voltages, current and
energy losses. Voltages: The output voltage from the
power station, the transmission line voltage and the
supply voltage to the houses remains approximately
constant. Current: An increase in the total current being
drawn from T2 by the houses produces an increase in the
transmission line current and the output current from the
power station. If the former doubles, then the
transmission line current and the current output of the
power station approximately double. Energy losses: Heat is
produced in the transmission line wires and other wires
due to their resistance. As the current increases the heat
produced in the wires increases. Heat is also produced by
eddy currents in the transformer cores, and this increases
as the current increases. Because of the resistance of the
wires, relatively small voltage drops occur along these
conductors and these increase as more appliances are
turned on in the houses. This results in slight decreases in
the voltage inputs and outputs at each of the
transformers.
• Answers could include: Reference to parallel circuits in the
houses
• Sample answer: A black body produces a radiation
curve that is dependent on the temperature of the
body. A star acts as a black body and the
characteristic peak of the curve reflects the
temperature of the surface of the star.
• A black body produces a continuous spectrum, so
the spectrum of stars is continuous. Absorption lines
are seen in the spectrum due to cooler gas particles
in the atmosphere around the stars absorbing
certain wavelengths of energy resulting in an
absorption spectrum which identifies the atoms in
the gas clouds.
• Using different gas discharge tubes (hydrogen,
helium, neon) and a spectroscope, unique spectra
can be observed in a school laboratory. This can be
used to compare with spectral lines produced by
stars to identify their chemical composition.
Incandescent bulbs can demonstrate a continuous
spectrum curve.
2018 HSC PHYSICS QUESTIONS AND SOLUTIONS INCLUDING MARKING GUIDE

2018 HSC PHYSICS QUESTIONS AND SOLUTIONS INCLUDING MARKING GUIDE

  • 3.
  • 11.
  • 47.
    • Sample answer:The increased demand for energy can be analysed in terms of the effect on voltages, current and energy losses. Voltages: The output voltage from the power station, the transmission line voltage and the supply voltage to the houses remains approximately constant. Current: An increase in the total current being drawn from T2 by the houses produces an increase in the transmission line current and the output current from the power station. If the former doubles, then the transmission line current and the current output of the power station approximately double. Energy losses: Heat is produced in the transmission line wires and other wires due to their resistance. As the current increases the heat produced in the wires increases. Heat is also produced by eddy currents in the transformer cores, and this increases as the current increases. Because of the resistance of the wires, relatively small voltage drops occur along these conductors and these increase as more appliances are turned on in the houses. This results in slight decreases in the voltage inputs and outputs at each of the transformers. • Answers could include: Reference to parallel circuits in the houses
  • 51.
    • Sample answer:A black body produces a radiation curve that is dependent on the temperature of the body. A star acts as a black body and the characteristic peak of the curve reflects the temperature of the surface of the star. • A black body produces a continuous spectrum, so the spectrum of stars is continuous. Absorption lines are seen in the spectrum due to cooler gas particles in the atmosphere around the stars absorbing certain wavelengths of energy resulting in an absorption spectrum which identifies the atoms in the gas clouds. • Using different gas discharge tubes (hydrogen, helium, neon) and a spectroscope, unique spectra can be observed in a school laboratory. This can be used to compare with spectral lines produced by stars to identify their chemical composition. Incandescent bulbs can demonstrate a continuous spectrum curve.