Download as PDF, PPTX


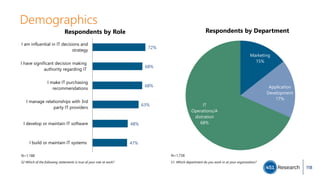
![Budgets
41%
39%
42%
41%
39%
40%
30%
36%
30%
30%
32%
32%
16%
13%
16%
16%
17%
16%
13%
12%
12%
14%
12%
12%
MEA (n=47)
LA (n=95)
APAC (n=316)
WE (n=330)
NA (n=950)
Total (n=1738)
0% 10% 20% 30% 40% 50% 60% 70% 80% 90% 100%
Average %
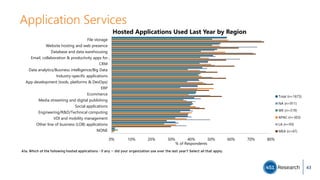
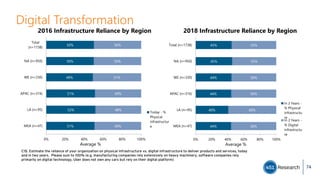
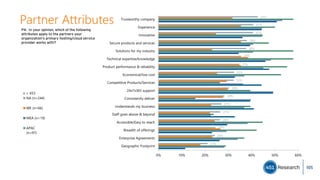
2017 IT Budget Allocation by Region
On-Premises
Infrastructure &
Staff
Hosting Services
SaaS
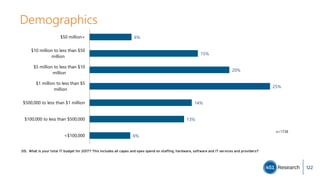
S8b. Using your best guess, approximately what percentage of your total IT budget in 2017 is allocated to: [sum to 100%]
7](https://image.slidesharecdn.com/2017microsofthostingandcloudstudy-170412003031/85/2017-Microsoft-hosting-and-cloud-study-7-320.jpg)
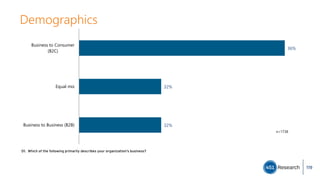
![Budgets/Spending
8
26%
25%
26%
26%
25%
26%
19%
18%
21%
20%
19%
20%
18%
18%
18%
18%
19%
18%
18%
20%
18%
17%
19%
18%
18%
20%
17%
19%
18%
18%
MEA
(n=47)
LA
(n=95)
APAC
(n=316)
WE
(n=330)
NA
(n=950)
Total
(n=1738)
0% 20% 40% 60% 80% 100%
Average %
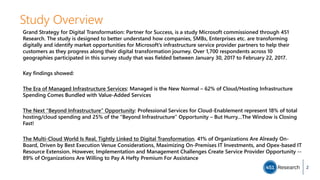
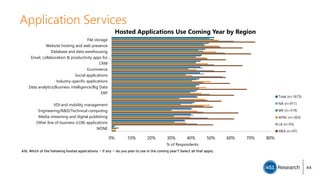
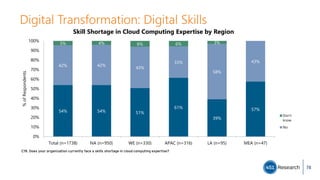
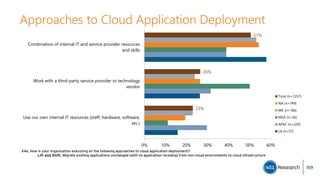
2017 Hosting/Cloud Services Budget
Allocation by Region
Infrastructure
Hosting
Application
Hosting
Managed
Services
Security
Services
Professional
Services
28%
29%
26%
27%
26%
27%
22%
19%
22%
21%
20%
21%
18%
16%
18%
17%
19%
18%
18%
20%
19%
18%
19%
19%
15%
16%
15%
17%
16%
16%
MEA
(n=47)
LA (n=95)
APAC
(n=316)
WE
(n=330)
NA
(n=950)
Total
(n=1738)
0% 20% 40% 60% 80% 100%
Average %
2019 Hosting/Cloud Services Budget
Allocation by Region
Infrastructure
Hosting
Application
Hosting
Managed
Services
Security
Services
Professional
Services
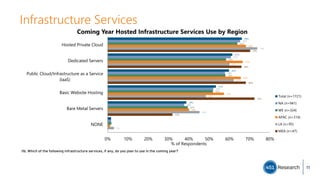
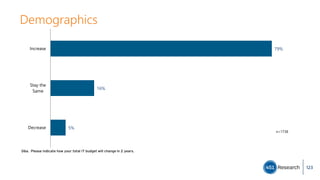
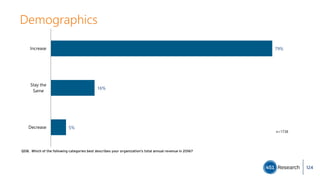
H1. Approximately what percent of your HOSTING & CLOUD SERVICES budget in 2016 is allocated to the following services? [Sum to 100%]
H2. Now thinking out two years, approximately what percent of your HOSTING & CLOUD SERVICES budget will be allocated to the following
services? [Sum to 100%]](https://image.slidesharecdn.com/2017microsofthostingandcloudstudy-170412003031/85/2017-Microsoft-hosting-and-cloud-study-8-320.jpg)

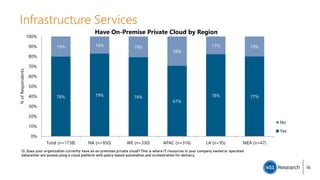
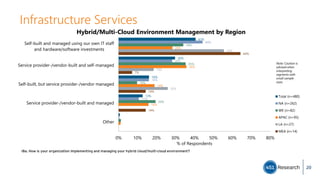
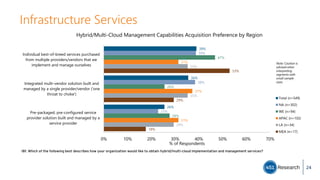
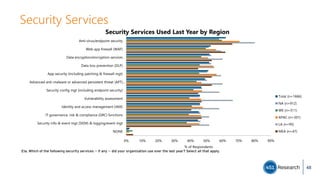
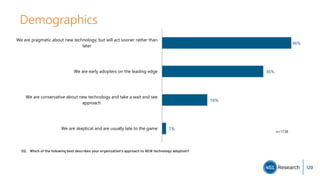
![Infrastructure Services
48%
43%
47%
47%
45%
46%
52%
57%
53%
53%
55%
54%
MEA (n=47)
LA (n=95)
APAC (n=316)
WE (n=330)
NA (n=950)
Total (n=1738)
0% 10% 20% 30% 40% 50% 60% 70% 80% 90% 100%
Average %
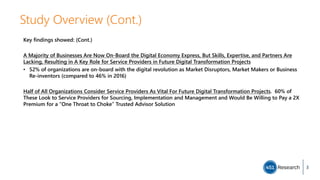
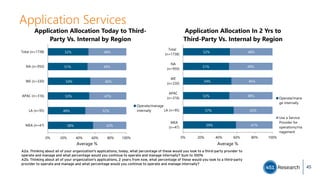
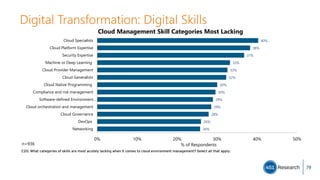
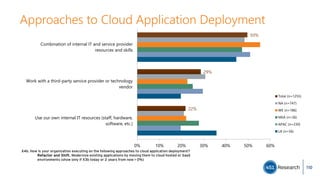
Managed Spend by Region
Basic
infrastructure
Managed
services/security
services
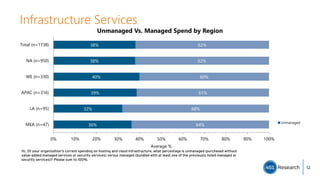
I1d . Thinking about your organization's managed infrastructure spending, what percentage of the spending is allocated to each of the
following? Please sum to 100%. [Sum to 100%]
13](https://image.slidesharecdn.com/2017microsofthostingandcloudstudy-170412003031/85/2017-Microsoft-hosting-and-cloud-study-13-320.jpg)
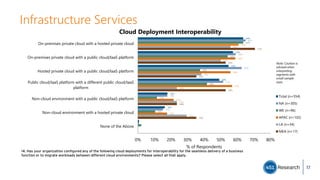
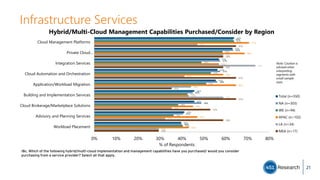
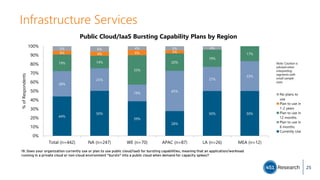


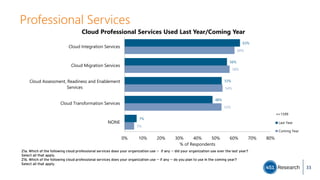
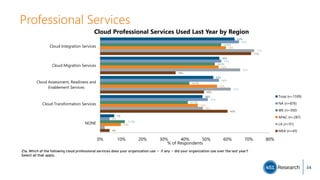
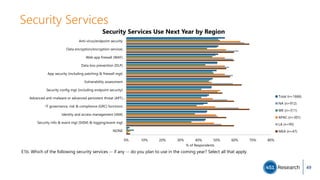
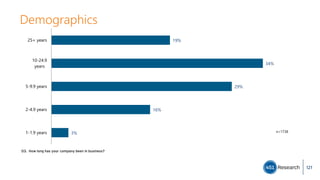
![Professional Services
70%
69%
69%
68%
68%
68%
66%
66%
66%
65%
65%
65%
63%
61%
0% 10% 20% 30% 40% 50% 60% 70% 80% 90% 100%
Intgrtn of legacy sys/bus processes w/SaaS fnctnlty
Application modernization
Intgrtn of core bus systems & data w/customer-facing bus prcsses
Compliance and risk assessment
Cloud business strategy
Training on cloud platforms
Ntwrk consulting & integration to accommodate cloud envrnmnts
Migration of legacy appls/wrklds to cloud infrastructure envrnmnts
Cloud advisory and planning
Workload Placement
Cloud orchestration and management
Vendor/service provider procrmnt & relationship mgt
Cloud-native application development
Cloud brokerage/marketplace solutions
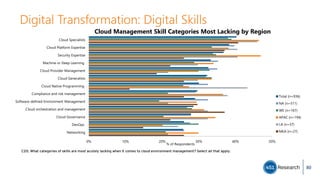
% TOP BOX (More Important - ratings 8 thru 10)
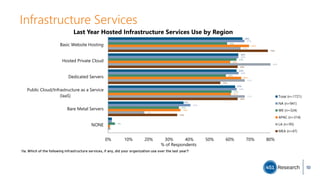
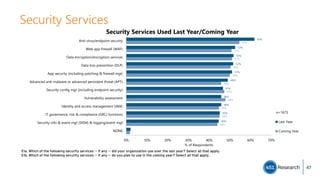
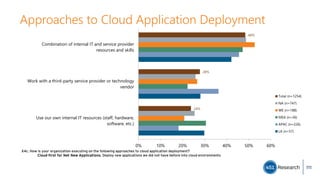
Importance To Digital Transformation Goals
n=1513
Z2. How important are each of the following to your organization 's digital transformation goals? Rate on a scale of 0-10 where 0= Not at all
Important and 10 = Extremely Important. [TOP BOX RATING OF 8-10]
Note:
‘Straightline”
responses
removed.
36](https://image.slidesharecdn.com/2017microsofthostingandcloudstudy-170412003031/85/2017-Microsoft-hosting-and-cloud-study-36-320.jpg)
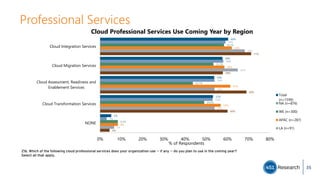
![Professional Services
0% 10% 20% 30% 40% 50% 60% 70% 80% 90% 100%
Intgrtn of legacy sys/bus processes w/SaaS fnctnlty
Application modernization
Intgrtn of core bus systems & data w/customer-facing bus prcsses
Compliance and risk assessment
Cloud business strategy
Training on cloud platforms
Ntwrk consulting & integration to accommodate cloud envrnmnts
Migration of legacy appls/wrklds to cloud infrastructure envrnmnts
Cloud advisory and planning
Workload Placement
Cloud orchestration and management
Vendor/service provider procrmnt & relationship mgt
Cloud-native application development
Cloud brokerage/marketplace solutions
% TOP BOX (More Important - ratings 8 thru 10)
Importance To Digital Transformation Goals by Region
Total (n=1513)
NA (n=851)
WE (n=274)
APAC (n=262)
LA (n=83)
MEA (n=43)
Z2. How important are each of the following to your organization 's digital transformation goals? Rate on a scale of 0-10 where 0= Not at all
Important and 10 = Extremely Important. [TOP BOX RATING OF 8-10]
Note:
‘Straightline”
responses
removed.
37](https://image.slidesharecdn.com/2017microsofthostingandcloudstudy-170412003031/85/2017-Microsoft-hosting-and-cloud-study-37-320.jpg)
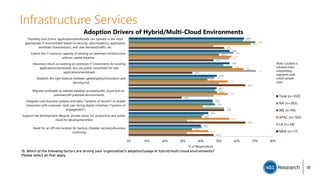
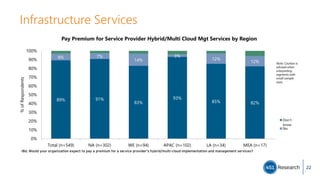
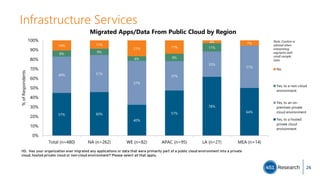
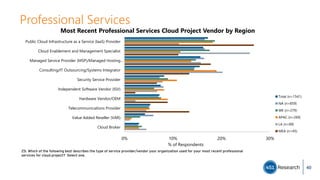
![Professional Services
12% 15%
9% 10% 7%
3%
14%
15% 24%
4%
12%
13%
16%
16%
23%
9%
4%
38%
19%
19%
19%
19%
22%
21%
17%
18%
13%
16%
30%
13%
11%
10%
7%
16%
10%
8%
11% 8%
4%
28%
13%
5%
Total (n=1282) NA (n=732) WE (n=217) APAC (n=227) LA (n=67) MEA (n=39)
0%
10%
20%
30%
40%
50%
60%
70%
80%
90%
100%
%ofRespondents
Most Recent Professional Services Cloud Project Spend by Region
$2mil+
$500,000-
<$2mil
$100,000-
$499,999
$25,000-
$99,999
$5,000-$24,999
$1,000-$4,999
<$1,000
Z3. How much did your organization spend on your most recent professional services for cloud enablement project? Please enter a US
dollar value. [OPEN NUMERIC]
38](https://image.slidesharecdn.com/2017microsofthostingandcloudstudy-170412003031/85/2017-Microsoft-hosting-and-cloud-study-38-320.jpg)
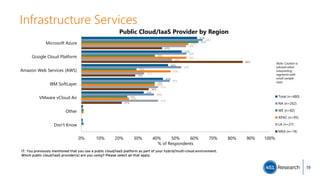
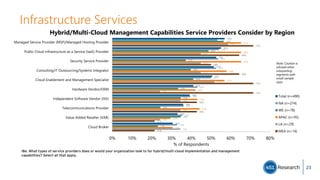
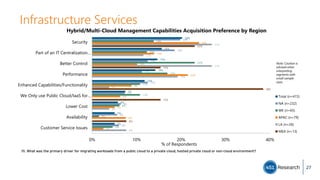
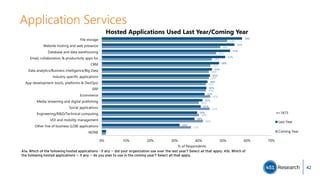
![Professional Services
11% 12%
6%
13% 11% 12%
22% 24%
20%
18% 20% 19%
25%
24%
30% 25% 22% 21%
21%
23%
23%
19%
16%
14%
7%
6%
7%
8% 14%
5%
14% 12% 14% 18% 16%
30%
Total (n=1391) NA (n=778) WE (n=236) APAC (n=255) LA (n=79) MEA (n=43)
0%
10%
20%
30%
40%
50%
60%
70%
80%
90%
100%
%ofRespondents
Most Recent Professional Services Cloud Project Duration by Region
More than 24
weeks
17-24 weeks
9-16 weeks
5-8 weeks
3-4 weeks
1-2 weeks
Average Weeks13 12 12 14 14 20
Z4. What was the duration (WEEKS) of your organization 's most recent professional services for cloud enablement project?
________ Weeks [OPEN NUMERIC]
39](https://image.slidesharecdn.com/2017microsofthostingandcloudstudy-170412003031/85/2017-Microsoft-hosting-and-cloud-study-39-320.jpg)


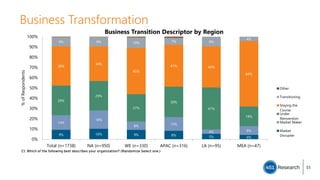
![Business Transformation
24 24 23 26 27 30
23 22 23
23
25 20
19 19 20 19
19 20
17 18 17 16
16 16
16 17 16 16 13 14
Total (n=1738) NA (n=950) WE (n=330) APAC (n=316) LA (n=95) MEA (n=47)
Relative Company Goals
Increase
revenue
Improve
product or
service quality
Lower costs
C3. Allocate 100 points among the following five goals to their relative importance within your company or organization? [Sum to 100]
52](https://image.slidesharecdn.com/2017microsofthostingandcloudstudy-170412003031/85/2017-Microsoft-hosting-and-cloud-study-52-320.jpg)
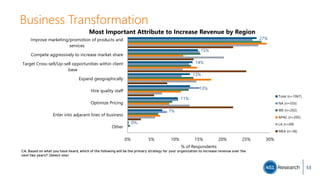
![Digital Investment
12%
6%
6%
4%
6%
4%
40%
43%
41%
42%
37%
38%
31%
49%
51%
53%
54%
57%
58%
69%
Enter into adjacent lines of business (n=78)
Target Cross-sell/Up-sell opportunities within client base
(n=146)
Hire quality staff (n=140)
Optimize Pricing (n=113)
Improve marketing/promotion of products and services
(n=290)
Compete aggressively to increase market share (n=158)
Expand geographically (n=140)
0% 20% 40% 60% 80% 100%
% of Respondents
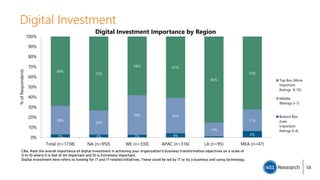
Digital Investment to Increase Revenue
None
Some
Significant
C9a. What is the level of digital investment that your organization will need to make to deliver on these strategies
[Increase Revenue] over the next two years, based either on your own knowledge or impressions?
59](https://image.slidesharecdn.com/2017microsofthostingandcloudstudy-170412003031/85/2017-Microsoft-hosting-and-cloud-study-59-320.jpg)
![Digital Investment
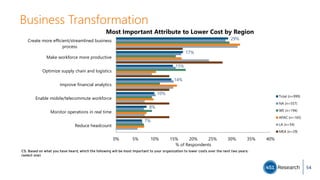
10%
9%
5%
3%
3%
49%
39%
42%
42%
39%
38%
37%
40%
52%
53%
55%
58%
59%
60%
Reduce headcount (n=67)
Enable mobile/telecommute workforce (n=99)
Monitor operations in real time (n=79)
Optimize supply chain and logistics (n=147)
Make workforce more productive (n=173)
Improve financial analytics (n=143)
Create more efficient/streamlined business process
(n=290)
0% 20% 40% 60% 80% 100%
% of Respondents
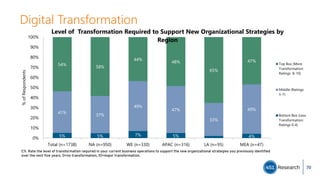
Digital Investment to Lower Costs
None
Some
Significant
C9b. What is the level of digital investment that your organization will need to make to deliver on these strategies
[Lower Costs] over the next two years, based either on your own knowledge or impressions?
60](https://image.slidesharecdn.com/2017microsofthostingandcloudstudy-170412003031/85/2017-Microsoft-hosting-and-cloud-study-60-320.jpg)
![Digital Investment
4%
4%
5%
3%
3%
3%
52%
49%
42%
42%
39%
41%
39%
38%
32%
28%
46%
47%
55%
56%
56%
57%
59%
59%
66%
70%
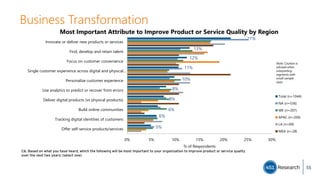
Tracking digital identities of customers (n=63)
Offer self-service products/services (n=51)
Use analytics to predict or recover from errors (n=84)
Build online communities (n=66)
Find, develop and retain talent (n=135)
Focus on customer convenience (n=129)
Single cstmr exprnce across digital & physical srvcs/devices/pltfrms…
Personalize customer experience (n=102)
Deliver digital products (vs physical products) (n=79)
Innovate or deliver new products or services (n=224)
0% 20% 40% 60% 80% 100%
% of Respondents
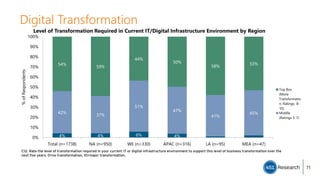
Digital Investment to Improve Product or Service Quality
None
Some
Significant
C9c. What is the level of digital investment that your organization will need to make to deliver on these strategies
[Improve Product or Service Quality] over the next two years, based either on your own knowledge or impressions?
61](https://image.slidesharecdn.com/2017microsofthostingandcloudstudy-170412003031/85/2017-Microsoft-hosting-and-cloud-study-61-320.jpg)
![Digital Investment
6%
4%
39%
41%
40%
39%
38%
34%
37%
55%
56%
58%
59%
60%
62%
63%
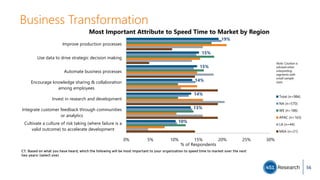
Cultivate a culture of risk taking...to accelerate development (n=101)
Encourage knowledge sharing & collaboration among employees
(n=135)
Invest in research and development (n=133)
Integrate customer feedback through communities or analytics
(n=132)
Automate business processes (n=145)
Use data to drive strategic decision making (n=149)
Improve production processes (n=189)
0% 20% 40% 60% 80% 100%
% of Respondents
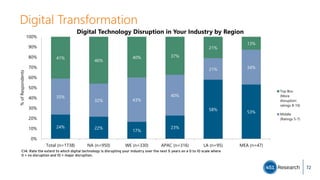
Digital Investment to Speed Time to Market
None
Some
Significant
C9d. What is the level of digital investment that your organization will need to make to deliver on these strategies
[Speed Time to Market] over the next two years, based either on your own knowledge or impressions?
62](https://image.slidesharecdn.com/2017microsofthostingandcloudstudy-170412003031/85/2017-Microsoft-hosting-and-cloud-study-62-320.jpg)
![Digital Investment
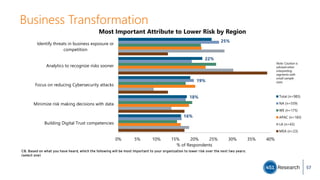
42%
41%
38%
36%
27%
56%
58%
60%
62%
71%
Minimize risk making decisions with data (n=177)
Analytics to recognize risks sooner (n=217)
Building Digital Trust competencies (n=162)
Identify threats in business exposure or competition
(n=241)
Focus on reducing Cybersecurity attacks (n=186)
0% 20% 40% 60% 80% 100%
% of Respondents
Digital Investment to Lower Risk
None
Some
Significant
C9e. What is the level of digital investment that your organization will need to make to deliver on these strategies [Lower Risk]
over the next two years, based either on your own knowledge or impressions?
63](https://image.slidesharecdn.com/2017microsofthostingandcloudstudy-170412003031/85/2017-Microsoft-hosting-and-cloud-study-63-320.jpg)
![Digital Investment
3%
3%
4%
4%
25%
24%
20%
26%
25%
26%
19%
51%
42%
50%
44%
44%
45%
45%
24%
28%
26%
24%
27%
26%
29%
4%
4%
3%
Expand geographically (n=140)
Compete aggressively to increase market share (n=158)
Improve marketing/promotion of products and services
(n=290)
Optimize Pricing (n=113)
Target Cross-sell/Up-sell opportunities within client base
(n=146)
Enter into adjacent lines of business (n=78)
Hire quality staff (n=140)
0% 20% 40% 60% 80% 100%
% of Respondents
Proportion of Providers Can Support Digital Investment to Increase Revenue
None
Few
Many
All
C10a. Estimate the PROPORTION of cloud and hosting providers that could deliver services to support the digital investment
required for these strategies [Increase Revenue] , based either on your own knowledge or what you heard?
64](https://image.slidesharecdn.com/2017microsofthostingandcloudstudy-170412003031/85/2017-Microsoft-hosting-and-cloud-study-64-320.jpg)
![Digital Investment
3%
9%
13%
23%
20%
21%
24%
24%
28%
45%
52%
52%
48%
46%
44%
28%
42%
23%
26%
25%
28%
26%
28%
3%
5%
6%
Improve financial analytics (n=143)
Monitor operations in real time (n=79)
Create more efficient/streamlined business process
(n=290)
Make workforce more productive (n=173)
Optimize supply chain and logistics (n=147)
Enable mobile/telecommute workforce (n=99)
Reduce headcount (n=67)
0% 20% 40% 60% 80% 100%
% of Respondents
Proportion of Providers Can Support Digital Investment to Lower Costs
None
Few
Many
All
Don't know
C10b. Estimate the PROPORTION of cloud and hosting providers that could deliver services to support the digital investment
required for these strategies [Lower Costs], based either on your own knowledge or what you heard?
65](https://image.slidesharecdn.com/2017microsofthostingandcloudstudy-170412003031/85/2017-Microsoft-hosting-and-cloud-study-65-320.jpg)
![Digital Investment
3%
5%
14%
15%
19%
18%
17%
18%
15%
17%
20%
21%
55%
48%
57%
50%
46%
50%
39%
52%
50%
46%
29%
36%
24%
29%
36%
26%
43%
27%
26%
24%
3%
5%
4%
Offer self-service products/services (n=51)
Build online communities (n=66)
Tracking digital identities of customers (n=63)
Innovate or deliver new products or services (n=224)
Single customer experience across digital and physical services, devices or platforms…
Use analytics to predict or recover from errors (n=84)
Deliver digital products (vs physical products) (n=79)
Personalize customer experience (n=102)
Focus on customer convenience (n=129)
Find, develop and retain talent (n=135)
0% 20% 40% 60% 80% 100%
% of Respondents
Proportion of Providers Can Support Digital Investment to Improve Product or Service
Quality
None
Few
Many
All
C10c. Estimate the PROPORTION of cloud and hosting providers that could deliver services to support the digital investment
required for these strategies [Improve Product or Service Quality] , based either on your own knowledge or what you heard?
66](https://image.slidesharecdn.com/2017microsofthostingandcloudstudy-170412003031/85/2017-Microsoft-hosting-and-cloud-study-66-320.jpg)
![5%
14%
15%
19%
18%
17%
18%
15%
17%
20%
21%
55%
48%
57%
50%
46%
50%
39%
52%
50%
46%
29%
36%
24%
29%
36%
26%
43%
27%
26%
24%
3%
5%
4%
Offer self-service products/services (n=51)
Build online communities (n=66)
Tracking digital identities of customers (n=63)
Innovate or deliver new products or services (n=224)
Single customer experience across digital and physical services, devices or platforms (n=111)
Use analytics to predict or recover from errors (n=84)
Deliver digital products (vs physical products) (n=79)
Personalize customer experience (n=102)
Focus on customer convenience (n=129)
Find, develop and retain talent (n=135)
0% 20% 40% 60% 80% 100%
% of Respondents
Proportion of Providers Can Support Digital Investment to Improve Product or Service
Quality
None
Few
Many
All
Digital Investment
C10c. Estimate the PROPORTION of cloud and hosting providers that could deliver services to support the digital investment required for
these strategies [Improve Product or Service Quality] , based either on your own knowledge or what you heard?
67](https://image.slidesharecdn.com/2017microsofthostingandcloudstudy-170412003031/85/2017-Microsoft-hosting-and-cloud-study-67-320.jpg)
![Digital Investment
C10d. Estimate the PROPORTION of cloud and hosting providers that could deliver services to support the digital investment required
for these strategies [Speed Time to Market], based either on your own knowledge or what you heard?
17%
15%
15%
14%
20%
12%
19%
54%
54%
58%
51%
50%
51%
50%
26%
30%
26%
33%
30%
33%
28%
3%Automate business processes (n=145)
Use data to drive strategic decision making (n=149)
Integrate customer feedback through communities or analytics
(n=132)
Invest in research and development (n=133)
Improve production processes (n=189)
Encourage knowledge sharing & collaboration among employees
(n=135)
Cultivate a culture of risk taking...to accelerate development
(n=101)
0% 20% 40% 60% 80% 100%
% of Respondents
Proportion of Providers Can Support Digital Investment to Speed Time to
Market
None
Few
Many
All
68](https://image.slidesharecdn.com/2017microsofthostingandcloudstudy-170412003031/85/2017-Microsoft-hosting-and-cloud-study-68-320.jpg)
![Digital Investment
C10e. Estimate the PROPORTION of cloud and hosting providers that could deliver services to support the digital investment required for
these strategies [Lower Risk], based either on your own knowledge or what you heard?
11%
15%
19%
15%
14%
47%
42%
40%
42%
41%
38%
40%
36%
38%
43%
3%
4%
5%
Focus on reducing Cybersecurity attacks (n=186)
Identify threats in business exposure or competition
(n=241)
Analytics to recognize risks sooner (n=217)
Minimize risk making decisions with data (n=177)
Building Digital Trust competencies (n=162)
0% 10% 20% 30% 40% 50% 60% 70% 80% 90% 100%
% of Respondents
Proportion of Providers Can Support Digital Investment to Lower Risk
None
Few
Many
All
69](https://image.slidesharecdn.com/2017microsofthostingandcloudstudy-170412003031/85/2017-Microsoft-hosting-and-cloud-study-69-320.jpg)
![Digital Transformation
C15. What is the level of your organization's commitment to implementing digital/online operations for each of the
following business functions? (Randomize) Rate on a scale of 0-10 where 0 = Not at all Committed and 10 = Completely
Committed. [TOP BOX RATING OF 8-10]
67%
66%
64%
63%
73%
72%
71%
70%
54%
52%
51%
45%
60%
59%
54%
56%
78%
80%
68%
72%
66%
54%
49%
54%
0% 10% 20% 30% 40% 50% 60% 70% 80% 90% 100%
Customer service/support
Sales
Marketing
Automated internal business
workflows
% TOP BOX (More Committed - ratings 8 thru 10)
Commitment to Implementing Digital/Online Operation by Region
Total (n=1502)
NA (n=844)
WE (n=271)
APAC (n=265)
LA (n=81)
MEA (n=41)
Note:
‘Straightline”
responses
removed.
73](https://image.slidesharecdn.com/2017microsofthostingandcloudstudy-170412003031/85/2017-Microsoft-hosting-and-cloud-study-73-320.jpg)
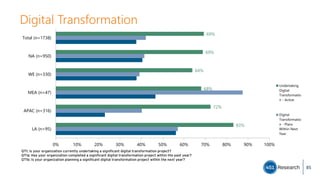
![Digital Transformation
C16c. How important are each of the following for your organization's digital innovation strategy over the next five years?
Rate on a 0-10 scale where 0 = Not at all important and 10 = Extremely Important. (Randomize) [TOP BOX RATING OF 8-10]
72%
72%
65%
63%
79%
78%
72%
70%
62%
63%
50%
48%
62%
59%
57%
58%
81%
82%
81%
68%
74%
77%
49%
58%
0% 10% 20% 30% 40% 50% 60% 70% 80% 90% 100%
Engaging Customers
Optimizing Business Operations
Empowering employees
Transforming Products
% TOP BOX (More Important - ratings 8 thru 10)
Importance to Digital Innovation Strategy by Region
Total (n=1573)
NA (n=870)
WE (n=310)
APAC (n=278)
LA (n=72)
MEA (n=43)
Note:
‘Straightline”
responses
removed.
75](https://image.slidesharecdn.com/2017microsofthostingandcloudstudy-170412003031/85/2017-Microsoft-hosting-and-cloud-study-75-320.jpg)
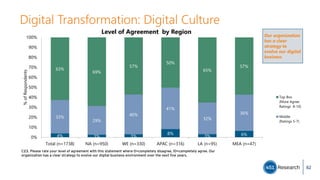
![Digital Transformation: Optimizing Business Operations
C17. Rate the level of investment in the following technologies needed over the next 5 years to meet your
organization's business goals: 0 = No investment, 10= Significant Investment (Randomize) [TOP BOX RATING OF 8-10]
66%
65%
65%
64%
62%
61%
57%
56%
56%
55%
55%
53%
51%
49%
49%
49%
48%
0% 10% 20% 30% 40% 50% 60% 70%
Cybersecurity protection
Mobile platforms and applications
Customer experience management systems
Data integration across multiple lines of business &…
Data mining and analytics
Agile software development processes for fast feedback
Social-media enabled business process
Sensor-based technology
Governance/regulatory tools
Serverless computing
Machine learning
Artificial intelligence
Robotics
Containers
Wearables
Nanotechnology
3D printing
% TOP BOX (More Investment - ratings 8 thru 10)
Technology Investment Ratings
Note: “Straightline” responses removed.n=1731
76](https://image.slidesharecdn.com/2017microsofthostingandcloudstudy-170412003031/85/2017-Microsoft-hosting-and-cloud-study-76-320.jpg)
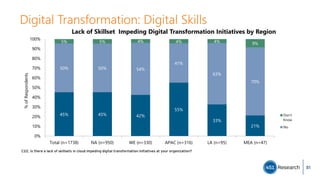
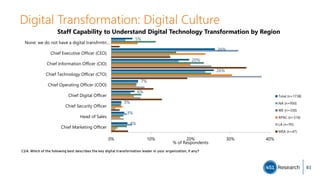
![Digital Transformation: Digital Skills
C18. How capable are staff in the following groups at your organization in understanding how digital technologies could
transform your business? 0=not at all capable, 10=very capable (Randomize) [TOP BOX RATING OF 8-10]
76%
68%
67%
62%
62%
59%
80%
75%
75%
71%
71%
66%
67%
55%
49%
43%
48%
45%
68%
59%
57%
53%
49%
51%
88%
72%
80%
78%
62%
53%
72%
57%
79%
60%
64%
62%
0% 10% 20% 30% 40% 50% 60% 70% 80% 90% 100%
IT
Security
Executive team
Line of Business
Support functions: HR, Finance
Legal
% TOP BOX (More Capable - ratings 8 thru 10)
Staff Capability to Understand Digital Technology Transformation by Region
Total
(n=1639)
NA (n=900)
WE (n=310)
APAC (n=297)
LA (n=85)
77](https://image.slidesharecdn.com/2017microsofthostingandcloudstudy-170412003031/85/2017-Microsoft-hosting-and-cloud-study-77-320.jpg)

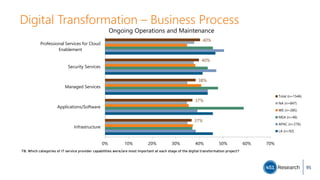
![Digital Transformation – IT Service Providers
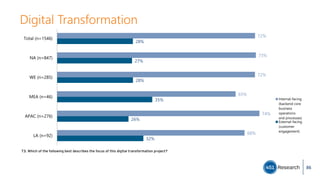
T7. Please rate the strategic importance of IT service providers for this digital transformation project. [% TOP BOX RATING (More
Strategic 8 thru 10)]
77%
61%
63%
60%
71%
67%
LA (n=92)
APAC
(n=276)
MEA (n=46)
WE (n=285)
NA (n=847)
Total
(n=1546)
90](https://image.slidesharecdn.com/2017microsofthostingandcloudstudy-170412003031/85/2017-Microsoft-hosting-and-cloud-study-90-320.jpg)
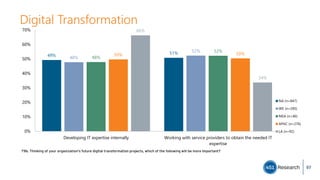
![Digital Transformation
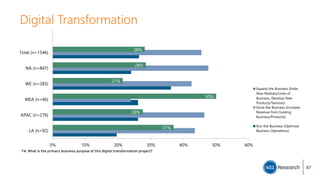
T9a. Considering all the IT skill sets required for successful completion of this digital transformation project, allocate 100 points among the following
capabilities. [Rating Displayed as MEAN]
64%
79%
80%
81%
94%
52%
59%
59%
60%
70%
0% 10% 20% 30% 40% 50% 60% 70% 80% 90% 100%
Orchestrati
on
Integration
Hardware
Manageme
nt
Software
Total (n=1546)
NA (n=847)
WE (n=285)
MEA (n=46)
APAC (n=276)
LA (n=92)
96](https://image.slidesharecdn.com/2017microsofthostingandcloudstudy-170412003031/85/2017-Microsoft-hosting-and-cloud-study-96-320.jpg)
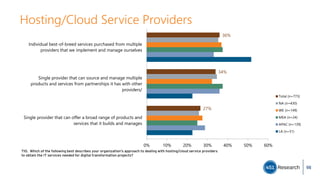


![Digital Transformation - Managed Services
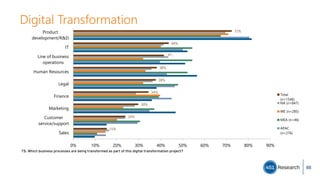
X1. Thinking about the managed services you are currently using / planning to use, rate the impact of these services on
your organization’s ability to do the following. Use a 0 to 10 scale where 0 = No Impact and 10 = Significant Impact. [% TOP
BOX RATING (Most Impactful 8 thru 10)]
63%
64%
66%
71%
0% 10% 20% 30% 40% 50% 60% 70% 80% 90%
Empower your
employees
Transform your
products
Engage your customers
Optimize your
operations
Total (n=1707)
NA (n=936)
WE (n=321)
MEA (n=47)
APAC (n=309)
LA (n=95)
107](https://image.slidesharecdn.com/2017microsofthostingandcloudstudy-170412003031/85/2017-Microsoft-hosting-and-cloud-study-107-320.jpg)
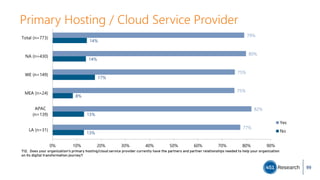
![Digital Transformation – Business Goals
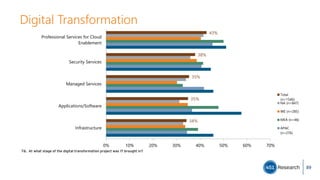
X2. Still thinking about the managed services you are currently using or planning to use rate the role of these
services have/had in accomplishing the following business goals, using a 0 to 10 scale where 0 = Not at All
Important and 10 = Extremely Important.[% TOP BOX RATING (Most Important 8 thru 10)]
68%
67…
67%
73%
74%
0% 10% 20% 30% 40% 50% 60% 70% 80% 90%
Lower costs
Speed time to market
Lower risk
Increase revenue
Improve product or service
quality
Total (n=1707)
NA (n=936)
WE (n=321)
MEA (n=47)
APAC (n=309)
LA (n=95)
108](https://image.slidesharecdn.com/2017microsofthostingandcloudstudy-170412003031/85/2017-Microsoft-hosting-and-cloud-study-108-320.jpg)
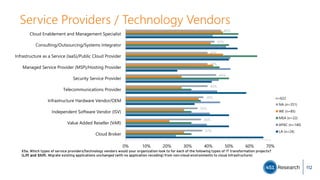


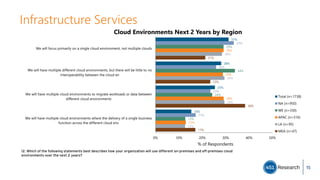
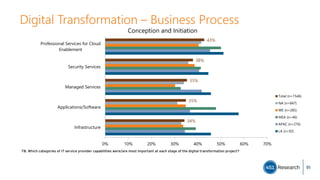
The 2017 study commissioned by Microsoft reveals that 62% of cloud spending is bundled with value-added services, emphasizing the significance of managed infrastructure services. Key insights include a rising trend towards multi-cloud environments, with 41% of organizations already adopting this approach, driven by the need for better resource management and operational efficiency. Service providers are deemed vital for future digital transformation projects, with 60% of organizations willing to pay a premium for comprehensive managed solutions.