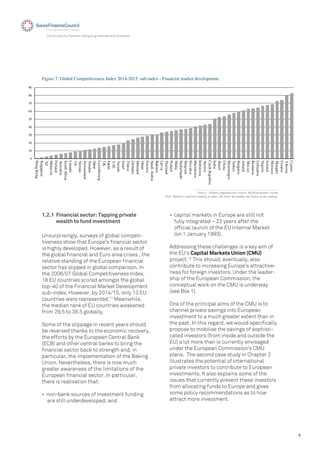
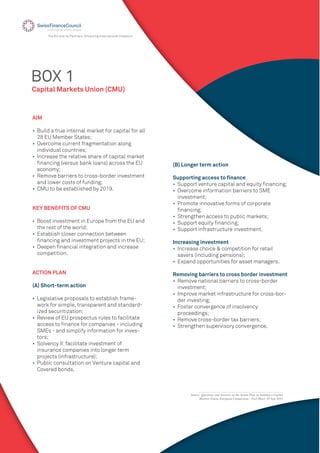
This document discusses attracting international investment to boost economic growth in the EU. It presents three case studies:
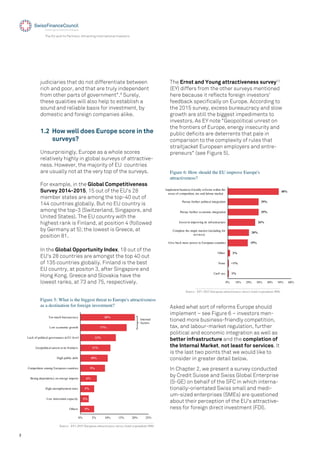
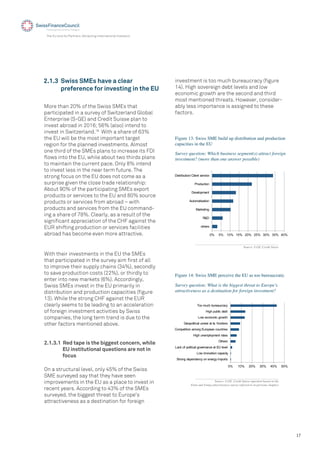
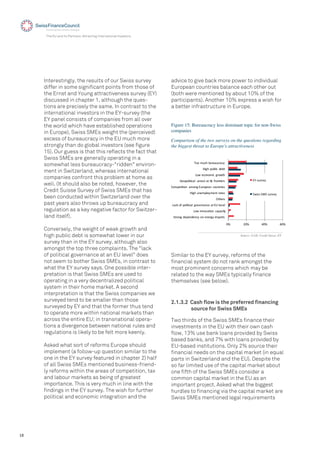
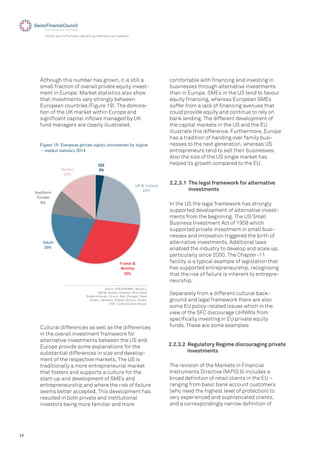
1) A survey of Swiss SMEs found their main concern when investing internationally is time-consuming bureaucracy. Despite limited capital market use, 20% see the EU common capital market as important.
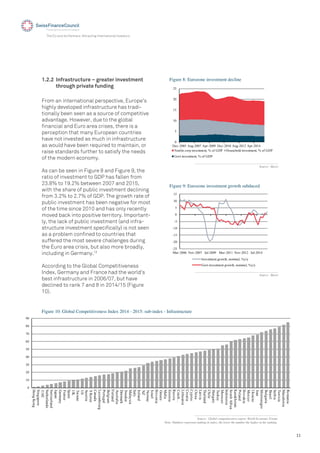
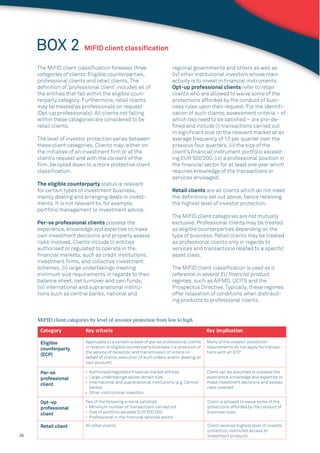
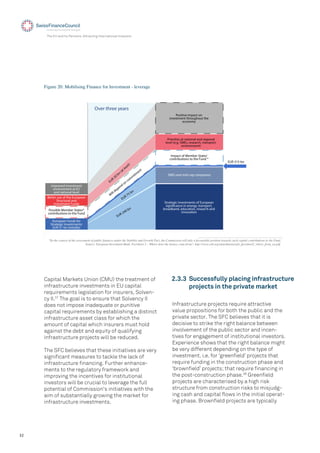
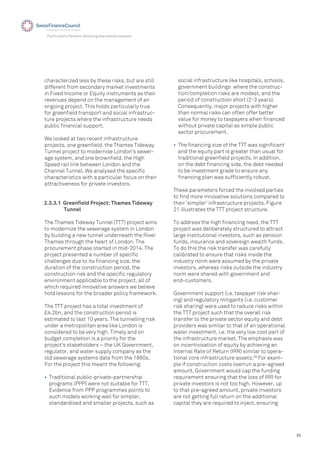
2) Private investors can help fund long-term projects like infrastructure. EU policies should encourage private investment through enhanced regulation, better taxation, and streamlined alternative investment registration and distribution.
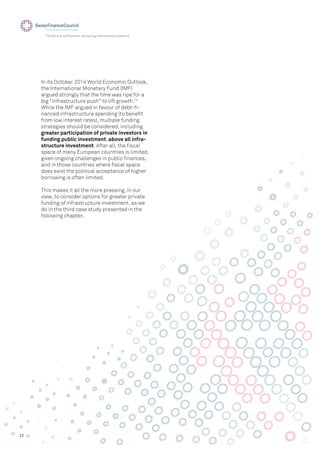
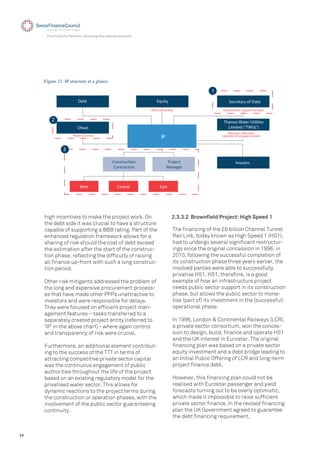
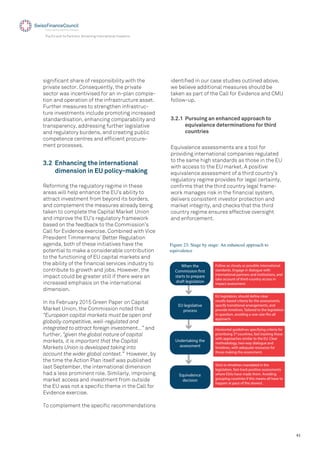
3) UK infrastructure case studies show public-private partnerships can fund projects through innovative financing like contingent guarantees. The IMF argues infrastructure investment can stimulate growth.