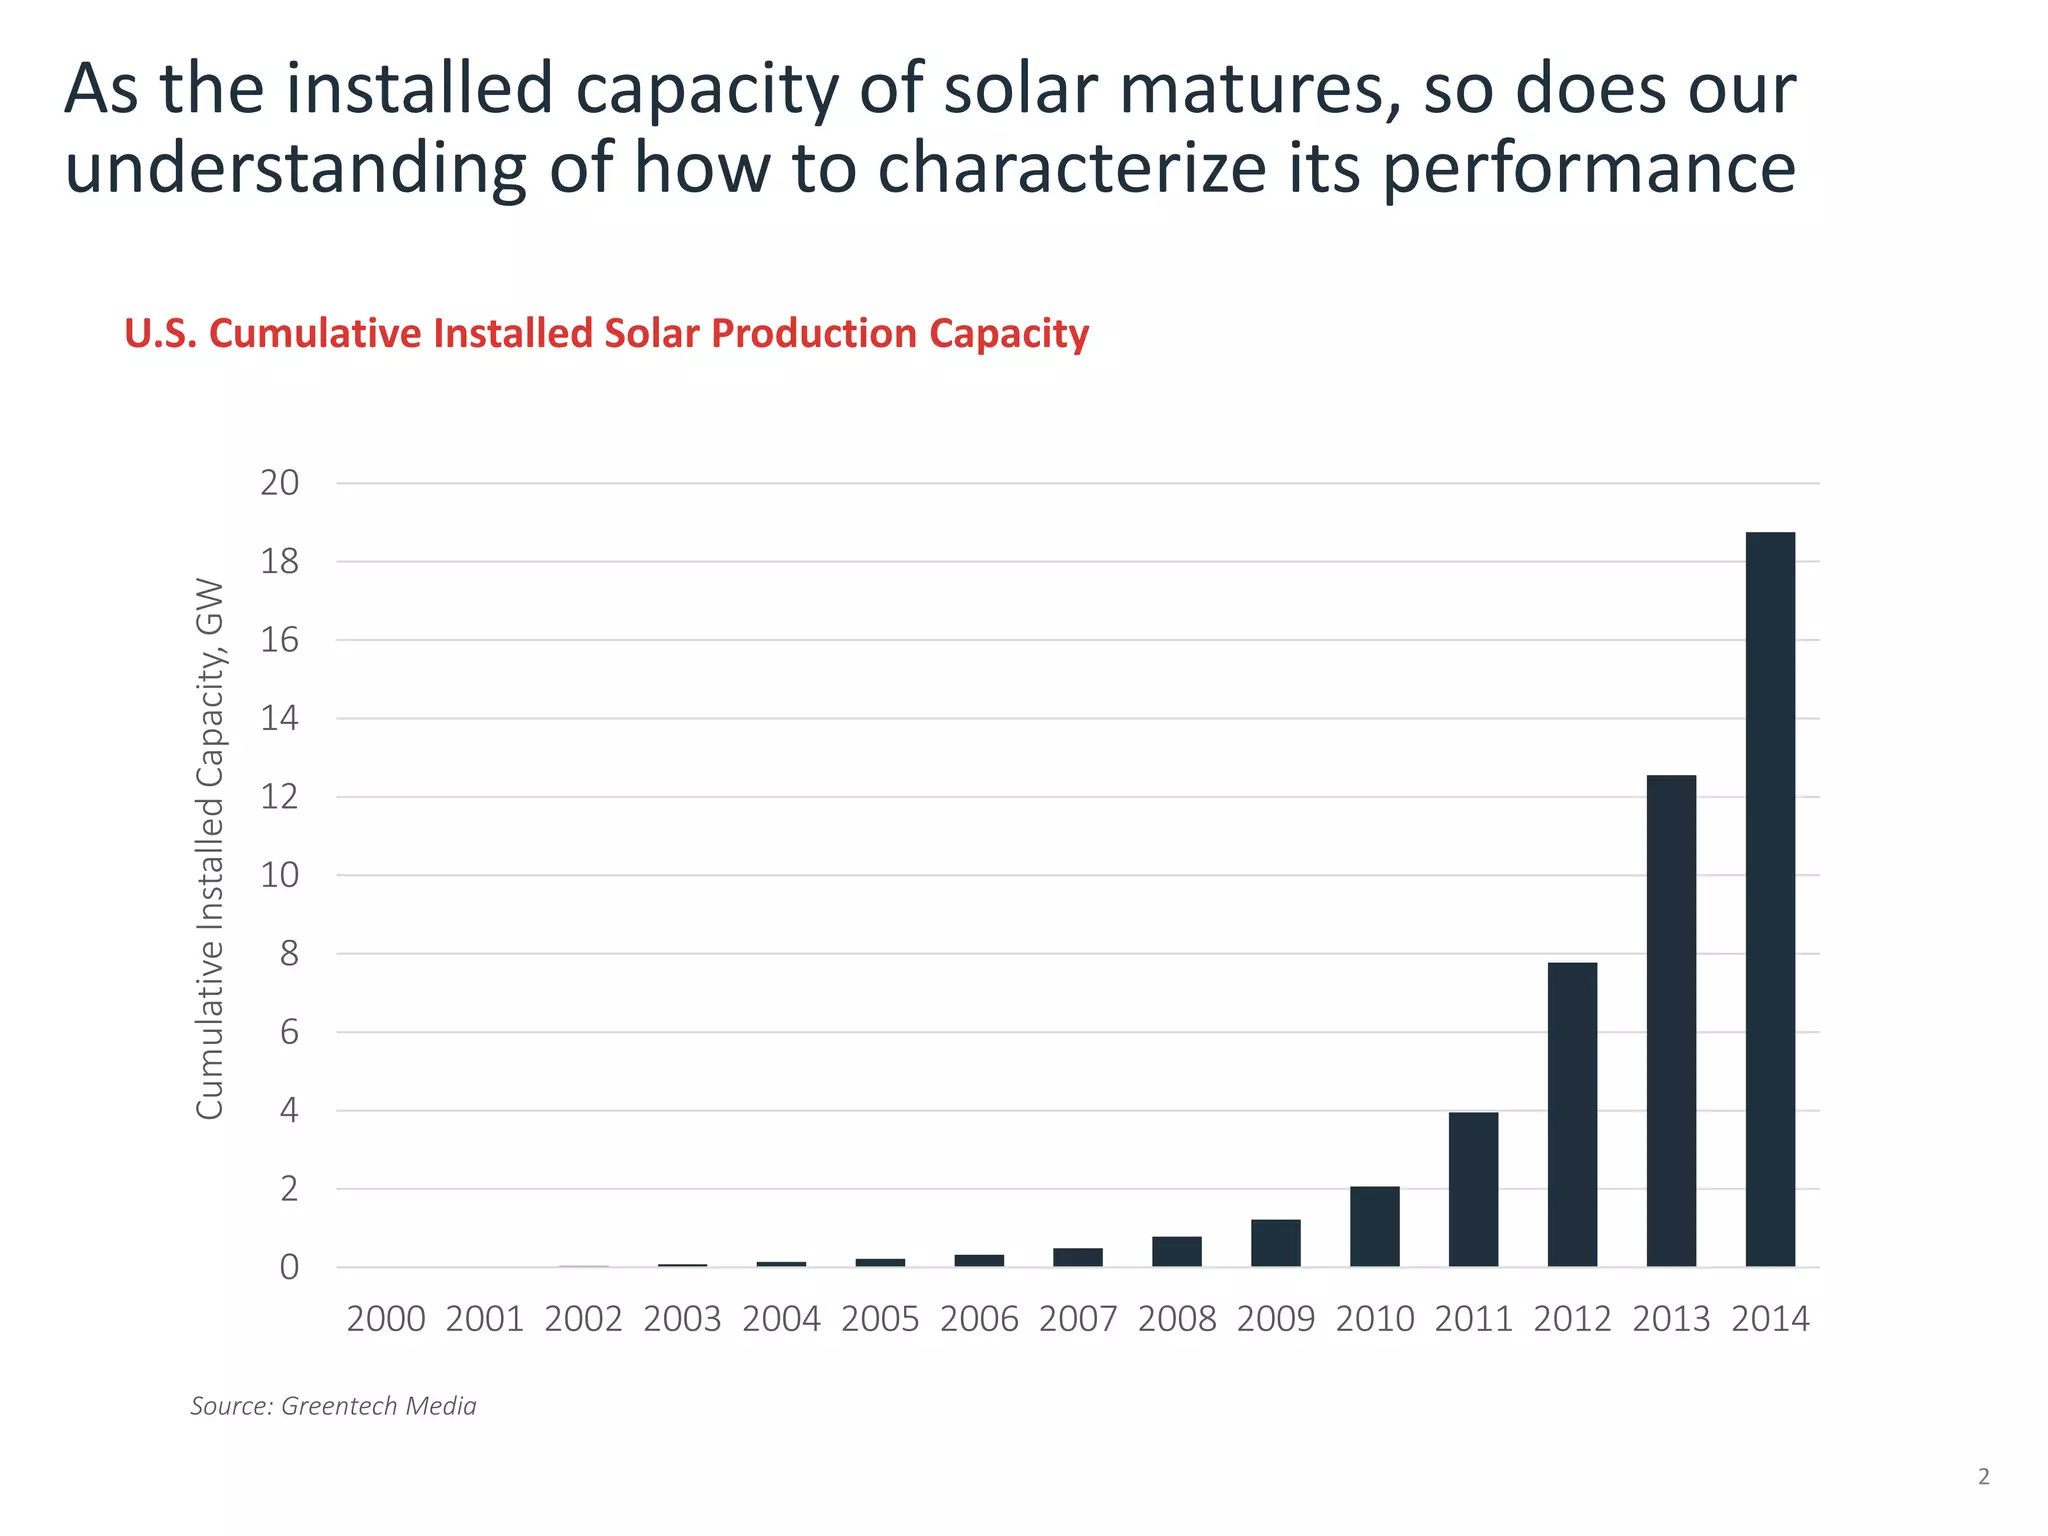
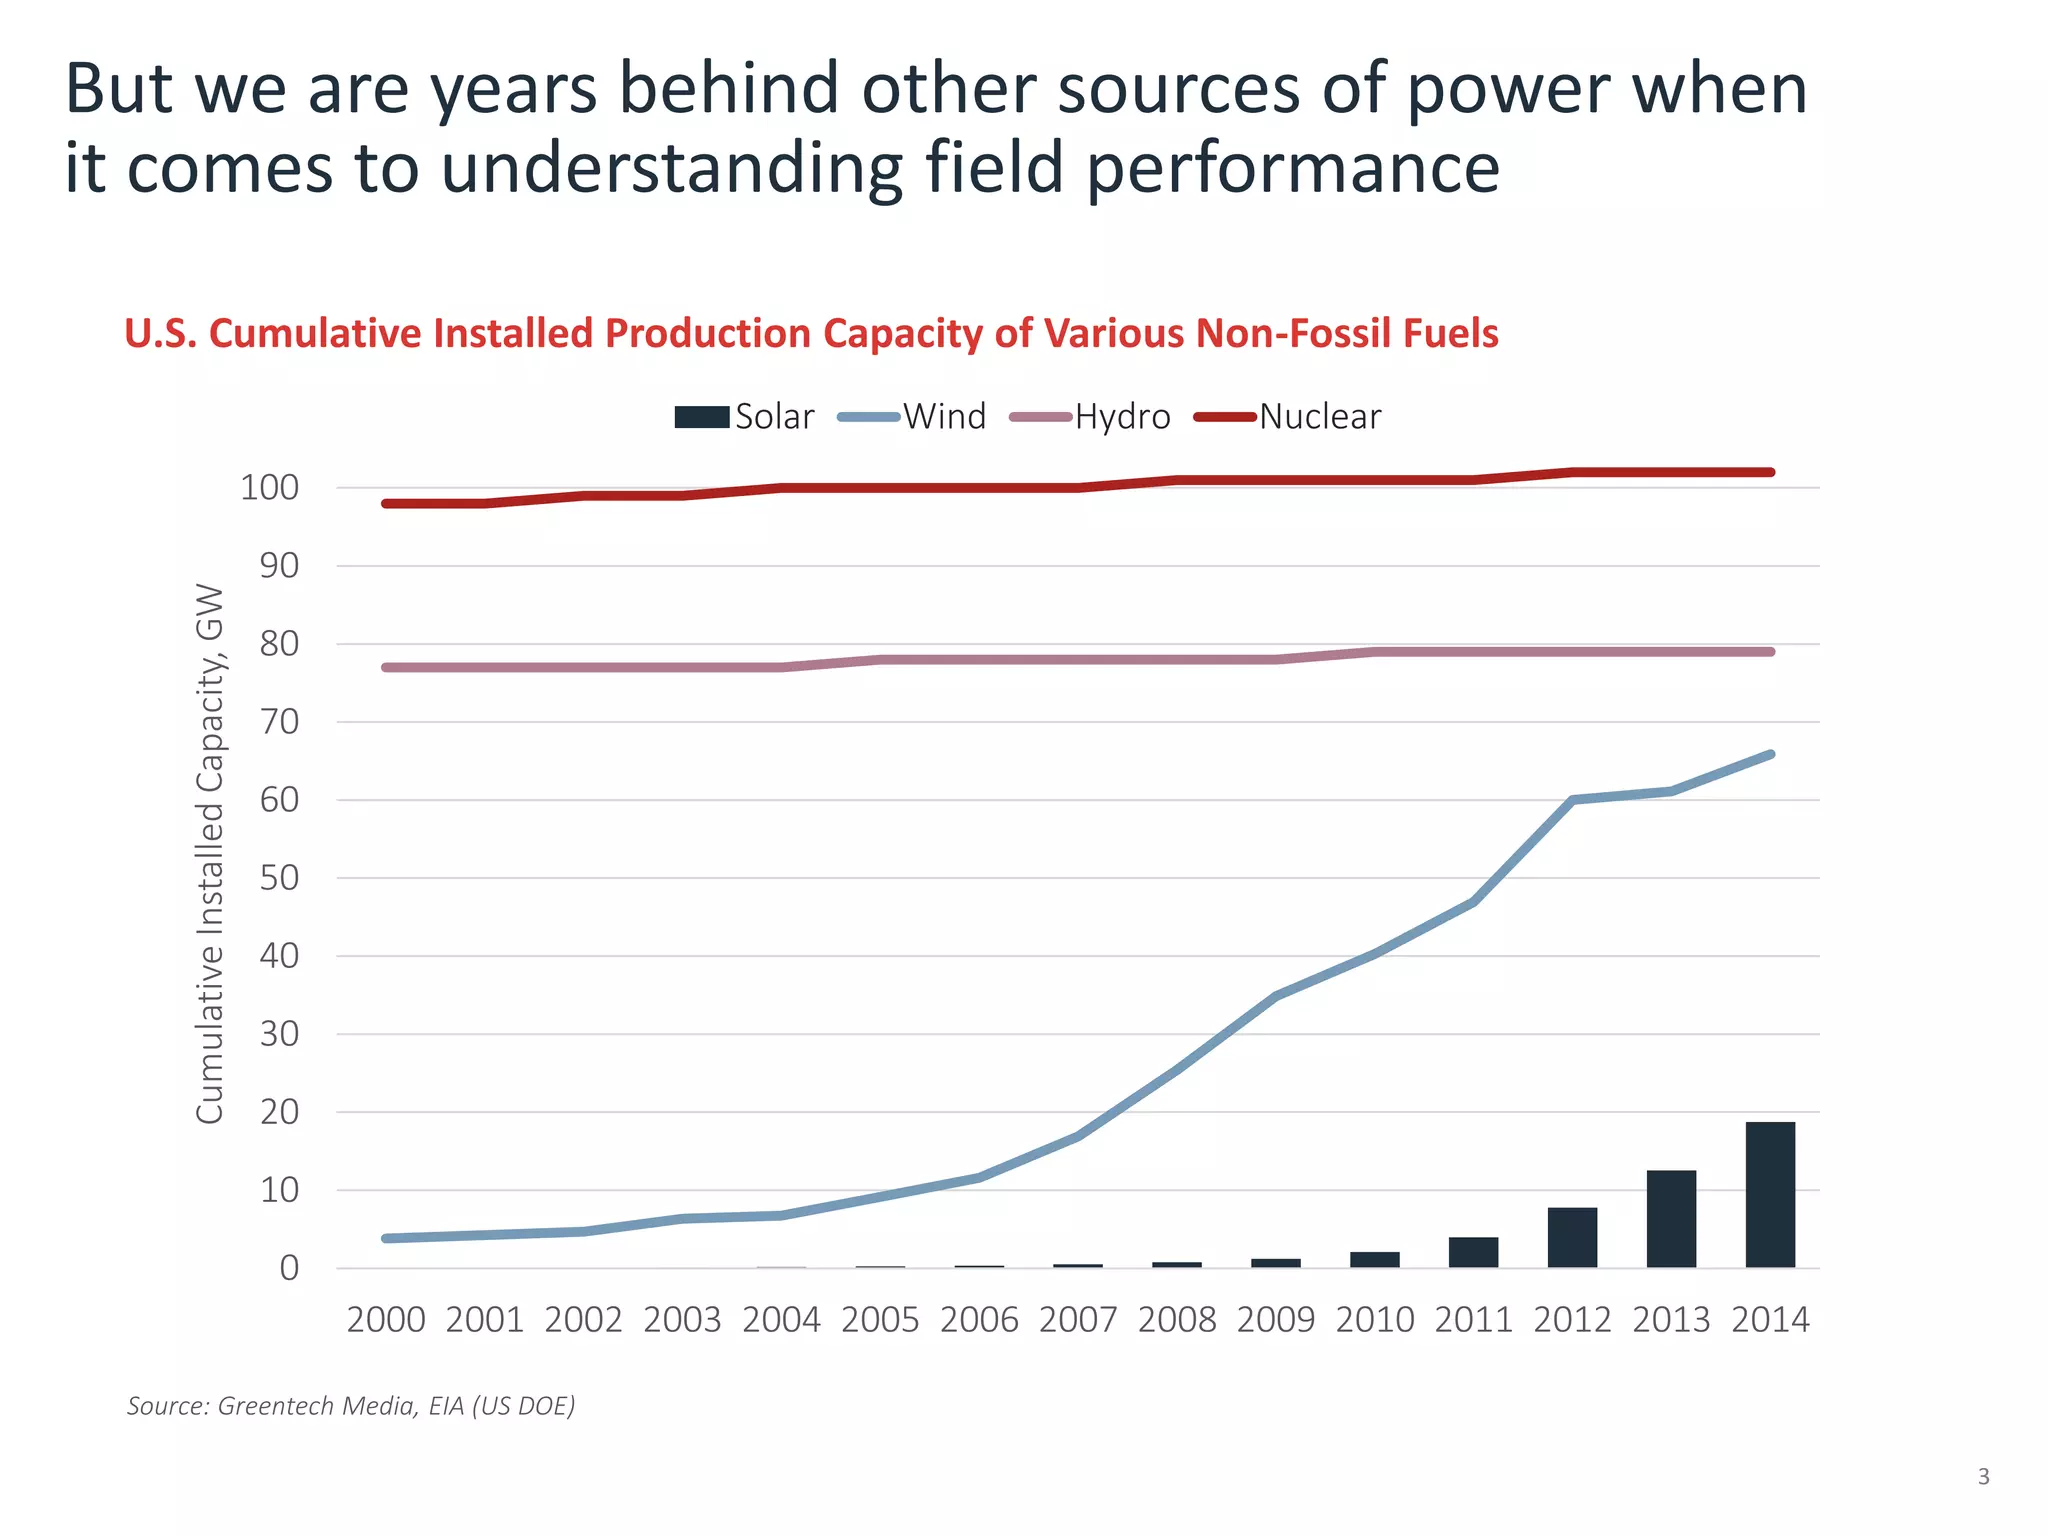
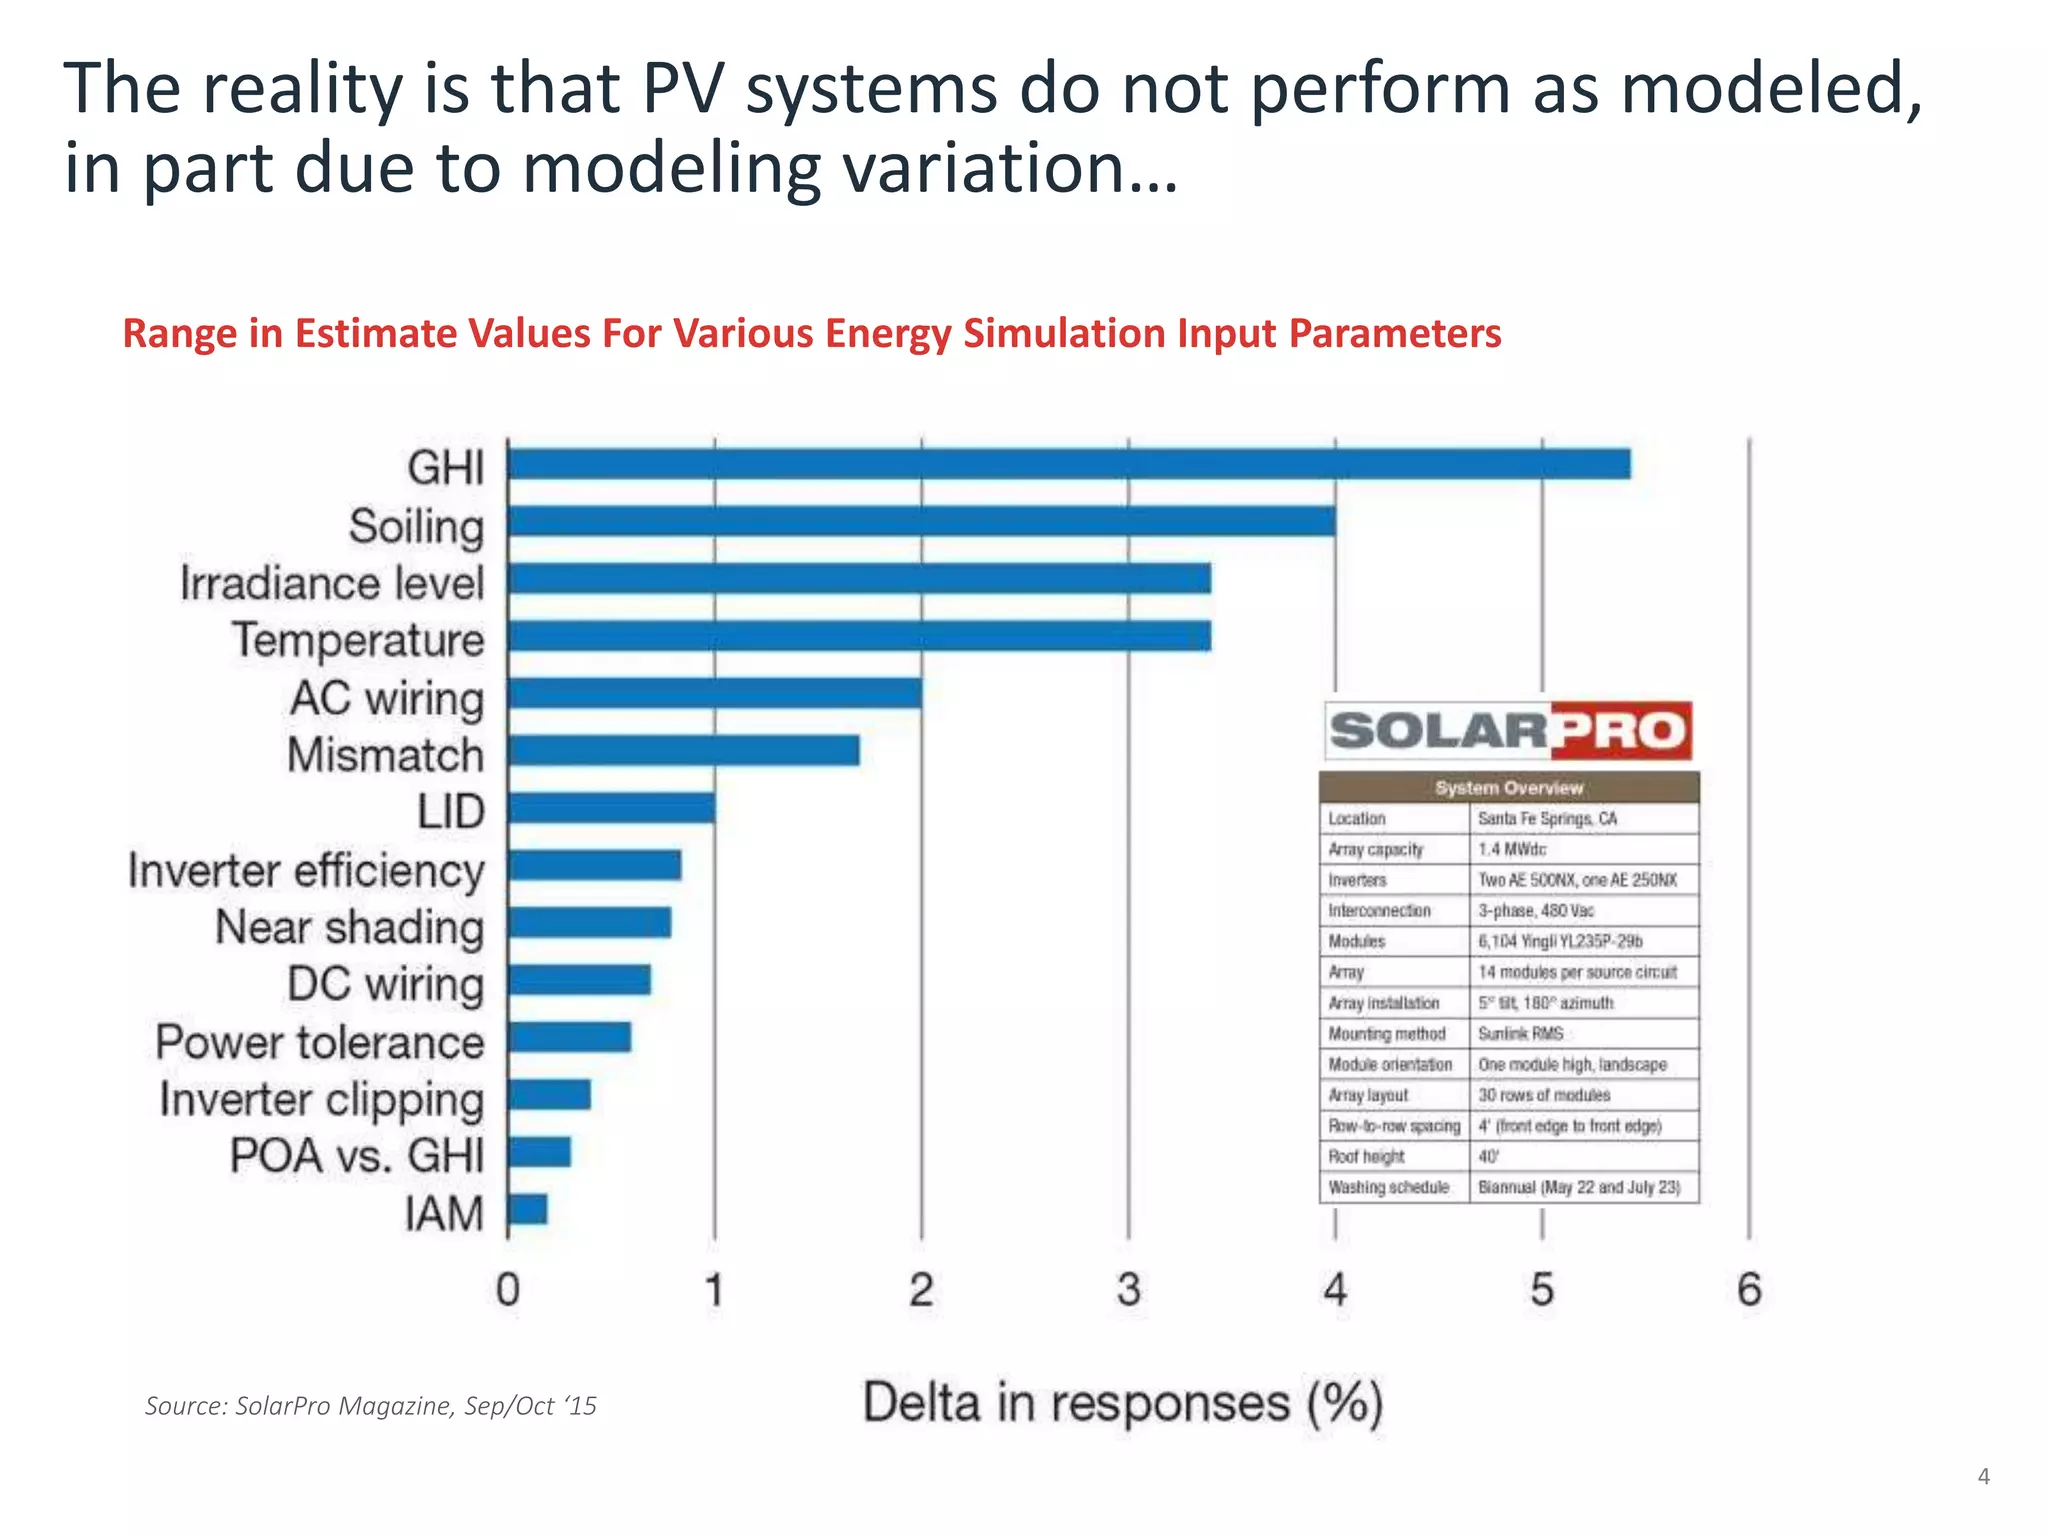
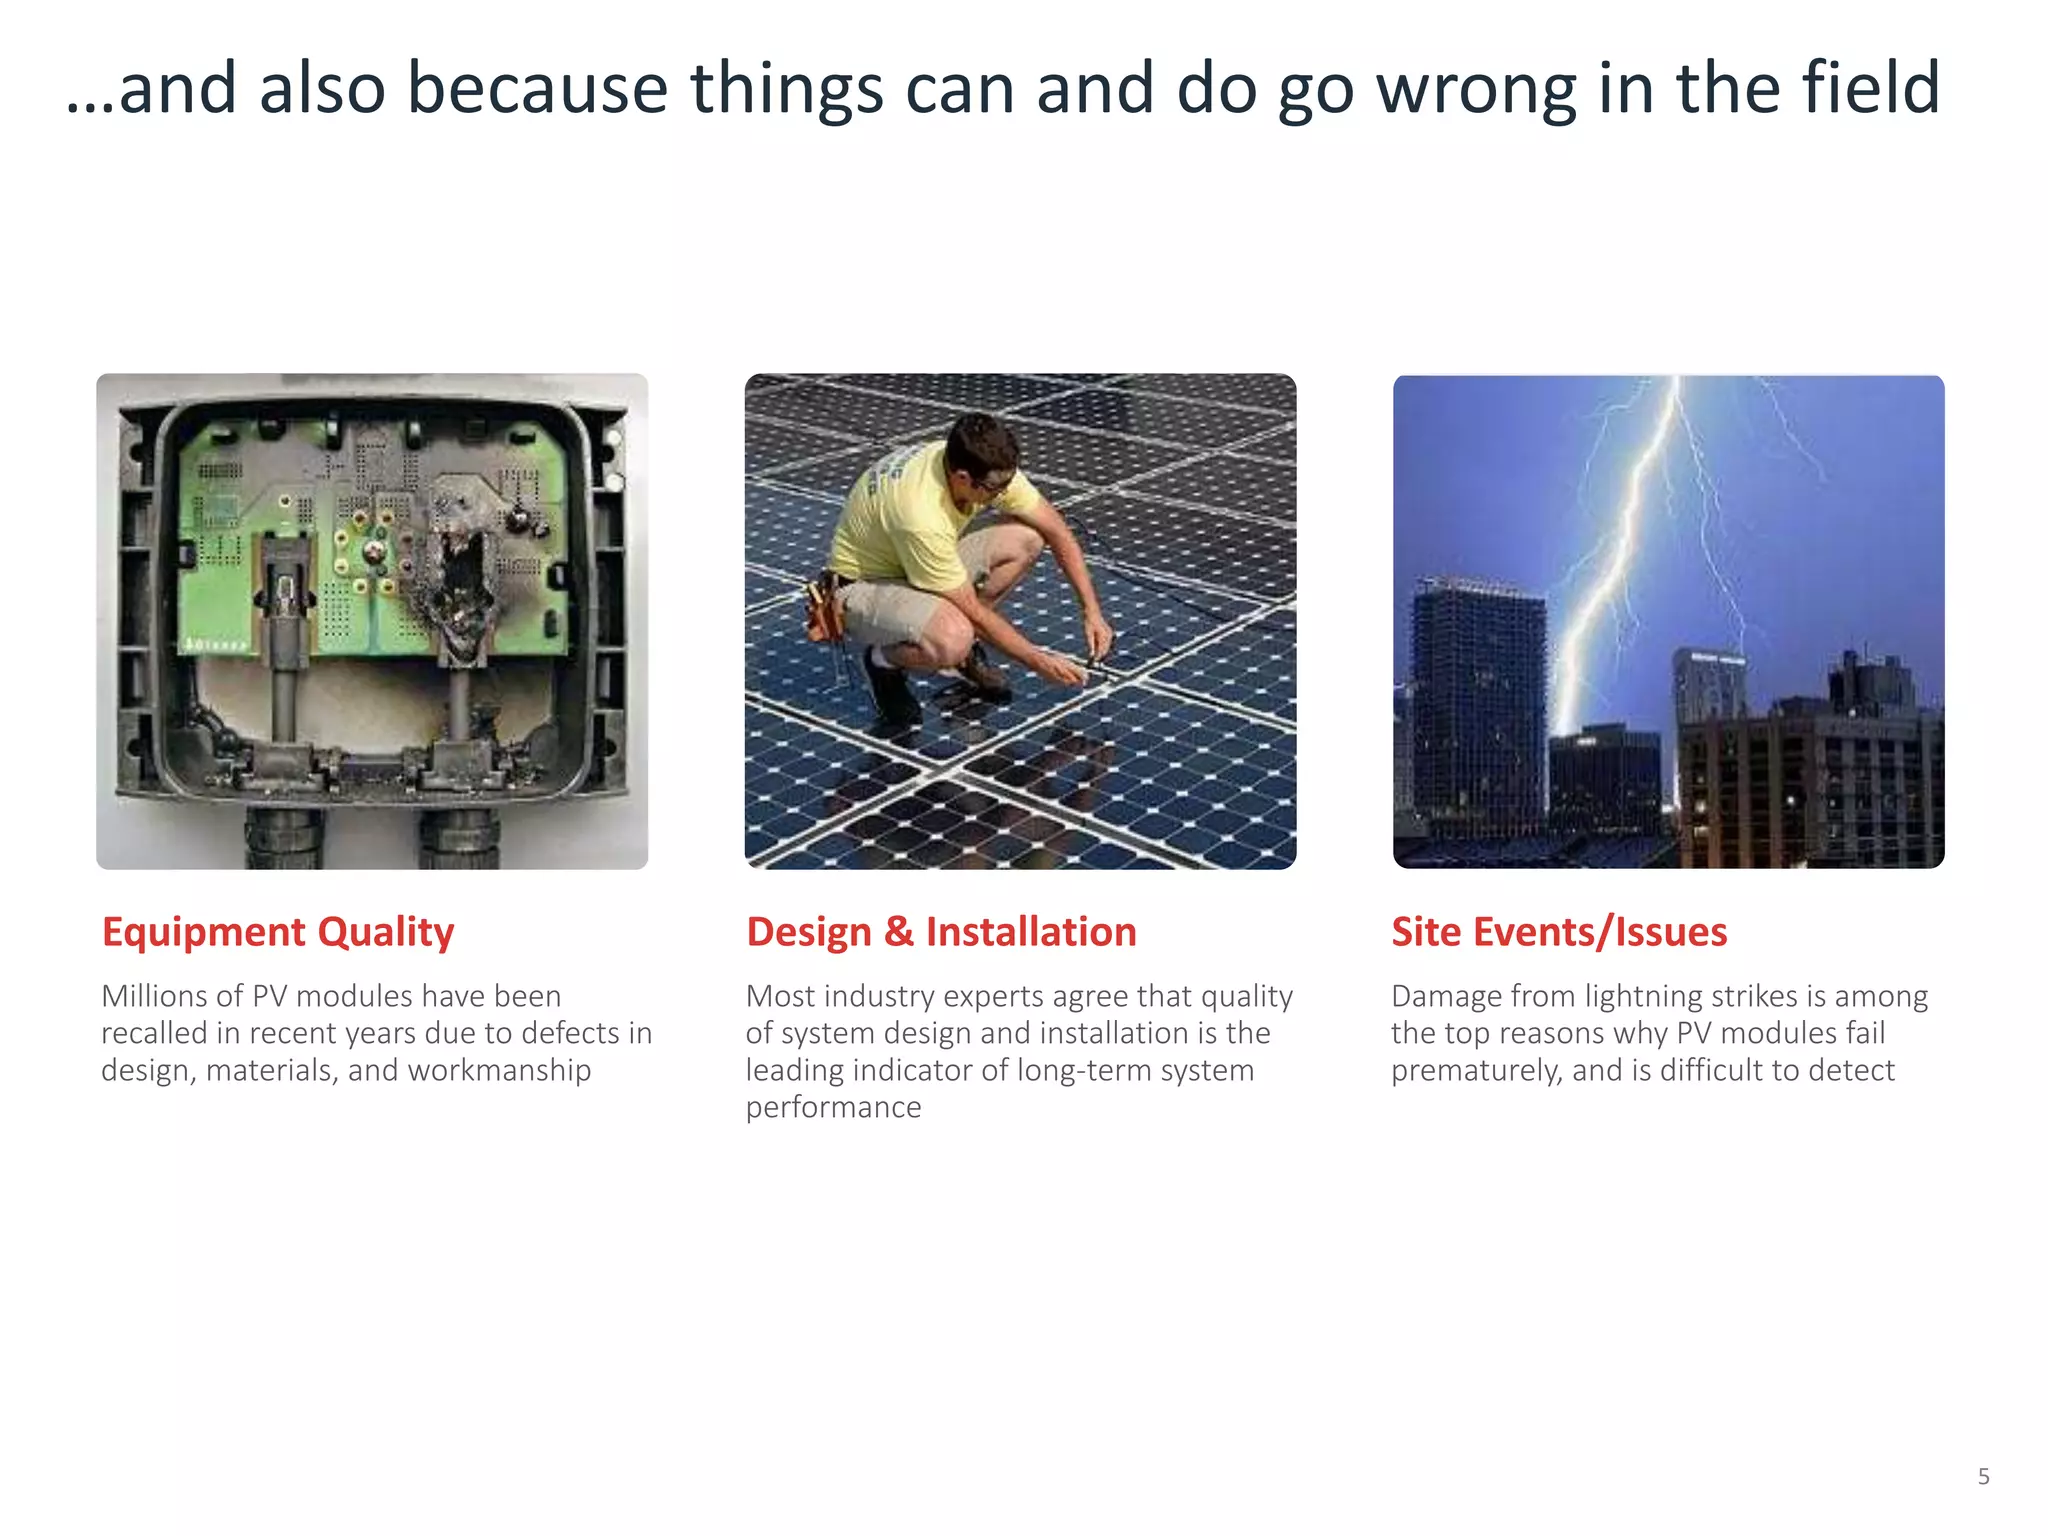
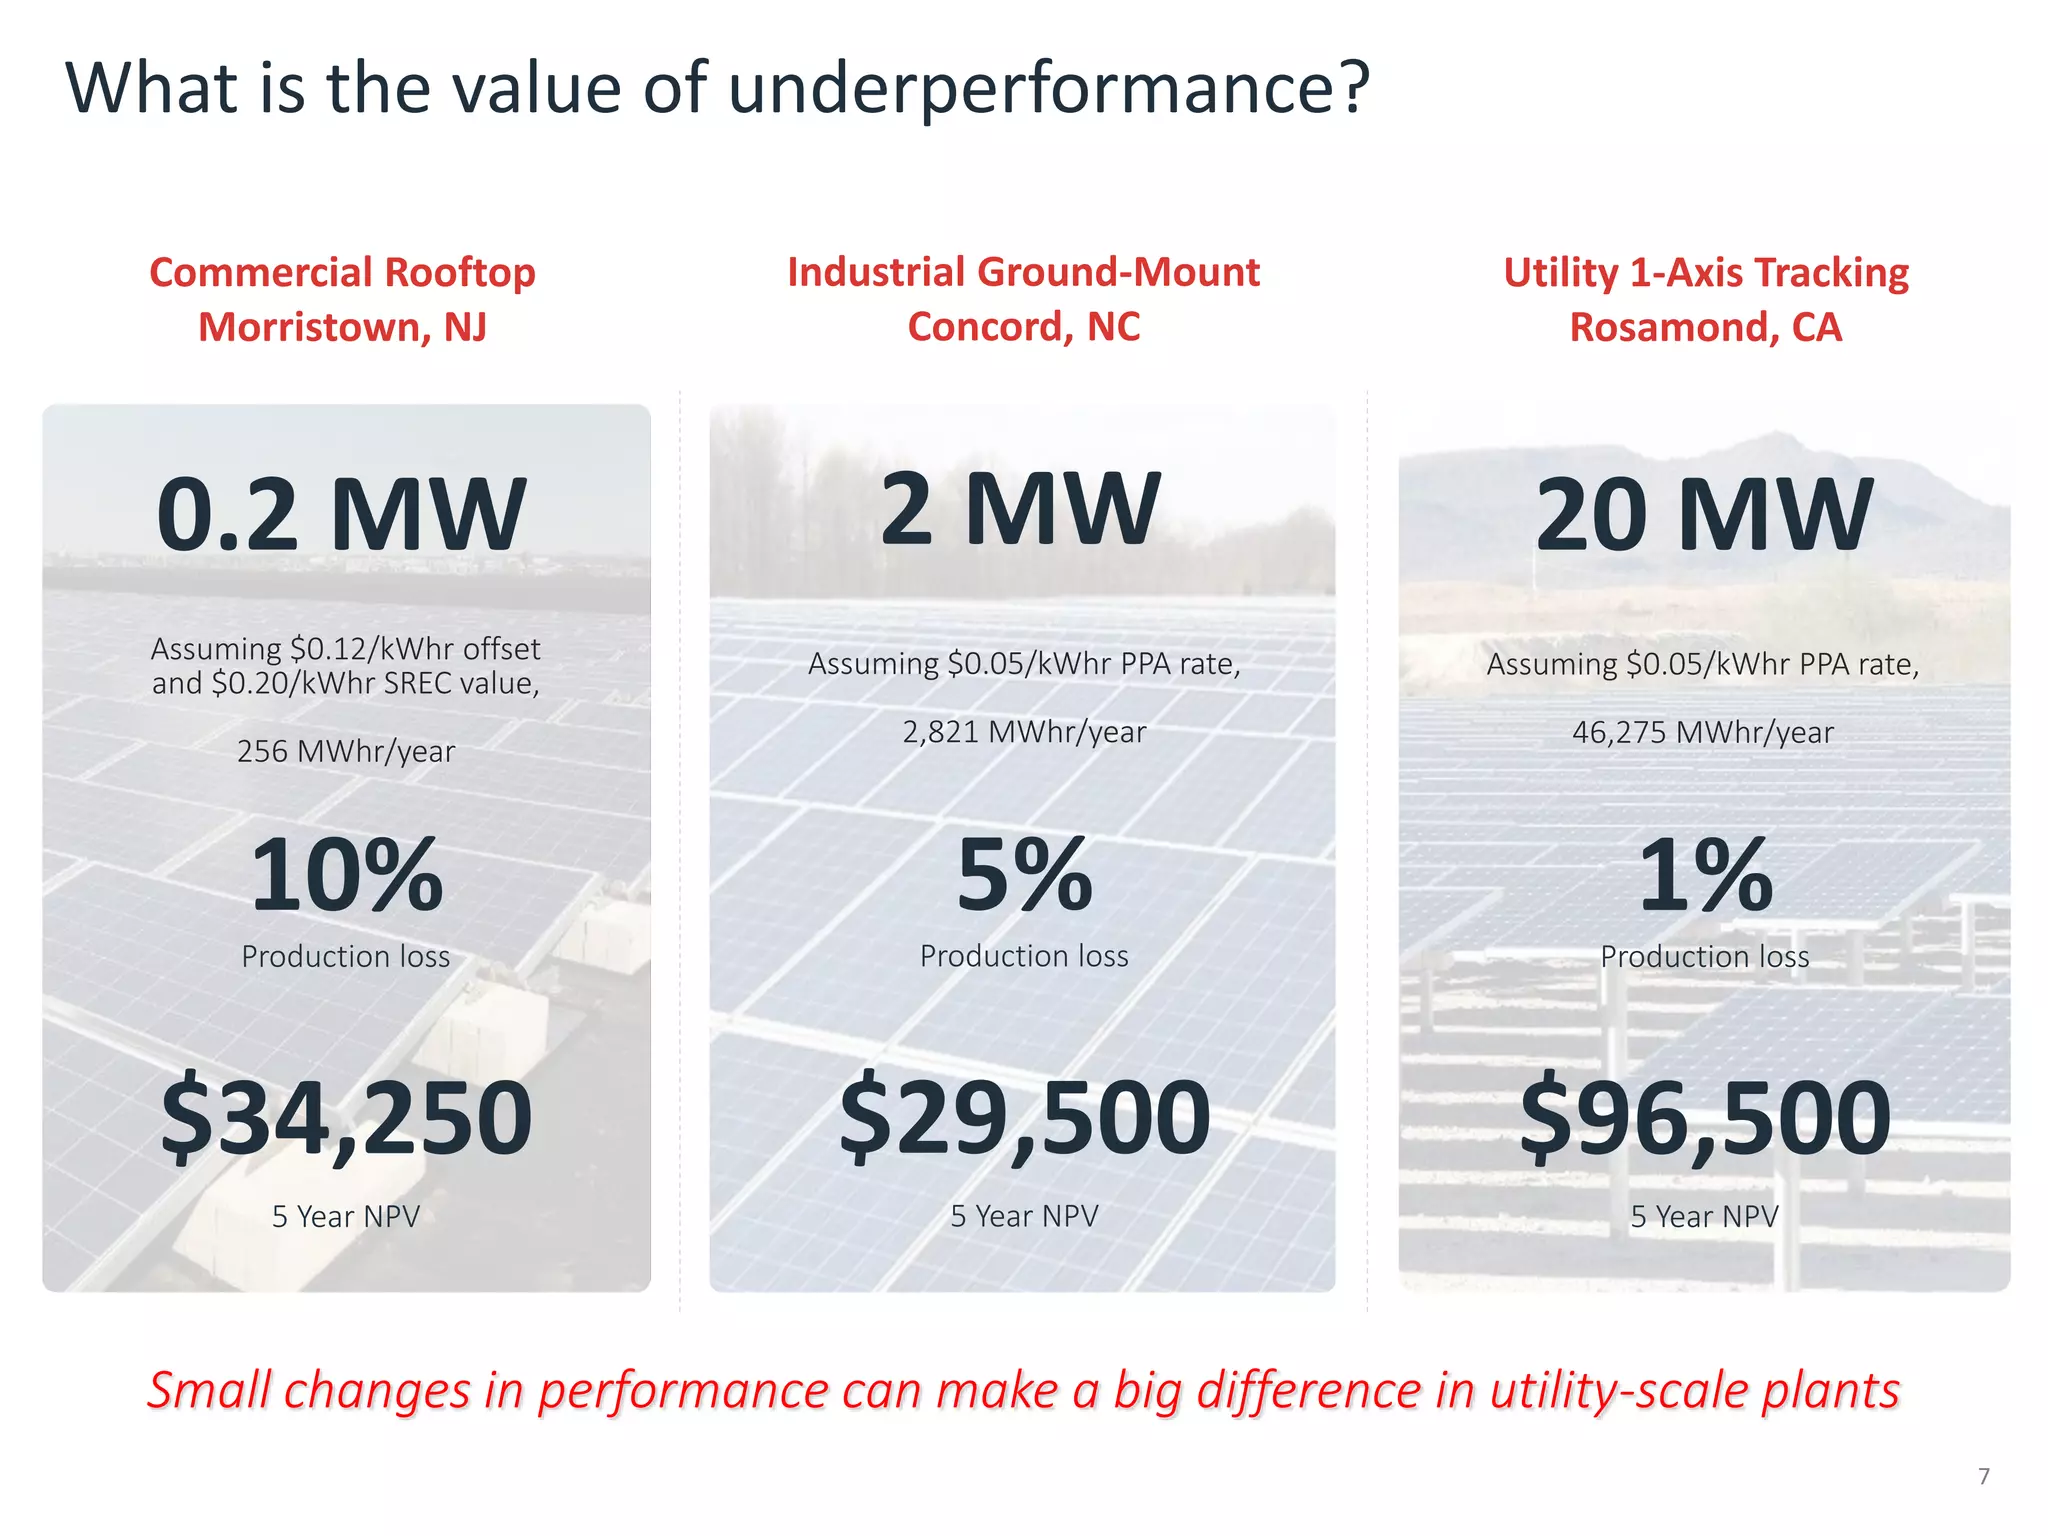
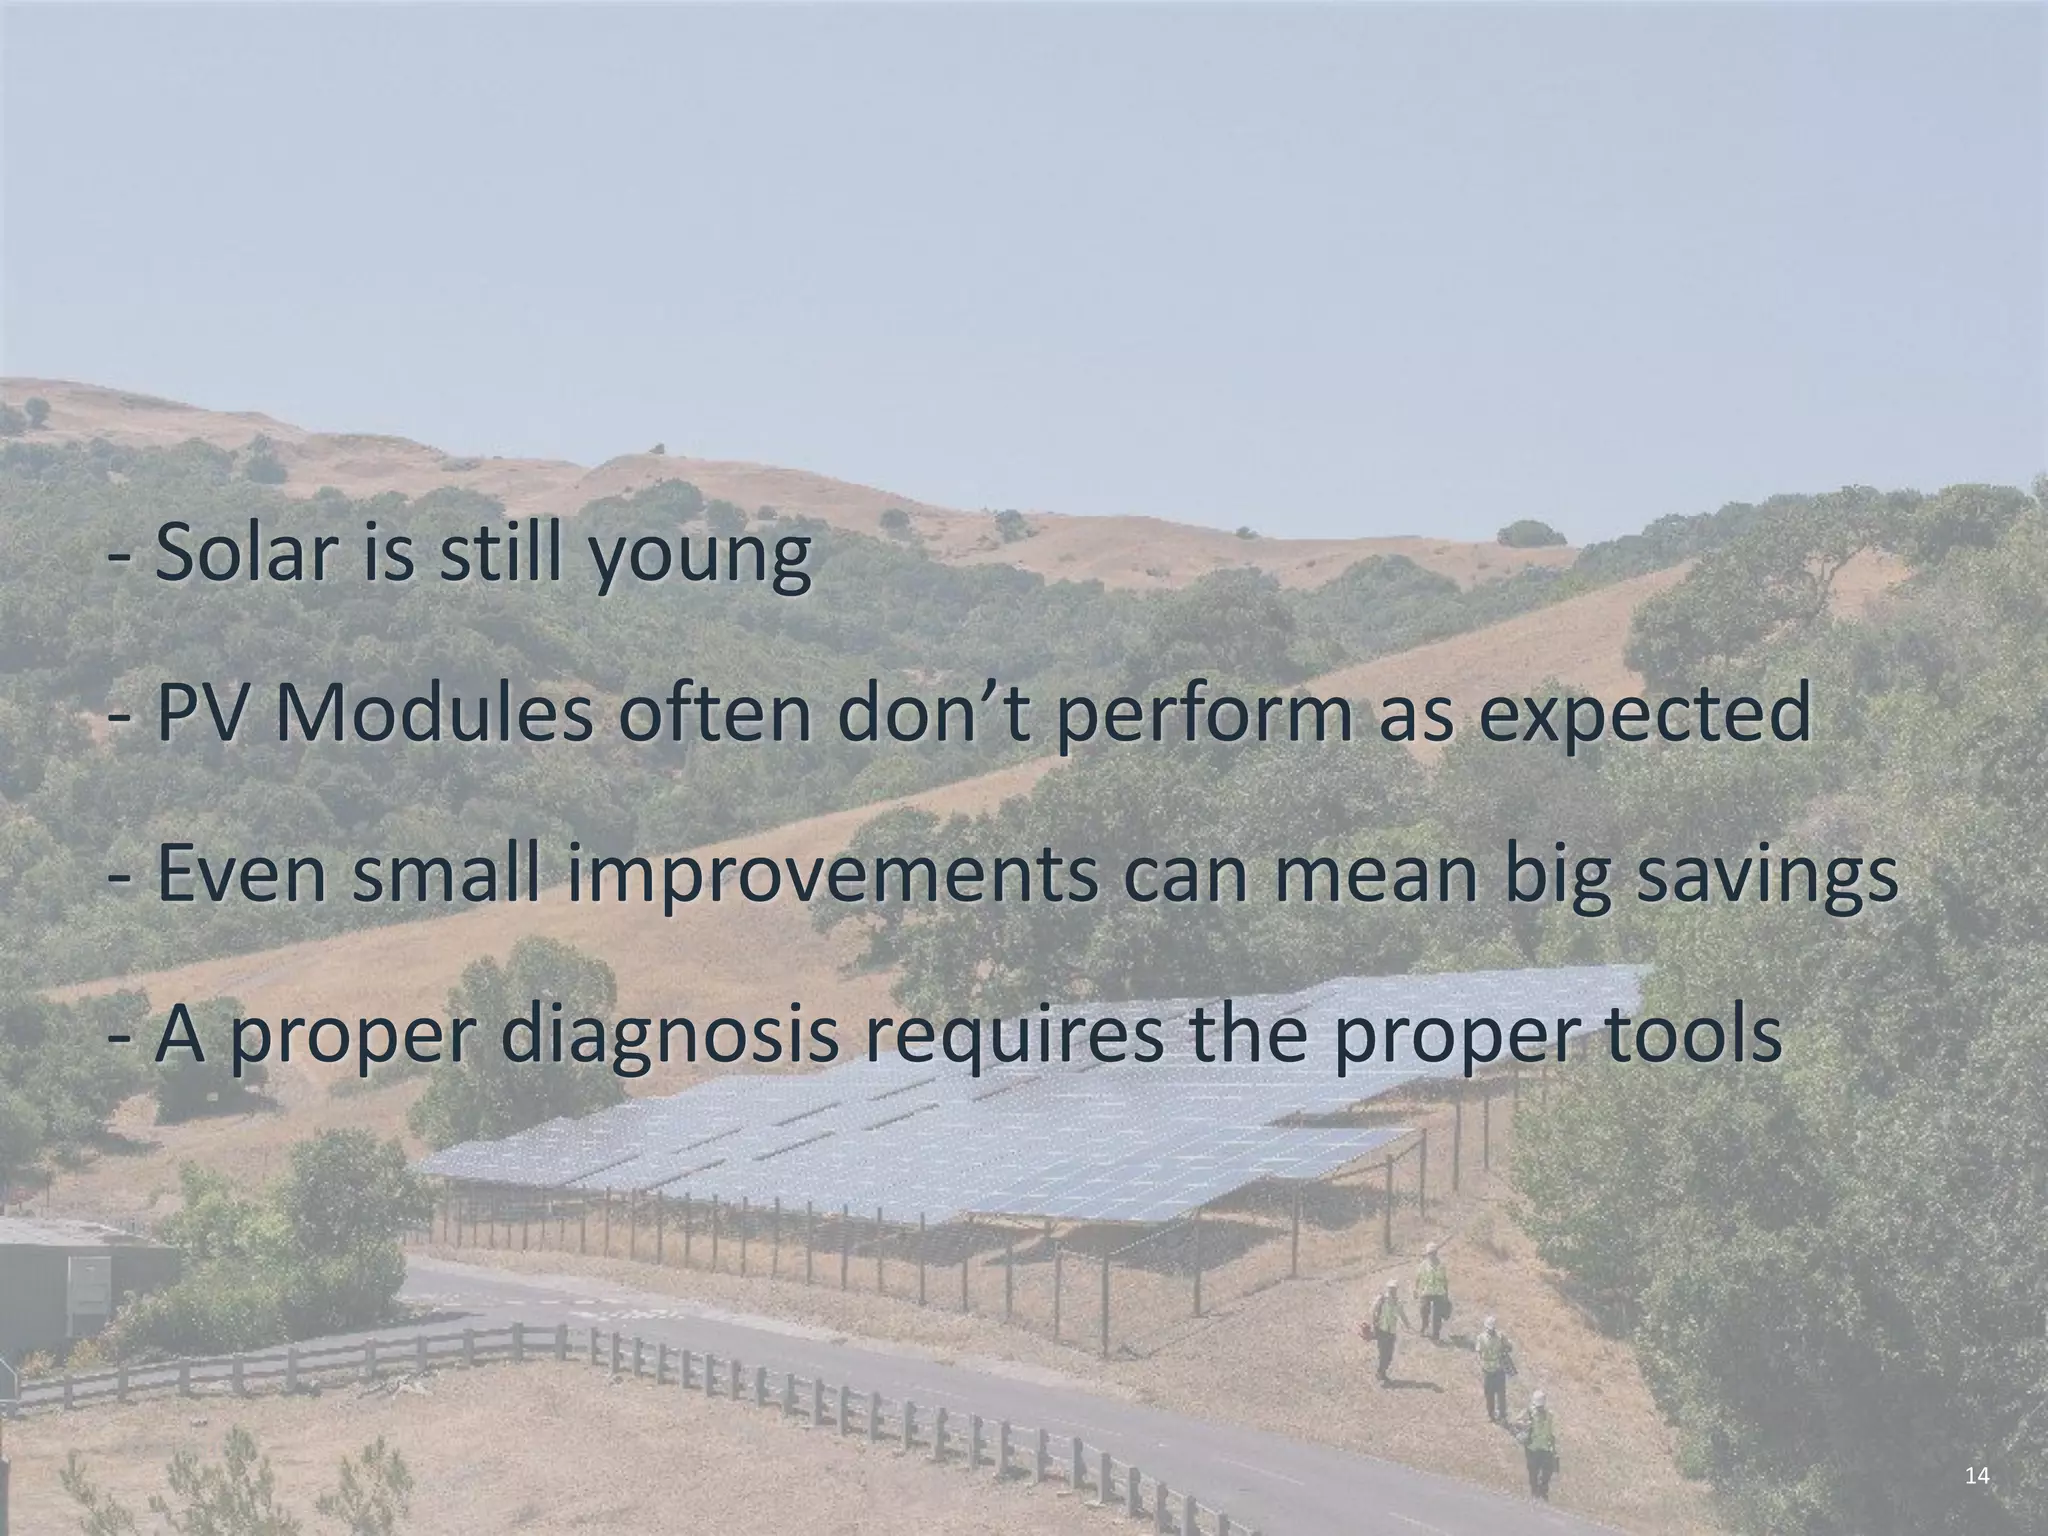
- As solar capacity increases, better understanding performance in the field is needed as PV systems often underperform models due to various factors like defects, installation issues, and weather events.
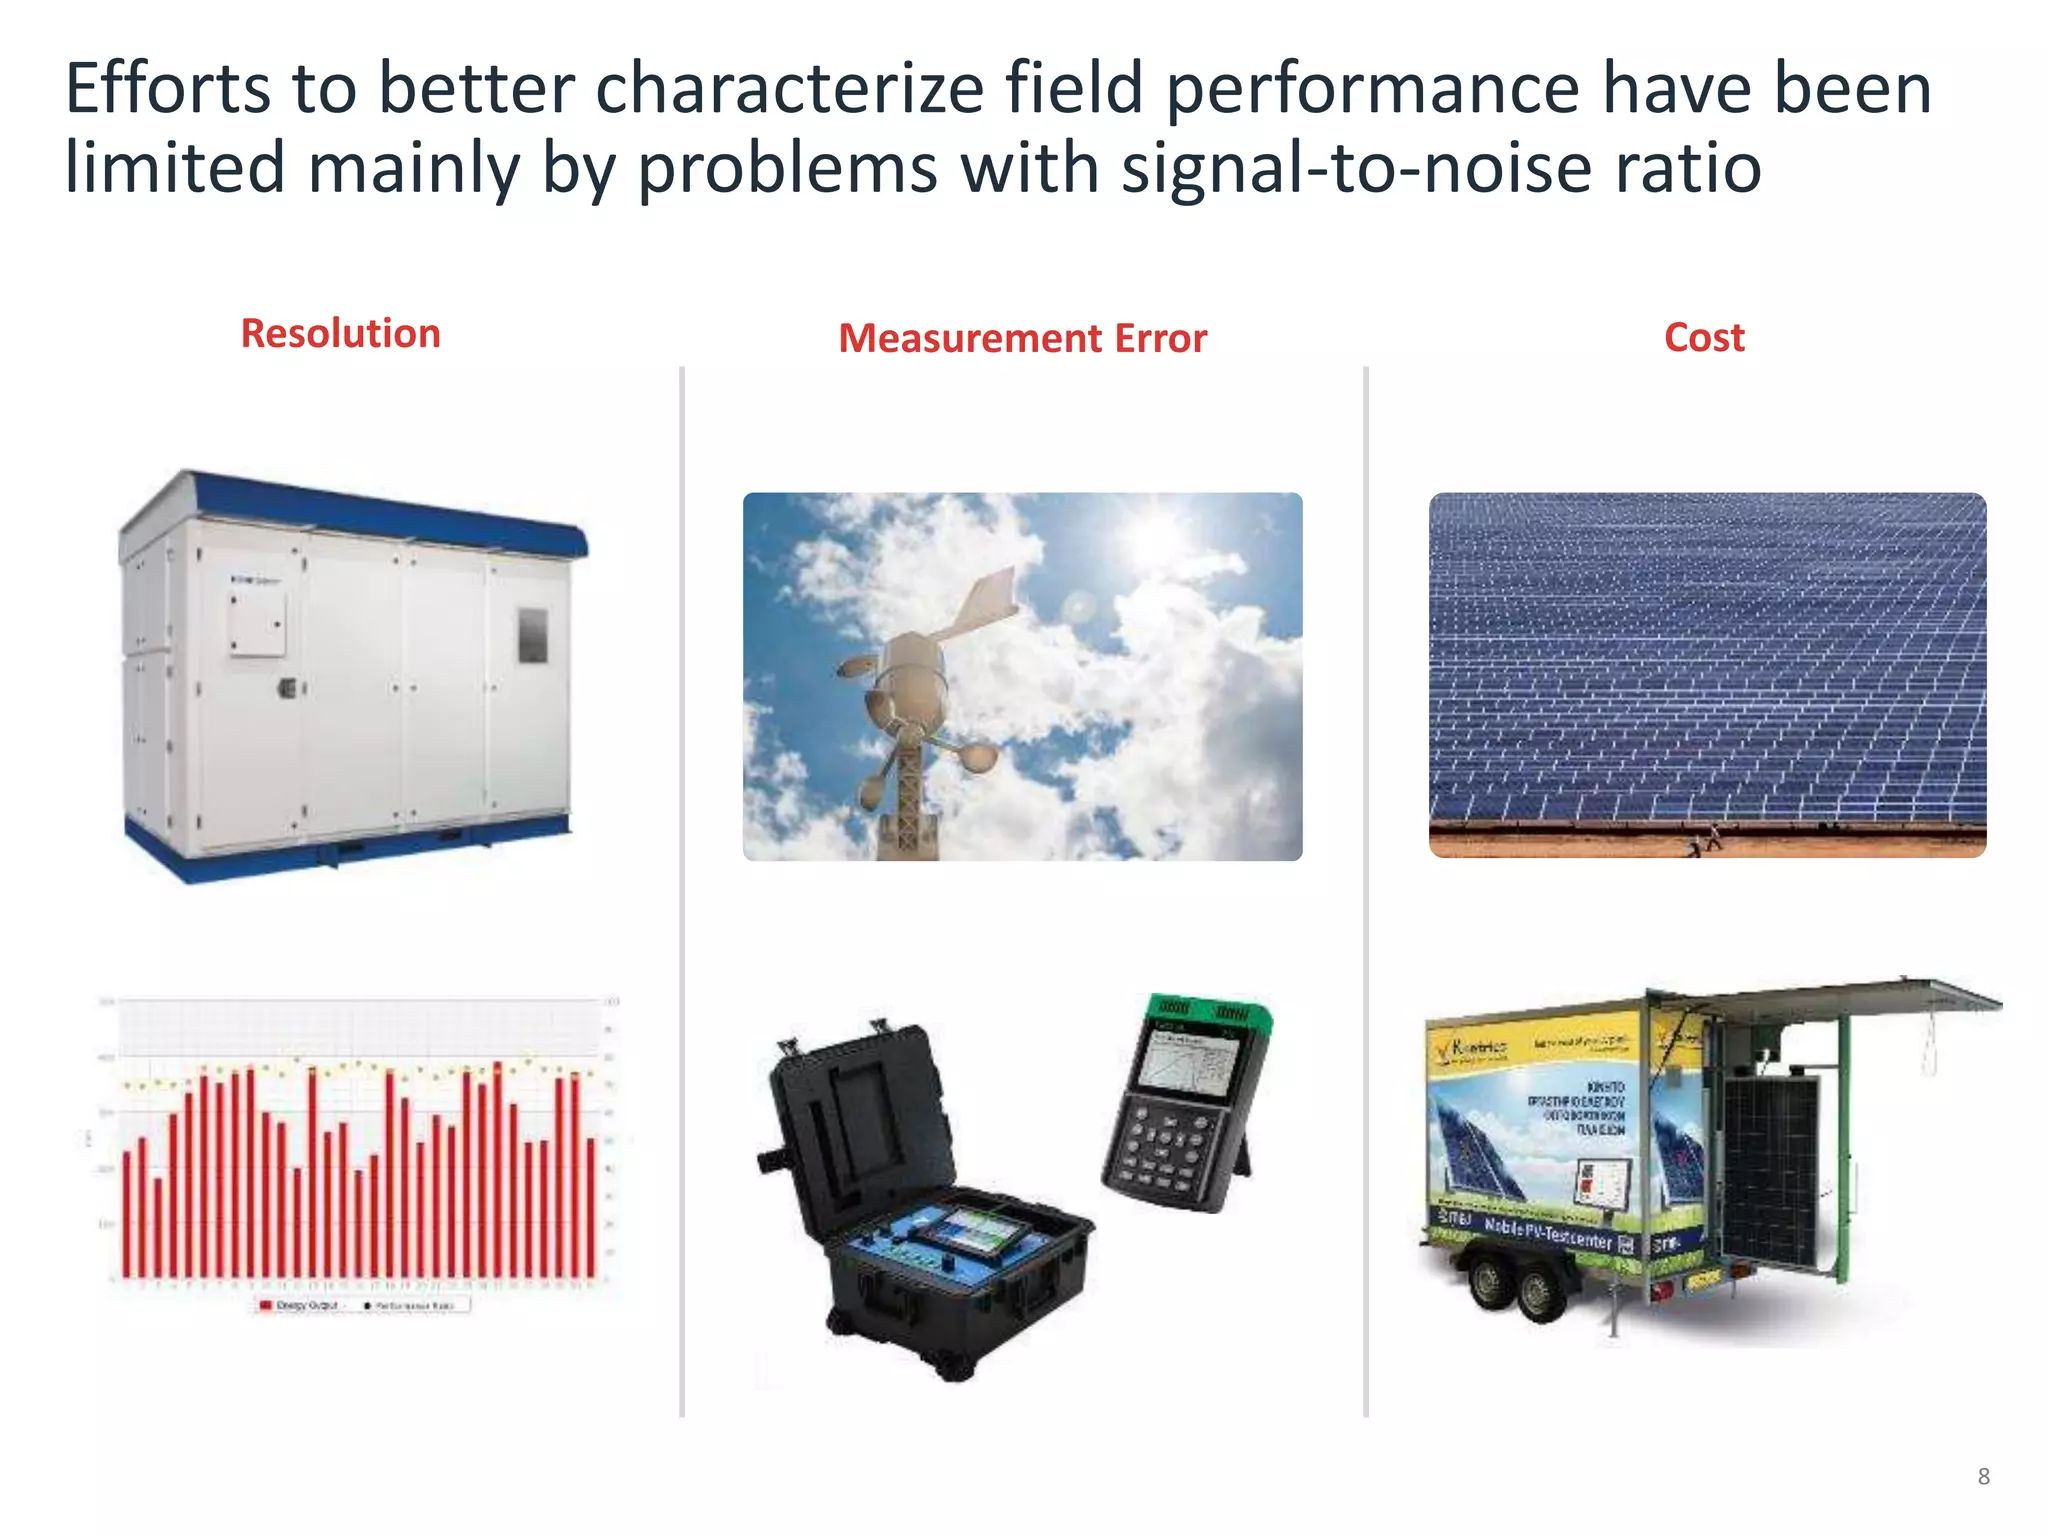
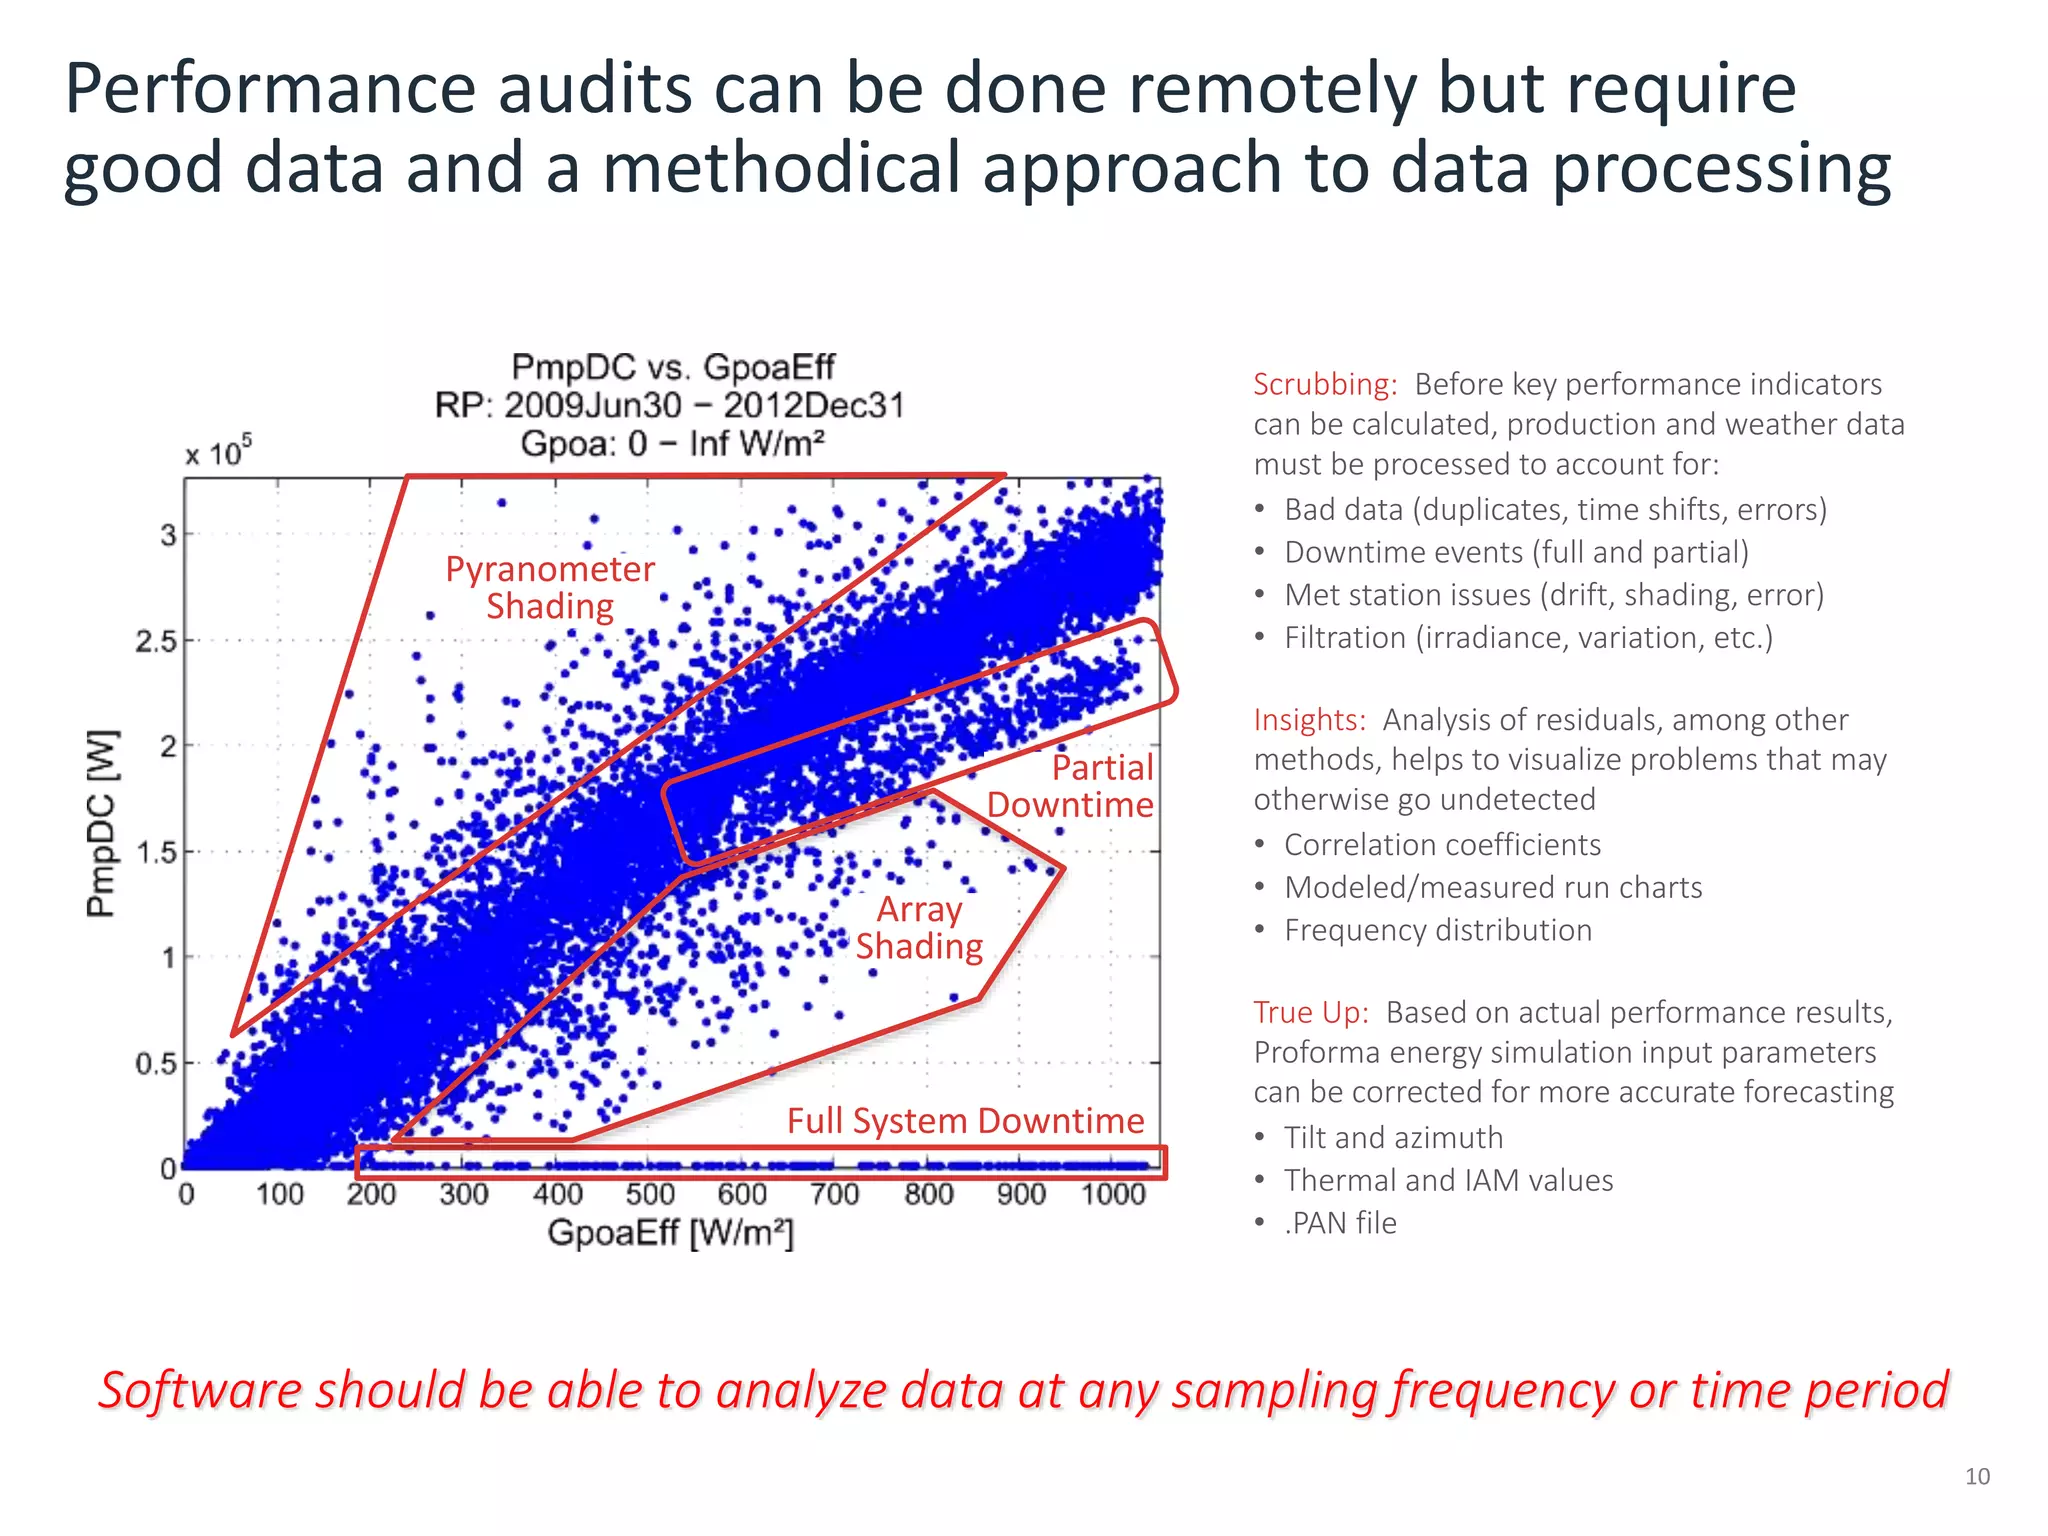
- Novel methods are required to characterize field performance as current approaches have limitations due to signal-to-noise ratios in production and weather data.
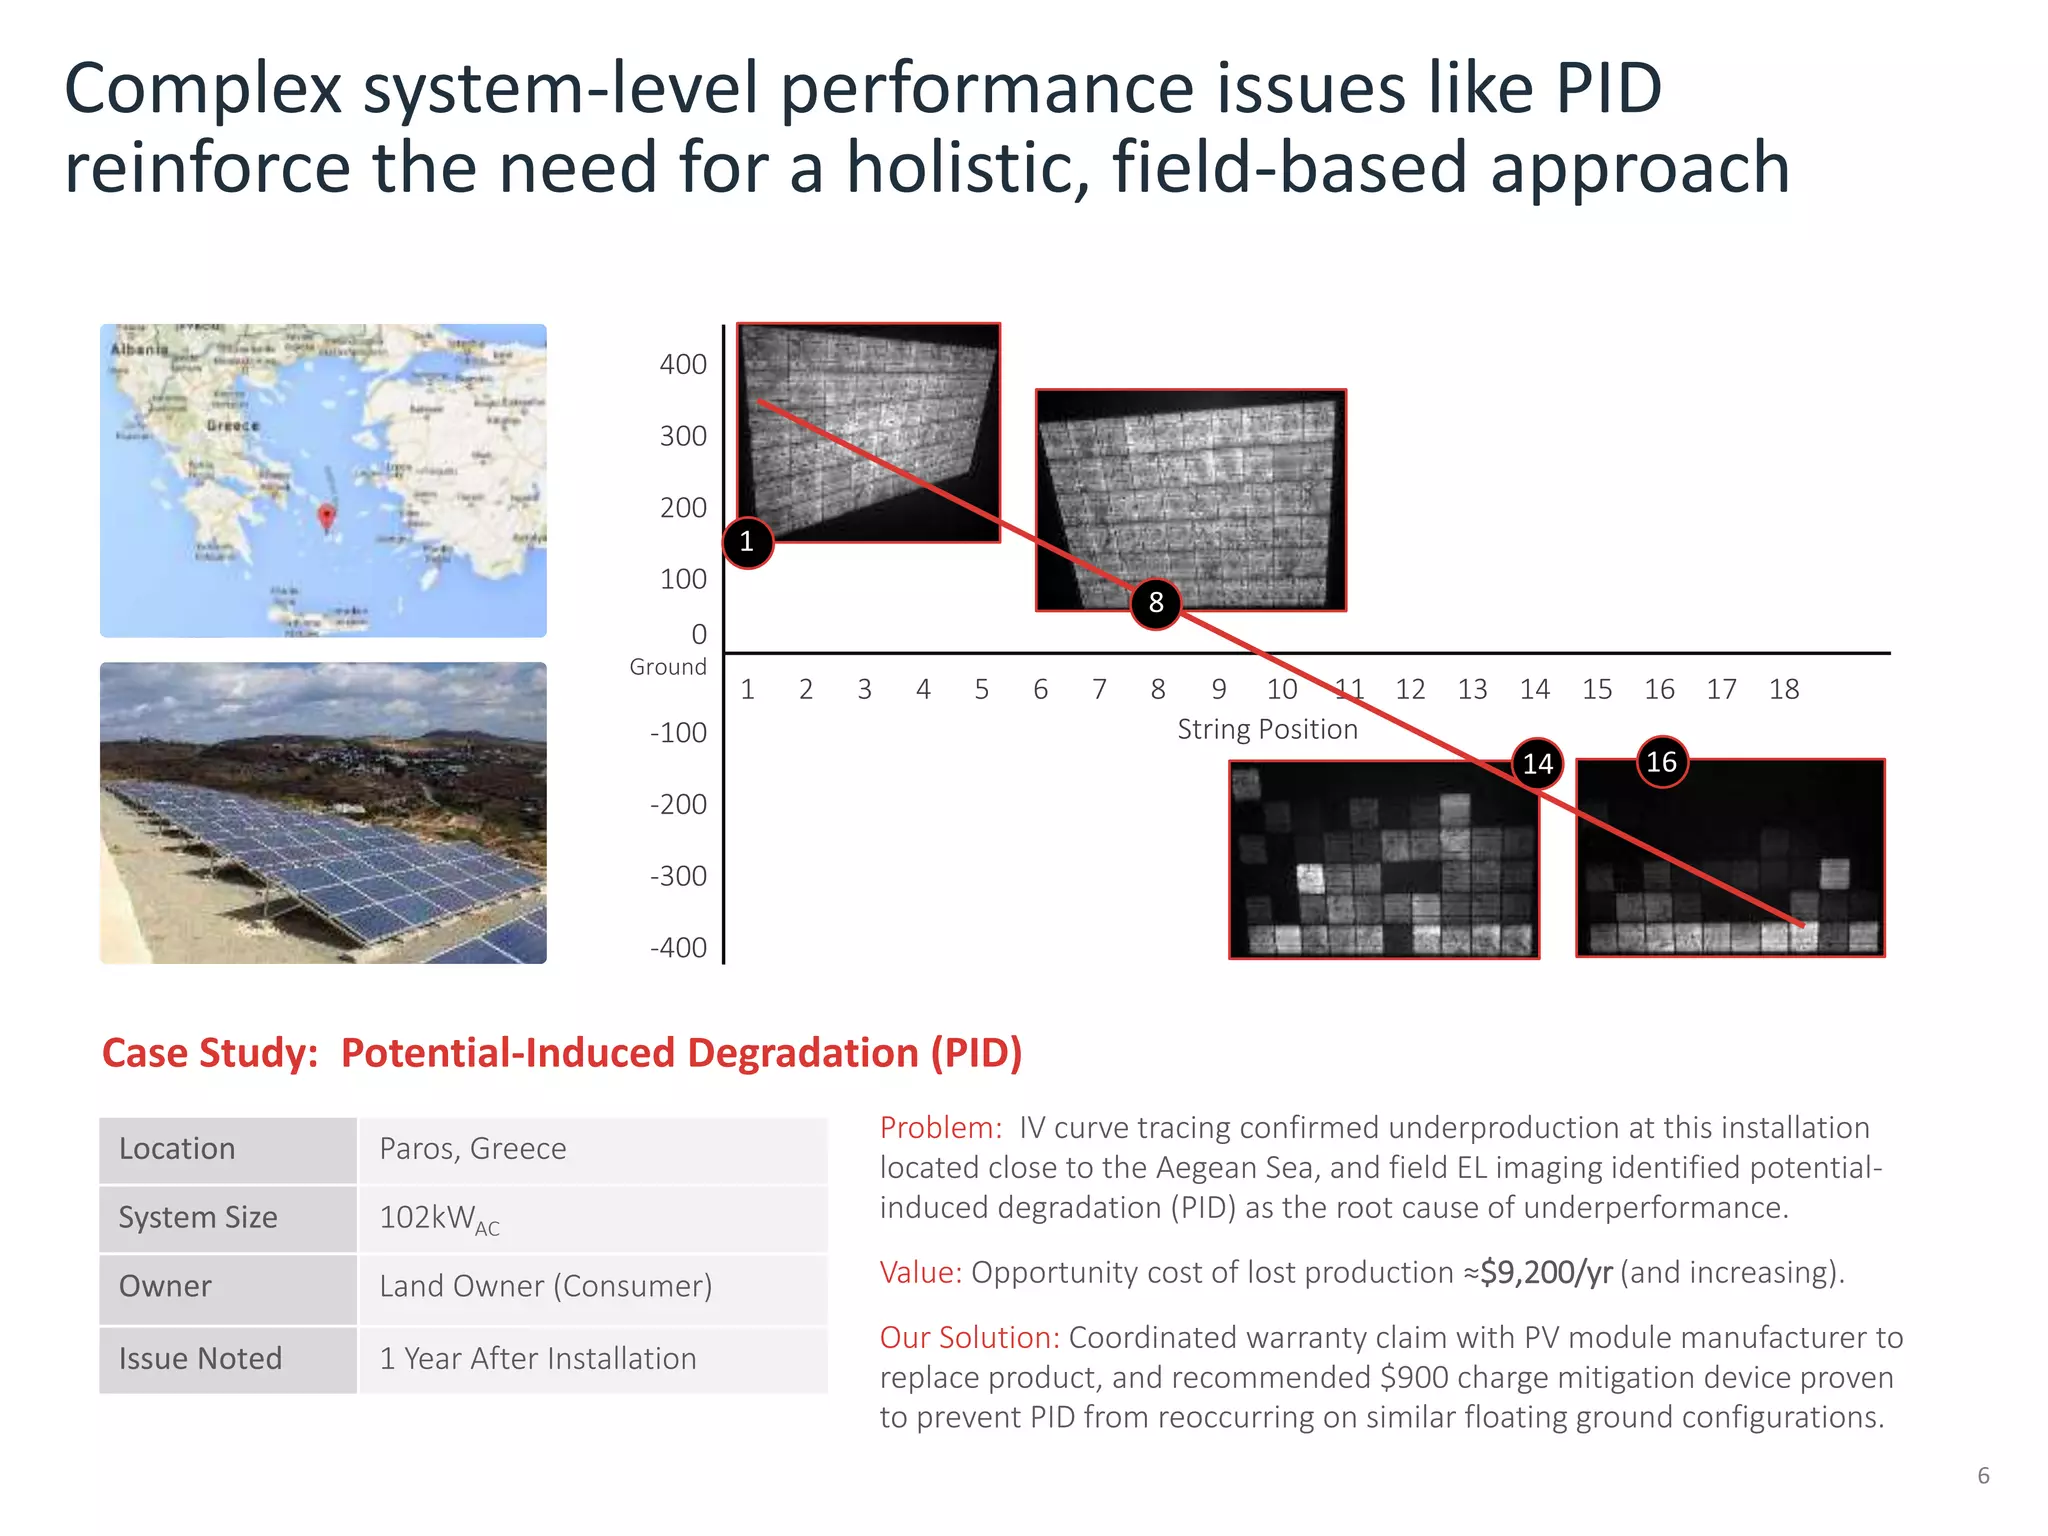
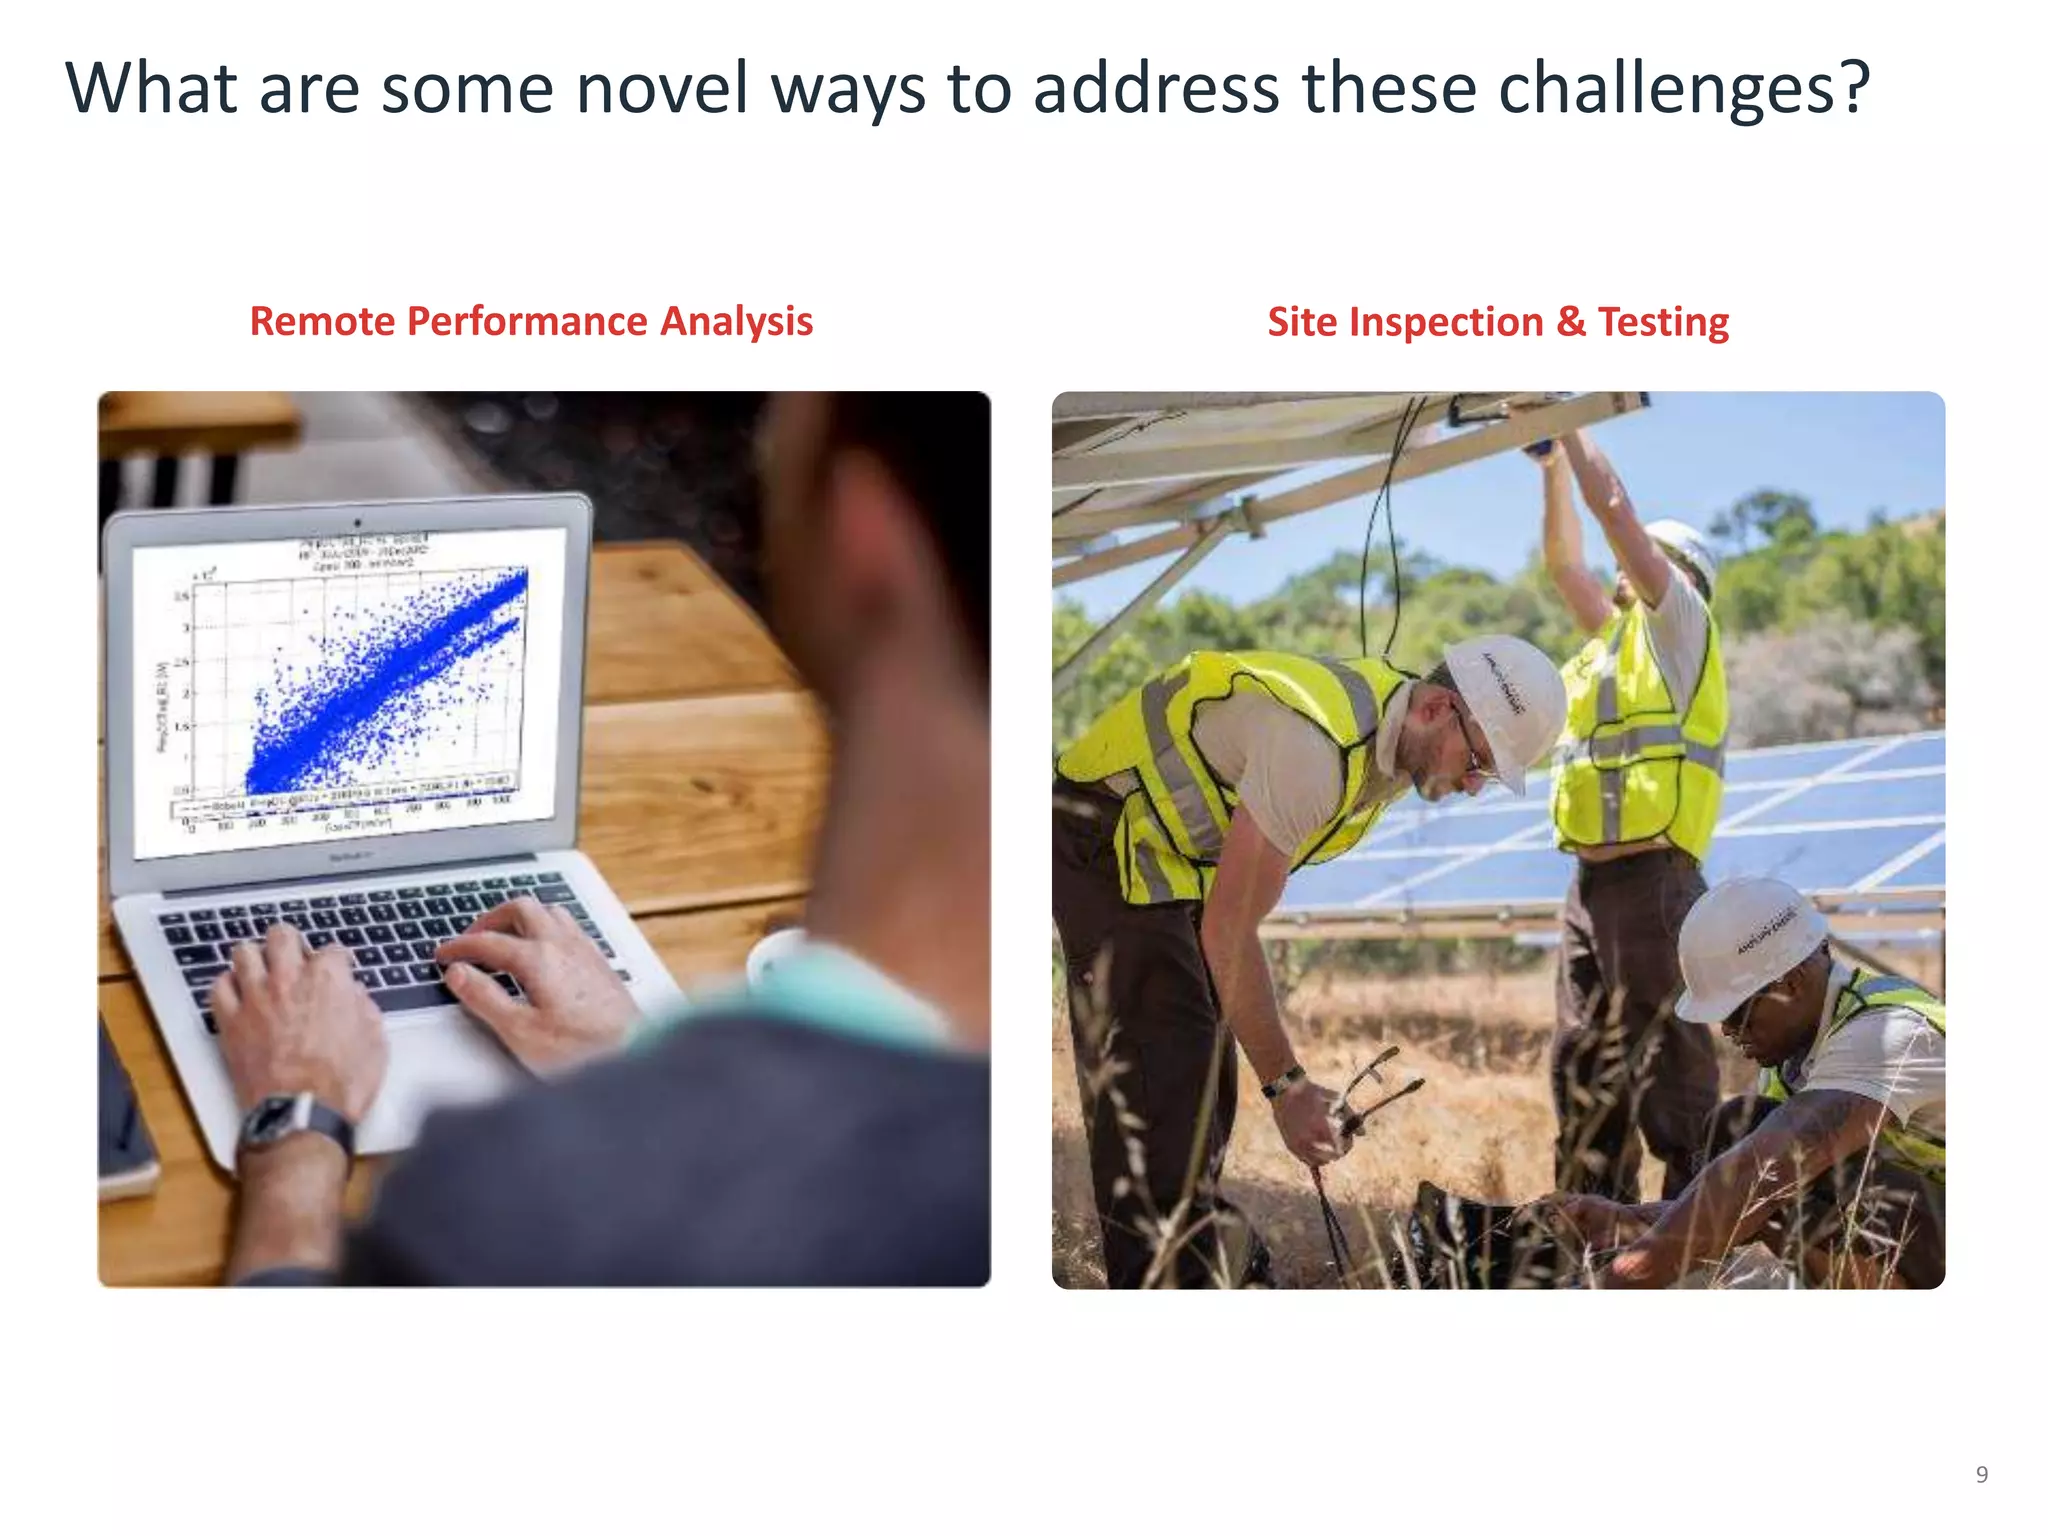
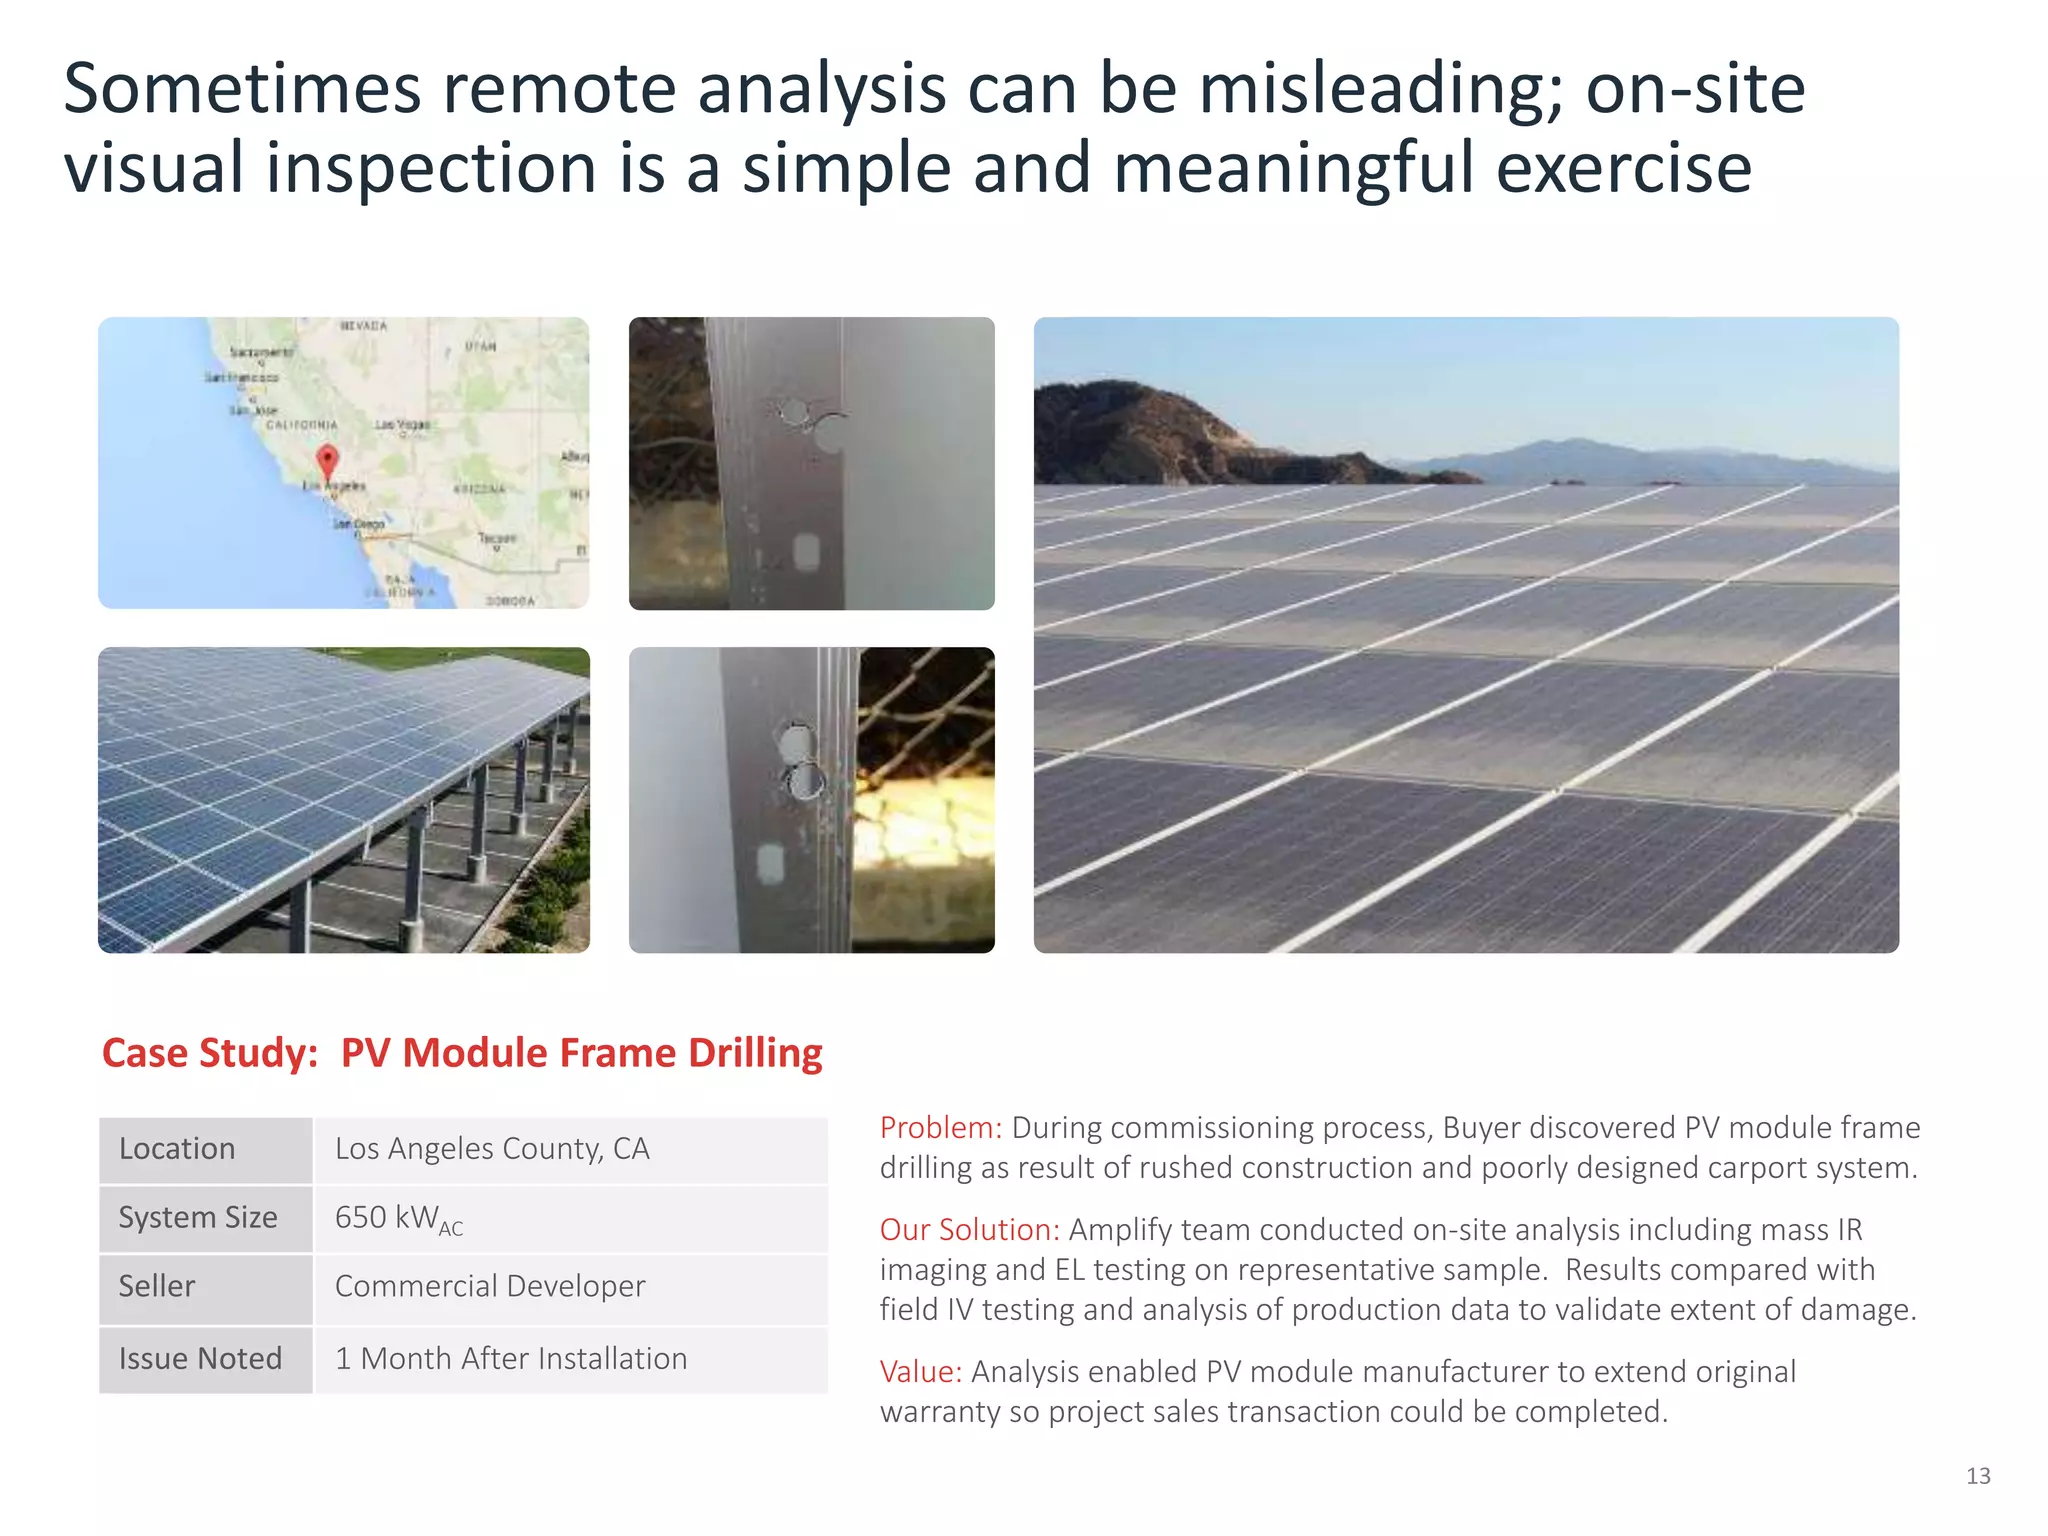
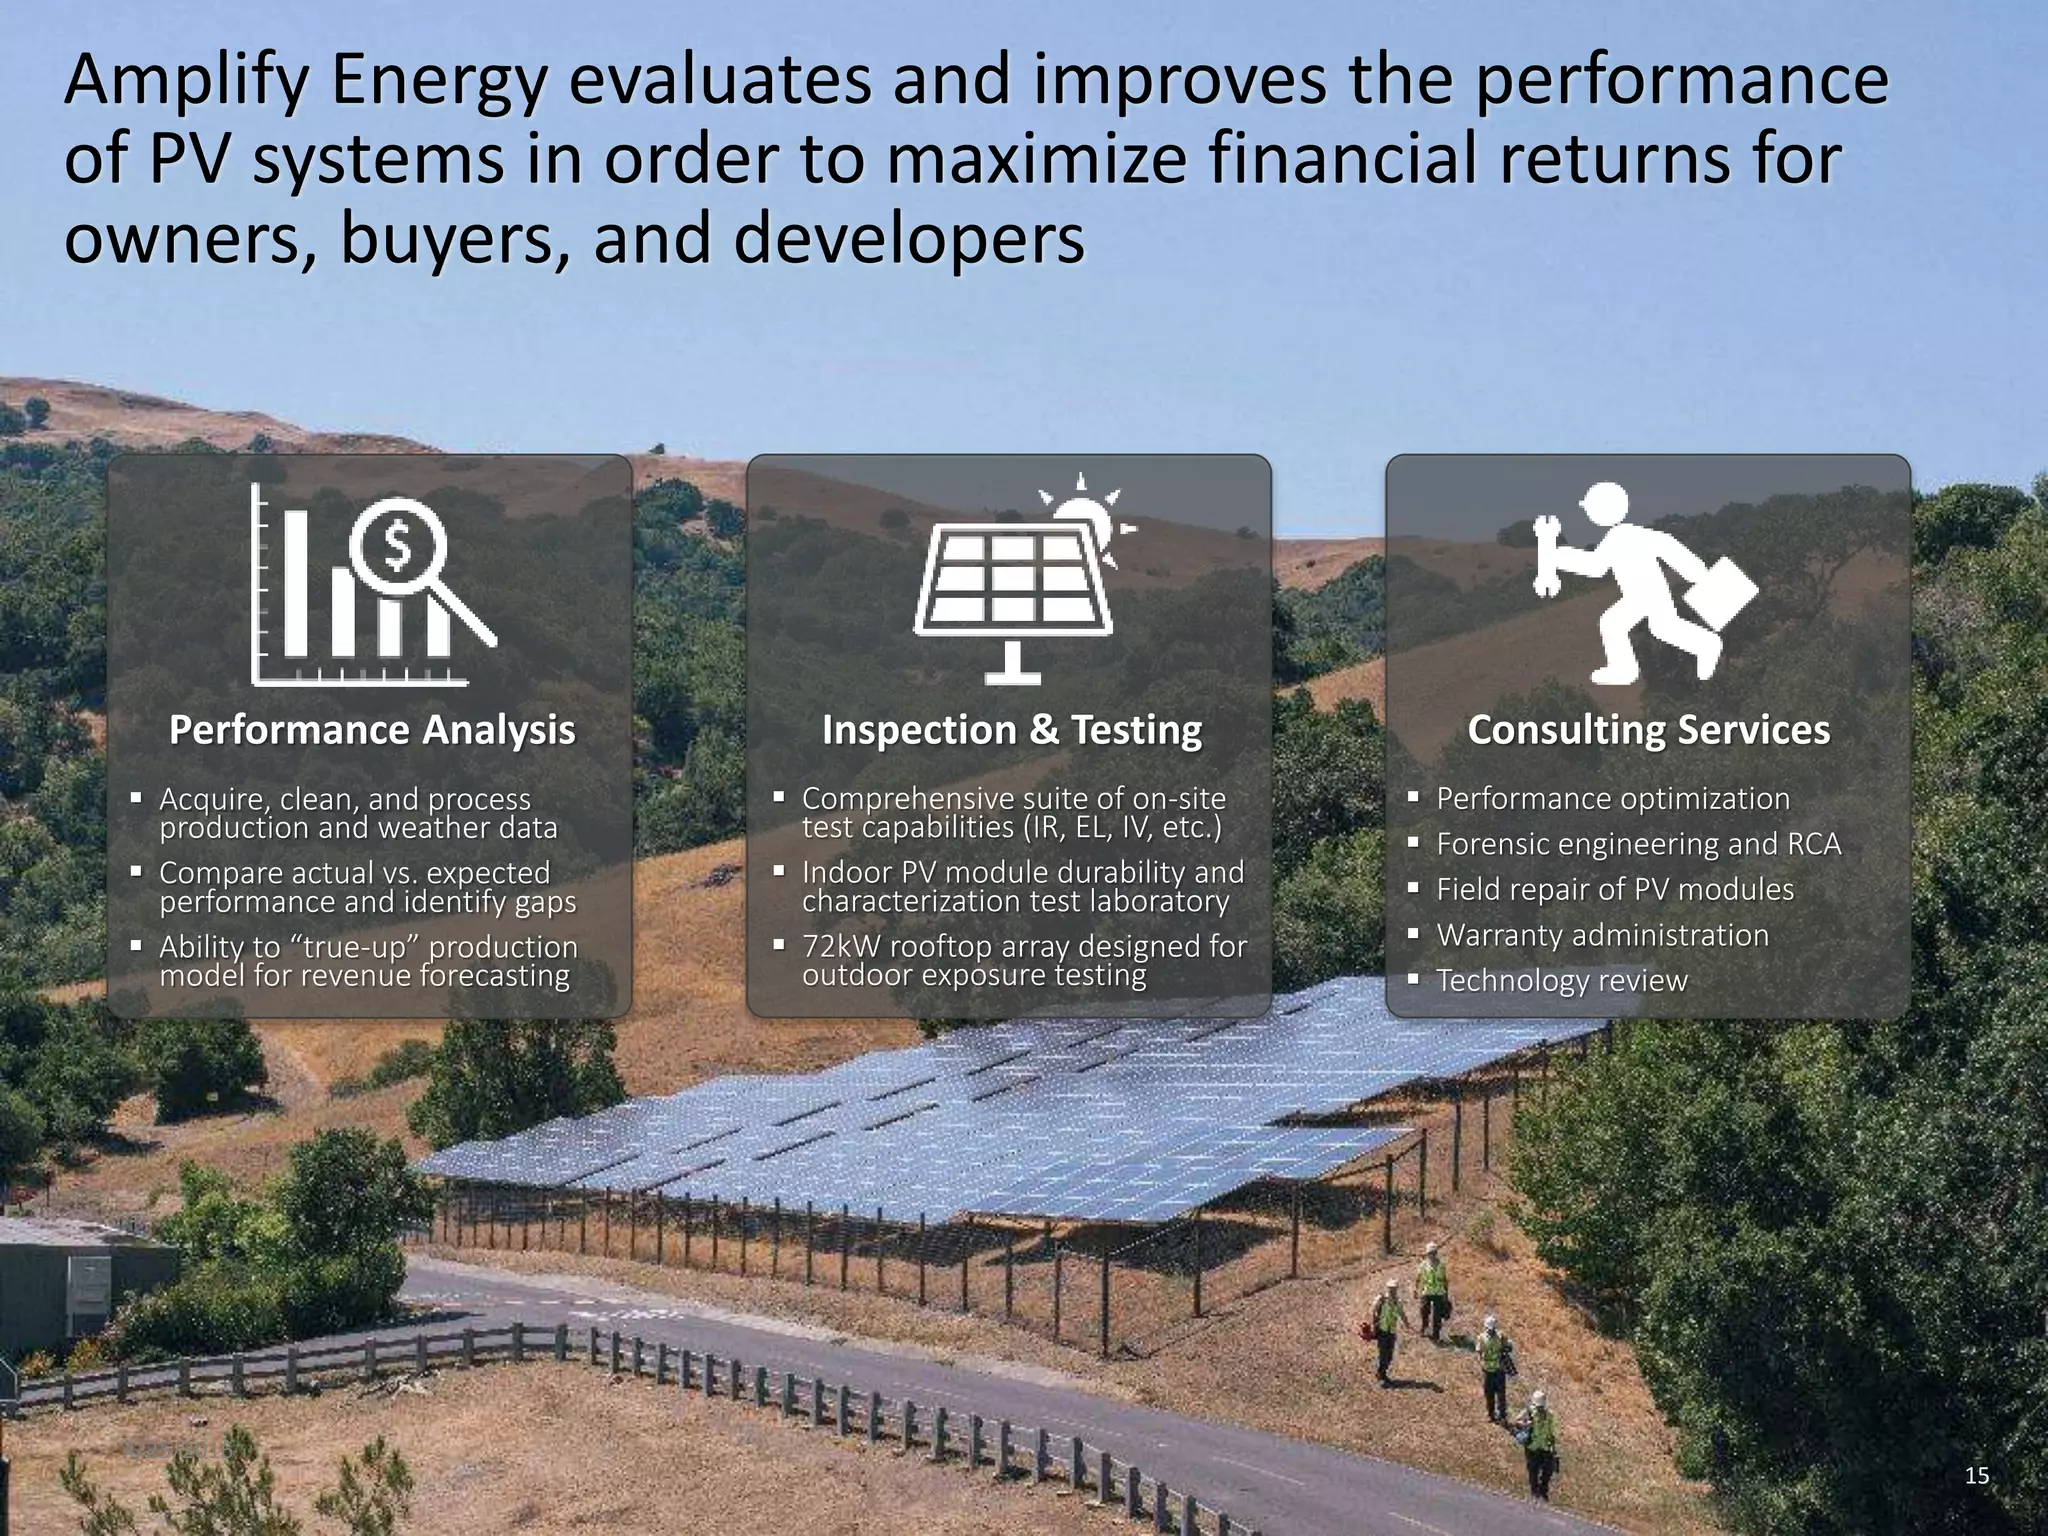
- Remote performance analysis and on-site inspection/testing provide different insights and both play a role in properly diagnosing underperformance through high-resolution data analysis and visualization of system issues.