Download to read offline

![Geometry Global is the largest and most geographically complete
activation agency of its kind, providing brand marketers with
a unique solution for an unmet need: Precision Activation. This
proprietary approach focuses on the exact blend of context and
content that combine to influence consumer behavior, transforming
proven communication techniques and big creative ideas into
effective and profitable business growth drivers. With a team of
4000 experts in 56 markets, the global network develops highly
compelling marketing programs – informed by data and insights
– connecting people with brands at precisely the right times, in
the right places, and right ways – making a measurable difference
to clients’ businesses. Launched in June 2013, Geometry Global
delivers award-winning creativity and integrated talent across a
range of disciplines including Shopper, Relationship, Promotional
and Experiential, Trade and Digital Marketing.
For more information, visit www.geometry.com
As humans, we constantly seek to define and
evaluate ourselves, using social interactions,
experiences and personal inventory to project our
own identity. Community and participation are
powerful influencers: we crave connections with
people whose beliefs and values we share. And with
digital as the mighty enabler, our connections are
widening alongside our collective experiences.
People’s relationships with brands have changed.
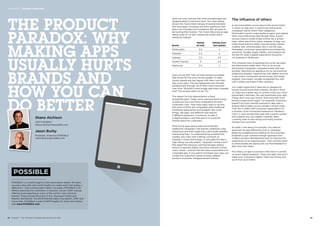
A recent survey [GlobalWebIndex] asked
consumers how they would want a brand to act
towards them: 50 percent of 25-34 year olds
reported their favorite brand plays an integral
part in their online life and experience, while 38
percent would buy a product or service simply to
be part of the community around it.
Add to this the Convergence Economy [LS:N Global]
where boundaries between brands, sectors,
economy and emotion are dissolving. Look to retail
spaces, products, hospitality and entertainment and
there’s one distinctive theme: it’s difficult to tell one
thing from the other.
Consequently, we need a fresh way to activate
brands, to find new ways to engage with people and
gain a greater share of life and “share of self.”
Today’s smart winners are imaginative, reaching
outside of their historical boundaries to create new
experiences and solutions. Nike, Samsung, Sony and
others, are moving from purely product offers to
services and lifestyle enhancement. For the time
poor, Google’s Future Home has launched life-
enhancing apps from voice-activated cooking to
tablet-operated smart TV.
Such brands are going wide and creating
partnerships to take an increased share of life.
Clothing retailer Banana Republic has collaborated
with Condé Nast Bon Appetit and online reservation
service Open Table to create a Desk to Dinner
collection – an innovative solution for the working
woman while making the brand relevant to a much
larger market. Through a collaborative movement,
Shop Elsewhere in Hong Kong enabled independent
fashion retailers to recommend each other’s
products, allowing shoppers browsing in one
designer’s store to activate the QR code on an item,
leading to a web site with recommendations for
other designers’ products pre-selected to match.
Designers increased reach and attracted new clients
while creating a unique in-store experience.
Critical to brand success in this digital age is the
ability to create precise and relevant connections
and experiences, with communications that engage
people at the right time, in the right place and in the
right way. Mastery of big data has replaced
supposition to extract real time consumer insights,
enhancing a sense of self. In Korea, retailer Emart
created a mobile, Wi-Fi flying store. High footfall
rivals were visited by the drones encouraging
consumers to connect to the flying store via
smartphones. Once connected, consumers were
directed to the Emart online shopping portal to
access discounts. The result: satisfied, value
conscious shoppers and soaring sales for Emart.
The human brand
Technology and data are merely brand conduits and
enablers. The reality is that brands are transitioning
from acquaintance to become life influencers in real
and valuable ways.
Smart brands are inviting people to share an
experience, rather than product. Apple changed the
retail landscape forever to become the supreme
shopper experience where people could learn, seek
help and socialize. In tandem with its aspirational
product it became an iconic global brand with the
best brand retention in the industry [source: WDS].
And this engagement goes beyond the physical,
with 10 percent of Internet users having talked about
Apple online (GlobalWebIndex). In Latin America,
Huggies moved the hearts and minds of parents
when, to celebrate Friendship Day, it delivered a
special crib for two new born babies to a maternity
ward. Bringing two boys together meant each had
their first friend. And Huggies created a moment
parents would never forget.
Apple and Google’s brand-lifestyle ecosystems are an
elegant attempt by both brands to refocus themselves
around an arresting experience; demonstrating
reliability, innovation, design and a defined personality
across every customer touch point.
Participatory brands are here
and now
The past is another country for brands, as they
journey towards a social role within a much broader
community. People are now invited to view brands
as they do their friends, colleagues and partners –
offering products and services the opportunity to
embrace change and help people to think smarter,
lead healthier lives, and enjoy richer experiences.
To succeed, a brand simply has to be clear about its
own values, and the places, spaces and occasions
where it has both role and purpose.
1. People are seekers, searching for solutions
– functional or emotional – to support both them
and their identity. Brands must understand these
needs and their associated behaviors.
2. In doing this, brands can move away from industry
definitions of category to identify opportunities
by observing consumer and shopper behavior
relating to consumption, usage occasions and
solutions that enhance people’s lives.
3. For example, in Asia, Cadburys incentivized
shoppers to give chocolate at key gifting
occasions with its “Say it with chocolate”
campaign. Allowing shoppers to create
personalized messages in store, this innovative
approach created a crucial social connection
with the brand, sharing joy and changing
purchase behavior.
MY
BRANDS.
MY
SELF.Jonathan Dodd
Global Chief Strategy Officer
Geometry Global
Jonathan.Dodd@geometry.com
92 BrandZ™ Top 100 Most Valuable Global Brands 2014 9392 BrandZ™ Top 100 Most Valuable Global Brands 2014
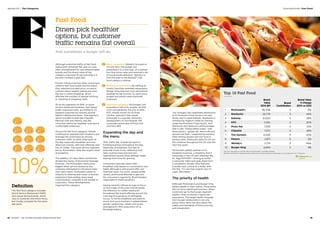
Section 03 | Thought Leadership](https://image.slidesharecdn.com/c2eb24e1-33d6-4efc-877d-695a6cd83dbf-150225120221-conversion-gate02/85/2014_BrandZ_Top100_Report-47-320.jpg)
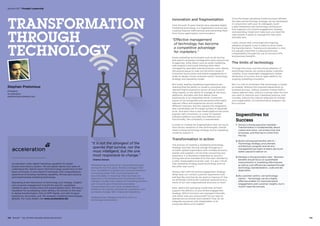

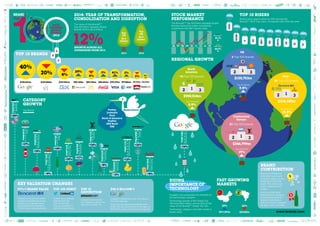
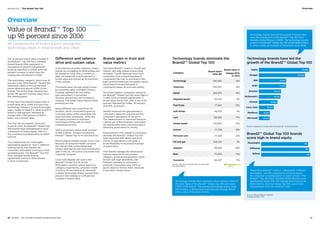
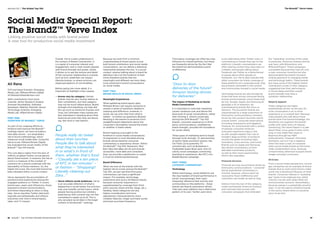
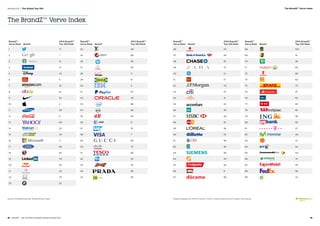
The 2014 BrandZTM Global Top 100 report found that the total brand value of the top 100 brands grew 12% to $2.9 trillion. This marks a shift from economic recovery to growth. Key points: - All categories increased in value led by Apparel at 29% growth. - Google overtook Apple as the most valuable brand. - Tencent was the fastest growing brand at 97% value increase. - Technology brands still dominate representing 1/3 of total value. - Growth has led to new challenges for brands around consumer expectations shaped by mobile technology.


![[Millward Brown] Brandz report 2014](https://cdn.slidesharecdn.com/ss_thumbnails/2014brandztop100report-140928232328-phpapp01-thumbnail.jpg?width=640&height=640&fit=bounds)


