20140824 Abnormalities in human pluripotent cells due to reprogramming mechanisms
•
1 like•90 views

This study compares genetic and epigenetic abnormalities in three types of human pluripotent stem cells: induced pluripotent stem cells (iPS cells), nuclear transfer embryonic stem cells (NT ES cells), and in vitro fertilization embryonic stem cells (IVF ES cells). The researchers found that both iPS cells and NT ES cells derived from the same somatic cells contained similar numbers of copy number variations, whereas DNA methylation and gene expression profiles of NT ES cells more closely matched those of IVF ES cells. The results suggest that human somatic cells can be faithfully reprogrammed to pluripotency by somatic cell nuclear transfer and may be better suited than iPS cells for cell replacement therapies due to avoiding

Recommended
More Related Content
What's hot
What's hot (20)
Similar to 20140824 Abnormalities in human pluripotent cells due to reprogramming mechanisms
Similar to 20140824 Abnormalities in human pluripotent cells due to reprogramming mechanisms (20)
20140824 Abnormalities in human pluripotent cells due to reprogramming mechanisms
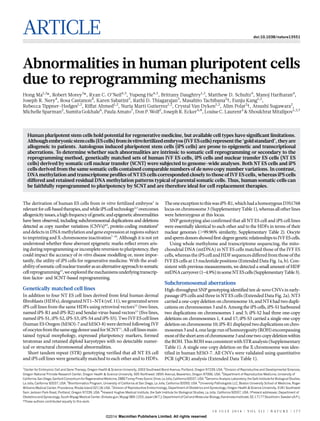
- 1. ARTICLE doi:10.1038/nature13551 Abnormalities in human pluripotent cells due to reprogramming mechanisms Hong Ma1,2 *, Robert Morey3 *, Ryan C. O’Neil4,5 , Yupeng He4,5 , Brittany Daughtry1,2 , Matthew D. Schultz4 , Manoj Hariharan4 , Joseph R. Nery4 , Rosa Castanon4 , Karen Sabatini3 , Rathi D. Thiagarajan3 , Masahito Tachibana2 {, Eunju Kang1,2 , Rebecca Tippner-Hedges1,2 , Riffat Ahmed1,2 , Nuria Marti Gutierrez1,2 , Crystal Van Dyken1,2 , Alim Polat2 {, Atsushi Sugawara2 , Michelle Sparman2 , SumitaGokhale6 , Paula Amato7 , DonP.Wolf2 , JosephR. Ecker4,8 , LouiseC. Laurent3 & ShoukhratMitalipov1,2,7 Human pluripotent stem cells hold potential for regenerative medicine, but available cell types have significant limitations. Althoughembryonicstemcells(EScells)frominvitrofertilizedembryos(IVFEScells)representthe‘goldstandard’,theyare allogeneic to patients. Autologous induced pluripotent stem cells (iPS cells) are prone to epigenetic and transcriptional aberrations. To determine whether such abnormalities are intrinsic to somatic cell reprogramming or secondary to the reprogramming method, genetically matched sets of human IVF ES cells, iPS cells and nuclear transfer ES cells (NT ES cells) derived by somatic cell nuclear transfer (SCNT) were subjected to genome-wide analyses. Both NT ES cells and iPS cells derived from the same somatic cells contained comparable numbers of de novo copy number variations. In contrast, DNA methylation and transcriptome profiles of NT ES cells corresponded closely to those of IVF ES cells, whereas iPS cells differed and retained residual DNA methylation patterns typical of parental somatic cells. Thus, human somatic cells can be faithfully reprogrammed to pluripotency by SCNT and are therefore ideal for cell replacement therapies. The derivation of human ES cells from in vitro fertilized embryos1 is relevantforcell-basedtherapies,andwhileiPScelltechnology2,3 overcomes allogenicityissues,ahighfrequencyofgeneticandepigeneticabnormalities have been observed, including subchromosomal duplications and deletions detected as copy number variations (CNVs)4,5 , protein-coding mutations6 and defectsinDNAmethylationand geneexpressionatregionssubject to imprinting and X-chromosome inactivation7–10 . Although it is not yet understood whether these aberrant epigenetic marks reflect errors aris- ing during reprogramming or incomplete reversion topluripotency, they could impact the accuracy of in vitro disease modelling or, more impor- tantly, the utility of iPS cells for regenerative medicine. With the avail- abilityofsomaticcellnucleartransferasanalternativeapproachtosomatic cellreprogramming11 ,weexploredthemechanismsunderlyingtranscrip- tion factor- and SCNT-based reprogramming. Genetically matched cell lines In addition to four NT ES cell lines derived from fetal human dermal fibroblasts (HDFs),designatedNT1–NT4(ref. 11),wegeneratedseven iPS cell lines from the same HDFs using retroviral vectors12 (two lines, named iPS-R1 and iPS-R2) and Sendai-virus-based vectors13 (five lines, named iPS-S1,iPS-S2, iPS-S3, iPS-S4and iPS-S5). Two IVF ES cell lines (human ES Oregon (hESO)-7 and hESO-8) were derived following IVF ofoocytesfromthesameeggdonorusedforSCNT11 .Allcelllinesmain- tained typical morphology, expressed pluripotency markers, formed teratomas and retained diploid karyotypes with no detectable numer- ical or structural chromosomal abnormalities. Short tandem repeat (STR) genotyping verified that all NT ES cell and iPS cell lines were genetically matched to each other and to HDFs. TheoneexceptiontothiswasiPS-R1,whichhadahomozygousD3S1768 locus on chromosome 3 (Supplementary Table 1), whereas all other lines were heterozygous at this locus. SNP genotyping also confirmed that all NT ES cell and iPS cell lines were essentially identical to each other and to the HDFs in terms of their nuclear genomes (.99.96% similarity, Supplementary Table 2). Oocyte andspermdonorsshowedfirst-degreegeneticrelationshipstoIVFEScells. Using whole methylome and transcriptome sequencing, the mito- chondrial DNA (mtDNA) in NT ES cells matched those of the IVF ES cells,whereastheiPScellandHDFsequencesdifferedfromthose ofthe IVF ES cells at 13 nucleotide positions (Extended Data Fig. 1a, b). Con- sistent with previous measurements, we detected a small amount of HDF mtDNAcarryover(1–4.9%)insomeNTEScells(SupplementaryTable3). Subchromosomal aberrations High-throughput SNP genotyping identified ten de novo CNVs in early- passage iPS cells and three in NT ES cells (Extended Data Fig. 2a). NT3 carried a one-copy deletion on chromosome 16, and NT4 had two dupli- cations on chromosomes 3 and 6. Among the iPS cells, iPS-S1 harboured two duplications on chromosomes 1 and 5; iPS-S2 had three one-copy deletions on chromosomes 1, 4 and 17; iPS-S3 carried a single one-copy deletion on chromosome10; iPS-R1 displayed two duplications on chro- mosomes3and4,onelargerunofhomozygosity(ROH)encompassing mostoftheshortarmofchromosome3andonetwo-copydeletionwithin the ROH.This ROHwasconsistentwith STRanalysis(Supplementary Table 1). A single one-copy deletion on the X chromosome was iden- tified in human hESO-7. All CNVs were validated using quantitative PCR (qPCR) analysis (Extended Data Table 1). *These authors contributed equally to this work. 1 Center for Embryonic Cell and Gene Therapy, Oregon Health & Science University, 3303 Southwest Bond Avenue, Portland, Oregon 97239, USA. 2 Division of Reproductive and Developmental Sciences, Oregon National Primate Research Center, Oregon Health & Science University, 505 Northwest 185th Avenue, Beaverton, Oregon 97006, USA. 3 Department of Reproductive Medicine, University of California,SanDiego, SanfordConsortium for RegenerativeMedicine, 2880Torrey PinesScenicDrive,La Jolla,California92037,USA.4 Genomic AnalysisLaboratory,the Salk Institutefor Biological Studies, La Jolla, California 92037, USA. 5 Bioinformatics Program, University of California at San Diego, La Jolla, California 92093, USA. 6 University Pathologists LLC, Boston University School of Medicine, Roger Williams Medical Center, Providence, Rhode Island 02118, USA. 7 Division of Reproductive Endocrinology, Department of Obstetrics and Gynecology, Oregon Health & Science University, 3181 Southwest Sam Jackson Park Road, Portland, Oregon 97239, USA. 8 Howard Hughes Medical Institute, the Salk Institute for Biological Studies, La Jolla, California 92037, USA. {Present addresses: Department of Obstetrics and Gynecology, South MiyagiMedical Center, Shibata-gun, Miyagi 989-1253,Japan (M.T.); Departmentof Cell and Molecular Biology, Karolinska Institutet, SE-17177Stockholm, Sweden (A.P.). 1 0 J U L Y 2 0 1 4 | V O L 5 1 1 | N A T U R E | 1 7 7 Macmillan Publishers Limited. All rights reserved©2014
- 2. CNV analysis was extended to a second matched set, consisting of NT ES cell (Leigh-NT1) and iPS cell lines (Leigh-iPS1, Leigh-iPS2 and Leigh- iPS3)derivedfromapatientwithLeighsyndrome11 .G-bandingdidnot reveal any numerical or chromosomal abnormalities and STR genotyp- ing corroborated that all lines were from the Leigh patient (Leigh-fib, Supplementary Table 1). Leigh-NT1 carried oocyte mtDNA while all Leigh iPS cells inherited patient mtDNA including the homoplasmic m.8993T.G mutation14 (Extended Data Fig. 1c). Nine de novo CNVs were identified in this data set, including multiple CNVs in Leigh-iPS1 and Leigh-iPS3 and one each in Leigh-iPS2 and Leigh-NT1 (Extended Data Fig. 2a and Extended Data Table 1). Insummary,iPScells,NTEScellsandIVFEScellscarriedanaverageof 1.8,0.8and0.5CNVsperline,respectively(ExtendedDataFig.2b),with nostatisticallysignificantdifferencesamongcelltypes.InDelanalysisusing RNA sequencing (RNA-seq) also showed a trend towards fewer muta- tionsin NT ES cells comparedwith iPS cells,but the differencesamong cell types were again not statistically significant (P.0.05, Extended Data Fig. 2c, d). Thus, it seems that the mutagenic and selective pressures for both reprogramming approaches are not statistically different, but this conclusion is limited by the small numbers of cell lines analysed. Global DNA methylation DNA methylation is an important epigenetic mechanism contributing to cell identity, and significant differences have been reported between iPScellsandIVFEScells7,15 .Therefore,weexaminedgenome-wideDNA methylationofourcelllinesandcomparedthemtopubliclyavailablesam- ples using the Infinium HumanMethylation450 BeadChip. Unsupervised hierarchical clustering16 and bootstrap resampling identified two well- defined clusters, one containing all iPS cell lines and one IVF ES cell line froma previousstudy (HUES64 (ref. 17)), and another with all NT EScelllinesandfourIVFEScelllines(Fig.1a,b).Intra-groupvariability wasassessedusingthecoefficientofvariationforeachstemcelltypeand wasfoundtobesimilartopreviouslyreportedcelllines17 (iPScells5 0.71, NT ES cells 5 0.73, IVF ES cells 5 0.74; iPS cells17 5 0.73 and IVF ES cells17 5 0.72). Comprehensivegroup-wiseanalysisrevealed6,478differentiallymethy- lated probes(DMPs) betweeniPScells and IVF ES cells (false discovery rate(FDR),0.01;Fig.1c).Usingthesamecriteria,110DMPswerefound in NT ES cells, suggesting that NT ES cells are remarkably similar to IVF ES cells. We then asked if the DMPs could be attributed to residual epi- genetic memory inherited from HDFs. Of the 6,478 DMPs in iPS cells, 780 displayed a substantial difference in DNA methylation in the same directionbetweeniPScellsandIVFEScellsandbetweenHDFsandIVF ES cells (average b-difference . j0.3j, where b is the ratio of intensities between methylated alleles and the sum of unmethylated and methylated alleles). Of the 110 DMPs in NT ES cells, 87 were substantially different both between NT ES cells and IVF ES cells and between HDFs and IVF ES cells (Fig. 1c). Functional enrichment analysis of probes that were highlymethylatedin iPS cells and HDFs compared to IVF ES cells indi- catedassociationwithsequence-specificDNAbindingtranscriptionfactor activity (2.02-fold enrichment, FDR , 0.0001). No significant annota- tion terms were found for hypermethylated probes shared by NT ES cells and HDFs. However, probes that were hypomethylated in iPS cells, NT ES cells and HDFs were enriched for loci associated with the major histocompatibility complex (MHC) class II protein complex (72- fold enrichment, FDR , 0.001). We conclude that methylation profiles of NT ES cells are more similar toIVFEScellsthantoiPScells.BothcelltypescarryresidualHDFepigenetic memory, but iPS cells retain eightfold more of such sites. Interestingly, nearly 80% of DMPs in NT ES cells, but only 12% in iPS cells, could be relatedtosomaticmemory,suggestingthat themajorityofmethylation abnormalities in iPS cells result from reprogramming errors. DNA methylation at imprinted and XCI regions AberrantmethylationatimprintedlocihasbeenobservediniPScells7,18,19 . We interrogated previously identified imprinted regions7,20,21 (Fig. 2a) considering CpGs with a b 5 0.2–0.8 on the DNA methylation micro- array as partially methylated, .0.8 aberrantly hypermethylated, and ,0.2 hypomethylated. Our cell line variances within these imprinted regions were comparable to other independently generated cells17 (our lines,coefficientofvariation50.27–0.36;coefficientofvariation17 50.28– 0.4). Based on unsupervised hierarchical clustering within imprinted regions,NTEScelllinesgroupedcloselywithIVFEScellsanddisplayed fewer aberrantly methylated probes compared to iPS cells (Fig. 2a, b). In terms of aberrant DNA methylation at imprinted regions, all NT EScells displayedhypomethylation atGNAS(alsoknownasGNAScom- plex locus); NT2 and NT3 were hypermethylated at probes located in the genomic region of GNASAS (alsoknown as GNAS antisense RNA 1)and GNAS overlap; and NT4 was hypomethylated at H19 (also known as imprintedmaternallyexpressedtranscript(non-proteincoding))(Fig.2a), which corresponded with bi-allelic expression of this gene (Extended Data Table 2). All iPS cells and the hESO-7 cell line were hypermethy- lated at PEG3 (also known as paternally expressed 3) (Fig. 2a), while only the iPS cells displayed hypermethylation at MEG3 (also known as maternally expressed 3 (non-protein coding)) (Fig. 2a). These genes dis- played reduced expression of corresponding transcripts (Fig. 2c; MEG3 adjusted P , 0.001, average fold change, 19.8; PEG3 adjusted P , 0.005, average fold change, 128.9). The DIRAS3 (also known as DIRAS family, GTP-binding RAS-like 3) locus was hypermethylated in all iPS cells, but a corresponding change in gene expression was not seen (Fig. 2a). HUES13 hESO-8 NT1 NT2 NT3 NT4 hiPS-20b hiPS-17b hiPS-27b iPS-S1 IVF ES cells NT ES cells iPS cells 1 (24%) 2 (12%) 3 (9%) a Stem cell type Number of DMPs different from IVF ES cells (FDR < 0.01) Number of DMPs shared with HDFs iPS cells NT ES cells Shared between iPS cells and NT ES cells 6478 110 91 780 87 74 Somatic cell methylation memory in reprogrammed cells b c 200 400 600 1,200 Height iPS-R1 iPS-R2 iPS-S2 iPS-S1 hESO-8 hESO-7 NT4 NT2 NT3 NT1 HUES1 HUES13 hiPS-17b hiPS-27b HUES64 HDF hiPS-20b au / bp 100 100 100 100 100 100 100 100 100 100100 100 100 100 100 100 100 100 100 100 100 100667297 99100 100 hESO-7 HUES1 HUES64 iPS-R2 iPS-R1 iPS-S2 * 100 100 Figure 1 | Global methylation status. a, Unsupervised hierarchical clustering of all filtered and normalized methylation probes in five IVF ES cell lines, seven iPS cell lines, and four NT ES cell lines, and in parental HDFs. Red and green values above each edge represent AU (approximately unbiased) and BP (bootstrap probability) P values (%) calculated using bootstrap resampling16 . b, Principal component analysis of IVF ES cells (red balls), iPS cells (orange balls), and NT ES cells (green balls) with nearest-neighbour analysis. The percentages in parentheses represent the variance explained by the respective axes. c, Total number of differentially methylated probes (DMPs) observed between matched iPS cells, NT ES cells and IVF ES cells (n 5 11, Kruskal– Wallis test, FDR , 0.01). The number of DMPs shared with parental HDFs was used as a measure of the degree of somatic cell memory. *|Average b HDF – average b IVF-ES cells| . 0.3 and |average b iPS cells – average b IVF-ES cells| . 0.3. RESEARCH ARTICLE 1 7 8 | N A T U R E | V O L 5 1 1 | 1 0 J U L Y 2 0 1 4 Macmillan Publishers Limited. All rights reserved©2014
- 3. X-chromosome inactivation (XCI) can be detected by allele-specific expressionandcoatingoftheXchromosomebythelongnoncodingRNAs XIST(alsoknownasXinactivespecifictranscript(non-proteincoding)) andXACT22,23 .BasedonRNA-seq,allfemalecellsinourdatasetexpressed similar levels of XIST, but only pluripotent cells expressed XACT (Ex- tended Data Fig. 3a, b).hESO-8 (male)was unmethylated at previously annotated XCI loci7 , whereas all female lines were predominantly par- tiallymethylated(b 50.2–0.8;Fig.3a).NTEScellsandIVFEScellsdem- onstrated higher DNA methylation levels at XCI loci compared to HDFs. However, methylation levels in iPS cells were significantly higher than in NT ES cells and female hESO-7 (Fig. 3b, P,0.001), with substantial variationamonglines.With aberrant methylation defined asb , 0.2or . 0.8, NT ES cells and hESO-7 had fourfold fewer aberrations than iPS cells (Fig. 3c, P , 0.001). POU3F4 (also known as POU class 3 homeo- box4),SLITRK2(alsoknownasSLITandNTRK-likefamily,member2) and SLITRK4 (also known as SLIT and NTRK-like family, member 4) hypermethylationin iPS-R2 correlated with lower gene expression while hypomethylation of DACH2 (also known as Dachshund homologue 2), RPS6KA6 (also known as ribosomal S6 kinase 4) and CHM (also known as choroideremia rab escort protein 1) in iPS-R1 and TMEM187 (also knownastransmembraneprotein187)iniPS-S2correlatedwithincreased gene expression (Fig. 3a and Extended Data Fig. 4a, b). Autosomal non-imprinted loci Differential DNA methylation analysis of autosomal non-imprinted sites revealed 1,621 DMPs between our groups (Kruskal–Wallis test, P, 0.01, Db.0.5).Wegroupedtheseprobesintosixmajorclustersusinganunsu- pervisedself-organizingmapalgorithm24 (ExtendedDataFig.5).Allsix clusters were analysed for cis-regulatory functional enrichments using GREAT25 , but only cluster 3 showed significant enrichments for cat- egories associated with morphogenesis and neural development (Sup- plementary Table 4). iPS cells displayed higher DNA methylation levels compared to NT ES cells and IVF ES cells for most clusters, with the exception of cluster 4, in which the highest DNA methylation was seen in the IVF ES cells. NT ES cells displayed intermediate DNA methyla- tion, but overall were closer to IVF ES cells. We examined several dif- ferent probe subsets, and noted higher methylation levels in iPS cells compared to IVF ES cells, as reported previously26,27 (Extended Data Fig. 6a–o). Whole-genome bisulphite sequencing To gain a more detailed picture of the underlying methylation differ- ences in our cells, we generated high-coverage base-resolution methy- lomes (143to253)usingMethylC-seq8 .Wealsoassessedthemethylomes of three additional IVF ES cells (H1, H9 and HUES6)28–30 . Hierarchical clustering at CG differentially methylated regions (DMRs) demonstrated that the methylation landscape of NT ES cells more closely matched IVF ES cells compared to iPS cells (Fig. 4a). By comparing the methylomes and filtering regions that were obscure or highly variable in IVF ES cells, 678CG DMRs were identified (Supplementary Table 5) that were present in at least one NT ES cell or iPS cell line but not in IVF ES cells (FDR 5 0.01). Most of these CG DMRs were identified within iPS cells (619),whereas NT EScells containedthreefoldfewer(212) and 153CG DMRs were shared (Fig. 4b). Using a similar approach, we calculated that five previously profiled iPS cells8 carried a total of 792 CG DMRs, suggestingthatbothiPScellgroupsarecomparable.MostoftheCGDMRs werelocalizedwithinCGislandsandgenebodies(Fig.4c).AnalysisofCG- DMR distribution among individual cell lines showed that each NT ES NT2 NT3 NT4 NT1 hESO-8 hESO-7 iPS-R2 iPS-R1 iPS-S1 iPS-S2 HDF NT ES cells IVF ES cells iPS cells HDFs β = 0 unmethylated β = 1 methylated DIRAS3 (n = 3) NAP1L5 (n = 11) PLAGL1/HYMAI (n = 9) GRB10 (n = 3) SGCE/PEG10 (n = 44) MESTIT1/MEST (n = 45) DLGAP2 (n = 1) KCNK9 (n = 1) H19 (n = 12) KCNQ1/KCN1OT1 (n = 23) MEG3 (n = 1) MKRN3 (n = 3) MAGEL2 (n = 2) PEG3 (n = 9) L3MBTL (n = 14) GNASAS/GNAS (n = 6) SNRPN (n = 6) PEG3/ZIM2 (n = 15) GNAS (n = 5) b 0% 18% 16% 14% 12% 10% 8% 6% 4% 2% 20% Percentageof totalimprintedprobes Total imprinting probes with β < 0.2 or > 0.8 00 PEG3 gene expression and average methylation 0.9 0.8 0.7 0.6 0.5 0.4 0.3 0.2 0.1 0 1.0 0 1,800 1,600 1,400 1,200 1,000 800 600 400 200 1,600 1,400 1,200 1,000 800 600 400 200 2,000 MEG3 gene expression and methylationc a iPS-S2 iPS-S1 iPS-R1 iPS-R2 hESO -7 hESO -8 N T4 N T1 N T3 H DF H DF iPS-S2 iPS-S1 iPS-R1 iPS-R2 hESO -7 hESO -8 N T4 N T1 N T3 H DF H DF iPS-S2 iPS-S1 iPS-R1 iPS-R2 hESO -7 hESO -8 N T4 N T1 N T3 H DF H DF β(methylation) 0.9 0.8 0.7 0.6 0.5 0.4 0.3 0.2 0.1 1.0 β(methylation) Averagenormalized reads(RNA-seq) Averagenormalized reads(RNA-Seq) Figure 2 | Methylation at imprinted regions. a, Heat map of previously identified imprinted regions. For each gene, an average b-value (the ratio of intensities between methylated alleles and the sum of methylated and unmethylated alleles) for all DNA methylation probes assigned to a specific gene is shown and the number of included probes is indicated next to the gene. White box, hypermethylation at DIRAS3 locus, no change in gene expression; black boxes, DNA methylation changes at H19, GNASAS or GNAS, and GNAS loci (no change in gene expression); grey box, hypermethylation at the MEG3 locus (reduced gene expression); yellow box, hypermethylation at the PEG3 locus (reduced gene expression). b, Bar graph showing percentage of total imprinted probes that had a b , 0.2or . 0.8. c, Bar andline graphs showing the normalized RNA-seq read count (bars, averaged between replicates) and the DNA methylation b-values (black line) for MEG3 and PEG3. Solidus symbols indicate genes with overlapping genomic regions. ARTICLE RESEARCH 1 0 J U L Y 2 0 1 4 | V O L 5 1 1 | N A T U R E | 1 7 9 Macmillan Publishers Limited. All rights reserved©2014
- 4. cell line had fewer aberrant regions than any of the iPS cell lines (Fig. 4d, P 5 0.0147, Mann–Whitney test). CG DMRs were then assigned into three groups: memory DMRs (mDMRs; shared with HDF), NT-specific DMRs(ntDMRs)andiPS-cell-specificDMRs(iDMRs).Onaverage,38% of total CG DMRs in the NT ES cell lines and 22% of DMRs in iPS cells were mDMRs (Fig. 4d). Inspection of the recurrent CG DMRs (hotspot DMRs8 ) in every iPS cell or NT ES cell line revealed that NT ES cell lines had 50 hotspot DMRs,ortwofoldfewerthaniPScells(104)(Fig.4e).Interestingly,48 of 50 hotspot DMRs in NT ES cells were also shared with iPS cells (P , 0.001, Hypergeometric test). Of the hotspot DMRs shared among all 8 cell lines 63% (30 out of 48) were mDMRs, suggesting regions resistant toreprogrammingbyeitherapproach.Only2(4%)hotspotDMRswere unique to NT ES cells compared to 56 (54%) iPS-cell-specific hotspots (Fig. 4e). Non-CG methylation in NT ES cells We previously identified pervasive and exclusive non-CG methylation in pluripotent cells31 . We also reported that iPS cells carry frequent aber- rant non-CG methylations8 . We identified regions showing megabase- scale non-CG methylation differences (non-CG mega DMRs) in NT ES cells and iPS cells when compared to IVF ES cells. Five IVF ES cell lines, two from this study and the three described previously, served as our control methylation landscape28–30 . Autosomal non-CG mega DMRs (150) were identified when the methylomes of 13 iPS cell lines and NT ES cell lines were compared to controls (Extended Data Fig. 7a and Supplementary Table 6). Non-CG mega DMRs linked to the sex chro- mosomes were excluded due to the mixed gender of controls.A total of 150 autosomal non-CG mega DMRs covered 123 megabases (Mb) of genome and included all regions reported previously8 (99% of bases); of these, 77 non-CG mega DMRs were identified from the iPS and NT cells,70ofwhichoccurringexclusivelyiniPScells(Fig.5a).TheseDMRs were distributed on every autosomal chromosome except chromosome 13 (Fig. 5b). Only 7 non-CG mega DMRs (tenfold less) were present in NTEScells.Consistentwithourpreviousfindings8 ,non-CGmegaDMRs were significantly closer to centromeric and telomeric regions compared withshufflednon-CGmegaDMRs(Fig.5b,P,0.001).Wealsoobserved several different patterns of aberrant non-CG methylation, including hypomethylation in iPS cells only, or in both NT ES cells and iPS cells, and hypermethylation in iPS cells only (Extended Data Fig. 7b, c, d). However,thevastmajorityofnon-CGmegaDMRs(92.5%oftotalbases) were hypomethylated in iPS cells and/or NT ES cells compared with IVF ES cells (Fig. 5c). We asked whether methylomes from our four iPS cells were similar to other iPS cells8 . The former contained a total of 75 DMRs, while the latter carried 121, indicating that despite different somatic cell origin and cultureconditions,iPScellscarriedsimilarlevelsofaberrantnon-CGme- thylation. In contrast, NT ES cells showed the least amount of aberrant non-CGmethylation(Fig.5c,d;P,0.005).Hierarchicalclusteringforall non-CG mega DMRs also supported the conclusion that the NT ES cells are more similar to IVF ES cells (Extended Data Fig. 7a). Tounderstandthefunctionalimpactofnon-CGmegaDMRs,wefocused ontranscriptionalactivitywithinthoseregions.Onaverage,2genesinNTES cells and 30 in iPS cells were located within non-CG mega DMRs, imply- ing that fewer genes in NT ES cells are affected (Extended Data Fig. 8a, b; P50.0147). Gene ontology analysis32 for genes in hypomethylated non- CG DMRs revealed that these genes were related to olfactory transduc- tion, epidermal cell differentiation, cytoskeleton, immunoglobulin and homeoboxproteins(FDR#0.001;SupplementaryTable7).Geneexpres- sion in the iPS cells for 2 genes in the hypermethylated non-CG mega DMRs was upregulated (Extended Data Fig. 8c, P , 0.05), whereas expression of 24 genes in the iPS cells and 6 genes in the NT ES cells in thehypomethylatednon-CGmegaDMRsweredownregulated(Extended DataFig.8d,e;P , 0.001). Theseobservationsindicate thatNTES cells were more faithfully reprogrammed to a state closely matching IVF ES cellscomparedtoiPScells.Particularly,NT4hadtheleastaberrantmeth- ylation in both CG and non-CG contexts. Global gene expression Lastly, we examined global gene expression patterns from strand-specific RNA-seq. Consistent with DNA methylation, intra-group variability was similaramongcelltypes(coefficientsofvariation:NTEScells51.41,IVF ES cells51.45, iPScells 51.44) and unsupervisedhierarchical clustering positionedNTEScellscloselywithIVFEScells(Fig.6a).Differentialexpre- ssion analysis (FDR , 0.05) yielded 1,220-transcripts, grouped into 10 clus- ters. The majority (65%) of these genes were either significantly upregulated ordownregulatedin iPScellscompared toNT EScells and IVFES cells. Clusters 2 and 3 showed higher gene expression in NT ES cells and IVF ES cells compared to iPS cells; when subjected to functional enrichment analysis,theseclusterswereassociatedwithp38MAPKsignallingpathway genes (FDR50.02; n551) and Krueppel-associated box genes (FDR5 0.001; n591). Cluster 10 contained transcripts that were upregulated in 0 Mb 20 Mb 30 Mb 40 Mb 50 Mb 60 Mb (Centromere) 70 Mb 80 Mb 110 Mb 120 Mb 130 Mb 140 Mb 90 Mb 100 Mb 154 Mb IVF ES cells iPS cells HDFs hESO-8 NT1 NT2 NT3 NT4 hESO-7 iPS-R1 iPS-R2 iPS-S2 iPS-S1 HDF β = 0 unmethylated β = 1 methylated POU3F4 SLITRK2/SLITRK4 DACH2/RPS6KA6/CHM TMEM187 NT ES cells P < 0.001 0.00 0.20 0.40 0.60 0.80 1.00 Total XCI probes with β < 0.2 or > 0.8 a c PercentageoftotalXCIprobes b P < 0.0010.55 0.5 0.45 0.4 0.35 Averageβ-value Average β-value for all XCI probes iPS-S1 iPS-S2 iPS-R2 iPS-R1 hESO -7 N T4 N T3 N T2 N T1 H DF iPS-S1 iPS-S2 iPS-R2 H DF iPS-R1 hESO -7 N T4 N T3 N T2 N T1 Figure 3 | Methylation at X-chromosome inactivation sites. a, Heat map displaying b-values of previously identified XCI probes on the DNA methylation array in NT ES cells, IVF ES cells, iPS cells and HDFs. The genes highlighted with black boxes showed both aberrant hypermethylation and corresponding changes in gene expression. The hypomethylated genes highlighted in white boxes were associated with corresponding changes in gene expression. b, Line graph showing an average b-value for all XCI probes for each cell line (two-sidedt-test, P , 0.001,error bars s.e.m.). c, The percentage of total XCI probes with b , 0.2 or . 0.8 (two-sided t-test, P , 0.001). RESEARCH ARTICLE 1 8 0 | N A T U R E | V O L 5 1 1 | 1 0 J U L Y 2 0 1 4 Macmillan Publishers Limited. All rights reserved©2014
- 5. IVFEScellscomparedtobothNTEScellsandiPScellsandincludedgenes associated with zinc finger and C2H2-like genes (FDR50.002; n5227). Cluster 8 was enriched for MGI expression of TS10 primary trophoblast giantcells(FDR50.03;n546)andcluster5wasassociatedwithY-linked inheritance. Based on differential expression analysis, we searched for genes dis- playing transcriptional memory in both iPS cells and NT ES cells. Three separate t-tests between HDFs and IVF ES cells, NT ES cells and IVF ES cellsandiPScellsandIVFEScellswereconductedataFDRcut-offof0.05. We found 24 genes that were expressed at significantly lower levels in the NT ES cells and HDFs compared to IVF ES cells, probably indicating in- completely reactivated genes, and 12 genes that were expressed at signifi- cantly higher levels representing incompletely silenced genes (Fig. 6b). In contrast, 171 genes were incompletely reactivated and 32 were incomple- tely silenced in iPS cells. We found that incompletely reactivated genes in iPS cells also retained significantly higher promoter methylation (P, 2.2 3 10216 , Mann– Whitneytest),possiblyindicatingincompletedemethylationduringrepro- gramming (Fig. 6c). Overall, the gene expression and DNA methylation resultswereconsistent,bothsuggestingthatNTEScellsaremoresimilar to IVF ES cells than to iPS cells. Conclusions Here,weshowedthattranscription-factor-basedreprogrammingisassoc- iated with incomplete epigenetic reprogramming. In contrast, the same somaticcellsreprogrammedbySCNTdisplayedepigeneticandtranscrip- tional signatures remarkably similar to those of IVF ES cell controls. Both NT ES cells and iPS cells contained similar levels of de novo CNVs, with some lines (iPS-R2, iPS-S4, iPS-S5 and NT1 and NT2) dis- playing no detectable alterations. This observation indicates that screen- ing of multiple cell lines may allow recovery of genetically normal lines. However,CNVanalysisdoesnotcompletelyexcludethepresenceofpoint mutations, small indels, or translocations. Indeed, exome sequencing has demonstrated that iPS cells carry, on average, six non-synonymous point mutations per line33 . Using genome-wide microarray-based DNA methylation as an indi- catorofreprogramming,wedemonstratedthatNTEScellsundergomore completereprogrammingthaniPScells.Wealsoconfirmedthepersistence ofsomaticpatternsofCpGmethylationinhumaniPScells,consistentwith a mouse study34 . Although NT ES cells also carried evidence of epigenetic memory, iPS cells contained eightfold more CpG sites that retained the DNA methylation pattern of parental HDFs. Whole-genome bisulphite sequencing was consistent with the DNA methylation microarray ana- lysis, showing that iPS cells carried threefold more aberrant CG and tenfold more aberrant non-CG methylation compared to NT ES cells, indicating that SCNT reprogramming is capable of resetting the DNA methylation and corresponding gene expression program more faith- fully than iPS cell reprogramming. cba iPS-R2 iPS-S1 iPS-R1 iPS-S2 hESO-8 hESO-7 NT1 NT3 NT4 NT2 d 0 1 mCG/CG 619 iPS cell CG DMRs 212 NT ES cell CG DMRs All Gene±2kb CGI TSS±2kb TES±2kb Gene NumberofCGDMRs 0 100 200 300 400 500 600 NT ES cells iPS cells 700 NumberofCGDMRs 0 50 100 150 200 250 300 NT1 NT2 NT3 NT4 iPS-R1 iPS-R2 iPS-S1 iPS-S2 mDMRs ntDMRs iDMRs 49 40 42 34 60 71 76 57 90 72 62 50 248 170 232 287 e 400 56 2 48 iPS cell hotspot DMRs (n = 104) NT ES cell hotspot DMRs (n = 50) Hotspot DMRs 466 153 59 Figure 4 | CG DMRs across NT ES cells and iPS cells. a, Complete hierarchical clustering of CG methylation for a total 678 CG DMRs identified by comparing methylomes of NT ES cells and iPS cells to IVF ES cells. b, Venn diagram showing the overlap of CG DMRs across iPS cells and NT ES cells in cases in which the DMR is found in at least one of the lines in the same group. c, The number of 678 CG DMRs that overlapped (at least 1 bp) with indicated genomic features. CGI, CG islands; TES, transcription end sites; TSS, transcription start sites. d, Distribution of CG DMRs among each NT ES cell and iPS cell line. DMRs that were also shared with parental somatic cells were identified as memory or mDMRs. Other DMRs were then assigned into NT-specific DMRs (ntDMRs) and iPS-cell-specific DMRs (iDMRs) if the DMRs were present in NT ES cell lines and iPS cell lines, respectively. e, The Venn diagram shows the hotspot CG DMRs that were identified in every iPS cell or NT ES cell line in the same group. Hotspot CG DMRs (48) were shared among all iPS cell and NT ES cell lines. a Totalbasesin non-CGmegaDMRs(Mb) 0 20 40 60 80 Non-CG hypomethylation Non-CG hypermethylation c NumberofnonCGmega-DMRs 0 20 40 60 80 NT1 NT2 NT3 NT4 iPS-R1 iPS-R2 iPS-S1 iPS-S2 IMR90-iPSC ADS-iPSC FF-iPSC19.11 FF-iPSC19.7 FF-iPSC6.9 NT1 NT2 NT3 NT4 iPS-R1 iPS-R2 iPS-S1 iPS-S2 IMR90-iPSC ADS-iPSC FF-iPSC19.11 FF-iPSC19.7 FF-iPSC6.9 Non-CG hypomethylation Non-CG hypermethylation d 70 2 75 non-CG mega DMRs in iPS cells 7 non-CG mega DMRs in NT ES cells Non-CG mega DMRs iPS cells NT ES cells Shared 1 2 3 4 5 6 7 8 9 10 111213141516171819202122 b 5 Figure 5 | Non-CG mega DMRs in NT ES cells and iPS cells. a, Venn diagram showing the overlap of the 77 non-CG mega DMRs identified in the iPS cell and the NT ES cell lines from this study. Numbers within circles denote DMRs identified exclusively within each group. Five DMRs were shared among all cell lines in both groups. b, Chromosome ideogram showing the location of the 77 non-CG mega DMRs found in both NT ES cell and iPS cell lines from this study. Orange circles and lines indicate thelocation of theindividualDMRs specific for iPS cells; green circles and lines denote those specific for NT ES cells and yellow circles and lines are DMRs shared by both cell types. c, Total length of the non-CG mega DMRs identified in 4 NT ES cell and 9 iPS cell lines. The NT ES cells had a significantly lower size of DMRs (Mann–Whitney test, P , 0.005) compared to the iPS cells. FF, foreskin fibroblasts. d, Total number of the non-CG mega DMRs identified in the cell lines. The NT ES cells had a significantly lower number of DMRs (Mann–Whitney test, P , 0.005) compared to the iPS cells. ARTICLE RESEARCH 1 0 J U L Y 2 0 1 4 | V O L 5 1 1 | N A T U R E | 1 8 1 Macmillan Publishers Limited. All rights reserved©2014
- 6. An explanation for this more effective reprogramming by SCNT is thatthe ooplasm provides ‘physiologic’ levelsofreprogramming factors that are upstream of pluripotency. It has been suggested that oocyte fac- torsrapidlydemethylatethesomaticgenome,whereasthisprocessoccurs passively during factor-based reprogramming34 . Clearly, elucidation of oocyte-based reprogramming mechanisms will support the develop- ment of improved reprogramming protocols. In summary, although IVF ES cells most closely resemble cells resid- ing in embryos, they are allogeneic. Human iPS cells might remain the most facile cell type for many in vitro applications, but show extensive epigenetic and transcriptomic aberrations compared to NT ES cells and IVF ES cells. NT ES cells combine significant advantages of both types; epigenetic stability of IVF ES cells and the histocompatible nature of iPS cells. Further studies on additional NT ES cell lines, especially lines derived from aged patients, and their differentiation potential are now warranted. Online Content Methods, along with any additional Extended Data display items andSource Data, are available in the onlineversion of the paper; references unique to these sections appear only in the online paper. Received 9 December 2013; accepted 5 June 2014. Published online 2 July 2014. 1. Thomson, J. A. et al. Embryonic stem cell lines derived from human blastocysts. Science 282, 1145–1147 (1998). 2. Takahashi, K. et al. Induction of pluripotent stem cells from adult human fibroblasts by defined factors. Cell 131, 861–872 (2007). 3. Rais, Y. et al. Deterministic direct reprogramming of somatic cells to pluripotency. Nature 502, 65–70 (2013). 4. Hussein,S.M.etal. Copynumbervariationandselectionduringreprogrammingto pluripotency. Nature 471, 58–62 (2011). 5. Laurent, L. C. et al. Dynamic changes in the copy number of pluripotency and cell proliferation genes in human ESCs and iPSCs during reprogramming and time in culture. Cell Stem Cell 8, 106–118 (2011). 6. Ruiz,S. et al. Analysis ofprotein-codingmutationsinhiPSCsandtheir possiblerole during somatic cell reprogramming. Nature Commun. 4, 1382 (2013). Singletons Negative regulation of histone acetylation (fold 41.6) FDR = 0.007 p38 MAPK signalling pathway (fold 17.7) FDR = 0.02 Krueppel-associated box (fold 8.02) FDR = 0.001 TS10 primary trophoblast giant cells (fold 10.7) FDR = 0.028 Y-linked inheritance (fold 58.3) FDR = 0.005NT2-1 NT3-1 NT4-2 NT1-1 hESO-8-1 hESO-7-1 iPS-R2-2 iPS-R2-1 iPS-S1-2 iPS-S2-1 HDF1 HDF2 hESO-7-2 hESO-8-2 NT1-2 NT2-2 NT4-1 NT3-2 iPS-S3-2 iPS-R1-1 iPS-R1-2 iPS-S1-1 iPS-S2-2 iPS-S3-1 2.0 1.0 0.0 –1.0 –2.0 Zinc finger, C2H2-like (fold 2.4) FDR = 0.002 NT ES cells IVF ES cells iPS ES cells Promoterβ(n=1,217) P < 2.2 × 10⁻¹⁶ a b c Promoter methylation of genes significantly lower compared to IVF ES cells in both HDF and iPS cellsIPS cells vs IVF ES cells 629 genes Q < 0.05 203 genes NT ES cells vs IVF ES cells 48 genes Q < 0.05 36 genes HDFs vs IVF ES cells 5,820 genes Q value < 0.05 IVF ES cells iPS cells HDFs NT ES cells Cluster 1 Cluster 2 Cluster 3 Cluster 4 Cluster 5 Cluster 6 Cluster 7 Cluster 8 Cluster 9 Cluster 10 0.8 0.6 0.4 0.2 0.0 1.0 Figure 6 | Gene expression analysis by RNA-seq. a, Heat map displaying 1,220 differentially expressed genes between NT ES cells, iPS cells and IVF ES cells (n 5 22) (ANOVA adjusted p-value ,0.05). Genes were clustered into ten-groups for functional analysis and presented as a heat map. Cluster 4, 6, 7, and 9 showed no significant functional enrichments. b, Venn diagram showing the number of genes differentially expressed between the HDFs and the IVF ES cells (large circle), the iPS cells and the IVF ES cells (medium circle) and the NT ES cells and IVF ES cells (small circle; t-test FDR ,0.05). Overlapping regions represent the number of genes differentially expressed in both the HDFs and either the NT ES cells or iPS cells. c, Notched box plots represent the b-value of all probes in the promoter regions (22,000 bp to 500 bp) of the genes that were expressed at significantly lower levels (t-test FDR , 0.05) in both the HDFs and the iPS cells (exhibiting transcriptional memory) when compared to the IVF ES cells. The box represents the interquartile range (25th to 75th percentile), and the line within the box marks, the median. The notch in the box represents the 95% confidence interval around the median. The whiskers above and below the box contain 99.3% of the data and the number of CpGs interrogated is shown on the y axis. RESEARCH ARTICLE 1 8 2 | N A T U R E | V O L 5 1 1 | 1 0 J U L Y 2 0 1 4 Macmillan Publishers Limited. All rights reserved©2014
- 7. 7. Nazor, K. L. et al. Recurrent variations in DNA methylation in human pluripotent stem cells and their differentiated derivatives. Cell Stem Cell 10, 620–634 (2012). 8. Lister,R.etal.Hotspotsofaberrantepigenomicreprogramminginhumaninduced pluripotent stem cells. Nature 471, 68–73 (2011). 9. Ohi, Y. et al. Incomplete DNA methylation underlies a transcriptional memory of somatic cells in human iPS cells. Nature Cell Biol. 13, 541–549 (2011). 10. Ruiz, S. et al. Identification of a specific reprogramming-associated epigenetic signature in human induced pluripotent stem cells. Proc. Natl Acad. Sci. USA 109, 16196–16201 (2012). 11. Tachibana, M. et al. Human embryonic stem cells derived by somatic cell nuclear transfer. Cell 153, 1228–1238 (2013). 12. Lowry,W.E.etal.Generation ofhuman inducedpluripotentstemcellsfromdermal fibroblasts. Proc. Natl Acad. Sci. USA 105, 2883–2888 (2008). 13. Fusaki, N., Ban, H., Nishiyama, A., Saeki, K. & Hasegawa, M. Efficient induction of transgene-free humanpluripotentstem cells using a vectorbasedon Sendaivirus, an RNA virus that does not integrate into the host genome. Proc. Jpn Acad. B 85, 348–362 (2009). 14. Taylor, R. W. & Turnbull, D. M. Mitochondrial DNA mutations in human disease. Nature Rev. Genet. 6, 389–402 (2005). 15. Bock, C. et al. Reference maps of human ES and iPS cell variation enable high-throughput characterization of pluripotent cell lines. Cell 144, 439–452 (2011). 16. Suzuki, R. & Shimodaira, H. Pvclust: an R package for assessing the uncertainty in hierarchical clustering. Bioinformatics 22, 1540–1542 (2006). 17. Ziller, M. J. et al. Genomic distribution and inter-sample variation of non-CpG methylation across human cell types. PLoS Genet. 7, e1002389 (2011). 18. Stelzer, Y. et al. Identification of novel imprinted differentially methylated regions by global analysis of human-parthenogenetic-induced pluripotent stem cells. Stem Cell Rep. 1, 79–89 (2013). 19. Rugg-Gunn,P.J.,Ferguson-Smith,A.C.&Pedersen,R.A.Statusofgenomicimprinting inhumanembryonicstemcellsasrevealedbyalargecohortofindependentlyderived and maintained lines. Hum. Mol. Genet. 16, R243–R251 (2007). 20. de Hoon, M. J., Imoto, S., Nolan, J. & Miyano, S. Open source clustering software. Bioinformatics 20, 1453–1454 (2004). 21. Saldanha, A. J. Java Treeview–extensible visualization of microarray data. Bioinformatics 20, 3246–3248 (2004). 22. Silva, S. S., Rowntree, R. K., Mekhoubad, S. & Lee, J. T. X-chromosome inactivation and epigenetic fluidity in human embryonic stem cells. Proc. Natl Acad. Sci. USA 105, 4820–4825 (2008). 23. Vallot, C. et al. XACT, a long noncoding transcript coating the active X chromosome in human pluripotent cells. Nature Genet. 45, 239–241 (2013). 24. Newman, A. M.& Cooper, J. B.AutoSOME: a clustering method for identifying gene expression modules without prior knowledge of cluster number. BMC Bioinformatics 11, 117 (2010). 25. McLean, C. Y. et al. GREAT improves functional interpretation of cis-regulatory regions. Nature Biotechnol. 28, 495–501 (2010). 26. Nishino, K. et al. DNA methylation dynamics in human induced pluripotent stem cells over time. PLoS Genet. 7, e1002085 (2011). 27. Polo, J. M. et al. Cell type of origin influences the molecular and functional properties of mouse induced pluripotent stem cells. Nature Biotechnol. 28, 848–855 (2010). 28. Xie, W. et al. Epigenomic analysis of multilineage differentiation of human embryonic stem cells. Cell 153, 1134–1148 (2013). 29. Laurent, L.et al. Dynamicchangesinthe human methylome duringdifferentiation. Genome Res. 20, 320–331 (2010). 30. Lister, R. et al. Global epigenomic reconfiguration during mammalian brain development. Science 341, 1237905 (2013). 31. Lister, R. et al. Human DNA methylomes at base resolution show widespread epigenomic differences. Nature 462, 315–322 (2009). 32. Ashburner, M. et al. Gene ontology: tool for the unification of biology. The Gene Ontology Consortium. Nature Genet. 25, 25–29 (2000). 33. Gore, A. et al. Somatic coding mutations in human induced pluripotent stem cells. Nature 471, 63–67 (2011). 34. Kim, K. et al. Epigenetic memory in induced pluripotent stem cells. Nature 467, 285–290 (2010). Supplementary Information is available in the online version of the paper. Acknowledgements The authors acknowledge the OHSU Embryonic Stem Cell Research Oversight Committee and the Institutional Review Board for providing oversight and guidance. We thank oocyte and sperm donors and the Women’s Health Research Unit staff at the Center for Women’s Health, University Fertility Consultants and the Reproductive Endocrinology and Infertility Division in the Department of Obstetrics and Gynecology of Oregon Health and Science University for their support and procurement of human gametes. We are grateful to C. Penedo for microsatellite analysis and W. Sanger and D. Zaleski for karyotyping services. We are also indebted to Y.Li, H.Sritanaudomchaiand D. Melguizo Sanchis for theirtechnicalsupport.Wethank the staff at the Institute for Genomic Medicine Genomics Facility at UCSD for running the Infinium HumanMethylation450 BeadChips and sequencing of the RNA-seq libraries. The authors acknowledge the Texas Advanced Computing Center (TACC) at The University of Texas at Austin (http://www.tacc.utexas.edu) and the San Diego Supercomputing Center (through an allocation from the eXtreme Science and Engineering Discovery Environment (XSEDE)) for providing HPC resources that have contributed to the research results reported within this paper. SCNT and iPS cell studies were supported by grants from the Leducq Foundation and OHSU institutional funds. R.M., K.S., R.T. and L.C.L. were supported by the UCSD Department of Reproductive Medicine. Methylome studies were supported by the Salk International Council Chair fund endowment and the Mary K. Chapman Foundation to J.R.E. J.R.E. is an investigator of the Howard Hughes Medical Institute and the Gordon and Betty Moore Foundation (GMBF3034). A.P. received a fellowship from the Swedish Research Council, Vetenskapsra˚det. E.K. was partially funded by a fellowship from the Collins Medical Trust. Author Contributions H.M., R.M., L.C.L. and S.M. conceived the study and designed the experiments. P.A., M.S. and N.M.G. coordinated recruitment of gamete donors. P.A. performed ovarian stimulations and oocyte retrievals. M.T., M.S., N.M.G. and S.M. conducted SCNT, IVF and embryo culture experiments. R.T.-H., S.M., M.T., M.S., N.M.G., H.M., A.P., B.D., E.K., A.S. and R.A. derived and cultured IVF ES cells, NT ES cells and iPS cells. S.G. performed teratoma analysis. H.M., M.T. and C.V.D. performed the DNA and RNA extractions, mtDNA amplification refractory mutation system qPCR analyses, and qPCR. R.M., K.S., R.D.T. and L.C.L. performed SNP, DNA methylation and RNA-seq studies and bioinformatic analysis of the data. R.C.O., Y.H., M.D.S., M.H., J.R.N., R.C. and J.R.E. conducted MethylC-seq studies. H.M., R.M., R.C.O., Y.H., J.R.E., L.C.L., D.P.W. and S.M. wrote the paper. Author Information Processed datasetscanbedownloaded from the NCBI GEO under accession GSE53096 for RNA-seq, SNP array and 450K methylation array, and accession GSE57179 for MethylC-seq data. Analysed MethylC-seq data sets can also be accessed at http://neomorph.salk.edu/SCNT/browser.html. Reprints and permissions information is available at www.nature.com/reprints. The authors declare no competing financial interests. Readers are welcome to comment on the online version of the paper. Correspondence and requests for materials should be addressed to S.M. (mitalipo@ohsu.edu), L.C.L. (llaurent@ucsd.edu) or J.R.E (ecker@salk.edu). ARTICLE RESEARCH 1 0 J U L Y 2 0 1 4 | V O L 5 1 1 | N A T U R E | 1 8 3 Macmillan Publishers Limited. All rights reserved©2014