SlideShare a Scribd company logo
1 of 1
Download to read offline
Period: Year (2014)
Staff Name Sales (£) Year to
Date Sales
(£)
Margin
(%)
Year to
Date
Margin (%)
Avg Sales
(£) Per
Hour
Year to Date
Avg Sales (£)
Per Hour
Discount (%) Year to
Date
Discount
(%)
ATV (£) Year to
Date ATV
(£)
IPB Year to
Date IPB
Swipe
(%)
Year to
Date
Swipe (%)
Customer
Survey Avg
% Score
No of
Surveys
Complete
Year to Date
Customer
Survey Avg %
Score
Year to Date
No of Surveys
Complete
BELL, PETER 8241 185277 26.6 34.1 56 102 0.4 1.4 67 74.47 1.7 1.9 49.6 44.6 95.2 4 88 31
BYIERS, CRAIG 16676 427777 38.4 34.1 120 231 3.1 2.4 131.31 107.13 2.3 2 59.1 53.1 0 0 90.1 31
Hudghton, David 9558 152115 25.4 32.7 59 103 6.8 2.7 83.84 76.13 1.6 1.8 61.4 51.1 92.8 2 91.3 10
Leadley, Richard 15331 315382 27.1 33.8 136 182 0.7 2.3 98.91 89.8 1.6 1.8 54.2 48.5 93 9 92.5 44
McDonald, Neil 10296 316449 29 31.5 94 209 0.3 2.4 72.5 81.75 1.6 2.1 60.6 54.7 0 0 88.4 19
Aberdeen 60097 1400384 30.2 33.3 89.83 167.05 2.3 2.3 90.78 88.01 1.8 2 56.8 51 93.5 15 90.2 135
NORTH 25.8 32.4 9.6 3.5 72.78 77.85 1.7 1.9 69.4 66 93.7 280 90.6 3091
Company 27.8 33.2 9.5 3.2 75.87 81.5 1.9 2 71.2 70.6 93.4 1955 90.5 19815
Period: Q1 (2015)
Staff Name Sales (£) Year to
Date Sales
(£)
Margin
(%)
Year to
Date
Margin (%)
Avg Sales
(£) Per
Hour
Year to Date
Avg Sales (£)
Per Hour
Discount (%) Year to
Date
Discount
(%)
ATV (£) Year to
Date ATV
(£)
IPB Year to
Date IPB
Swipe
(%)
Year to
Date
Swipe (%)
Customer
Survey Avg
% Score
No of
Surveys
Complete
Year to Date
Customer
Survey Avg %
Score
Year to Date
No of Surveys
Complete
BELL, PETER 0 885 0 32.6 0 21 0 0 0 73.78 0 1.9 0 58.3 0 0 0 0
BYIERS, CRAIG 36887 71337 41.1 40.6 140 119 1.3 1.4 111.11 109.24 2.2 2.2 63 62.8 100 1 93.3 5
Hudghton, David 24700 38134 39.2 37.9 100 73 1 1.4 119.32 108.64 2.3 2.1 68.1 69.8 96.4 1 95.6 10
Leadley, Richard 42676 79344 40.4 40 147 135 1.5 1.4 95.26 96.64 2 1.9 70.3 65.5 94.5 3 92.9 7
McDonald, Neil 46738 77376 39.6 39 159 136 0.3 0.5 87.03 87.33 2.2 2.1 77.1 77.7 100 3 99.6 8
Aberdeen 150901 266667 40.1 39.6 137.87 114.92 1 1.1 98.89 97.72 2.2 2.1 70.7 69.2 97.5 8 95.7 30
NORTH 39.0 38.2 1.4 1.5 88.58 88.34 2 1.9 67.7 69.6 93.8 116 94.5 505
Company 39.5 38.6 1.3 1.4 92.19 90.65 2.1 2 73.5 74.7 94 934 94.4 4020
Improvement 6.3 1.2 £9.71 0.1 18.2 5.5
As Percentage of total = 18% 47% 11% 5% 35% 6%
Key 2014 Year End Results 2015 Q1 Results Above Company Average Improvements under my Leadership
SALES (£) / MARGIN KPIs CUSTOMER SERVICE
americangolf Scorecard
SALES (£) / MARGIN KPIs CUSTOMER SERVICE

More Related Content

What's hot

Rentabilidade acumulada fundos imobiliários agosto 2015
Rentabilidade acumulada fundos imobiliários agosto 2015Rentabilidade acumulada fundos imobiliários agosto 2015
Rentabilidade acumulada fundos imobiliários agosto 2015claudiusinhos
 
מצגת נוזלי הגוף
מצגת  נוזלי הגוףמצגת  נוזלי הגוף
מצגת נוזלי הגוףtal zohar
 
KENYA AIRWAYS STATEMENT ANALYSIS- CIFA LUDENYO
KENYA AIRWAYS STATEMENT ANALYSIS- CIFA LUDENYOKENYA AIRWAYS STATEMENT ANALYSIS- CIFA LUDENYO
KENYA AIRWAYS STATEMENT ANALYSIS- CIFA LUDENYOJESSELUDENYO
 
LBS - Economic and Financial Forecasts - June 2017
LBS - Economic and Financial Forecasts - June 2017LBS - Economic and Financial Forecasts - June 2017
LBS - Economic and Financial Forecasts - June 2017Mark MacIsaac
 
Q3 fy2018 investor presentation final
Q3 fy2018 investor presentation finalQ3 fy2018 investor presentation final
Q3 fy2018 investor presentation finalnutanixipo
 
Q22018 investor presentation final
Q22018 investor presentation finalQ22018 investor presentation final
Q22018 investor presentation finalnutanixipo
 
Sightlines 2015 State of Facilities: An In-Depth Look at Operations Trends
Sightlines 2015 State of Facilities: An In-Depth Look at Operations TrendsSightlines 2015 State of Facilities: An In-Depth Look at Operations Trends
Sightlines 2015 State of Facilities: An In-Depth Look at Operations TrendsSightlines
 
Half and half restaurant final pitch
Half and half restaurant final pitchHalf and half restaurant final pitch
Half and half restaurant final pitchQi An
 
Inventory Discrepancy Comparison Cover Sheet
Inventory Discrepancy Comparison Cover SheetInventory Discrepancy Comparison Cover Sheet
Inventory Discrepancy Comparison Cover SheetRyan Smith
 
KENYA AIRWAYS STATEMENT ANALYSIS- CIFA LUDENYO
KENYA AIRWAYS STATEMENT ANALYSIS- CIFA LUDENYOKENYA AIRWAYS STATEMENT ANALYSIS- CIFA LUDENYO
KENYA AIRWAYS STATEMENT ANALYSIS- CIFA LUDENYOJESSELUDENYO
 
STAR Report FY13-14
STAR Report FY13-14STAR Report FY13-14
STAR Report FY13-14Joe Liu
 
Code compliance pitch bradley ean_9_26_19
Code compliance pitch bradley ean_9_26_19Code compliance pitch bradley ean_9_26_19
Code compliance pitch bradley ean_9_26_19EAN-VT
 
Hybrid cloud & orchestration - a critical success factor in your digital tran...
Hybrid cloud & orchestration - a critical success factor in your digital tran...Hybrid cloud & orchestration - a critical success factor in your digital tran...
Hybrid cloud & orchestration - a critical success factor in your digital tran...Atos
 

What's hot (20)

Samsungelectronics 005930-Algorithm Investment Report
Samsungelectronics 005930-Algorithm Investment ReportSamsungelectronics 005930-Algorithm Investment Report
Samsungelectronics 005930-Algorithm Investment Report
 
Capex
CapexCapex
Capex
 
Rentabilidade acumulada fundos imobiliários agosto 2015
Rentabilidade acumulada fundos imobiliários agosto 2015Rentabilidade acumulada fundos imobiliários agosto 2015
Rentabilidade acumulada fundos imobiliários agosto 2015
 
מצגת נוזלי הגוף
מצגת  נוזלי הגוףמצגת  נוזלי הגוף
מצגת נוזלי הגוף
 
KENYA AIRWAYS STATEMENT ANALYSIS- CIFA LUDENYO
KENYA AIRWAYS STATEMENT ANALYSIS- CIFA LUDENYOKENYA AIRWAYS STATEMENT ANALYSIS- CIFA LUDENYO
KENYA AIRWAYS STATEMENT ANALYSIS- CIFA LUDENYO
 
LBS - Economic and Financial Forecasts - June 2017
LBS - Economic and Financial Forecasts - June 2017LBS - Economic and Financial Forecasts - June 2017
LBS - Economic and Financial Forecasts - June 2017
 
Q3 fy2018 investor presentation final
Q3 fy2018 investor presentation finalQ3 fy2018 investor presentation final
Q3 fy2018 investor presentation final
 
Q22018 investor presentation final
Q22018 investor presentation finalQ22018 investor presentation final
Q22018 investor presentation final
 
Sightlines 2015 State of Facilities: An In-Depth Look at Operations Trends
Sightlines 2015 State of Facilities: An In-Depth Look at Operations TrendsSightlines 2015 State of Facilities: An In-Depth Look at Operations Trends
Sightlines 2015 State of Facilities: An In-Depth Look at Operations Trends
 
kospi Algorithm Forecast Report20211215
kospi Algorithm Forecast Report20211215kospi Algorithm Forecast Report20211215
kospi Algorithm Forecast Report20211215
 
Balance20141231 3
Balance20141231 3Balance20141231 3
Balance20141231 3
 
Half and half restaurant final pitch
Half and half restaurant final pitchHalf and half restaurant final pitch
Half and half restaurant final pitch
 
Inventory Discrepancy Comparison Cover Sheet
Inventory Discrepancy Comparison Cover SheetInventory Discrepancy Comparison Cover Sheet
Inventory Discrepancy Comparison Cover Sheet
 
Daily Derivative Report
Daily Derivative ReportDaily Derivative Report
Daily Derivative Report
 
KENYA AIRWAYS STATEMENT ANALYSIS- CIFA LUDENYO
KENYA AIRWAYS STATEMENT ANALYSIS- CIFA LUDENYOKENYA AIRWAYS STATEMENT ANALYSIS- CIFA LUDENYO
KENYA AIRWAYS STATEMENT ANALYSIS- CIFA LUDENYO
 
Control Room business and strategic
Control Room business and strategic Control Room business and strategic
Control Room business and strategic
 
STAR Report FY13-14
STAR Report FY13-14STAR Report FY13-14
STAR Report FY13-14
 
Code compliance pitch bradley ean_9_26_19
Code compliance pitch bradley ean_9_26_19Code compliance pitch bradley ean_9_26_19
Code compliance pitch bradley ean_9_26_19
 
Hybrid cloud & orchestration - a critical success factor in your digital tran...
Hybrid cloud & orchestration - a critical success factor in your digital tran...Hybrid cloud & orchestration - a critical success factor in your digital tran...
Hybrid cloud & orchestration - a critical success factor in your digital tran...
 
Elevator speeches
Elevator speechesElevator speeches
Elevator speeches
 

Similar to 2014 Year End Vs 2015 Q1

Fixed Capital Analysis PowerPoint Presentation Slides
Fixed Capital Analysis PowerPoint Presentation SlidesFixed Capital Analysis PowerPoint Presentation Slides
Fixed Capital Analysis PowerPoint Presentation SlidesSlideTeam
 
October Market Watch is Here !
October Market Watch is Here !October Market Watch is Here !
October Market Watch is Here !Michelle Makos
 
Market Report for August 2017 - Residential Resale
Market Report for August 2017 - Residential ResaleMarket Report for August 2017 - Residential Resale
Market Report for August 2017 - Residential ResaleMichelle Makos
 
'United Kingdom Commercial Radio: Q4 2007' by Grant Goddard
'United Kingdom Commercial Radio: Q4 2007' by Grant Goddard'United Kingdom Commercial Radio: Q4 2007' by Grant Goddard
'United Kingdom Commercial Radio: Q4 2007' by Grant GoddardGrant Goddard
 
September 2017 digital realty company overview
September 2017 digital realty company overviewSeptember 2017 digital realty company overview
September 2017 digital realty company overviewir_digitalrealty
 
'United Kingdom Commercial Radio: Q1 2008' by Grant Goddard
'United Kingdom Commercial Radio: Q1 2008' by Grant Goddard'United Kingdom Commercial Radio: Q1 2008' by Grant Goddard
'United Kingdom Commercial Radio: Q1 2008' by Grant GoddardGrant Goddard
 
Indian Spectrum Auctions : Design Issues & Way Forward
Indian Spectrum Auctions : Design Issues & Way ForwardIndian Spectrum Auctions : Design Issues & Way Forward
Indian Spectrum Auctions : Design Issues & Way ForwardParag Kar
 
Full Market April Market Watch 2022
Full Market April Market Watch 2022Full Market April Market Watch 2022
Full Market April Market Watch 2022Michelle Makos
 
Improving the design of indian spectrum auctions
Improving the design of indian spectrum auctionsImproving the design of indian spectrum auctions
Improving the design of indian spectrum auctionsParag Kar
 
Horniman Horticulture, FIL 349 ( Advanced Financial Theory and Problems)
Horniman Horticulture, FIL 349 ( Advanced Financial Theory and Problems)Horniman Horticulture, FIL 349 ( Advanced Financial Theory and Problems)
Horniman Horticulture, FIL 349 ( Advanced Financial Theory and Problems)CameronMcintosh8
 
Self Storage Annual Report 2016 in conjunction with SSA UK
Self Storage Annual Report 2016 in conjunction with SSA UKSelf Storage Annual Report 2016 in conjunction with SSA UK
Self Storage Annual Report 2016 in conjunction with SSA UKCushman & Wakefield
 
Market Watch TORONTO 2015 SEPTEMBER
Market Watch TORONTO 2015 SEPTEMBERMarket Watch TORONTO 2015 SEPTEMBER
Market Watch TORONTO 2015 SEPTEMBERChaba Tamasi
 
Spdr debunking-5-common-gold-misconceptions
Spdr debunking-5-common-gold-misconceptionsSpdr debunking-5-common-gold-misconceptions
Spdr debunking-5-common-gold-misconceptionsZewoMaluk
 
YorBox UK model
YorBox UK modelYorBox UK model
YorBox UK modelYorBox
 
Aminullah assagaf mp2 manajemen proyek
Aminullah assagaf mp2 manajemen proyekAminullah assagaf mp2 manajemen proyek
Aminullah assagaf mp2 manajemen proyekAminullah Assagaf
 
Market Watch TORONTO 2014 OCTOBER
Market Watch TORONTO 2014 OCTOBERMarket Watch TORONTO 2014 OCTOBER
Market Watch TORONTO 2014 OCTOBERChaba Tamasi
 
Awards Day April 2009
Awards Day April 2009Awards Day April 2009
Awards Day April 2009Angus Leisure
 

Similar to 2014 Year End Vs 2015 Q1 (20)

13 kp is
13 kp is13 kp is
13 kp is
 
Fixed Capital Analysis PowerPoint Presentation Slides
Fixed Capital Analysis PowerPoint Presentation SlidesFixed Capital Analysis PowerPoint Presentation Slides
Fixed Capital Analysis PowerPoint Presentation Slides
 
October Market Watch is Here !
October Market Watch is Here !October Market Watch is Here !
October Market Watch is Here !
 
Hansson
HanssonHansson
Hansson
 
Market Report for August 2017 - Residential Resale
Market Report for August 2017 - Residential ResaleMarket Report for August 2017 - Residential Resale
Market Report for August 2017 - Residential Resale
 
'United Kingdom Commercial Radio: Q4 2007' by Grant Goddard
'United Kingdom Commercial Radio: Q4 2007' by Grant Goddard'United Kingdom Commercial Radio: Q4 2007' by Grant Goddard
'United Kingdom Commercial Radio: Q4 2007' by Grant Goddard
 
CFO Dashboard Template in Excel
CFO Dashboard Template in ExcelCFO Dashboard Template in Excel
CFO Dashboard Template in Excel
 
September 2017 digital realty company overview
September 2017 digital realty company overviewSeptember 2017 digital realty company overview
September 2017 digital realty company overview
 
'United Kingdom Commercial Radio: Q1 2008' by Grant Goddard
'United Kingdom Commercial Radio: Q1 2008' by Grant Goddard'United Kingdom Commercial Radio: Q1 2008' by Grant Goddard
'United Kingdom Commercial Radio: Q1 2008' by Grant Goddard
 
Indian Spectrum Auctions : Design Issues & Way Forward
Indian Spectrum Auctions : Design Issues & Way ForwardIndian Spectrum Auctions : Design Issues & Way Forward
Indian Spectrum Auctions : Design Issues & Way Forward
 
Full Market April Market Watch 2022
Full Market April Market Watch 2022Full Market April Market Watch 2022
Full Market April Market Watch 2022
 
Improving the design of indian spectrum auctions
Improving the design of indian spectrum auctionsImproving the design of indian spectrum auctions
Improving the design of indian spectrum auctions
 
Horniman Horticulture, FIL 349 ( Advanced Financial Theory and Problems)
Horniman Horticulture, FIL 349 ( Advanced Financial Theory and Problems)Horniman Horticulture, FIL 349 ( Advanced Financial Theory and Problems)
Horniman Horticulture, FIL 349 ( Advanced Financial Theory and Problems)
 
Self Storage Annual Report 2016 in conjunction with SSA UK
Self Storage Annual Report 2016 in conjunction with SSA UKSelf Storage Annual Report 2016 in conjunction with SSA UK
Self Storage Annual Report 2016 in conjunction with SSA UK
 
Market Watch TORONTO 2015 SEPTEMBER
Market Watch TORONTO 2015 SEPTEMBERMarket Watch TORONTO 2015 SEPTEMBER
Market Watch TORONTO 2015 SEPTEMBER
 
Spdr debunking-5-common-gold-misconceptions
Spdr debunking-5-common-gold-misconceptionsSpdr debunking-5-common-gold-misconceptions
Spdr debunking-5-common-gold-misconceptions
 
YorBox UK model
YorBox UK modelYorBox UK model
YorBox UK model
 
Aminullah assagaf mp2 manajemen proyek
Aminullah assagaf mp2 manajemen proyekAminullah assagaf mp2 manajemen proyek
Aminullah assagaf mp2 manajemen proyek
 
Market Watch TORONTO 2014 OCTOBER
Market Watch TORONTO 2014 OCTOBERMarket Watch TORONTO 2014 OCTOBER
Market Watch TORONTO 2014 OCTOBER
 
Awards Day April 2009
Awards Day April 2009Awards Day April 2009
Awards Day April 2009
 

2014 Year End Vs 2015 Q1

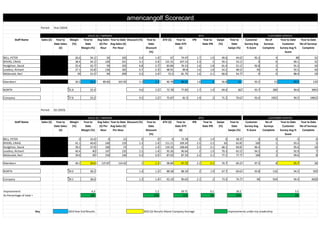
  • 1. Period: Year (2014) Staff Name Sales (£) Year to Date Sales (£) Margin (%) Year to Date Margin (%) Avg Sales (£) Per Hour Year to Date Avg Sales (£) Per Hour Discount (%) Year to Date Discount (%) ATV (£) Year to Date ATV (£) IPB Year to Date IPB Swipe (%) Year to Date Swipe (%) Customer Survey Avg % Score No of Surveys Complete Year to Date Customer Survey Avg % Score Year to Date No of Surveys Complete BELL, PETER 8241 185277 26.6 34.1 56 102 0.4 1.4 67 74.47 1.7 1.9 49.6 44.6 95.2 4 88 31 BYIERS, CRAIG 16676 427777 38.4 34.1 120 231 3.1 2.4 131.31 107.13 2.3 2 59.1 53.1 0 0 90.1 31 Hudghton, David 9558 152115 25.4 32.7 59 103 6.8 2.7 83.84 76.13 1.6 1.8 61.4 51.1 92.8 2 91.3 10 Leadley, Richard 15331 315382 27.1 33.8 136 182 0.7 2.3 98.91 89.8 1.6 1.8 54.2 48.5 93 9 92.5 44 McDonald, Neil 10296 316449 29 31.5 94 209 0.3 2.4 72.5 81.75 1.6 2.1 60.6 54.7 0 0 88.4 19 Aberdeen 60097 1400384 30.2 33.3 89.83 167.05 2.3 2.3 90.78 88.01 1.8 2 56.8 51 93.5 15 90.2 135 NORTH 25.8 32.4 9.6 3.5 72.78 77.85 1.7 1.9 69.4 66 93.7 280 90.6 3091 Company 27.8 33.2 9.5 3.2 75.87 81.5 1.9 2 71.2 70.6 93.4 1955 90.5 19815 Period: Q1 (2015) Staff Name Sales (£) Year to Date Sales (£) Margin (%) Year to Date Margin (%) Avg Sales (£) Per Hour Year to Date Avg Sales (£) Per Hour Discount (%) Year to Date Discount (%) ATV (£) Year to Date ATV (£) IPB Year to Date IPB Swipe (%) Year to Date Swipe (%) Customer Survey Avg % Score No of Surveys Complete Year to Date Customer Survey Avg % Score Year to Date No of Surveys Complete BELL, PETER 0 885 0 32.6 0 21 0 0 0 73.78 0 1.9 0 58.3 0 0 0 0 BYIERS, CRAIG 36887 71337 41.1 40.6 140 119 1.3 1.4 111.11 109.24 2.2 2.2 63 62.8 100 1 93.3 5 Hudghton, David 24700 38134 39.2 37.9 100 73 1 1.4 119.32 108.64 2.3 2.1 68.1 69.8 96.4 1 95.6 10 Leadley, Richard 42676 79344 40.4 40 147 135 1.5 1.4 95.26 96.64 2 1.9 70.3 65.5 94.5 3 92.9 7 McDonald, Neil 46738 77376 39.6 39 159 136 0.3 0.5 87.03 87.33 2.2 2.1 77.1 77.7 100 3 99.6 8 Aberdeen 150901 266667 40.1 39.6 137.87 114.92 1 1.1 98.89 97.72 2.2 2.1 70.7 69.2 97.5 8 95.7 30 NORTH 39.0 38.2 1.4 1.5 88.58 88.34 2 1.9 67.7 69.6 93.8 116 94.5 505 Company 39.5 38.6 1.3 1.4 92.19 90.65 2.1 2 73.5 74.7 94 934 94.4 4020 Improvement 6.3 1.2 £9.71 0.1 18.2 5.5 As Percentage of total = 18% 47% 11% 5% 35% 6% Key 2014 Year End Results 2015 Q1 Results Above Company Average Improvements under my Leadership SALES (£) / MARGIN KPIs CUSTOMER SERVICE americangolf Scorecard SALES (£) / MARGIN KPIs CUSTOMER SERVICE