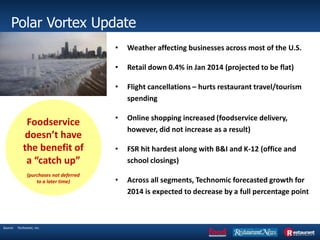
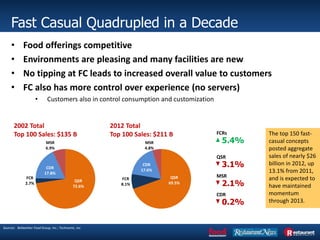
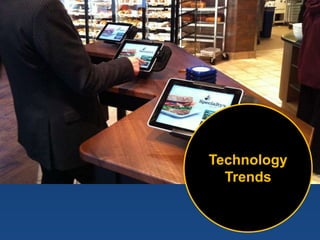
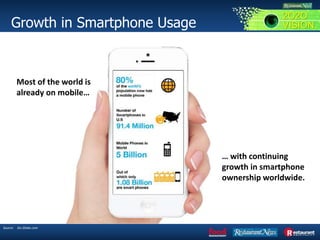
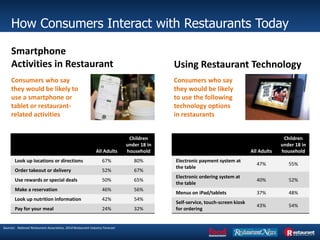
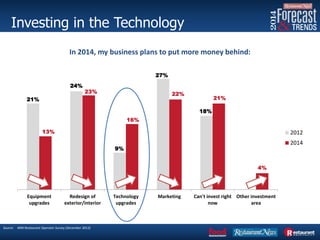
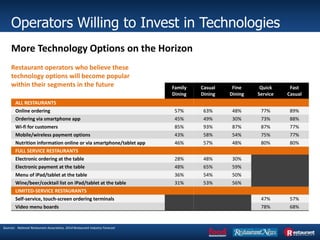
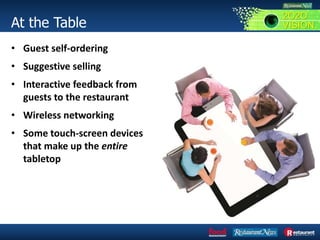
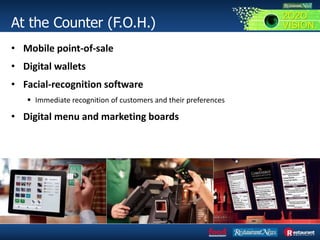
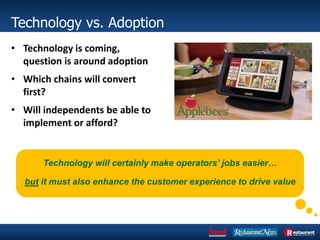
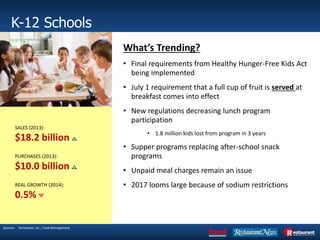
2. Polar Vortex Update
• Weather affecting businesses across most of the U.S.
• Retail down 0.4% in Jan 2014 (projected to be flat)
• Flight cancellations – hurts restaurant travel/tourism
spending
• Online shopping increased (foodservice delivery,
however, did not increase as a result)
• FSR hit hardest along with B&I and K-12 (office and
school closings)
• Across all segments, Technomic forecasted growth for
2014 is expected to decrease by a full percentage point
Source: Technomic, Inc.
Foodservice
doesn’t have
the benefit of
a “catch up”
(purchases not deferred
to a later time)
3. Fast Casual Quadrupled in a Decade
• Food offerings competitive
• Environments are pleasing and many facilities are new
• No tipping at FC leads to increased overall value to customers
• FC also has more control over experience (no servers)
• Customers also in control consumption and customization
The top 150 fast-
casual concepts
posted aggregate
sales of nearly $26
billion in 2012, up
13.1% from 2011,
and is expected to
have maintained
momentum
through 2013.
Sources: Bellwether Food Group, Inc.; Technomic, Inc.
QSR
69.5%
FCR
8.1%
CDR
17.6%
MSR
4.8%
QSR
72.6%
FCR
2.7%
CDR
17.8%
MSR
6.9%
2012 Total
Top 100 Sales: $211 B
2002 Total
Top 100 Sales: $135 B
5.4%
FCRs
3.1%
QSR
2.1%
MSR
0.2%
CDR
5. Growth in Smartphone Usage
Source: Go-Globe.com
… with continuing
growth in smartphone
ownership worldwide.
Most of the world is
already on mobile…
2O2O
VISION
6. How Consumers Interact with Restaurants Today
Sources: National Restaurant Association, 2014 Restaurant Industry Forecast
All Adults
Children
under 18 in
household
Look up locations or directions 67% 80%
Order takeout or delivery 52% 67%
Use rewards or special deals 50% 65%
Make a reservation 46% 56%
Look up nutrition information 42% 54%
Pay for your meal 24% 32%
Consumers who say
they would be likely to
use a smartphone or
tablet or restaurant-
related activities
Smartphone
Activities in Restaurant
All Adults
Children
under 18 in
household
Electronic payment system at
the table
47% 55%
Electronic ordering system at
the table
40% 52%
Menus on iPad/tablets 37% 48%
Self-service, touch-screen kiosk
for ordering
43% 54%
Consumers who say
they would be likely
to use the following
technology options
in restaurants
Using Restaurant Technology
7. Investing in the Technology
21%
24%
9%
27%
18%
13%
23%
16%
22%
21%
4%
Equipment
upgrades
Redesign of
exterior/interior
Technology
upgrades
Marketing Can't invest right
now
Other investment
area
2012
2014
Source: NRN Restaurant Operator Survey (December 2013)
In 2014, my business plans to put more money behind:
8. Operators Willing to Invest in Technologies
Sources: National Restaurant Association, 2014 Restaurant Industry Forecast
Family
Dining
Casual
Dining
Fine
Dining
Quick
Service
Fast
Casual
ALL RESTAURANTS
Online ordering 57% 63% 48% 77% 89%
Ordering via smartphone app 45% 49% 30% 73% 88%
Wi-fi for customers 85% 93% 87% 87% 77%
Mobile/wireless payment options 43% 58% 54% 75% 77%
Nutrition information online or via smartphone/tablet app 46% 57% 48% 80% 80%
FULL SERVICE RESTAURANTS
Electronic ordering at the table 28% 48% 30%
Electronic payment at the table 48% 65% 59%
Menu of iPad/tablet at the table 36% 54% 50%
Wine/beer/cocktail list on iPad/tablet at the table 31% 53% 56%
LIMITED-SERVICE RESTAURANTS
Self-service, touch-screen ordering terminals 47% 57%
Video menu boards 78% 68%
Restaurant operators who believe these
technology options will become popular
within their segments in the future
More Technology Options on the Horizon
9. At the Table
• Guest self-ordering
• Suggestive selling
• Interactive feedback from
guests to the restaurant
• Wireless networking
• Some touch-screen devices
that make up the entire
tabletop
2O2O
VISION
10. At the Counter (F.O.H.)
• Mobile point-of-sale
• Digital wallets
• Facial-recognition software
Immediate recognition of customers and their preferences
• Digital menu and marketing boards
2O2O
VISION
11. Technology vs. Adoption
• Technology is coming,
question is around adoption
• Which chains will convert
first?
• Will independents be able to
implement or afford?
Technology will certainly make operators’ jobs easier…
but it must also enhance the customer experience to drive value
12. REAL GROWTH (2014):
0.5%
PURCHASES (2013):
$10.0 billion
SALES (2013):
$18.2 billion
K-12 Schools
Sources: Technomic, Inc.; Food Management
What’s Trending?
• Final requirements from Healthy Hunger-Free Kids Act
being implemented
• July 1 requirement that a full cup of fruit is served at
breakfast comes into effect
• New regulations decreasing lunch program
participation
• 1.8 million kids lost from program in 3 years
• Supper programs replacing after-school snack
programs
• Unpaid meal charges remain an issue
• 2017 looms large because of sodium restrictions
13. Summary
• Big Stable Market
• Sluggish Growth Continues
• Labor, Healthcare, Food Costs Remain a Problem
• Market Share Theft Plus Operational Efficiency
• Big Winners Amongst the Flatness
• Technology Adoption Soaring
• Fast Casual Continues to Drive the Market
Investing in the Future
Operators who planned to make improvements this year were almost evenly split between investing in a redesign and putting money behind marketing efforts.
A slightly smaller group said they planned to invest in technology upgrades.
About one-fifth of respondents said they can’t divert any funds for improvements now.
Idea: start with what Operators are implementing
Problem: Will consumers adopt and use?
Arrows indicate increase for that statistic over previous year. Dash means equal to previous year.