2014 industry-report
•
0 likes•331 views

Training Industry, Trends, Share, contribution, change management, Market share, Report.

Recommended
Recommended
More Related Content
Similar to 2014 industry-report
Similar to 2014 industry-report (20)
More from Tahir Chaudhry
More from Tahir Chaudhry (20)
Recently uploaded
Recently uploaded (20)
2014 industry-report
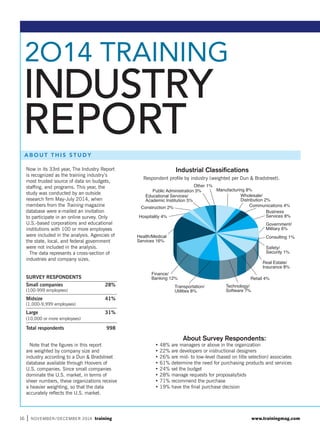
- 1. A B O U T T H I S S T U D Y 16 | NOVEMBER/DECEMBER 2014 training REPORT INDUSTRY 2O14 TRAINING Now in its 33rd year, The Industry Report is recognized as the training industry’s most trusted source of data on budgets, staffing, and programs. This year, the study was conducted by an outside research firm May-July 2014, when members from the Training magazine database were e-mailed an invitation to participate in an online survey. Only U.S.-based corporations and educational institutions with 100 or more employees were included in the analysis. Agencies of the state, local, and federal government were not included in the analysis. The data represents a cross-section of industries and company sizes. SURVEY RESPONDENTS Small companies 28% (100-999 employees) Midsize 41% (1,000-9,999 employees) Large 31% (10,000 or more employees) Total respondents 998 Note that the figures in this report are weighted by company size and industry according to a Dun Bradstreet database available through Hoovers of U.S. companies. Since small companies dominate the U.S. market, in terms of sheer numbers, these organizations receive a heavier weighting, so that the data accurately reflects the U.S. market. www.trainingmag.com About Survey Respondents: Industrial Classifications Respondent profile by industry (weighted per Dun Bradstreet). (GXFDWLRQDO 6HUYLFHV $FDGHPLF ,QVWLWXWLRQ 3XEOLF $GPLQLVWUDWLRQ 2WKHU 0DQXIDFWXULQJ :KROHVDOH 'LVWULEXWLRQ RPPXQLFDWLRQV %XVLQHVV 6HUYLFHV *RYHUQPHQW 0LOLWDU RQVXOWLQJ 6DIHW 6HFXULW 5HDO (VWDWH ,QVXUDQFH 5HWDLO 7HFKQRORJ 6RIWZDUH 7UDQVSRUWDWLRQ 8WLOLWLHV )LQDQFH %DQNLQJ +HDOWK0HGLFDO 6HUYLFHV +RVSLWDOLW RQVWUXFWLRQ
- 2. T R A I N I N G E X P E N D I T U R E S training NOVEMBER/DECEMBER 2014 | 17 Backed by an improving job market, a sharper focus on training to close skill gaps, and activity leading to more mid- size companies, total 2014 U.S. training expenditures—including payroll and spending on external products and services—jumped outside products and services rose The training budget figure was calculated by projecting the average training budget to a weighted universe of companies, using a Dun Bradstreet database available through Hoovers of U.S. organizations with more than 100 employees. It is interesting to note that although small companies have the smallest annual budgets, there are so many of them that they budget for training expenditures. Total training spending: All training-related expenditures for the year, including training budgets, technology spending, and staff salaries. Training staff payroll: The annual payroll for all staff personnel assigned to the training function. Outside products and services: Annual spending on external vendors and consultants, including all products, services, technologies, off-the- shelf and custom content, and consulting services. www.trainingmag.com 0 10 20 30 40 50 60 Training Expenditures 2009-2014 ,Q %LOOLRQV DEFINITIONS Average of Total Annual Budget Organization Type Large Midsize Small Average Avg. Across Sizes 7RWDO 7UDLQLQJ ([SHQGLWXUHV 7UDLQLQJ 6WDII 3DUROO 6SHQGLQJ RQ 2XWVLGH 3URGXFWV 6HUYLFHV
- 3. 2014 TRAINING INDUSTRY REPORT T R A I N I N G E X P E N D I T U R E S 18 | NOVEMBER/DECEMBER 2014 training www.trainingmag.com Average training expenditures for large companies decreased from the year before (up from 34 percent in 2013), while percent in 2013. Large nonprofits and service organizations had the largest personnel costs. Across all organization types, larger companies spent about 10 times as much as midsize, and midsize companies spent about three times as much as small ones. The average payroll figure for large For those who reported an increase in their training staff, the average increase was four people, five less than in 2013. For those who reported a decrease in their staff, the average average, organizations spent 11 percent of their budget education organizations spent the highest portion of their budgets on tools and technology (24 percent and 21 percent, respectively). Manufacturers across all sizes spent the greatest percentage of their budgets on training tools. 0 10 20 30 40 50 19% 6% 18% 37% 21% 23% 33% 20% 29% 27% 11% 8% 20% 15% 41% 23% 44% 17% 27% 18% 13% 7% 3% Assessment Analysis Testing Audience Response Systems Business Skills Enterprise Learning Systems Games Simulations Learning Management Systems Mobile Learning Online Learning Tools Systems Talent Management Tools Systems Training Management Administration Translation Localization Types of Training Products and Services Intended to Purchase Next Year
- 4. training NOVEMBER/DECEMBER 2014 | 19www.trainingmag.com 0 300 600 900 1,200 1,500 $976 $1,059 $881 $1,238 $1,092 $1,115 $829 $819 $1,104 $490 $903 $864 0 10 20 30 40 50 40.7 37.5 42.2 36.5 41.6 38.8 36.2 37.5 organizations spent the smallest percentage of their training budget on tools and technologies (1 percent and 4 percent, purchases are online learning tools and systems (44 percent year), classroom tools and systems (33 percent vs. 29 percent), and content development (29 percent vs. 30 percent last year). Manufacturers spent the most this year with an average organizations have lost their edge on cost savings as midsize per year, three hours more than last year. In general, small companies tended to have more hours of training this year at wholesale organizations having the largest number of hours expenditures to training non-exempt employees (40 percent, down from 42 percent in 2013). Training for exempt non- 2014. All Companies Small (100 to 999 employees) Midsize (1,000 to 9,999 employees) Large (10,000 or more employees) All Companies Small (100 to 999 employees) Midsize (1,000 to 9,999 employees) Large (10,000 or more employees) Training Expenditures per Learner 2012-2014 Hours of Training per Employee 2013-2014
- 5. 2014 TRAINING INDUSTRY REPORT T R A I N I N G E X P E N D I T U R E S 0 5 10 15 12.5 13.112.4 0 10 20 30 21.7 15.6 27.2 23.1 0 5 10 15 20 25 30 35 40 10% 24% 26% 40% 0 5 10 15 20 16.7 16.4 18.3 16.2 www.trainingmag.com20 | NOVEMBER/DECEMBER 2014 training www.trainingmag.com Staff per 1,000 Learners /DUJH RPSDQLHV Staff per 1,000 Learners 6PDOO RPSDQLHV Staff per 1,000 Learners 0LGVL]H RPSDQLHV Training Expenditure Allocations— Who Gets Trained? Is the Number of Training-Related Staff Higher or Lower Than Last Year? +LJKHU 6DPH /RZHU ([HFXWLYHV 0DQDJHUV ([HPSW 1RQ 0DQDJHUV ([HPSW 1RQ ([HPSW (PSORHHV 2YHUDOO IRU /DUJH RPSDQLHV WR WR RU PRUH 2YHUDOO IRU 6PDOO RPSDQLHV WR WR WR 2YHUDOO IRU 0LGVL]H RPSDQLHV WR WR 7KH DYHUDJH WUDLQLQJ EXGJHW IRU ODUJH FRPSDQLHV ZDV PLOOLRQ ZKLOH PLGVL]H FRPSDQLHV DOORFDWHG DQ DYHUDJH RI PLOOLRQ DQG VPDOO FRPSDQLHV GHGLFDWHG DQ DYHUDJH RI
- 6. T R A I N I N G B U D G E T www.trainingmag.com 0 20 40 60 80 100 9% 60% 31% 13% 42% 45% 13% 65% 22% 25% 42% 33% 28% 11% 61% 0% 0% 22% 100% 31% 47% www.trainingmag.com Budget status was almost evenly split, with 43 percent saying their training budget increased and 41 percent percent reported a decrease in budget. Last year, 41 percent said their budget military organizations showed the greatest tendency for training budget the largest gains. Increases were not evenly distributed across organization sizes. Large companies (23 percent) showed more decreases than midsize (14 percent) and small (13 percent) companies. Most of the budget increases were organizations reported increases in the who reported an increase in their training budgets attributed it to the following reasons: percent last year) vs. 49 percent and 40 percent, respectively last year) percent last year) Like last year, the majority (42 percent) of respondents reported budget Some 44 percent chose “other” as the reason for the decrease, citing “corporate mandate to cut expenses,” “LMS implemented,” “lowered priority by the organization,” and “Training department reorganized,” among others. This was followed by: Services Education Association Nonprofit Budget Change by Industry What Happened to Your Training Budget This Year? ,QFUHDVHG 5HPDLQHG WKH VDPH 'HFUHDVHG 'HFUHDVH ,QFUHDVH 6DPH training NOVEMBER/DECEMBER 2014 | 21
- 7. T R A I N I N G B U D G E T S 2014 TRAINING INDUSTRY REPORT 0 10 20 30 40 50 0 5 10 15 20 25 30 35 40 0 10 20 30 40 50 0 10 20 30 40 50 60 0 10 20 30 40 50 60 How Much Did Your Training Budget Increase? $OO RPSDQLHV 6PDOO RPSDQLHV 0LGVL]H RPSDQLHV /DUJH RPSDQLHV 0RUH 7KDQ WR WR WR 0RUH 7KDQ WR WR WR 0RUH 7KDQ WR WR WR 0RUH 7KDQ WR WR WR Why Did Your Budget Increase? www.trainingmag.com22 | NOVEMBER/DECEMBER 2014 training
- 8. www.trainingmag.com How Much Did Your Training Budget Decrease? $OO RPSDQLHV 6PDOO RPSDQLHV 0LGVL]H RPSDQLHV /DUJH RPSDQLHV Reduced Training Staff Decreased Number of Learners Served Decreased Scope of Training Attended Fewer Outside Learning Events (conferences/seminars) Decreased Outside Trainer/Consultant Investment Budget Adjusted to Reflect Lower Costs Other 0RUH 7KDQ WR WR WR 0RUH 7KDQ WR WR WR 0RUH 7KDQ WR WR WR 0RUH 7KDQ WR WR WR Why Did Your Budget Decrease? training NOVEMBER/DECEMBER 2014 | 23 0 10 20 30 40 50 0 10 20 30 40 0 10 20 30 40 0 10 20 30 40 0 10 20 30 40 50 60 22% 9% 42% 27% 31% 0% 56% 13% 10% 20% 35% 35% 26% 5% 37% 32% 40% 11% 22% 11% 18% 24% 44%
- 9. 0 20 40 60 80 100 11% 60% 4% 25% 26% 60% 6% 8% 20% 60% 7% 13% 15% 61% 7% 17% 10% 61% 10% 19% 20% 58% 6% 16% 16% 38 3% 43% 15% 72% 5% 8% 14% 63% 4% 19% 19% 63% 4% 14% 0 30 60 90 120 150 2014 TRAINING INDUSTRY REPORT T R A I N I N G B U D G E T S T R A I N I N G D E L I V E RY www.trainingmag.com Nearly 47 percent of training hours were delivered by a stand-and-deliver instructor in a classroom setting—up a bit from the 44 percent reported last year. year. they are using social learning to some extent. companies continue to rely on instructor-led delivery Blended learning was fairly even across companies of all appeared to be focusing on online or computer-based Executive Development Management/Supervisory Training Customer Service Training Sales Training Mandatory or Compliance Training Onboarding Projected Funding for Learning Areas Next Year 0RUH 7KDQ /DVW HDU $ERXW WKH 6DPH DV /DVW HDU /HVV 7KDQ /DVW HDU 1$ %OHQGHG /HDUQLQJ D FRPELQDWLRQ RI PHWKRGV OLVWHG EHORZ
- 10. ,QVWUXFWRU/HG ODVVURRP 2QO 9LUWXDO ODVVURRP:HEFDVW 2QO LQVWUXFWRU IURP UHPRWH ORFDWLRQ
- 11. 2QOLQH RU RPSXWHU%DVHG 0HWKRGV 2QO QR LQVWUXFWRU
- 12. 0RELOH 2QO FHOO SKRQHV L3RGV WDEOHWV 3'$V
- 13. 6RFLDO /HDUQLQJ 2QO Small Midsize Large Training Delivery Methods by Company Size 2014 24 | NOVEMBER/DECEMBER 2014 training
- 14. T R A I N I N G D E L I V E RY 1HDUO SHUFHQW RI WUDLQLQJ KRXUV ZHUH GHOLYHUHG E D VWDQGDQGGHOLYHU LQVWUXFWRU LQ VOLJKWO IURP WKH SHUFHQW UHSRUWHG ODVW HDU 6RPH SHUFHQW RI FRPSDQLHV VDLG WKH DUH XVLQJ VRFLDO OHDUQLQJ WR VRPH H[WHQW www.trainingmag.com 0 20 40 60 80 100 methods (35.9 percent vs. an average of 26.5 percent for small and midsize companies). Mandatory or compliance training continued to be done mostly online, with 72 percent of organizations doing at least some of it online and 20 percent entirely online (down from 21 percent last year). Online training also often is used for desktop application training (56 percent, the same as last year) and IT/systems application training (54 percent, down from 58 percent last year). Online training was least used for executive development (40 percent had no online training for it), onboarding (35 percent had no online training for it), and interpersonal skills and customer service (31 percent had no online training for either one). Of the learning technologies presented, the most often used included: learning management systems (LMSs), both with 74 percent. Last year, virtual held the lead at 78 percent, followed by LMSs with 74 percent. last year) percent) The delivery methods least often used for training remained the same as last year: percent (down from 26 percent) management system at 21 percent (down from 25 percent) Management/Supervisory Training Interpersonal Skills (e.g., communication) IT/Systems Training (e.g., enterprise software) Sales Training Onboarding Online Method Use for Types of Training 1R 2QOLQH $ )HZ 2QOLQH 3URJUDPV 6RPH 2QOLQH 0RVWO 2QOLQH $OO 2QOLQH training NOVEMBER/DECEMBER 2014 | 25
- 15. 2014 TRAINING INDUSTRY REPORT T R A I N I N G D E L I V E RY www.trainingmag.com 0 20 40 60 80 100 0 20 40 60 80 100 0 20 40 60 80 100 0 20 40 60 80 100 Learning Technologies Current Usage $OO RPSDQLHV 6PDOO RPSDQLHV 0LGVL]H RPSDQLHV /DUJH RPSDQLHV Podcasting Online Performance Support or Knowledge Management System Rapid E-Learning Tool (PowerPoint conversion tool) Application Simulation Tool Virtual Classroom/Webcasting/Video Broadcasting Learning Content Management System (LCMS) Learning Management System (LMS) Mobile Applications Podcasting Online Performance Support or Knowledge Management System Rapid E-Learning Tool (PowerPoint conversion tool) Application Simulation Tool Virtual Classroom/Webcasting/Video Broadcasting Learning Content Management System (LCMS) Learning Management System (LMS) Mobile Applications Podcasting Online Performance Support or Knowledge Management System Rapid E-Learning Tool (PowerPoint conversion tool) Application Simulation Tool Virtual Classroom/Webcasting/Video Broadcasting Learning Content Management System (LCMS) Learning Management System (LMS) Mobile Applications Podcasting Online Performance Support or Knowledge Management System Rapid E-Learning Tool (PowerPoint conversion tool) Application Simulation Tool Virtual Classroom/Webcasting/Video Broadcasting Learning Content Management System (LCMS) Learning Management System (LMS) Mobile Applications 8VH FXUUHQWO 'R QRW XVH 1RW VXUH 8VH FXUUHQWO 'R QRW XVH 1RW VXUH 8VH FXUUHQWO 'R QRW XVH 1RW VXUH 8VH FXUUHQWO 'R QRW XVH 1RW VXUH 26 | NOVEMBER/DECEMBER 2014 training
- 16. T R A I N I N G O U T S O U R C I N G www.trainingmag.com 0 20 40 60 80 100 2014 saw a sizeable increase in the average expenditure was spent on outsourcing in 2014, the same as in 2013. On average, 29 percent of companies completely year). Learner support, however, was mostly handled in- was handled in-house, as well. house and outsourced. Across all the topic areas, large companies outsourced more than midsize ones, and midsize organizations outsourced more than small companies. This organizations. The level of outsourcing is expected to stay relatively steady to stay the same in the outsourcing area. The percentage of companies expecting to decrease use (11 percent) is slightly higher than those expecting to use outsourcing more though. In learner support, twice as many companies said they will be doing less than those that said they will be doing more. There aren’t many differences between the outsourcing changes by company size. One thing that stands out: Large companies will outsource less custom content development. VDZ D VL]HDEOH LQFUHDVH LQ WKH DYHUDJH H[SHQGLWXUH IRU WUDLQLQJ RXWVRXUFLQJ XS IURP LQ $Q DYHUDJH RI SHUFHQW RI WKH WRWDO WUDLQLQJ EXGJHW ZDV VSHQW RQ RXWVRXUFLQJ 7KH OHYHO RI RXWVRXUFLQJ LV H[SHFWHG WR VWD UHODWLYHO VWHDG LQ Extent of Outsourcing $OO RPSDQLHV LMS Administration (registration, upload data) Learner Support 1R 2XWVRXUFLQJ 6RPH 2XWVRXUFLQJ 0RVWO RU RPSOHWHO 2XWVRXUFHG training NOVEMBER/DECEMBER 2014 | 27
- 17. 2014 TRAINING INDUSTRY REPORT T R A I N I N G O U T S O U R C I N G www.trainingmag.com 0 20 40 60 80 100 0 20 40 60 80 100 0 20 40 60 80 100 ,Q IRU OHDUQHU VXSSRUW WZLFH DV PDQ FRPSDQLHV VD WKH ZLOO EH GRLQJ OHVV WKDQ WKRVH WKDW VD WKH ZLOO EH GRLQJ PRUH /DUJH FRPSDQLHV ZLOO RXWVRXUFH OHVV FXVWRP FRQWHQW GHYHORSPHQW Extent of Outsourcing 6PDOO RPSDQLHV 0LGVL]H RPSDQLHV /DUJH RPSDQLHV Instruction/Facilitation LMS Administration (registration, upload data) LMS Operations/Hosting Learner Support Custom Content Development Instruction/Facilitation LMS Administration (registration, upload data) LMS Operations/Hosting Learner Support Custom Content Development Instruction/Facilitation LMS Administration (registration, upload data) LMS Operations/Hosting Learner Support Custom Content Development 1R 2XWVRXUFLQJ 6RPH 2XWVRXUFLQJ 0RVWO RU RPSOHWHO 2XWVRXUFHG 1R 2XWVRXUFLQJ 6RPH 2XWVRXUFLQJ 0RVWO RU RPSOHWHO 2XWVRXUFHG 1R 2XWVRXUFLQJ 6RPH 2XWVRXUFLQJ 0RVWO RU RPSOHWHO 2XWVRXUFHG 28 | NOVEMBER/DECEMBER 2014 training
- 18. www.trainingmag.com 0 20 40 60 80 100 0 20 40 60 80 100 0 20 40 60 80 100 0 20 40 60 80 100 Projected Use of Outsourcing $OO RPSDQLHV 6PDOO RPSDQLHV 0LGVL]H RPSDQLHV /DUJH RPSDQLHV LMS Administration (registration, upload data) Learner Support LMS Administration (registration, upload data) Learner Support LMS Administration (registration, upload data) Learner Support LMS Administration (registration, upload data) Learner Support 0RUH 2XWVRXUFLQJ 7KH 6DPH /HVV 2XWVRXUFLQJ 0RUH 2XWVRXUFLQJ 7KH 6DPH /HVV 2XWVRXUFLQJ 0RUH 2XWVRXUFLQJ 7KH 6DPH /HVV 2XWVRXUFLQJ 0RUH 2XWVRXUFLQJ 7KH 6DPH /HVV 2XWVRXUFLQJ training NOVEMBER/DECEMBER 2014 | 29