Download as PDF, PPTX


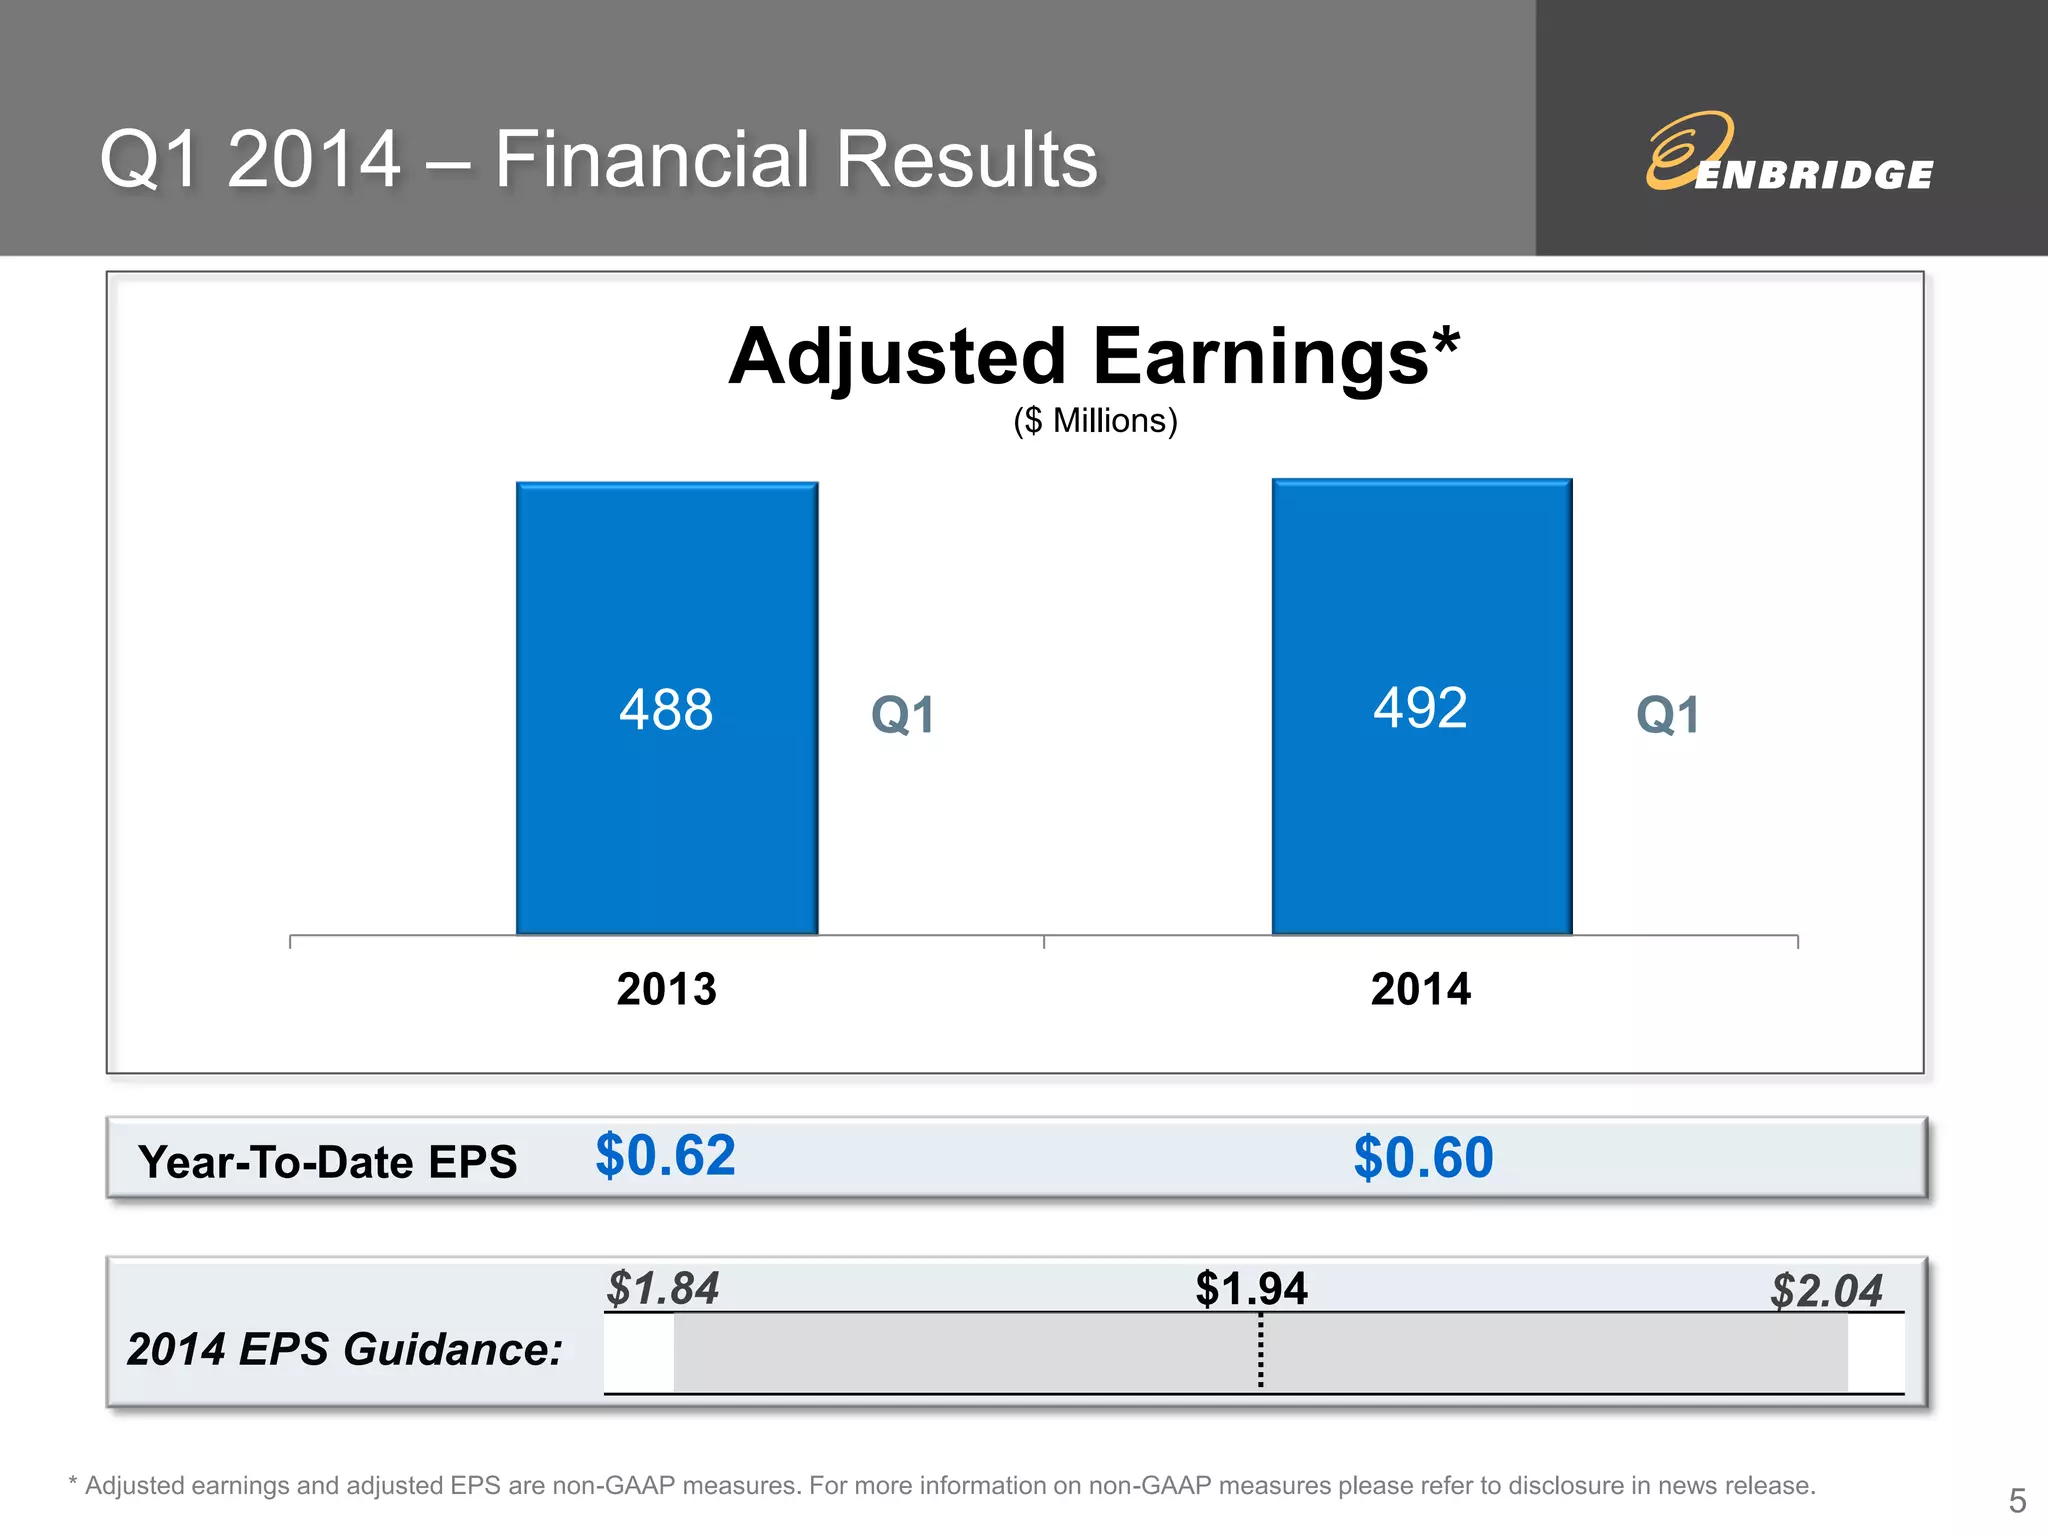
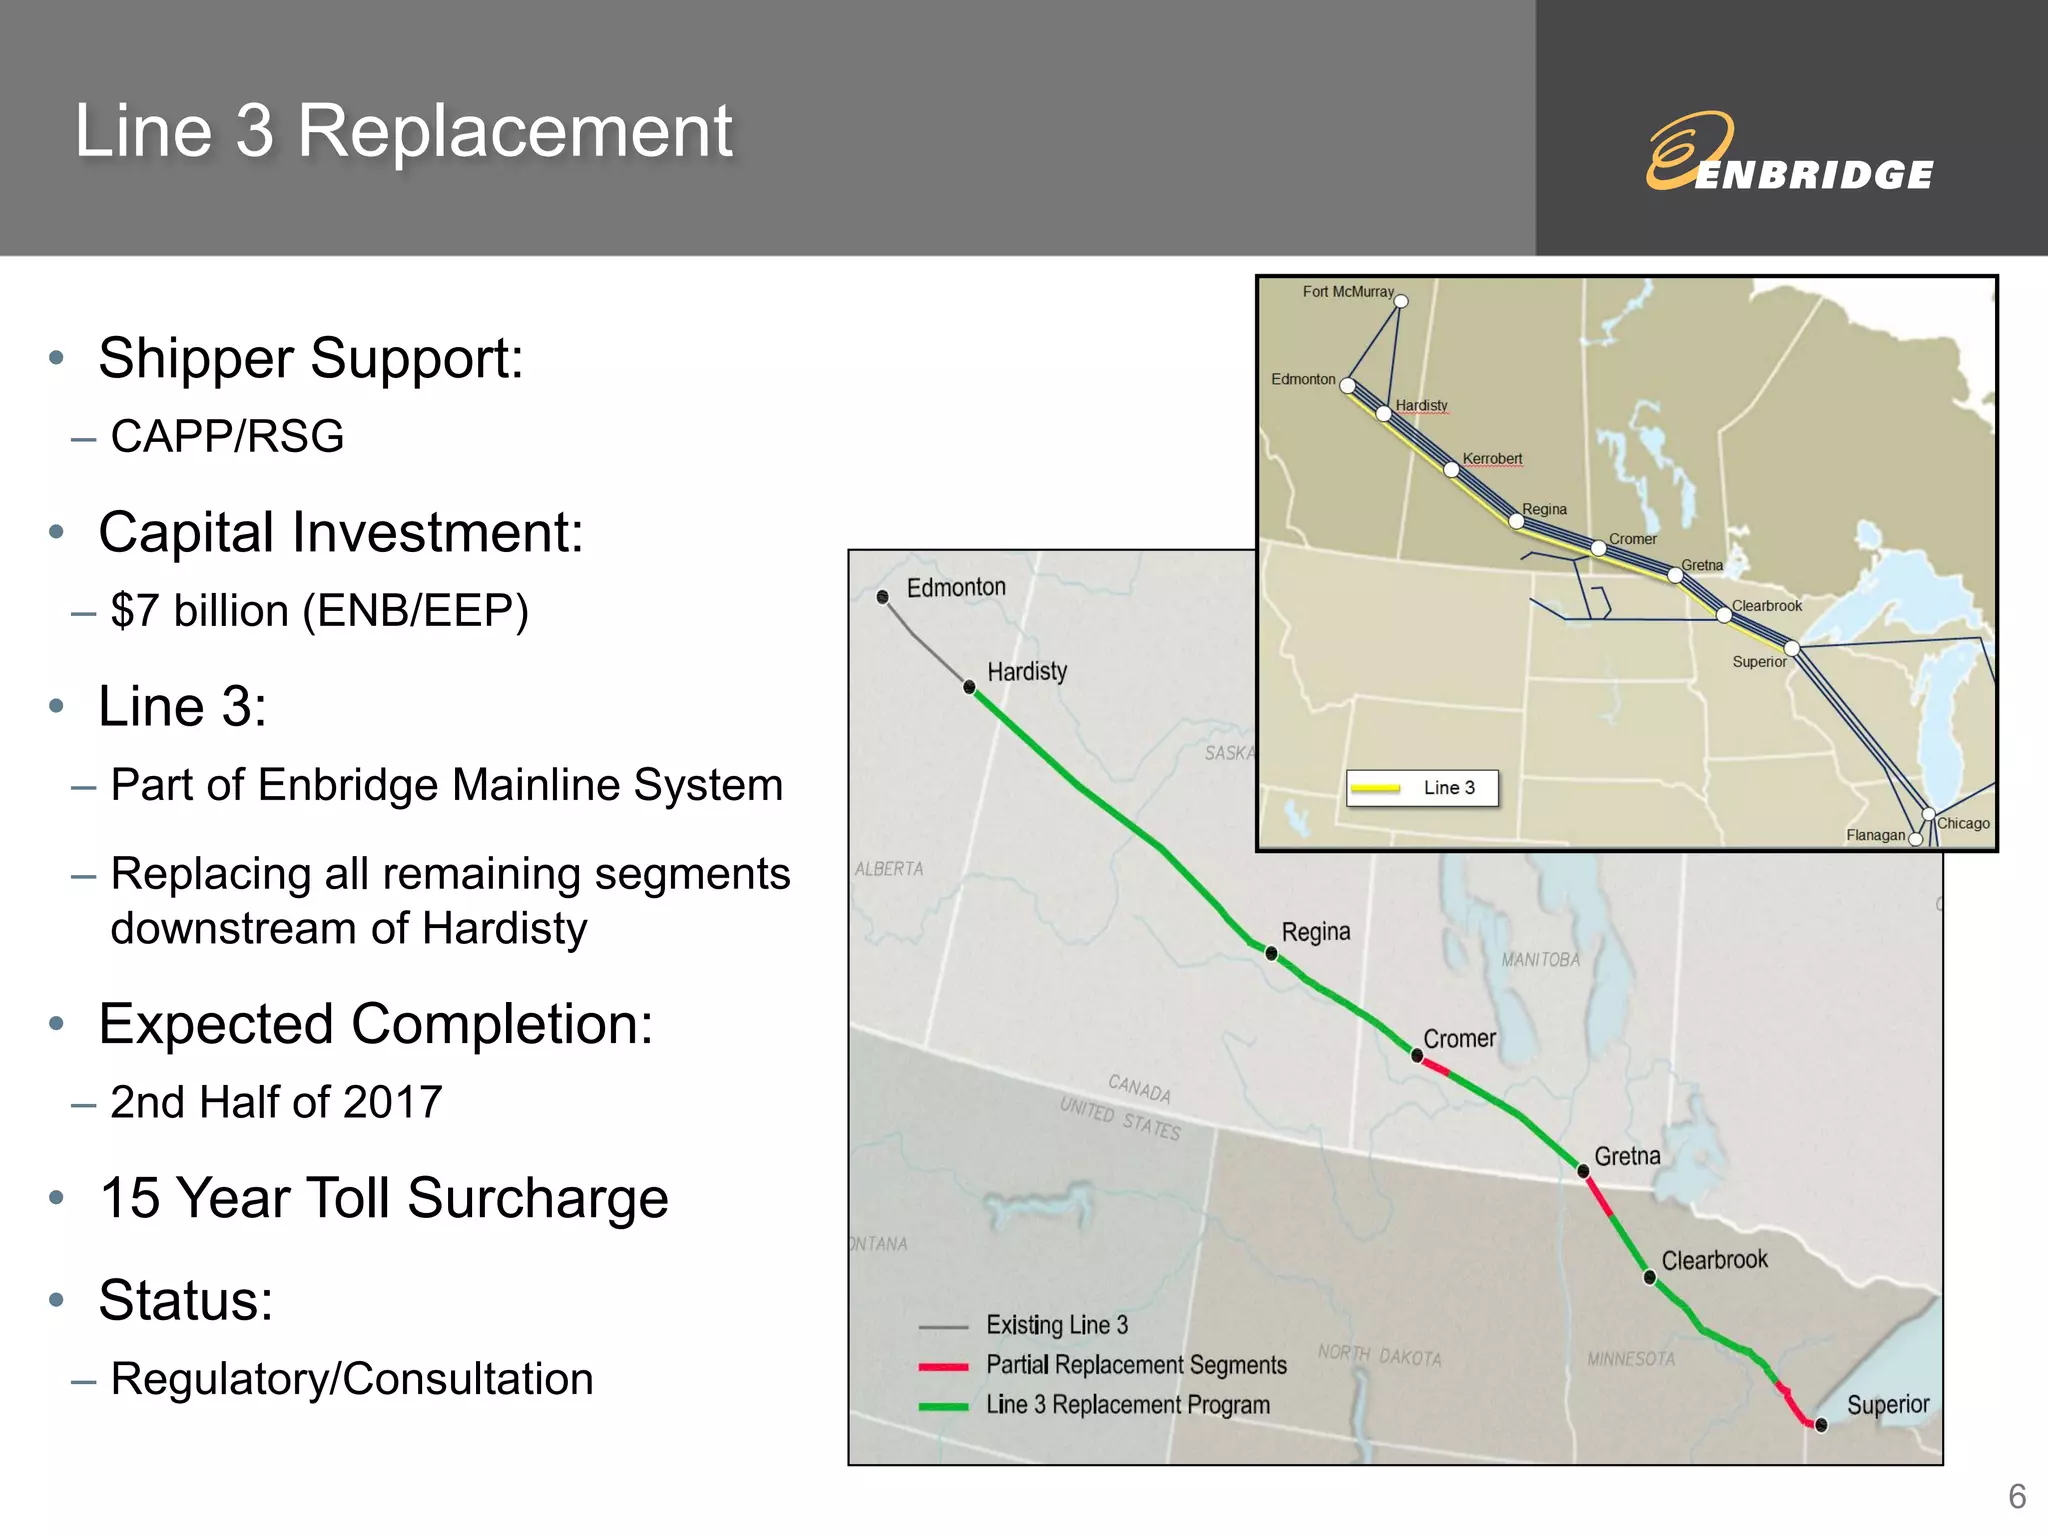
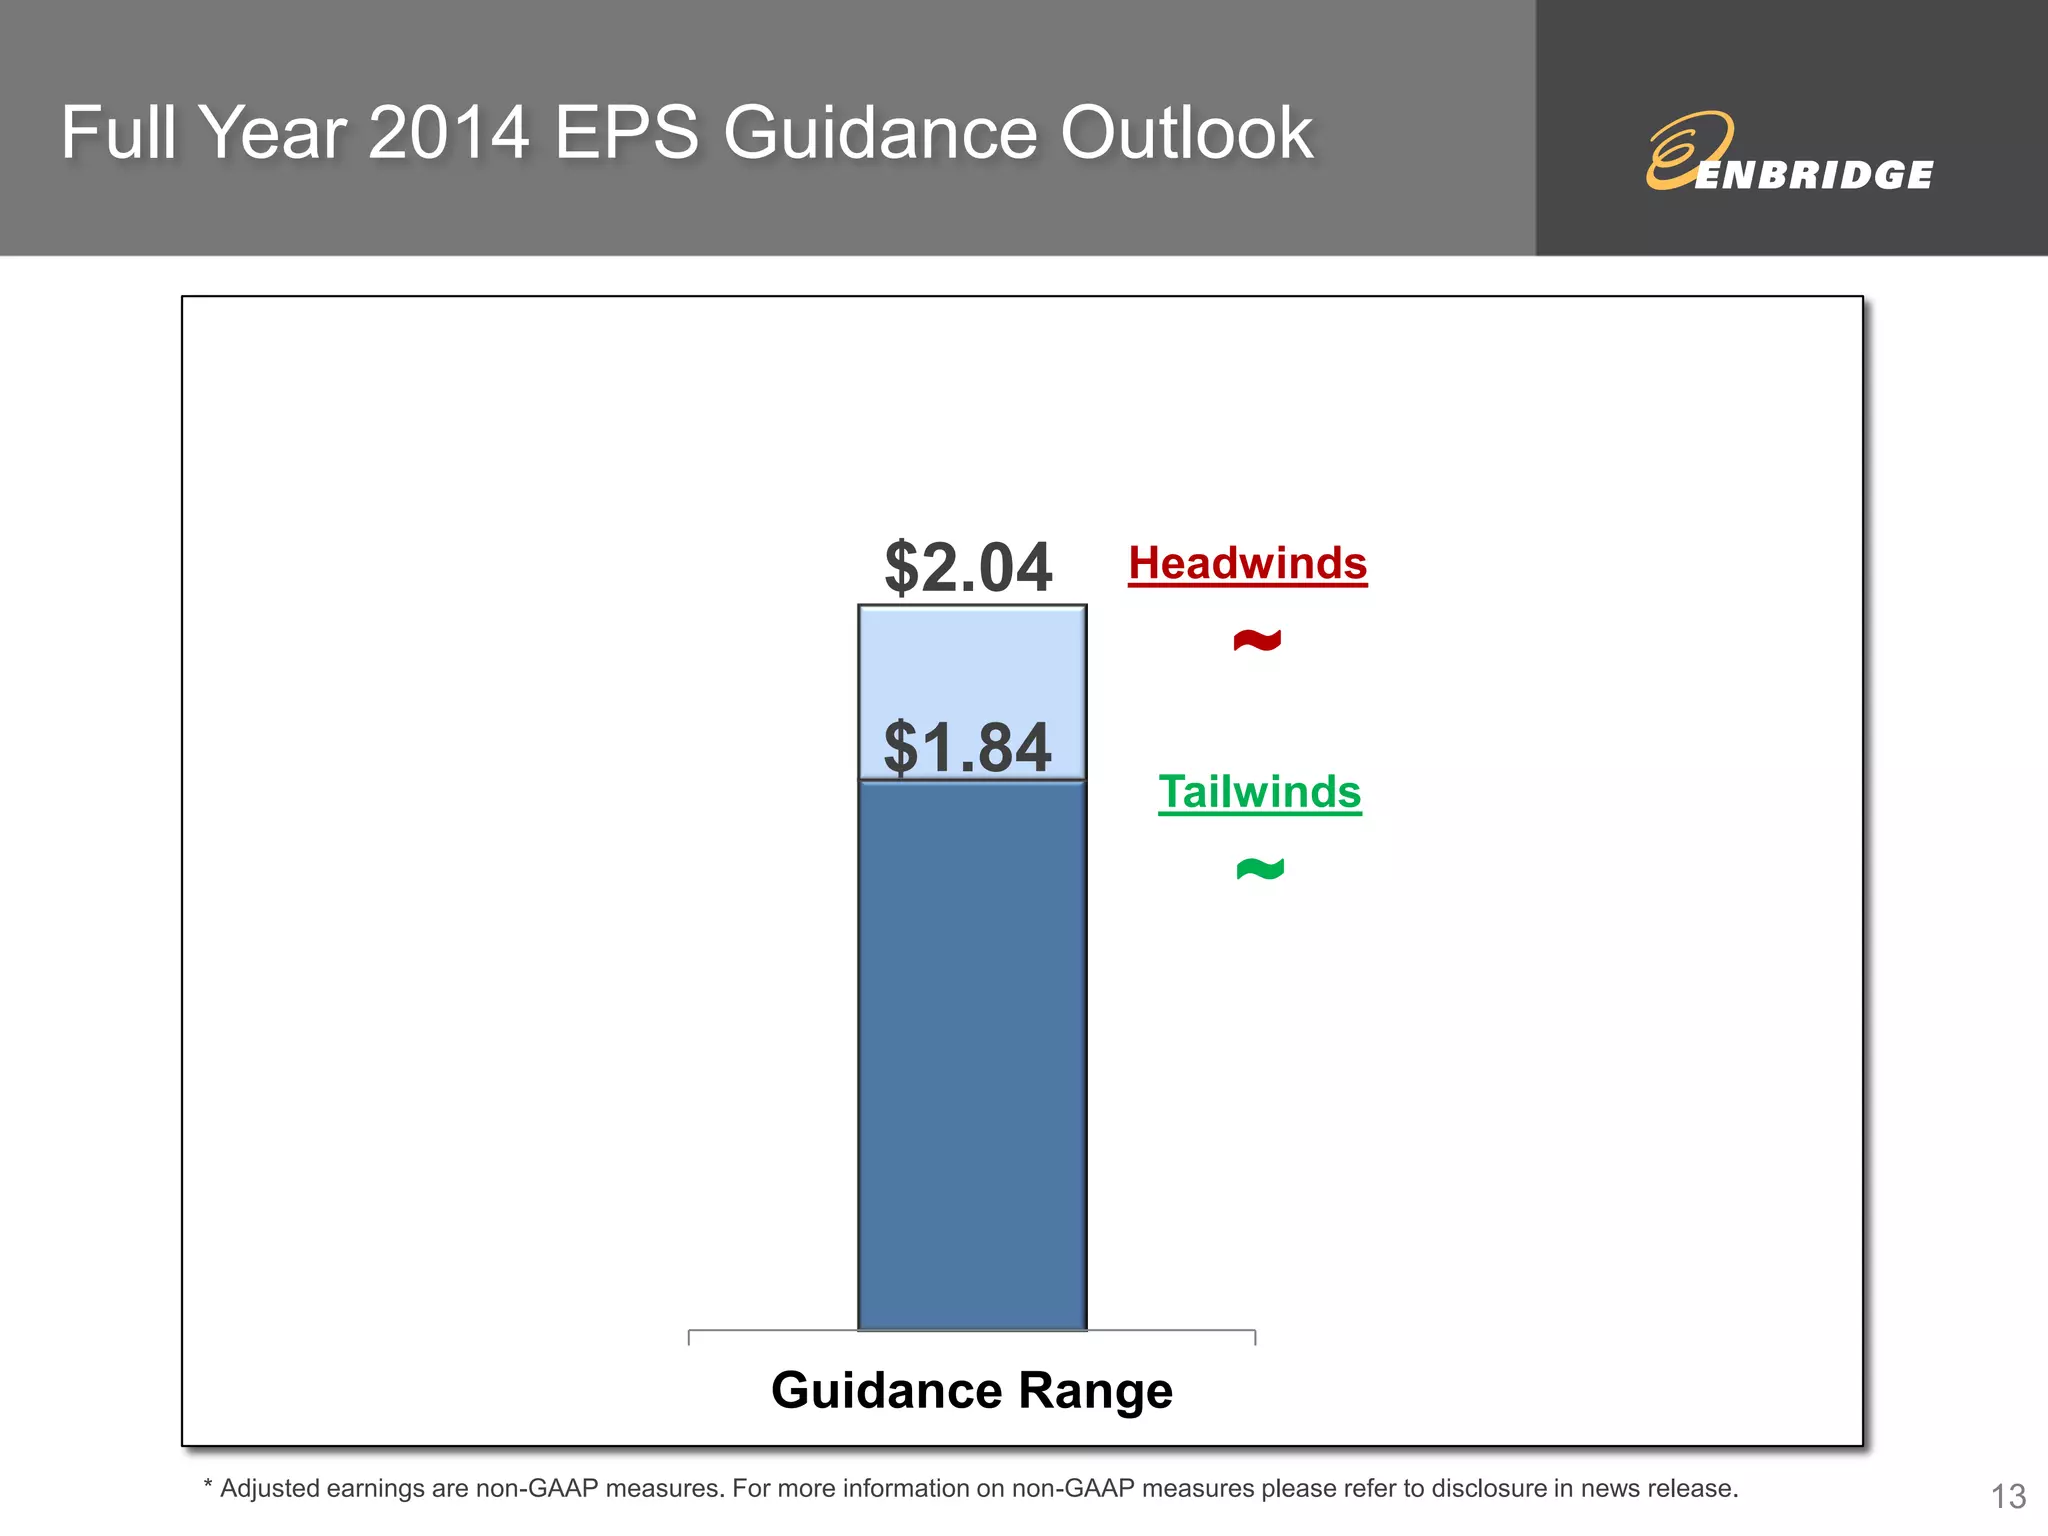
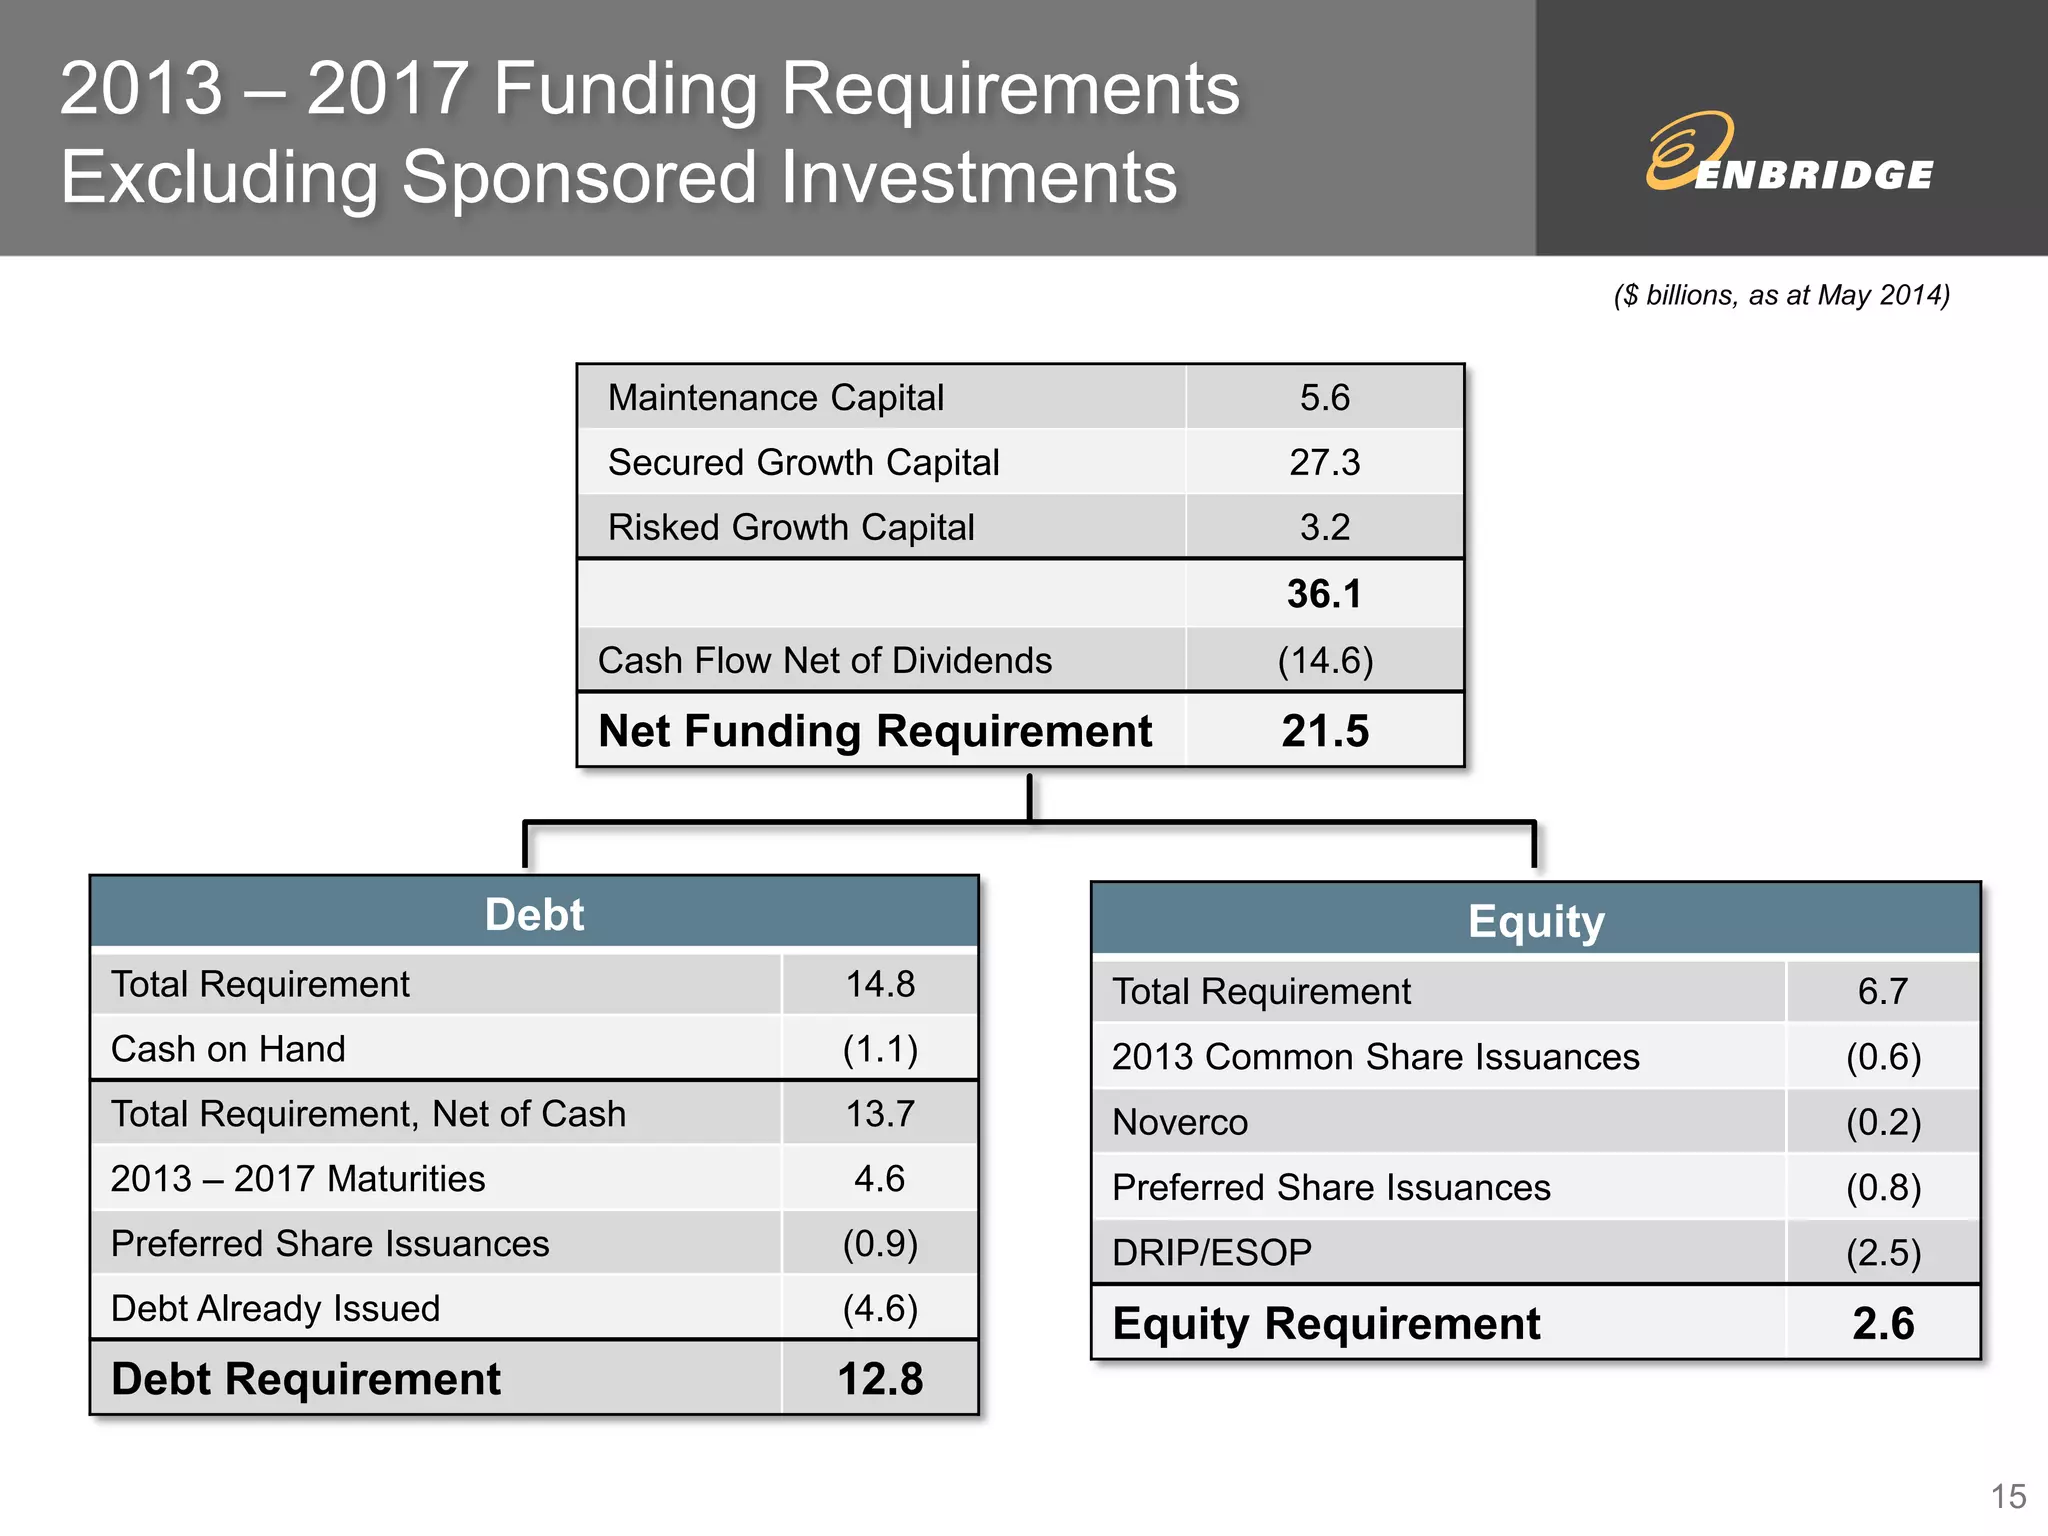
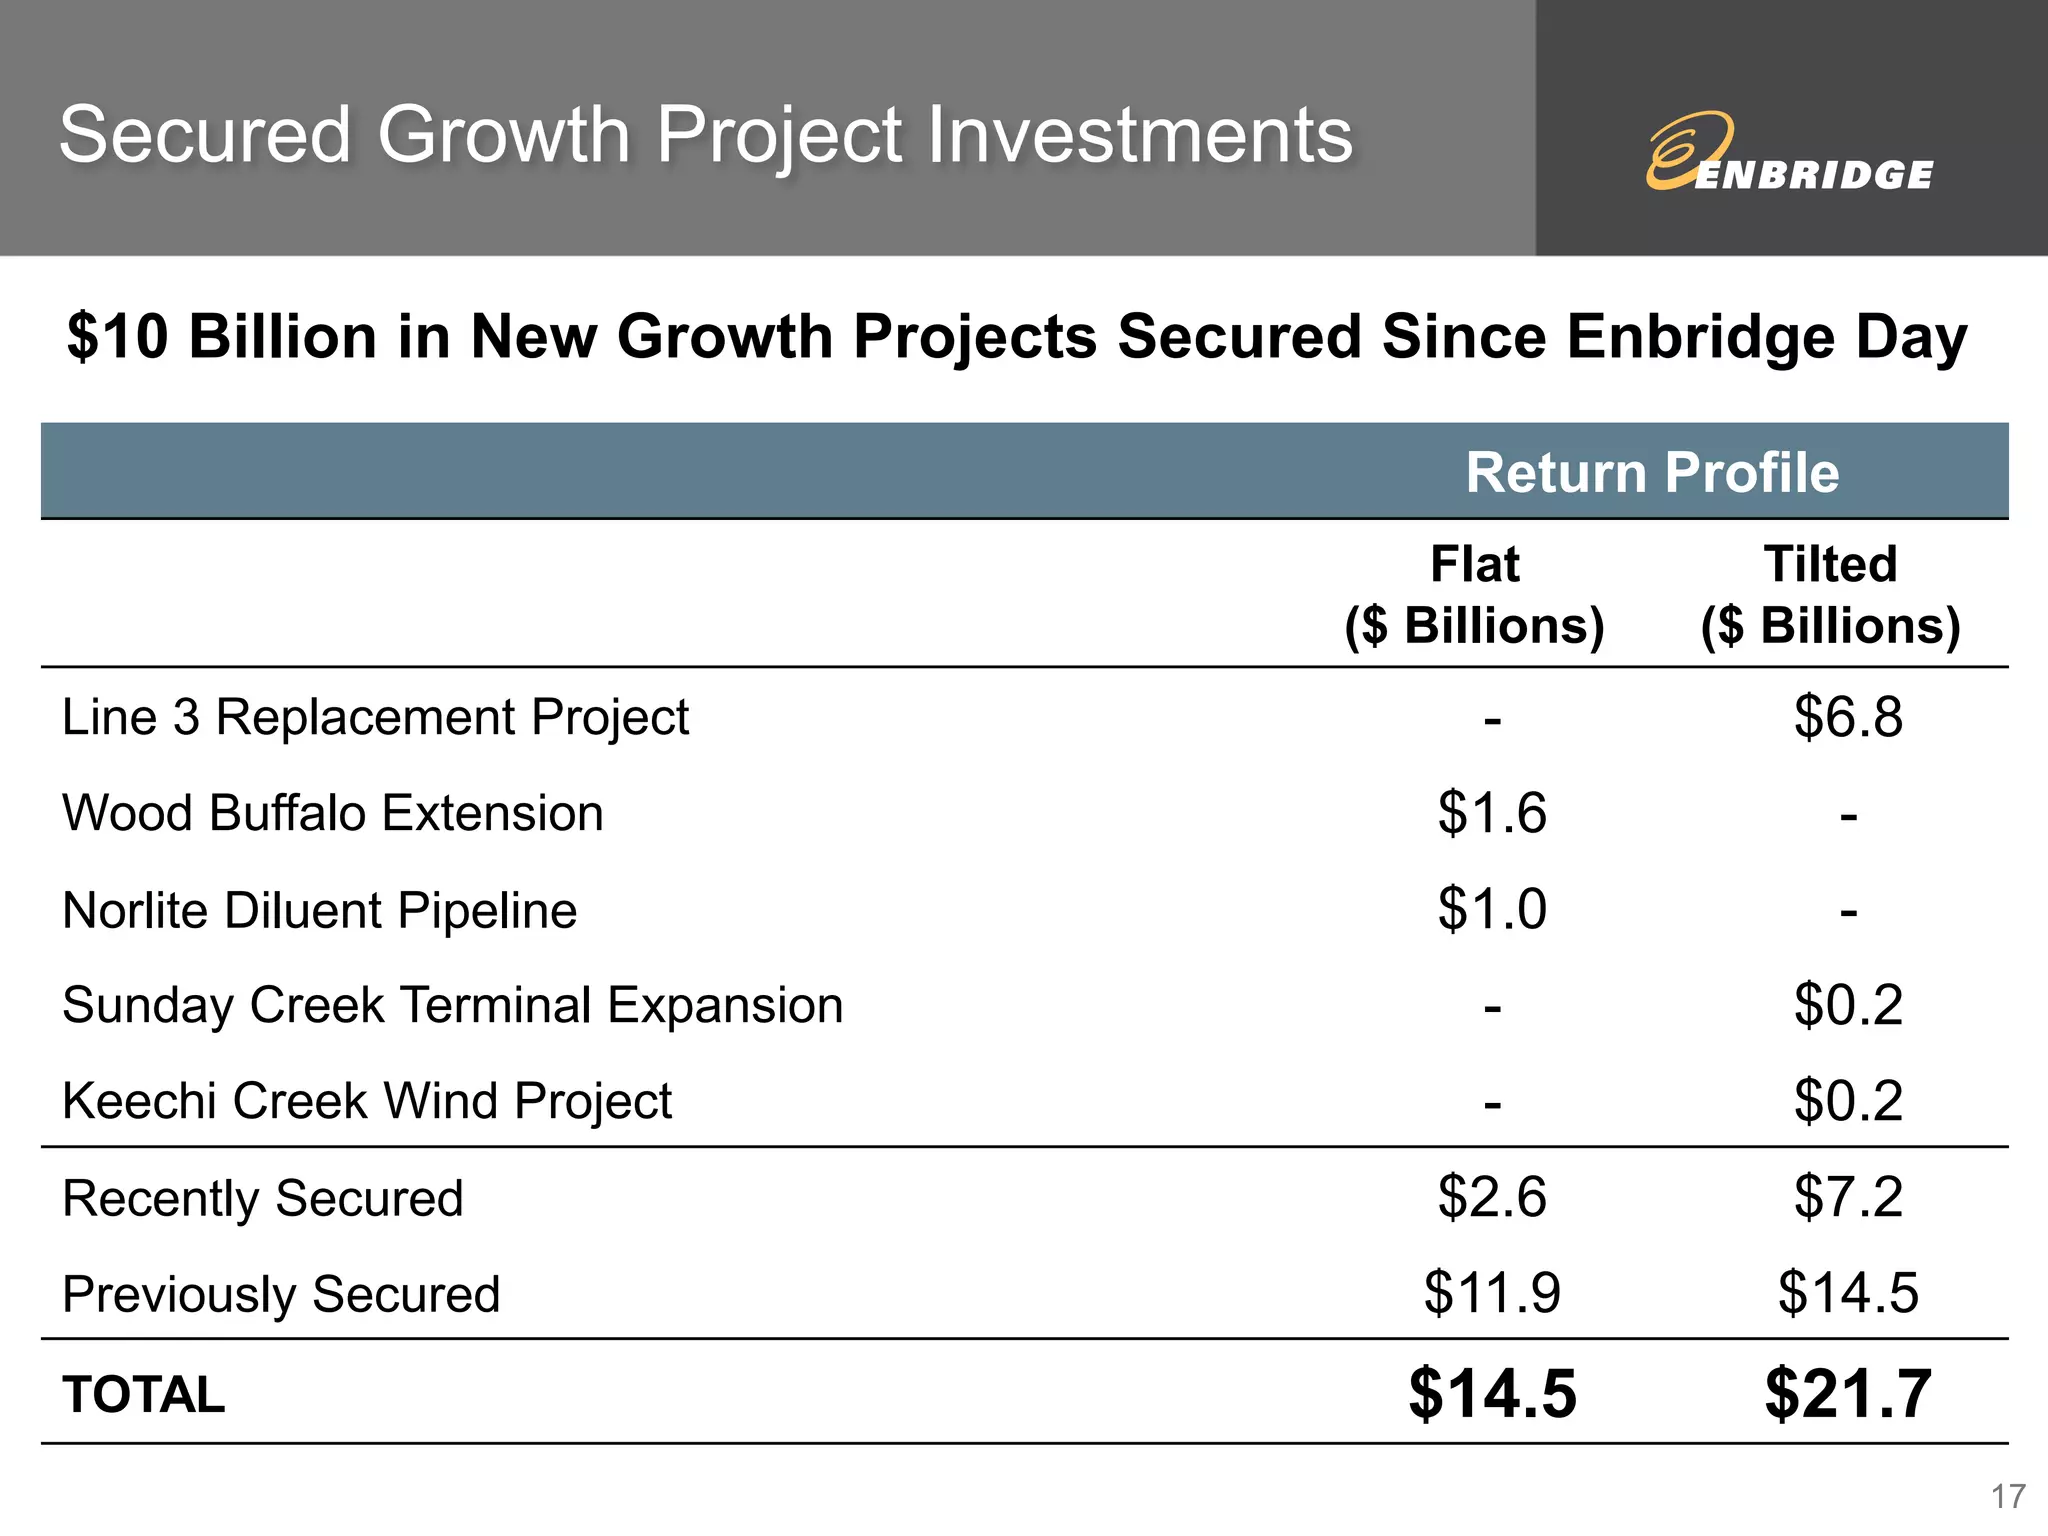
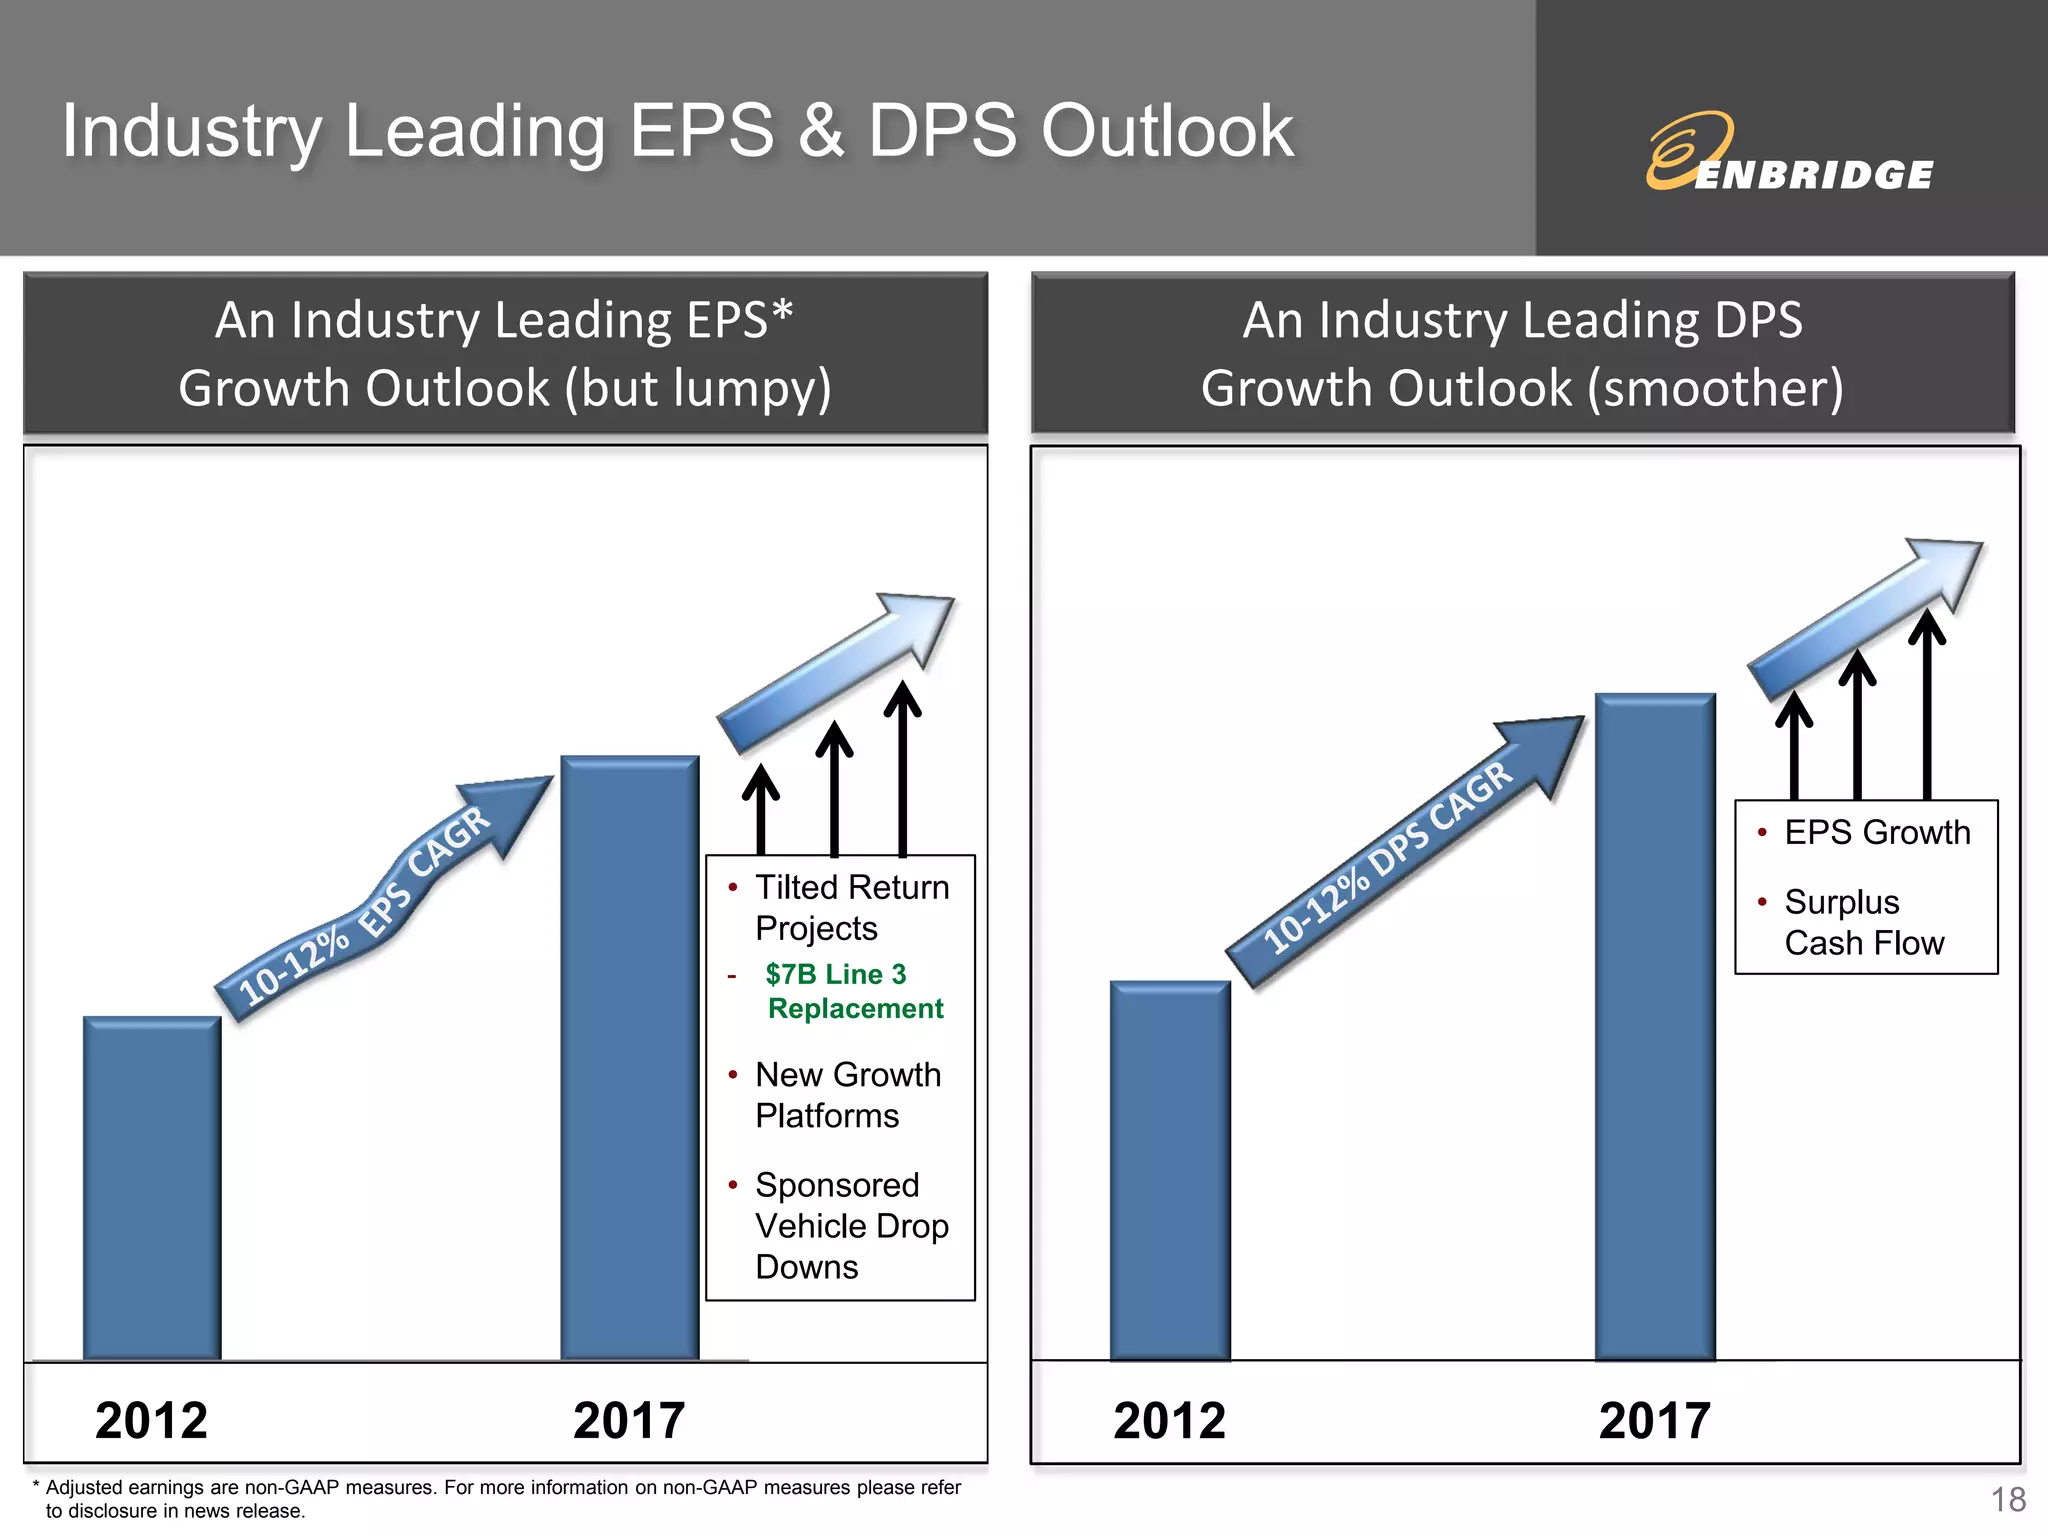
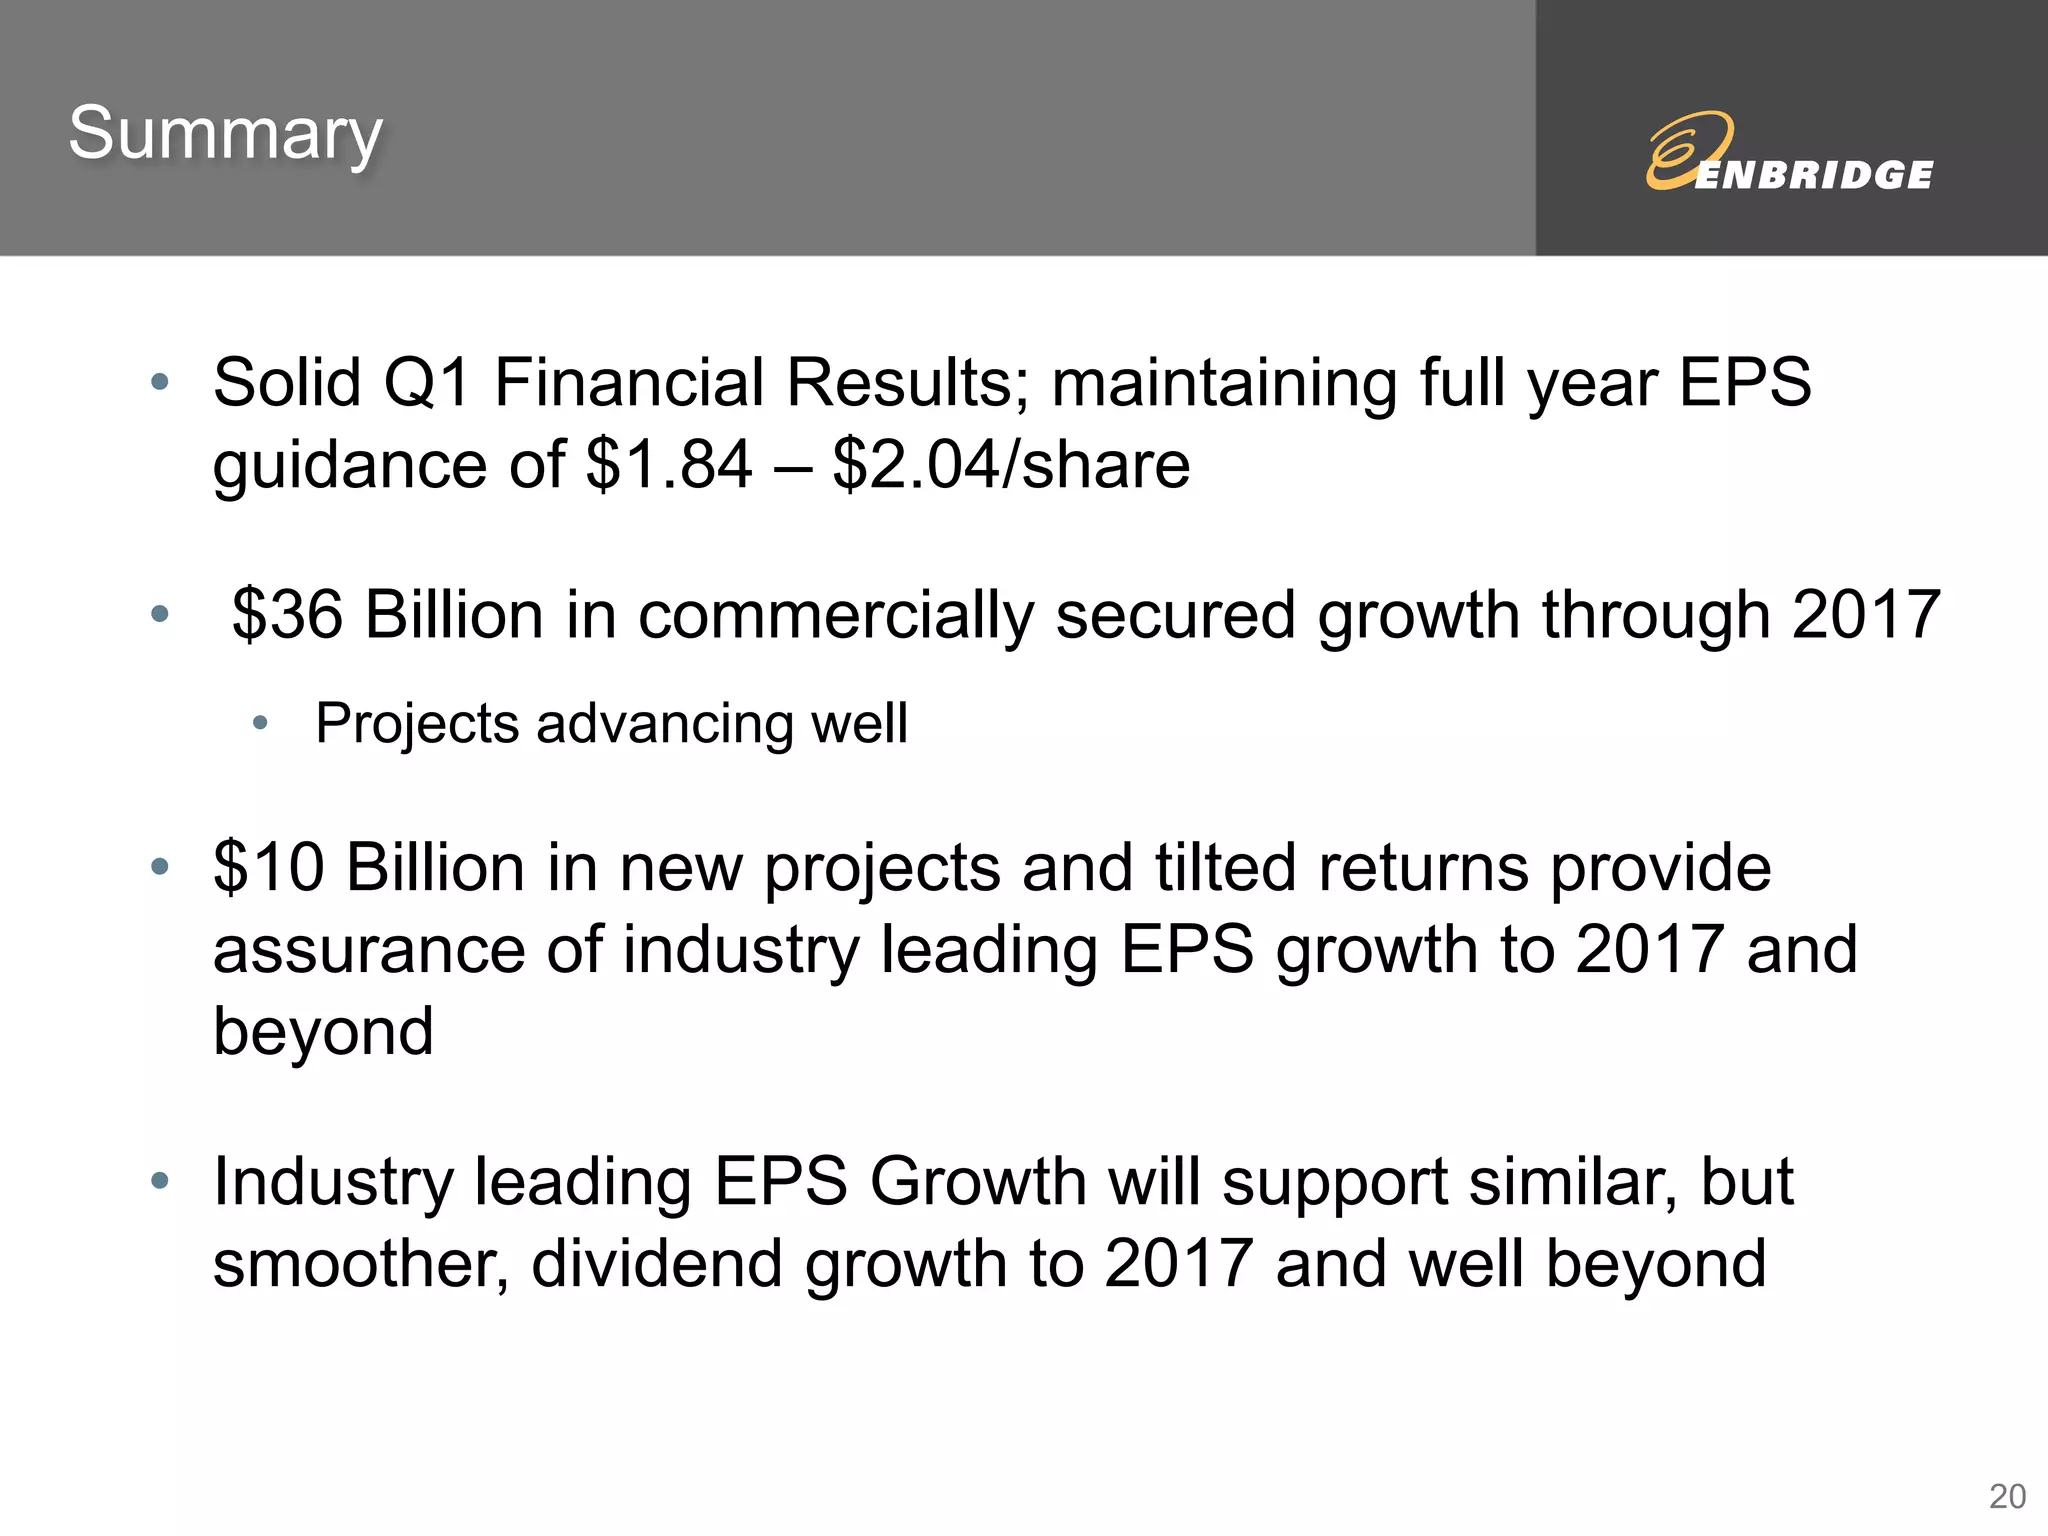


The document is a financial and strategic update for Enbridge for the first quarter of 2014, presented by CEO Al Monaco and CFO J. Richard Bird. It highlights a strong financial performance and the maintenance of earnings per share guidance of $1.84 - $2.04, alongside significant secured growth capital of $36 billion up to 2017. Key projects, including the Line 3 replacement, are progressing well, reflecting the company's commitment to safety, operational reliability, and future growth.


