Download as PDF, PPTX


![14
0%
10%
20%
30%
40%
50%
60%
70%
80%
Region selection
Site selection
Cost benchmarking/management
Provider selection
Project management/oversight
Protocol procedures/eligibility criteria
Data collection tools
Overall protocol designs
Patient/volunteer recruitment
Monitoring
Sponsors
Providers
Q Sponsors: Approximately what percentage of clinical trials [conducted in-house] have employed “intelligent” (data-driven) approaches to each of the below activities? Q Providers: For approximately what percentage of clinical trials has your company employed “intelligent” (data- driven) approaches to each of the below activities?
Most respondents from both Sponsor and Provider companies reported using “intelligent” approaches to region selection and site selection for a majority of trials they conduct. Usage of these approaches for other clinical trial activities varied.
Utilization of “Intelligent” Approaches by Clinical Trial Activity
% reporting that a majority of trials conducted by their organization employ “intelligent” approaches
Use of “Intelligent” Approaches
Sponsor N (range) = 60-87
Provider N (range) = 49-62](https://image.slidesharecdn.com/2014avocaindustryreportexecutivesummary2-141006102527-conversion-gate01/75/2014-Avoca-Industry-Report-Executive-Summary-14-2048.jpg)
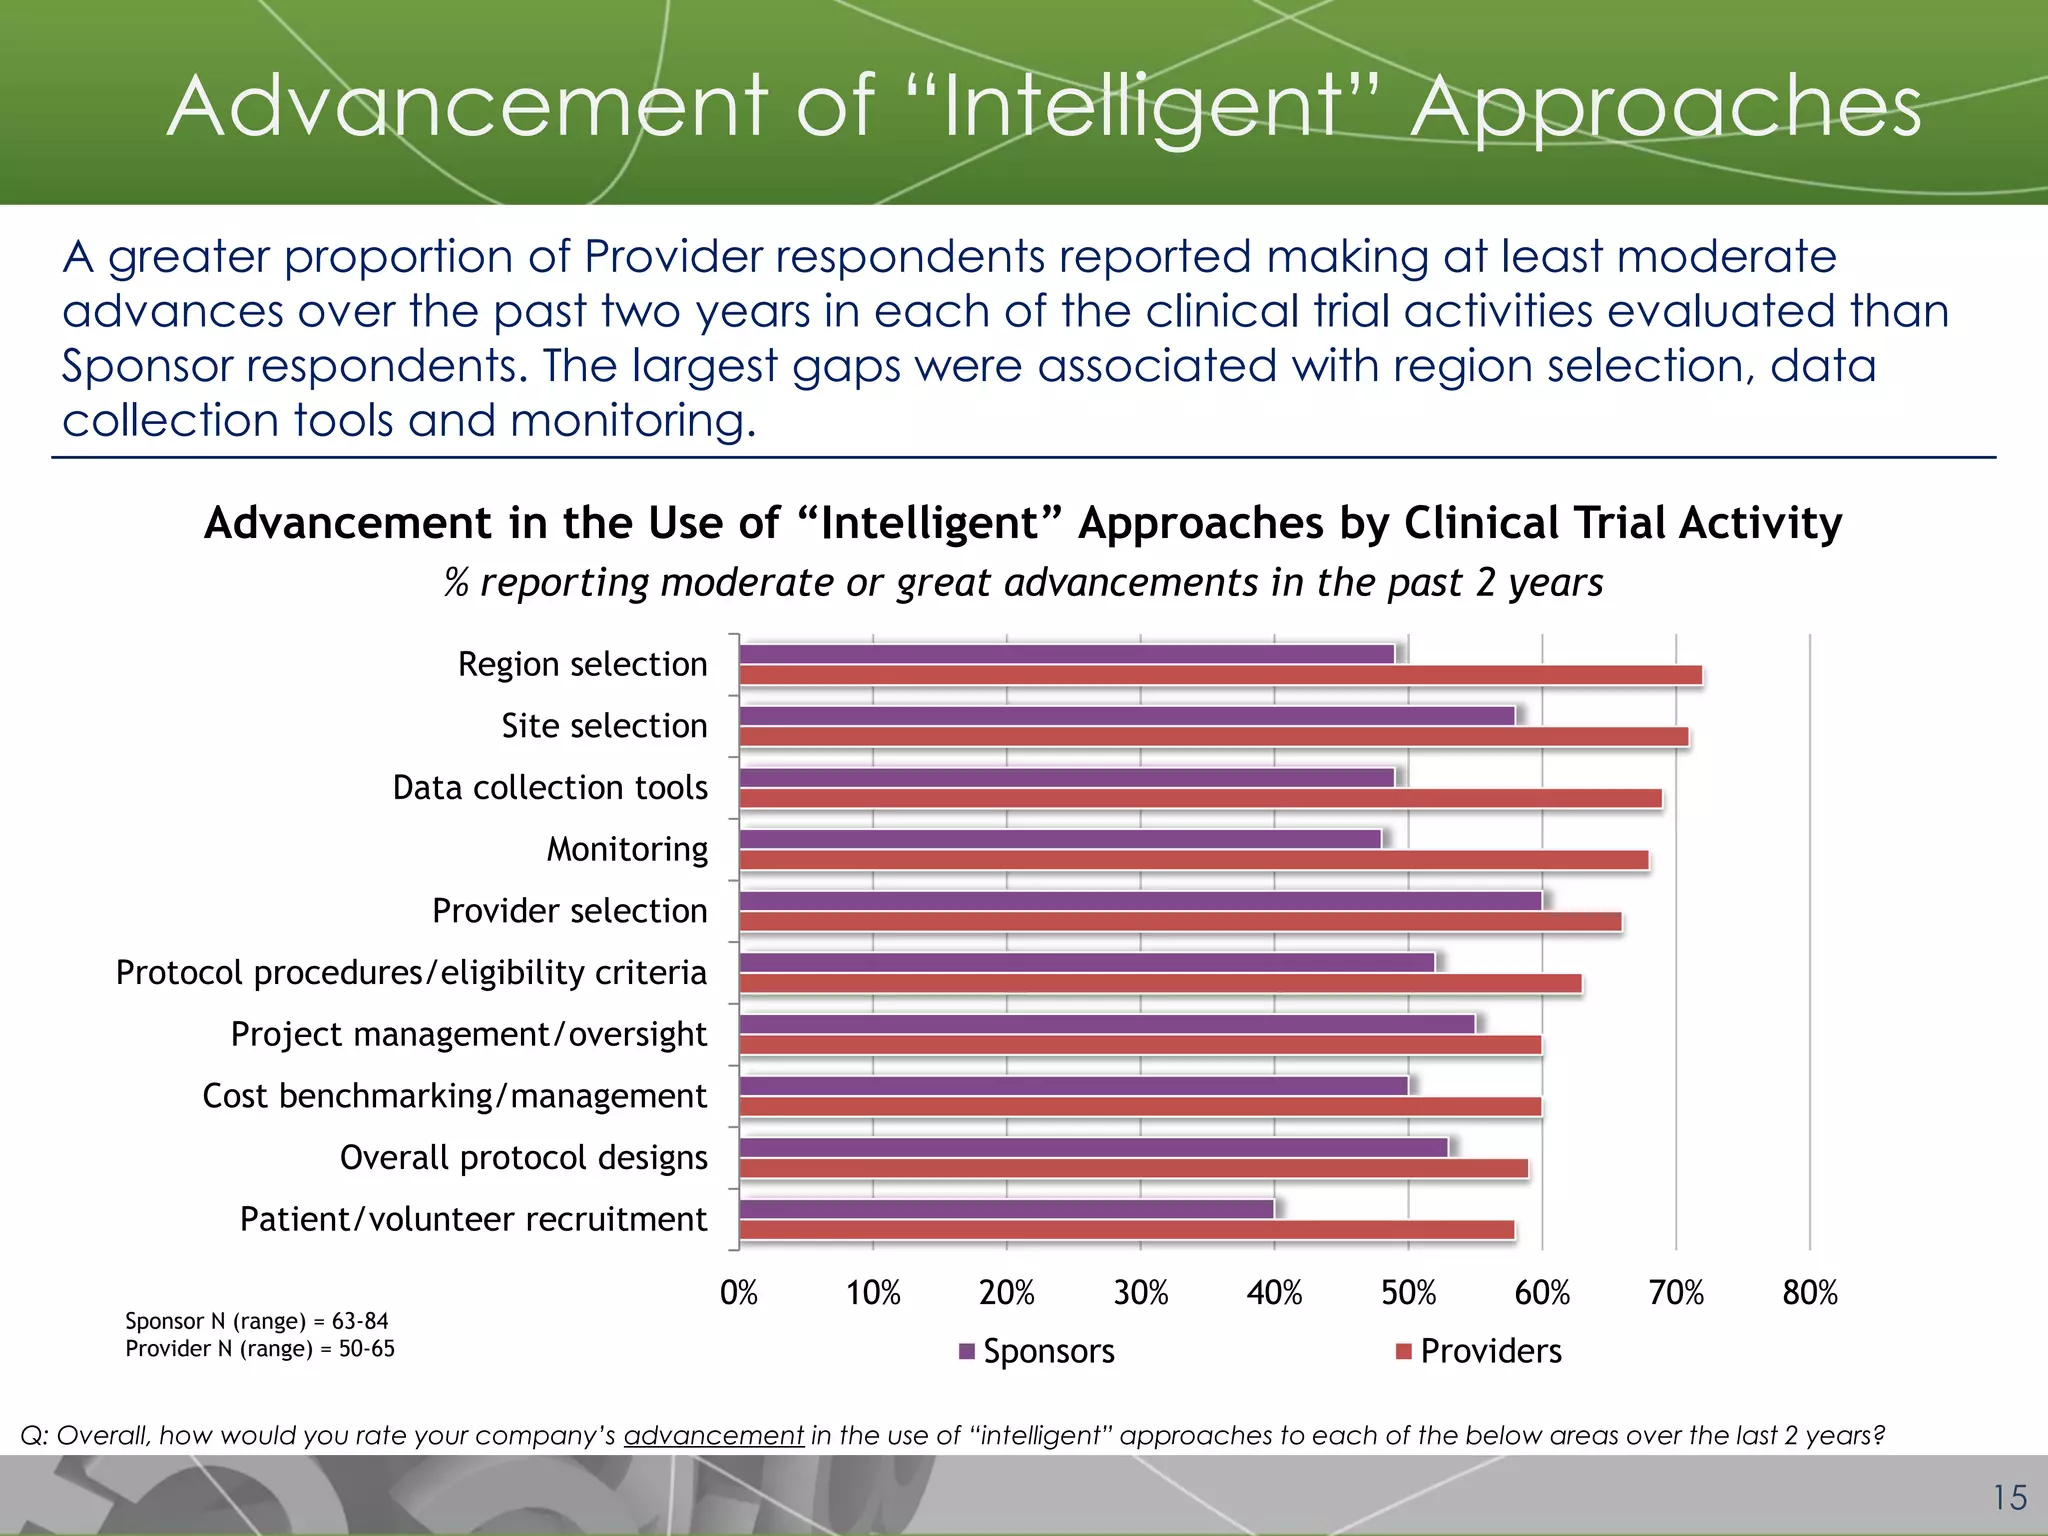
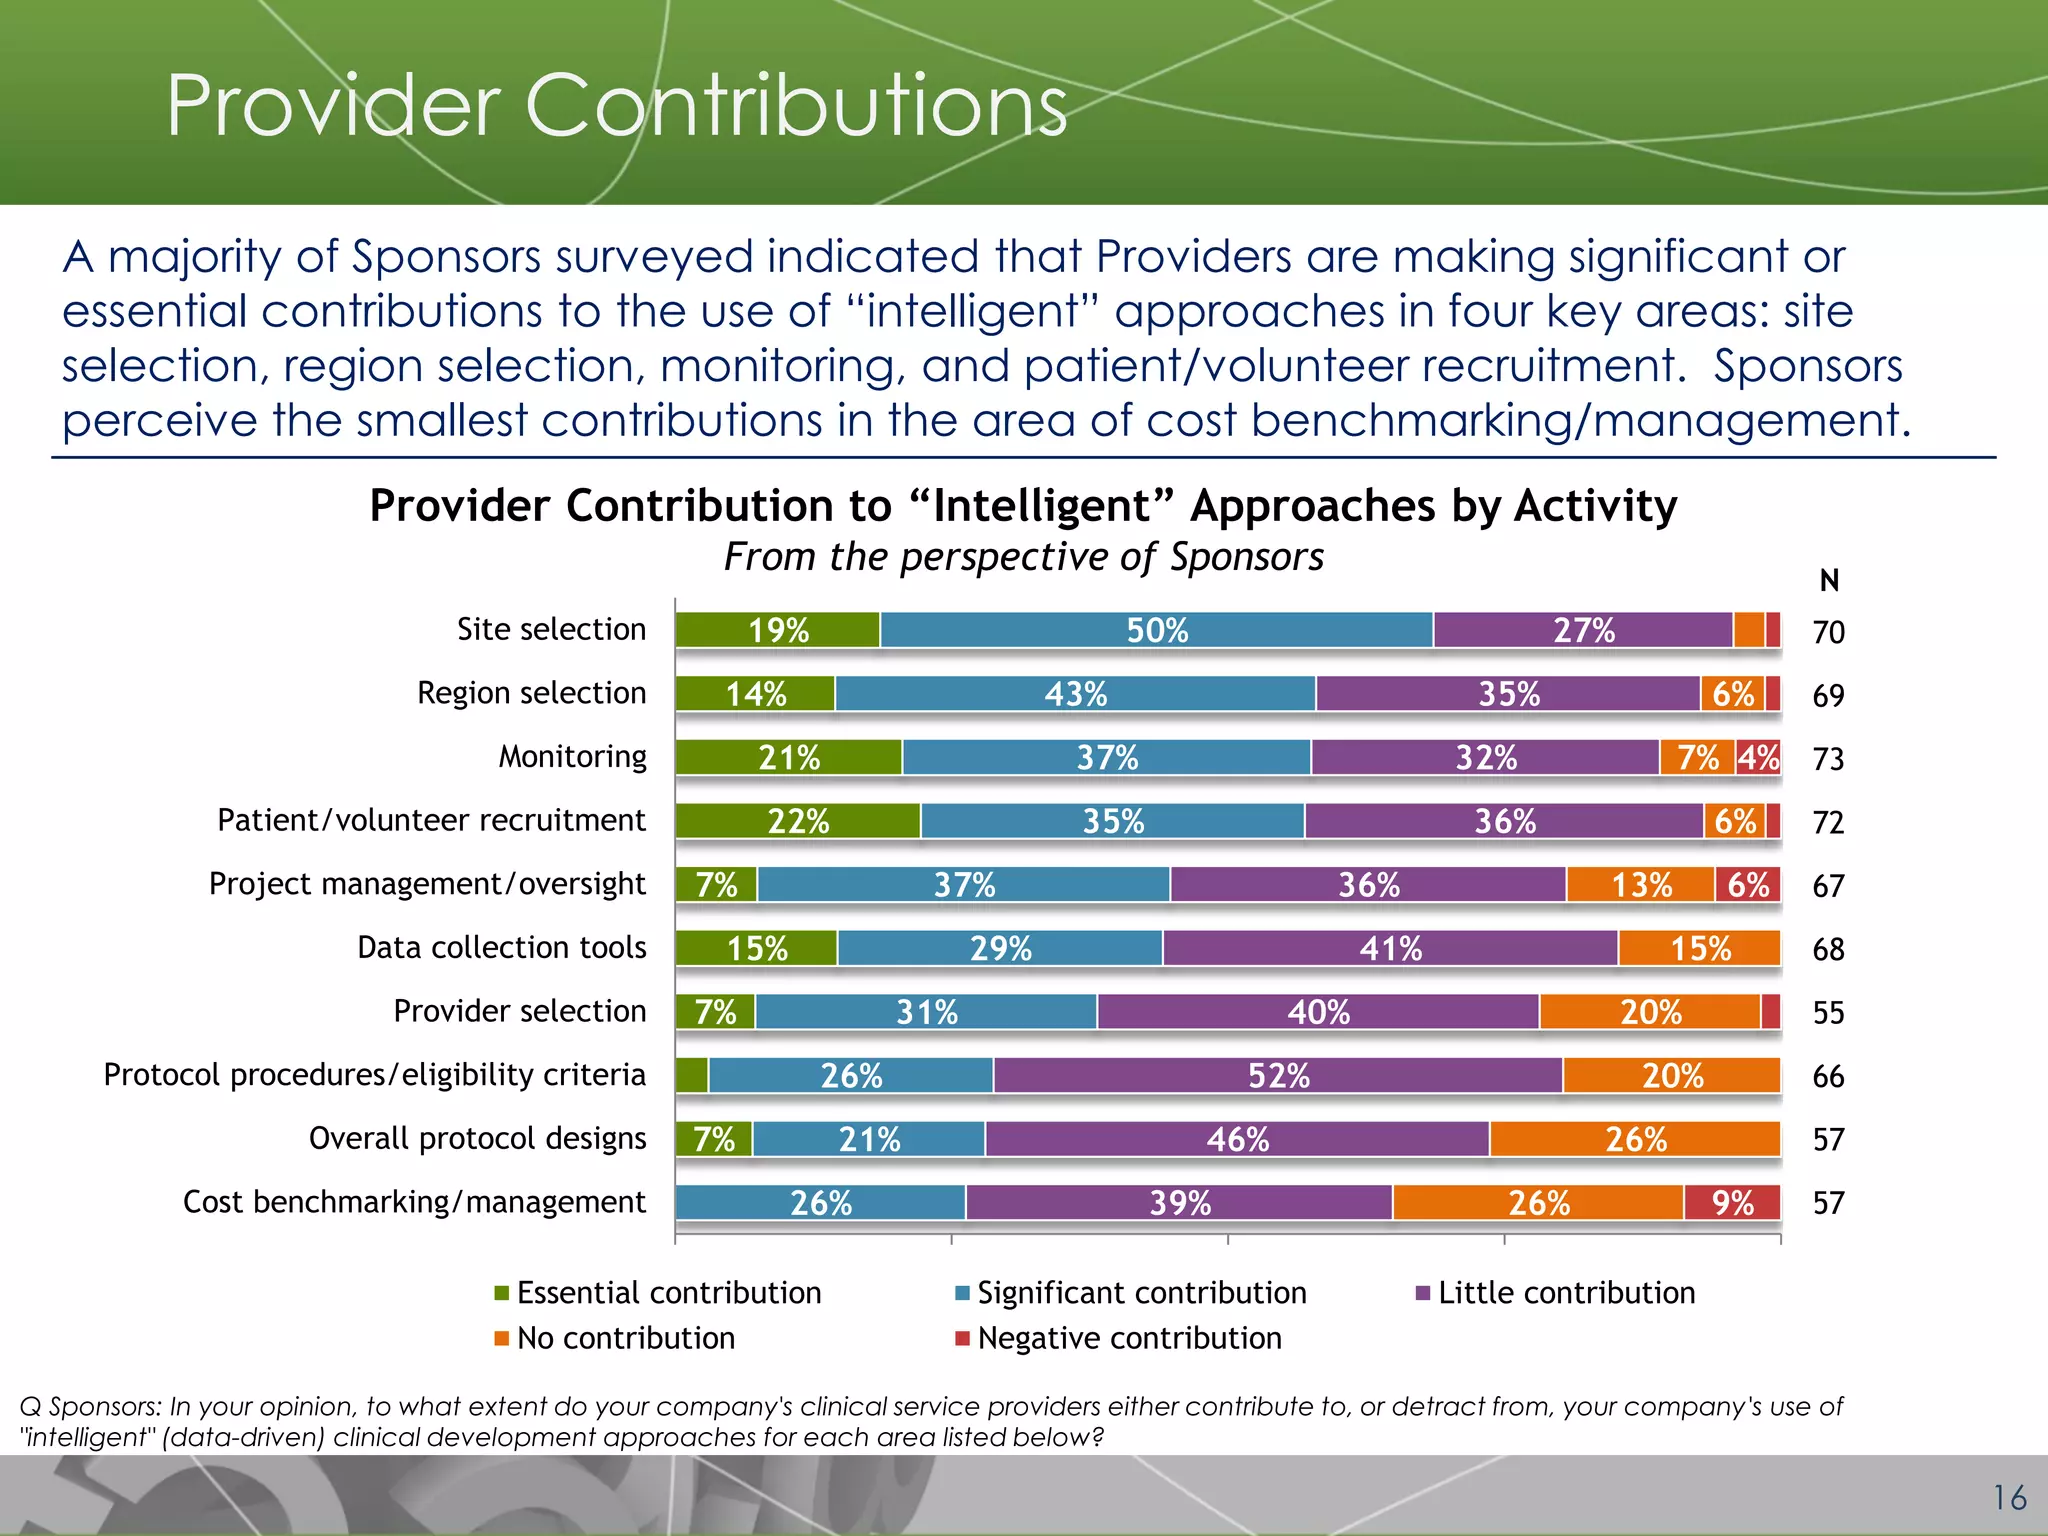


The document discusses a 2014 report from Avoca Group on the use of "intelligent" or data-driven approaches in clinical development. It found that both sponsors and providers apply these approaches most frequently to region and site selection. Providers reported greater advancement than sponsors in applying intelligent approaches across various clinical trial activities over the past two years. Sponsors viewed providers as making the most significant contributions to intelligent approaches for site selection, region selection, monitoring, and patient recruitment.