Download to read offline


![OVERALL PERFORMANCE (continued)
Las Aguilas (continued)
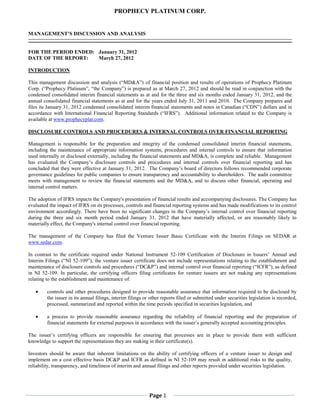
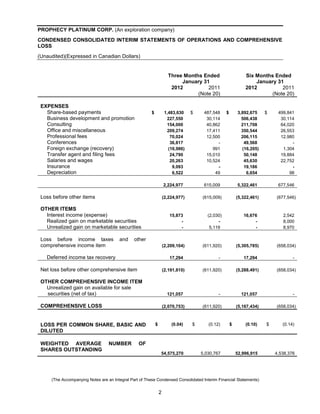
Las Aguilas NI 43-101 resource calculation summary as follows:
NiEq Nickel Copper Cobalt Au Ag Pt Pd NiEq
Zone Category Tons
Cutoff % % % (ppm) (ppm) (ppm) (ppm) %
East Indicated >= 0.4 1,036,800 0.52 0.35 0.03 0.09 0.53 0.19 0.19 0.77
West Indicated >= 0.4 2,227,000 0.36 0.45 0.03 0.03 0.29 0.15 0.19 0.62
Total Indicated >= 0.4 3,263,800 0.41 0.42 0.03 0.05 0.37 0.16 0.19 0.67
East Inferred >= 0.4 650,000 0.48 0.33 0.03 0.03 0.31 0.05 0.04 0.65
West Inferred >= 0.4 689,000 0.35 0.43 0.03 0.01 0.01 0.01 0.01 0.53
Total Inferred >= 0.4 1,339,000 0.41 0.38 0.03 0.02 0.16 0.03 0.03 0.59
Notes: Nickel price = US$9.02/lb and copper = US$2.66/lb, platinum = US$1842/oz, palladium = US$681/oz, gold =
US$1058/oz, silver = US$16.57/oz. The following formulas were used in Datamine to calculate Nickel Equivalence:
NiEQ=([Ni grade x $Ni)+(Cu grade x $Cu)+(Co grade x $Co)] x 20+[(Au grade x $Au)+(Ag grade X $Ag)+(Pt grade x
$Pt)+(Pd grade x $Pd) x 0.0291667)]/($Nix20). A total of 79 drill holes comprising 1,815 assays were used for resource
model validation. Specific gravities of 3.5 were used in this resource calculation. Block sizes of 8x8x4 meters for mineralized
lodes with two minor lodes on eastern zone given 1x1x1 meter block. The interpolation of the East and West zones was
completed using the estimation methods: nearest neighbour (NN), inverse distance squared (ID2) and ordinary kriging (OK).
Validation was carried out by visual comparison of colour-coded block model grades with composite grades on section and
plan, comparison of the global mean block grades for OK, ID2, NN and composites, and Swath Plots comparing NN
estimates and OK estimates. Danniel Oosterman, P. Geo., a consultant of Platinum, is the Qualified Person under National
Instrument 43-101 who has approved the technical content above.
The letter agreement dated for an initial 6 month earn-in and due diligence period to allow the Company to update this
resource estimate, study the economics of the resulting deposit and review other environmental and socio-economic issues
that pertain to this area of Argentina.
The agreement with Marifil provides for payments and work commitments as follows:
To earn a 49% interest in the property:
Cash and Shares
1) $25,000 upon signing (paid) and 250,000 shares (issued) and
2) $75,000 and 250,000 shares on or before April 1, 2012;
3) $100,000 and 250,000 shares on or before April 1, 2013
4) $100,000 and 250,000 shares on or before April 1, 2014
At January 31, 2012, $150,677 in exploration costs had been spent on the Las Aguilas Property.
Work Commitments:
1) On or before 3 months from the agreement date complete a resource estimate (completed)
2) On or before April 1, 2012 incur $500,000 in exploration expenditures
3) On or before April 1, 2013 incur $500,000 in exploration expenditures
4) On or before April 1, 2014 incur $1,000,000 in exploration expenditures
Page 10](https://image.slidesharecdn.com/2012q2-120515122953-phpapp01/85/2012-Q2-MD-A-Interim-Financial-Statements-10-320.jpg)


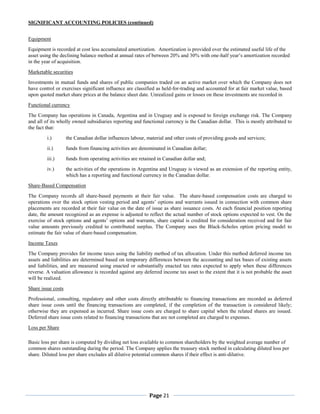


![PROPHECY PLATINUM CORP. (An exploration company)
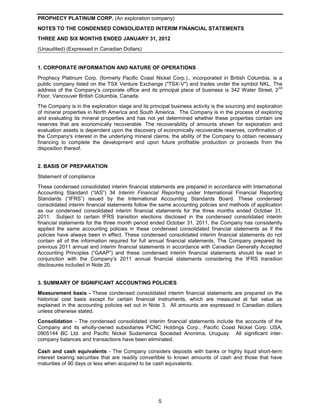
CONDENSED CONSOLIDATED INTERIM STATEMENTS OF FINANCIAL POSITION
(Unaudited) (Expressed in Canadian Dollars)
As at As at
January 31 July 31
2012 2011
ASSETS
Current
Cash and cash equivalents [Note 5] $ 1,972,527 $ 2,842,105
Marketable securities[Note 6] 4,146,825 -
Amounts receivable 148,937 91,877
Prepaid expenses [Note 7] 388,790 50,936
6,657,079 2,984,918
Exploration deposits 118,278 162,125
Loan receivable [Note 8] 809,469 -
Equipment [Note 9] 380,348 7,252
Exploration and evaluation assets [Note 11] 53,337,637 49,916,348
$ 61,302,811 $ 53,070,643
LIABILITIES AND SHAREHOLDERS’ EQUITY
Current
Accounts payable and accrued expenses [Note 10] $ 411,780 563,896
Due to related parties [Note 14] - 324,851
Total liabilities 411,780 888,747
SHAREHOLDERS' EQUITY
Share capital [Note 12] 64,627,589 54,699,316
Contributed surplus 6,158,872 2,210,576
Accumulated other comprehensive income 121,057 -
Deficit (10,016,487) (4,727,996)
60,891,031 52,181,896
$ 61,302,811 $ 53,070,643
Subsequent events (Note 19)
Approved on behalf of the Board on March 27, 2012:
“John Lee” “Donald Gee”
John Lee, Director Donald Gee, Director
(The Accompanying Notes are an Integral Part of These Condensed Consolidated Interim Financial Statements)
1](https://image.slidesharecdn.com/2012q2-120515122953-phpapp01/85/2012-Q2-MD-A-Interim-Financial-Statements-30-320.jpg)


- Prophecy Platinum Corp. provides a management discussion and analysis of its financial position as of January 31, 2012. - It discusses its adoption of IFRS reporting standards and evaluation of disclosure controls and procedures. No significant changes were found in its internal controls over financial reporting. - Highlights for the period include private placement financings, property acquisitions, and stock options grants. Subsequent events include additional property agreements and minority equity investments.


