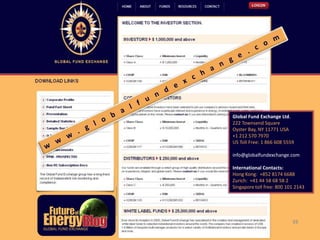
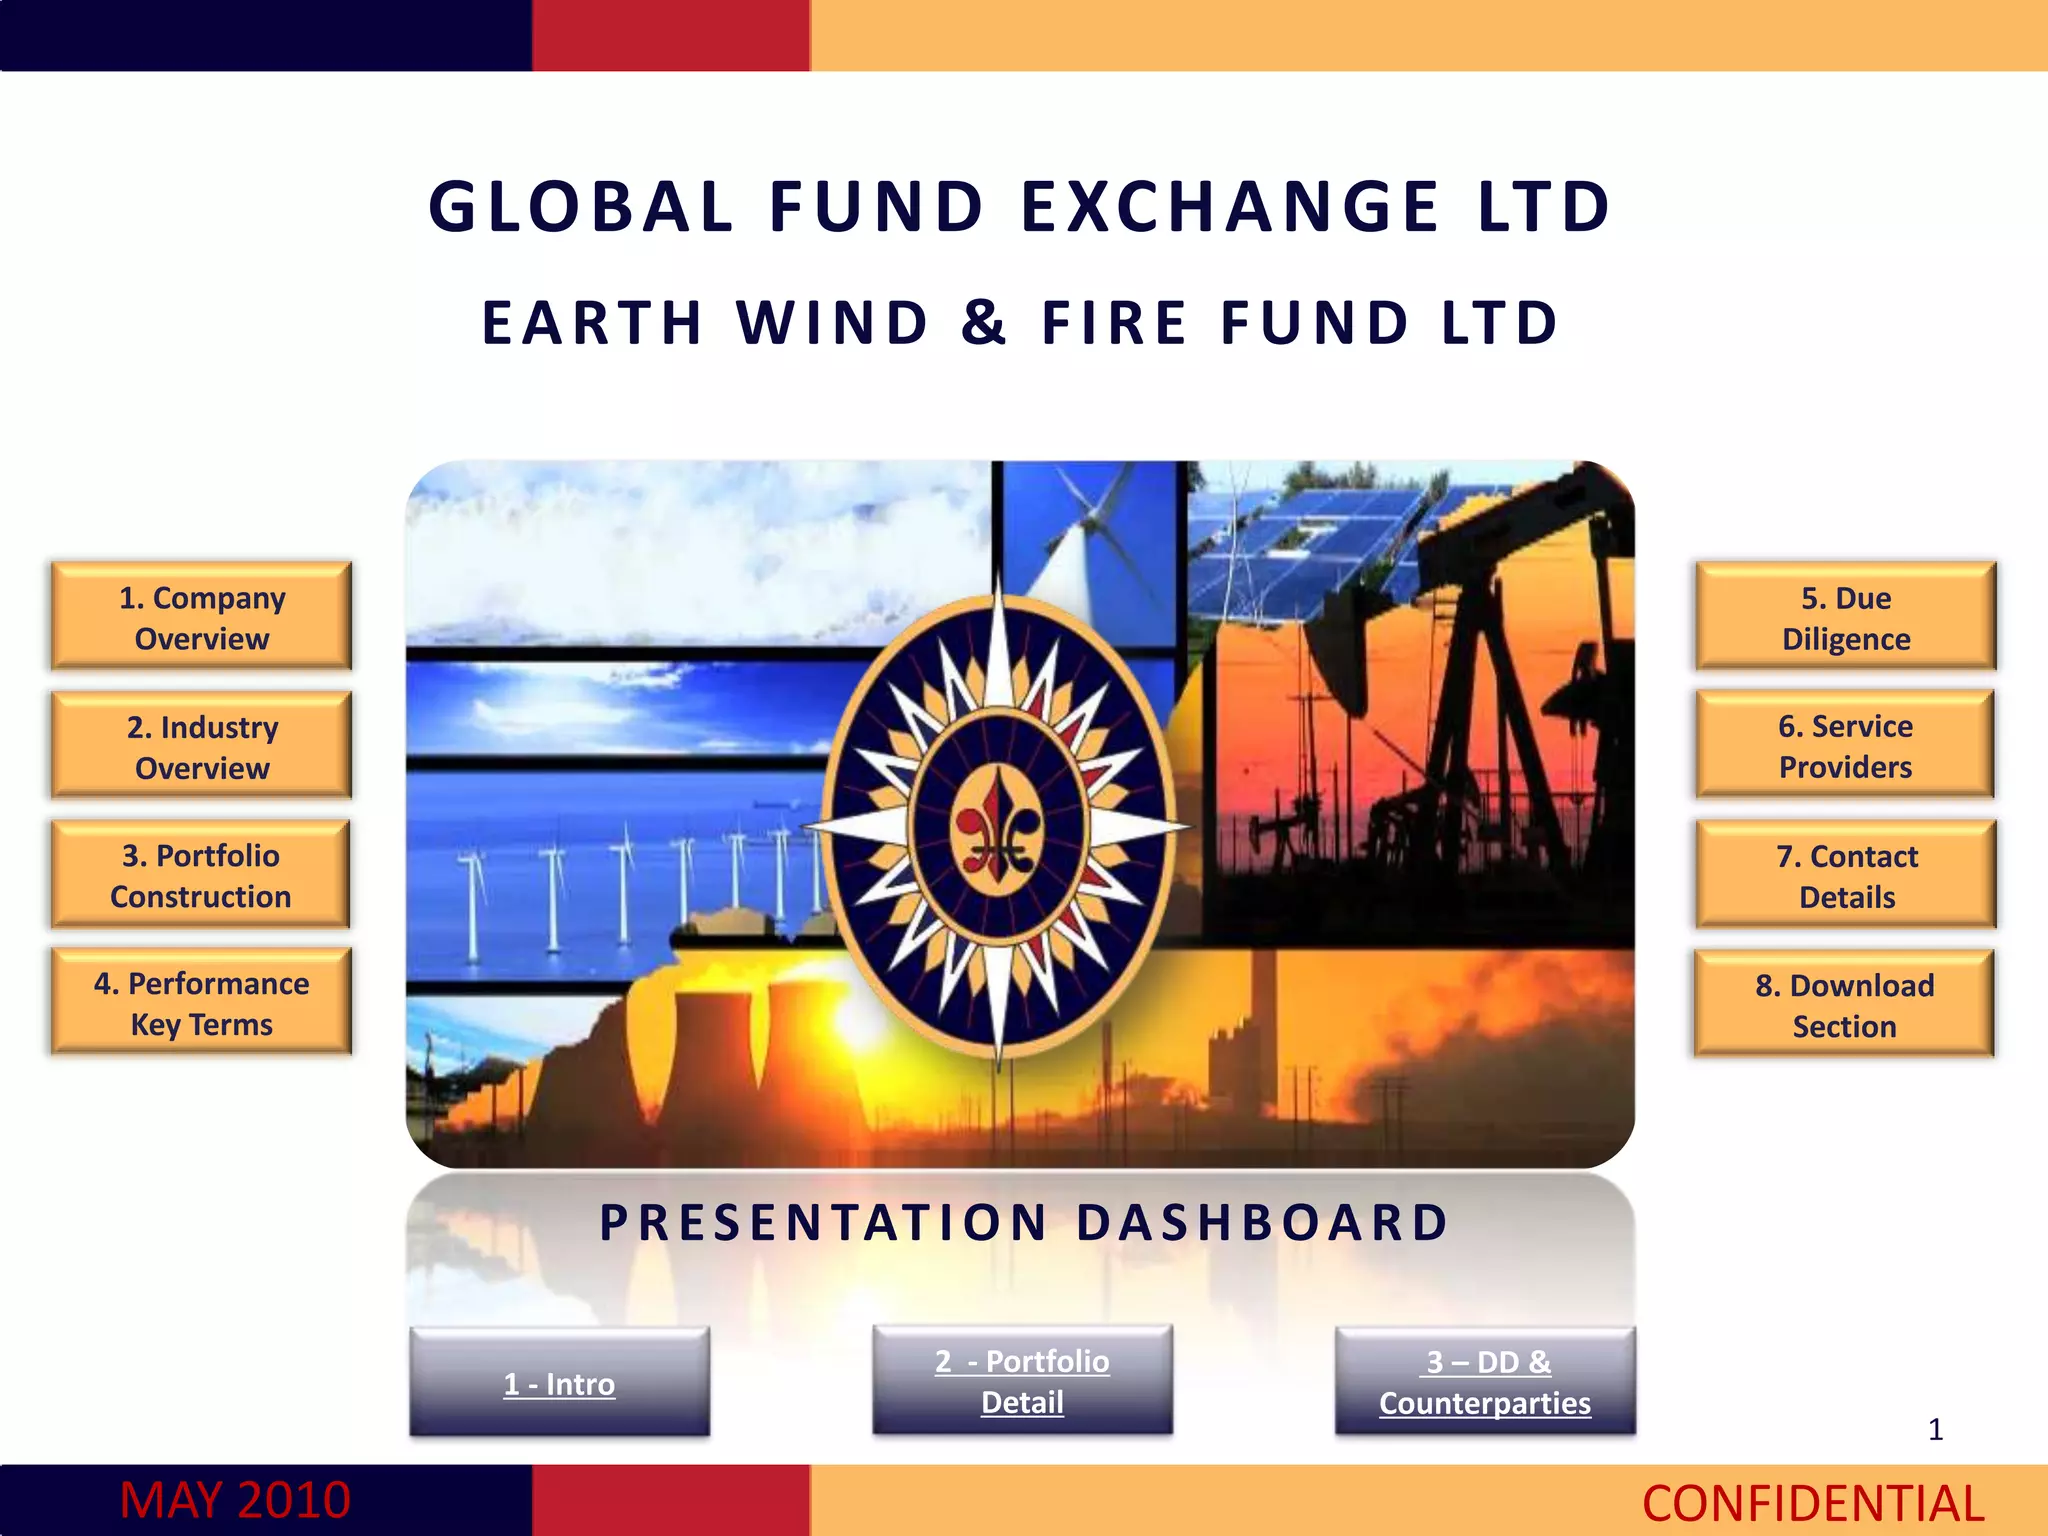
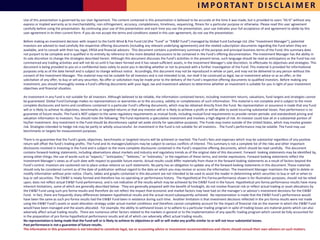
This document provides an overview and summary of the Earth Wind & Fire Fund Ltd managed by Global Fund Exchange Ltd. It outlines key sections that will be covered in the full presentation including introductions, portfolio details, due diligence of counterparties, and contact information. The summary also includes important legal disclaimers regarding the speculative nature of the investment, risks involved, and that the fund is newly formed so there is no historical performance to evaluate. It cautions readers to only consider the information current as of the date provided and to carefully review the full offering documents.
![CARBON PORTFOLIO
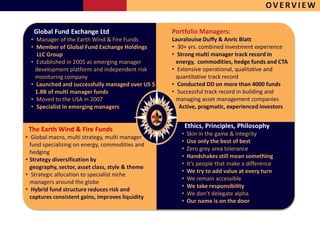
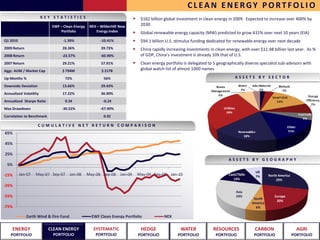
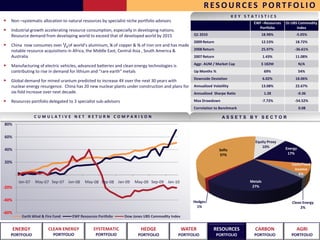
KEY STATISTICS
Carbon sector is set to be one of the most significant growth areas over next decade
EWF –Carbon ECX EUA Dec11
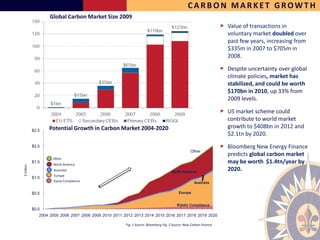
Portfolio Carbon Index Total value of global carbon market reached $125 billion in 2009. New exchange
systems proposed in U.S., Canada, Brazil, South Korea and Australia could dramatically
Q1 2010 -4.99% 0.99% increase value in years ahead
2009 Return 5.92% -23.02%
Over 1.32 billion tradable CER credits expected to result from U.N. registered CDM
2008 Return 2.30% -29.25%
projects in developing countries worldwide through 2012
2007 Return 101.90% 25.72%
Aggr. AUM / Open Interest $ 125M 422M Value of transactions in voluntary carbon markets such as RGGI and CCX increased
from $335 million in 2007 to $705 million in 2008
Up Months % 56% 54%
Downside Deviation 7.81% 29.33% Bloomberg New Energy Finance predicts global carbon market will be worth as much
Annualized Volatility 21.18% 39.48% as $1.4 trillion/year by 2020
Annualized Sharpe Ratio 1.13 -0.30 Carbon portfolio is currently delegated to 1 specialist sub-advisor
Max Drawdown -19.40% -65.15%
Correlation to Benchmark 0.43
CUMULATIVE NET RETURN COMPARISON
150%
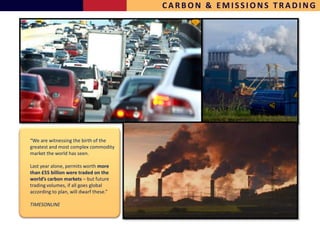
“Carbon, when it becomes worldwide,
will be unambiguously the largest
100% commodity in the world. The world emits
35 billion tons; its’ priced at $20; that’s
$700bn. Put a 10-20 multiple like you do
50% on futures, [and] you’re talking about
$10tn at maturity.”
– Richard Sandor, founder of
Chicago Climate Exchange (CCX)
-50%
-100%
Earth Wind & Fire Fund EWF Carbon Portfolio ECX EUA Dec11 Carbon Index
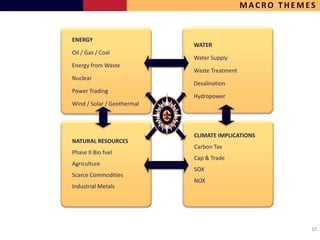
ENERGY CLEAN ENERGY SYSTEMATIC HEDGE WATER RESOURCES CARBON AGRI
PORTFOLIO PORTFOLIO PORTFOLIO PORTFOLIO PORTFOLIO PORTFOLIO PORTFOLIO PORTFOLIO](https://image.slidesharecdn.com/masterpresentationgtmupdatesinprogress-100730112004-phpapp01/85/Master-presentation-gtm-updatesinprogress-36-320.jpg)