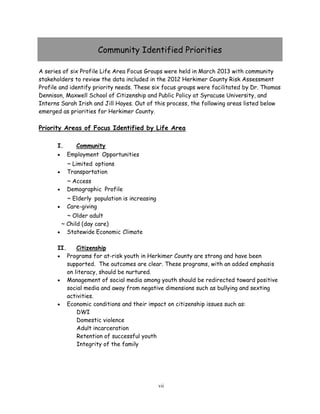
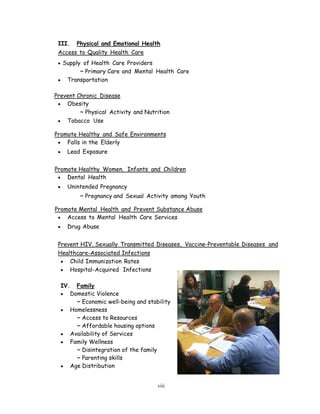
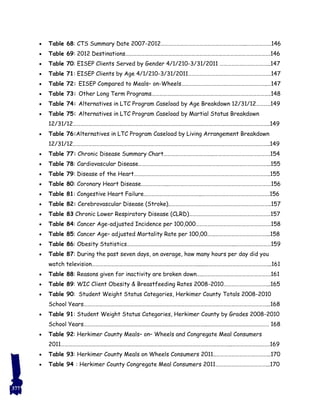
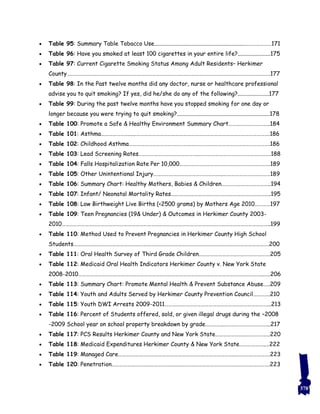
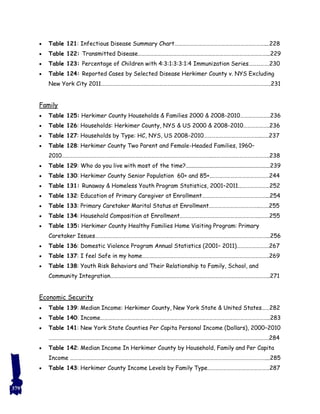
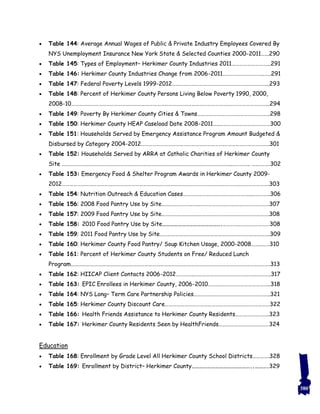
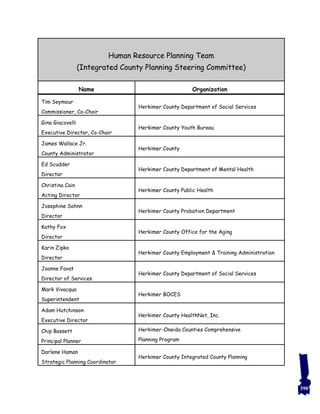
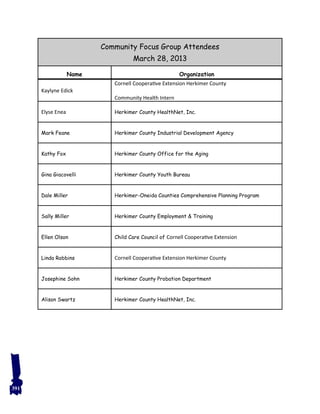
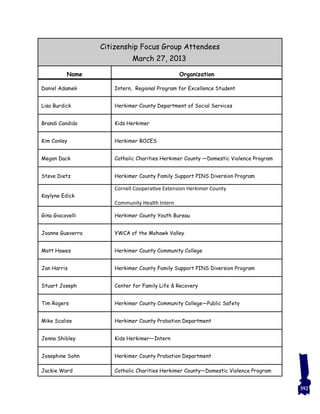
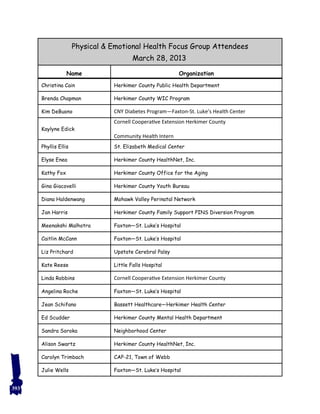
The document is an update to the 2012 Herkimer County Risk Assessment Profile. It was created through collaboration between Herkimer County Integrated County Planning (ICP) and Herkimer County HealthNet, Inc. (HCHN). The Profile collects data on community strengths and challenges to assess risks and needs in Herkimer County. It is organized using the six Life Areas framework and incorporates the New York State Prevention Agenda priorities. Focus groups were held to identify priority areas for improvement. The Profile will be used by county organizations and agencies to develop strategies to reduce risks and improve outcomes for residents.
This document provides a summary of the Marin County Family Support Blueprint. It lays out a vision for Marin County where children are cherished, families are supported, and communities thrive. The blueprint was developed with input from stakeholders to provide strategies and a framework for a coordinated family support system. It identifies strengths and needs of families in areas like economics, health, education, and community support. The blueprint proposes strategies at different levels to mobilize communities, influence policies, and better support families. It aims to guide policies and practices to help families be healthy, secure, and hopeful, especially in challenging economic times.
The document provides an overview of the Illinois Department on Aging (IDoA), including its mission, organizational structure, programs and services for older adults, funding sources, partnerships with Area Agencies on Aging, challenges around funding and serving an aging population, and the intern's responsibilities assisting with policy research and implementation.
NASHP Conference 2014 – State Health Policy Focuses on Integrating Social Ser...Jamie A. Brennan
The NASHP conference focused on integrating social services to improve public health. States are coordinating programs like Medicaid, healthcare, housing, and education. Unlocking health data is key, and federal support is helping states build integrated data systems. The conference highlighted success stories of states improving healthcare through coordination and data-driven reforms.
The document discusses the author's concept paper idea to address the overrepresentation of African American families and children in the child welfare system. Specifically, the author proposes creating a legal aid service and policy advocacy program housed within the existing Black Family Development organization. The legal aid program would provide free legal representation for low-income clients in child welfare cases, while the advocacy program would include policy analysts and lobbyists focused on child welfare issues. The author argues this idea aligns with Black Family Development's mission and would fill a need, as few similar programs currently exist in Wayne County.
Medicaid May Allow States to Save Millions on Prisoner Medical CareJamie A. Brennan
This article discusses how states may be able to save millions of dollars in prisoner medical care costs by taking advantage of a 1997 Medicaid rule. The rule allows states to enroll prisoners in Medicaid and receive federal matching funds for hospital costs over $24 hours if the prisoners qualify financially. With the expansion of Medicaid under the ACA, many more prisoners likely meet eligibility requirements. The article recommends states research this opportunity and develop agreements between Medicaid and corrections agencies to implement enrollment of eligible prisoners in Medicaid to help reduce rising medical costs for prisoners.
The document discusses advocacy efforts for Medicaid expansion in South Carolina, including messaging around the importance of expanded access to care and treatment for people living with HIV, ongoing discussions in the state around essential health benefits and benchmark plans, and next steps advocates can take like meeting with stakeholders, elected officials, and participating in coalitions and sign-on letters.
The 2016 annual report of the Summit County Health Department highlights the department's work in promoting and protecting personal and environmental health. It provides an overview of the department's mission and functions, financial information, messages from leadership, and summaries of programs and initiatives in areas such as emergency preparedness, communicable disease control, and health promotion. The report demonstrates the department's impact through interagency collaboration and services that address the health needs and challenges facing Summit County.
This document summarizes New Mexico's behavioral healthcare crisis and proposes reforms. Key points:
- New Mexico faces high rates of substance abuse and mental illness that burden the state financially and socially.
- Previous reforms failed to create an effective, coordinated system, and a 2013 scandal further divided stakeholders.
- The summary argues that simply increasing funding will not solve problems and that New Mexico must reform its system through more effective policies rather than looking to the dysfunctional US federal system for guidance or funds.
This document provides a summary of an AAFP Government Affairs Update presented in Dallas, TX on November 3, 2017. It introduces the AAFP Division of Government Relations staff and lists the AAFP's top issues for 2017, which include promoting physician payment reforms, defending gains in health insurance coverage, reducing administrative burdens, improving physician well-being, increasing the family physician workforce, and supporting population health improvement. Charts are included analyzing the current Congress and outlook for the 2018 Senate elections. The document reviews the status of key health care issues and upcoming deadlines under the Trump Administration.
This document provides a summary of findings from a report by the Committee on Oversight and Government Reform regarding the potential impacts of 7 Medicaid regulations proposed by CMS. Key findings include:
1) State estimates found the regulations could reduce federal Medicaid payments to states by $49.7 billion over 5 years, more than 3 times CMS's estimate of $15 billion.
2) The regulations are likely to shift costs from the federal government to states rather than improve efficiencies.
3) The regulations could disrupt care systems for vulnerable groups and threaten the stability of safety net hospitals and clinics treating uninsured patients.
4) The regulations would impose significant administrative burdens and costs on state Medicaid programs.
5
This document summarizes the Vision North 2010-2015 strategic planning process for the Clay-Platte County region. It describes how multiple stakeholders including local public health departments, hospitals, schools, and community organizations came together to identify key priorities and develop strategies. Through a facilitated process, they engaged the community and assessed needs to select five priority areas: community wellness, education, economic development, transportation/infrastructure, and quality of life. The local health departments played a key role by providing funding, participation on the community wellness committee, and staff support. Lessons learned include starting earlier, engaging funders, and focusing health data more locally.
This document summarizes key points from a policy briefing about the Affordable Care Act and Ryan White program. It discusses ACA milestones including Medicaid expansion and health insurance exchanges. It notes that some states like Pennsylvania may not expand Medicaid. The briefing also covers the potential impacts of sequestration cuts and upcoming advocacy events regarding appropriations for HIV/AIDS programs.
Qualitative Research on Health as a Human Right in Lewis & Clark County, MontanaPurvi P. Patel
The findings and final work product [abridged] of my Applied Learning Experience Presentation (ALE), the thesis requirement for my Masters of Public Health degree. The National Economic and Social Rights Initiative (NESRI) served as the host organization for my project.
The memorandum from Curtis Healy, head of the Michigan Health Department, summarizes proposed budget cuts to the department for the next fiscal year. Healy met with staff and senior leadership, who proposed initial cuts totaling $1,000,000 across several programs. Healy then proposed additional cuts of $525,000 to specific programs highlighted in yellow. The total proposed cuts amount to $2,317,500 across various department programs and services. Healy's goal was to do the least overall harm following criteria of low political feasibility. He requests Governor Yersy Yersinian's consideration and approval of the proposed cuts.
2013 06-20 capital region aaa session, overview of aa as-1Aging NY
The document provides an overview of area agencies on aging and the aging services network. It discusses the roles and responsibilities of area agencies on aging, which work to help older adults and caregivers access services and supports to allow them to live independently in their homes and communities. The document outlines various programs and services provided by the aging network, including home-delivered and congregate meals, transportation, care management, and caregiver support. It also discusses how these services help avoid unnecessary nursing home placements and are more cost-effective than institutional care.
Medicaid's Role for People with DisabilitiesVikki Wachino
This document discusses Medicaid and challenges for people with disabilities. It provides background on Medicaid, its role in covering people with disabilities, proposed changes to Medicaid's structure and coverage, and how Medicaid is evolving long-term care for people with disabilities. Key points include:
- Medicaid covers over 70 million low-income and disabled Americans and is the largest payer of long-term care in the US.
- 31% of non-elderly people with disabilities receive Medicaid coverage.
- Proposed changes in 2017 would have capped federal Medicaid spending, effectively ending the Medicaid expansion.
- Medicaid is shifting long-term care from institutions to home and community-based services to allow people to remain in their
This document introduces the team working on a project for Kern County to develop policy to aid unhoused community members. It provides backgrounds on three team members: Alex Sletta who is pursuing a master's in public policy with interests in diversity, equity, and inclusion; Ashley Miller who is also pursuing a master's in public policy with interests in civil rights; and Lincoln Mattwandel who received his bachelor's in political science and hopes to expand his understanding of local government through this project.
The document summarizes key points from a meeting of Advocates for Ohio's Future regarding the state budget. Key policy priorities discussed include preserving Medicaid eligibility and services, adequately funding programs for the elderly, food access, behavioral health, and early childhood education. Concerns were raised that the budget cuts funding for important social services and does not direct new revenue towards health and human services. Advocates were urged to contact state legislators and express that any new revenue should support programs for health, nutrition, and vulnerable groups.
The document summarizes highlights from Ohio's proposed state budget bill HB 153 for fiscal years 2012-2013. It discusses funding cuts to areas like education, Medicaid, and mental health services while Medicaid caseloads increase. Concerns are raised that more cuts may come in the next budget and the long-term impacts on health and human services are uncertain given over 5,000 pages of policy changes with little detail. Advocates call for more investment in areas like child welfare, mental health, and foodbanks to adequately meet growing needs.
The document summarizes the Debt Ceiling Deal passed by Congress and its potential impacts. It establishes a bipartisan committee to cut $1.2-1.5 trillion in spending over 10 years, with automatic cuts taking effect in 2013 if no deal is reached. Many programs are exempt from these cuts, but discretionary programs and entitlement reforms are on the table. The deal could reduce funding for services like nutrition assistance and Medicaid, threatening vulnerable populations. Advocates encourage engaging with members of Congress to prioritize critical social programs in further deficit reduction efforts.
The document discusses the key concepts of public health, including definitions, core functions, and relationship to medical care. It outlines the main disciplines of public health - epidemiology, statistics, biomedical sciences, environmental health, social and behavioral sciences, and health policy/management. It also covers the public health approach of defining problems, identifying risks, developing interventions, implementation, and monitoring effectiveness.
Meggan Christman Schilkie has over 15 years of experience in health care management, policy, and strategic consulting. She has held leadership roles at the New York City Department of Health and Mental Hygiene, managing over $200 million in behavioral health programs. Currently, she is a Principal at Health Management Associates, where she provides strategic consulting services to health care organizations. She has expertise in areas such as financing, delivery system reform, and healthcare policy.
SAC360 Chapter 3 powers and responsibilities of governmentBealCollegeOnline
The document discusses the roles and responsibilities of different levels of government in public health. It notes that the Constitution gives states primary responsibility for health, though the federal government also plays a large role through powers like regulating interstate commerce. It describes the legislative, executive, and judicial branches at federal, state, and local levels. It also lists many federal agencies like CDC and NIH involved in public health, as well as nongovernmental organizations.
In Spring 2013, we are on the precipice of dramatic, disruptive change in the health field that offers an unprecedented opportunity and challenge to transform health care and population health.
We know that traditional public health approaches along with more and better health care are not enough to improve health outcomes, equity, and cost. We must also:
- implement sustainable, fundamental "upstream" changes that address the root causes of disease and disability; and
- transform the way we deliver health care to ensure access to quality, affordable health care for all.
Enjoy this keynote panel presentation from Larry Cohen of the Prevention Institute, which was presented at the 2013 Annual Leadership Conference, co-sponsored by the Center for Health Leadership (CHL) and the California Pacific Public Health Training Center (CALPACT) at UC Berkeley's School of Public Health.
To learn more about this event, please visit:
http://calpact.org/index.php/en/events/leadership-conference
Learn more about CALPACT:
http://calpact.org/
Learn more about the CHL:
http://chl.berkeley.edu/
Home care has been provided in the US since the 1880s and currently over 7.6 million people receive care from 83,000 home care providers. Medicare's enactment in 1965 accelerated growth in home care agencies. By the end of 2001, the number of Medicare-certified home health agencies declined to 6,861 due to changes in Medicare home health coverage and reimbursement. However, the number of agencies rebounded to 9,284 by the end of 2007 with the introduction of the home health prospective payment system in 2000. Total national health expenditures were projected to be $2.2 trillion in 2007, with home care expenditures estimated at $47.5 billion in 2005.
This document summarizes an agenda and call for Advocates for Ohio's Future regarding the state budget. Representatives from various advocacy organizations discuss funding needs and cuts to programs supporting mental health, child welfare, aging services, food assistance, and more. They request restoring proposed budget cuts and investing additional funds in these areas using any new revenue. Attendees are encouraged to contact their state senator to advocate for prioritizing health and human services programs.
Zakaria Ahmed is a Ghanaian accountant seeking new opportunities. He has a Bachelor of Technology in Accounting with Computing from Kumasi Polytechnic and over 10 years of experience in accounting, teaching, sales, and import/export. His career objectives are to contribute his expertise to develop organizations and acquire additional knowledge and skills. He enjoys driving, traveling, sports, and reading in his free time.
Haiku Deck is a presentation tool that allows users to create Haiku-style slideshows. The tool encourages users to get started making their own Haiku Deck presentations, which can be shared on SlideShare. In just 3 sentences, it promotes creating Haiku Deck presentations and publishing them to SlideShare.
ESCASO SUSTENTO CIENTÍFICO TIENEN LAS PRUEBAS DE INGRESO A LAS UNIVERSIDADESMoises Logroño
El documento critica las pruebas de ingreso a la universidad utilizadas en Ecuador, señalando que tienen escaso sustento científico y contradicen principios democráticos. Argumenta que usar pocos ítems para evaluar las complejas capacidades humanas puede perjudicar a los estudiantes y sesgar los resultados. Propone implementar un año propedéutico para desarrollar habilidades antes de la selección, y usar múltiples métodos de evaluación cualitativa.
Los aerogeneradores convierten la energía cinética del viento en energía eléctrica mediante un rotor hélice que hace girar un generador. Pueden trabajar de forma aislada o en parques eólicos, y deben sincronizarse con la red eléctrica para aportar energía. Funcionan con velocidades de viento entre 3 y 24 m/s y usan sistemas de control para variar el ángulo de las palas y regular la velocidad de rotación en función de la velocidad del viento.
Este documento presenta el currículum de Miguel Ángel Carrillo Rivera. Ha trabajado en varias posiciones de supervisión y liderazgo en empresas de encuestas telefónicas como Market Information Solutions y First Kontact Center. Actualmente trabaja como técnico de soporte para Plantronics. Busca desarrollar sus habilidades profesionales para apoyar a su familia.
Este documento introduce la contabilidad en Excel, explicando que Excel puede usarse para llevar la contabilidad de una empresa de manera sencilla al permitir crear libros diarios, estados de situación inicial y realizar cálculos sin calculadora. Aunque Excel puede resultar difícil para algunos al inicio, el documento asegura que aprendiendo a usar sus iconos básicos no será complicado llevar la contabilidad en este programa.
Este documento es una solicitud de exención de pago para un estudiante. Contiene información personal como nombre, carrera, semestre, domicilio y contacto. También incluye detalles sobre la situación familiar como ingresos, número de personas en el hogar, si el estudiante trabaja y razones para solicitar la beca. El solicitante declara que la información es verdadera y está dispuesto a comprobarla y realizar servicio social si se le otorga la exención.
Este documento introduce la contabilidad en Excel, explicando que Excel puede usarse para llevar la contabilidad de una empresa de manera sencilla al permitir crear libros diarios, estados de situación inicial y realizar cálculos sin calculadora. Aunque Excel puede resultar difícil para algunos al inicio, el documento asegura que con práctica no será complicado utilizar sus iconos para la contabilidad.
This document presents the design of a variable gain low noise amplifier (LNA) using a 0.18 μm CMOS technology. It discusses the challenges of common source and common gate LNA core designs. It then describes the use of a gm boost configuration and cross coupled configuration to improve performance. Simulation results show the LNA meets gain, noise figure, and return loss specifications while achieving low power consumption. Layout design and test structures are also discussed.
O documento fornece instruções sobre como manter uma atitude positiva no atendimento ao cliente. Instrui os atendedores a se concentrarem nos benefícios dos produtos para os clientes, em vez de suas características, e a perguntarem sobre as necessidades dos clientes antes de apresentarem os produtos. Também enfatiza a importância de ver o "copo meio cheio", agir de forma positiva para resolver problemas, e ajustar constantemente as atitudes para manter uma perspectiva positiva.
Building a Healthy CommunityHealth Assessment & Community Se.docxcurwenmichaela
Building a Healthy Community
Health Assessment & Community Service Plan
S e P t e m b e r 2 0 0 9
S i x C o u n t y r e g i o n o f n e w y o r k S t A t e
Essex, Fulton, Hamilton, Saratoga, Warren, & Washington
Copies of the full report are available online at www.arhn.org
e x e C u t i v e S u m m A r y
ARHN / Health Assessment & Community Service Plan / September 2009
message to the Community2
Message to the Community
We are proud to present you
with this report of the six-county
Adirondack Region of Upstate New
York—a comprehensive collection
and analysis of data regarding
health issues and needs in Essex,
Fulton, Hamilton, Saratoga, Warren
and Washington counties.
This study was conducted to identify health
issues of primary concern and to provide critical
information to those in a position to make an
impact on the health of our region—governments,
social service agencies, businesses, healthcare
providers and consumers—to name just a few.
The results enable us to more strategically
establish priorities, develop interventions and
commit resources to improve the health of our
communities and the region.
Health is—and must be—an issue of concern and
action for all of us. We hope the information in
this study will encourage collaboration involving
all agencies, across county lines, between usual
competitors, and among funders to address the
complex health needs of our residents.
2
ARHN / Health Assessment & Community Service Plan / September 2009
executive Summary 3
Executive Summary
Introduction
Established in 1992 through a New York State
Department of Health Rural Health Network
Development Grant, the Adirondack Rural
Health Network (ARHN) is a community
partnership of public, private and non-profit
organizations in Upstate New York. ARHN links
local public health departments, community
health centers, hospitals, community mental
health programs, emergency medical services,
and other community-based organizations by
creating a collaborative process for developing
strategies and for implementing, monitoring
and evaluating the regional health care
system. The Upper Hudson Primary Care
Consortium, a 501-c-3 corporation licensed
as an Article 28 Central Service Facility, serves
as host organization for ARHN and provides
financial management, human resources, and
information technology support.
Since 2002, the ARHN has been recognized as
the leading sponsor of formal health planning
for Essex, Fulton, Hamilton, Saratoga, Warren
and Washington counties. Together with
community stakeholders, the ARHN has
developed and implemented a sophisticated
process of community health assessment and
planning for the defined region. The first ARHN regional community health assessment report was released five years
ago, in September 2004. Subsequent to the report’s release, the Adirondack Rural Health Network Community Health
Planning Committee (the Committee) ha.
This document provides a summary of the 2015 Community Health Needs Assessment conducted by Lake Regional Health System. Key findings from the assessment include:
1) The leading causes of death in the community as defined by Camden, Miller, and Morgan counties are heart disease, cancer, and smoking-related illness. Rates of premature death are higher than the state average.
2) Overweight and obesity rates are high, with over one-third of adults considered overweight or obese. This puts residents at risk for other health issues.
3) Through a community survey and focus groups, the top four prioritized health needs were identified as access to primary/specialty care, mental health, smoking/tobacco use,
This document provides a summary of Henry Ford Health System's 2016 Community Health Needs Assessment. It describes HFHS's service area as Wayne, Oakland, and Macomb counties, with a focus on communities where it receives most inpatient discharges. Demographic data on the Tri-County region is presented, showing a population of nearly 4 million that is 65% white and 25% black. Input from community stakeholders was gathered through surveys to understand health needs. Chronic diseases, access to care, and racial disparities were identified as ongoing priorities from the previous 2013 assessment.
Hampden CHA Final Report - Final version bTom Taaffe
This document provides a summary of a community health assessment conducted for 12 towns in Hampden County, Massachusetts. It includes surveys of 230 community members, interviews with 67 key informants across the towns, and 12 focus groups. The assessment examines health issues like substance abuse, obesity, mental health, and access to care. It also considers demographic factors and identifies priorities in each town. Overall, the report aims to understand community health conditions, needs, and concerns in order to improve public health outcomes for the region.
This document presents a needs assessment and strategic prevention plan for Midland County, Michigan. It identifies underage drinking, alcohol-related crashes, increased illicit drug use, and smoking as priority substance abuse problems based on an analysis of local data. Intervening factors like peer pressure and personal views of the future are also examined. Based on this analysis and a review of current prevention efforts, the plan proposes expanding asset-based programs through local agencies to reduce substance abuse among youth.
The document discusses evaluating the outcomes of coordinated community activities through credible measurement to demonstrate improved quality of life. It identifies key health priorities and indicators in St. Joseph County, Indiana that need to be addressed, such as health disparities, mental health, physical health, and access to care. Memorial Hospital invests in the community through funding initiatives and partnerships to address these priorities.
This document provides a summary of the Kane County Community Health Improvement Plan (CHIP) in Illinois. It discusses the purpose and requirements of the IPLAN/CHIP process, which is conducted every five years to assess community health needs and develop plans to address priority issues. The summary outlines the structure and organization of Kane County's CHIP, noting it is well organized with sections, subtitles, and graphics. It also analyzes how the CHIP addresses core functions and steps of the Timmreck 10-Step Planning Model. Key health priorities in the Kane County CHIP include reducing chronic disease, infant mortality, childhood lead poisoning, and improving social/emotional wellness. The CHIP aims to achieve these priorities through goals related to
The document provides information on the 2014 Public Health Advisory Council and Board of Health for Snohomish County, Washington. It lists the members of each group and notes that the Snohomish Health District works with these partners to promote public health in the community. The document then summarizes the Health District's strategic plan update and priorities for evolving its programs and services. It also provides some statistics on the services provided and funding challenges faced by the Health District.
The NC Rural Center hosted a summer road trip to 12 rural communities in North Carolina to engage with local partners, share research and initiatives, and hear about successful local projects. Over 350 people participated across the four regions visited. The top issues identified were rural healthcare, infrastructure, leadership, and education. The Rural Center committed to continued information sharing, convenings, and advocacy support for rural communities.
This document provides a summary of a 2011 community health needs assessment conducted in Wexford and Missaukee counties in Michigan. It describes the process, findings, and recommendations. Key findings include high rates of poverty, lack of access to healthcare, and chronic health issues like diabetes and respiratory disease. Mental health and substance abuse were also areas of concern. The assessment identified poverty as a root cause impacting many health issues. It recommended addressing gaps in chronic disease management, care coordination, prevention education, and related social determinants of health.
This document provides a summary of a 2011 community health needs assessment conducted in Wexford and Missaukee counties in Michigan. It describes the process used to conduct the assessment which included collecting health and socioeconomic data as well as gathering input from community members. The assessment found that the top health issues were poverty, access to healthcare, maternal/child health, chronic disease management/prevention, mental health, substance abuse, and tobacco/alcohol abuse. These issues were linked to underlying social determinants of health like unemployment and low education levels. The assessment will help inform strategic planning and programs to address the community's needs.
This document outlines a community health improvement plan for Clare and Gladwin Counties in Michigan. It discusses forming a cross-county health council and county-level working groups to assess local health needs and priorities. The working groups used various health data sources and a community survey to identify priority areas. The top priorities identified were: 1) obesity, nutrition, and physical activity, 2) mental health and substance abuse, and 3) access to healthcare. The document provides goals and current resources for each priority area. It aims to unite the community and improve health through collaborative efforts.
The document provides an overview of a community health improvement plan for Clare and Gladwin Counties in Michigan. It discusses forming a working group to assess health needs, determine priority areas, and set goals. The priority areas identified are: health services, nutrition/weight status, violence, substance abuse, maternal/infant health, and transportation. For each priority, goals and objectives are outlined, such as establishing new primary care clinics, increasing access to health screenings and education, and expanding access to healthy foods through farmers markets. The plan aims to unite partners across the region to improve health in central Michigan.
The document is the 2014 annual report of the Hinds County Human Resource Agency (HCHRA). It summarizes that HCHRA is the Community Action Agency for Hinds County, Mississippi that has provided services to low-income citizens for over 37 years. It works to lift families and communities out of poverty through programs like Head Start and Early Head Start for children and other services through its Department of Community Programs and Services. The report outlines HCHRA's mission, leadership, programs, and goals to continue successfully coordinating resources to help disadvantaged citizens.
The principal objective of the study titled “Assessing the Social Impact of Freedom Debt Relief” was to measure
the impacts of the Freedom Debt Relief program on clients’ financial and emotional health using two established
academic measures: The Financial Capability Scale and the Perceived Stress Scale. The Financial Capability Scale
(FCS) was used to measure financial capability of individuals with consumer debt and The Perceived Stress Scale
(PSS) was used to measure the perception of stress in individuals with consumer debt.
he data point to three key findings. Compared to those who never enrolled in the program:
1. Freedom Debt Relief graduates are significantly healthier financially.
2. Freedom Debt Relief graduates are significantly less stressed about their finances.
3. Freedom Debt Relief graduates feel significantly better about their personal lives.
This document provides an informational report on Oakland's 2015 Classrooms2Careers program, which provided summer employment and career development opportunities to over 2,000 Oakland youth. It describes the program design, eligibility requirements, participating organizations, types of jobs and internships available, and the various public and private funding sources that supported the program. The report recommends that City Council accept this informational report on the 2015 Classrooms2Careers program outcomes.
Childhood Obesity Grant Recommendations ReportAdam Poser
This document provides an overview of childhood obesity indicators in Marion and Vanderburgh counties in Indiana. It discusses the definition of overweight and obesity, national childhood obesity rates, causes of obesity such as poor nutrition and lack of physical activity, and consequences such as increased risk of health issues. Community indicators like smoking rates, poverty levels, and access to healthy foods are examined. The document concludes Marion county has greater needs based on a community indicator scorecard, making it the recommended target for childhood obesity funding.
This document summarizes oral health in Michigan and Kent County based on surveys and focus groups conducted by the Kent County Oral Health Coalition in 2015-2016. Key findings include:
- Access to dental care remains a challenge in Kent County, where over a quarter of adults have not visited a dentist in the past year. Barriers include cost of care and lack of dental insurance.
- Expansion of the Healthy Michigan Plan and Healthy Kids Dental in 2014 and 2015 increased dental coverage, but disparities still exist for vulnerable groups like seniors.
- Community surveys and focus groups found high treatment costs, poor insurance coverage, and lack of education are barriers to care for low-income residents in Kent
This document provides an evaluation report of the 2013-2016 Community Health Improvement Plan (CHIP 1.0) in Lane County, Oregon. It summarizes the plan's goals of improving health equity, preventing tobacco use and obesity, addressing mental health and substance abuse issues, and enhancing access to care. The report finds that while challenges remain, cross-sector collaboration increased over the three years, public health awareness grew, and accomplishments were made in all five priority areas. It concludes that continued collective action through the 2016-2019 CHIP 2.0 is needed to further reduce health disparities and improve population well-being in Lane County.
Similar to 2012 Herkimer County Risk Assessment Profile (20)
1. 2012 HERKIMER COUNTY
RISK ASSESSMENT PROFILE
Compiled by:
Herkimer County HealthNet, Inc.
&
Herkimer County Integrated County Planning
Cover Photo by Phyllis Spinner
2.
3. 2012 HERKIMER COUNTY RISK ASSESSMENT PROFILE
Dear Agency Director,
Presented here is a copy of the 2012 Herkimer County Risk Assessment Profile, a data-based
assessment of community strengths and challenges that affect the health and well being of
Herkimer County residents. The data included in the Profile gives us a snapshot of the level of risk
that exists in the community and the areas in which there is a need to work collaboratively to
improve outcomes.
The 2012 Profile was created by Herkimer County Integrated County Planning and Herkimer County
Health Net, Inc., in collaboration with the members of the Comprehensive Assessment Task Force.
It is an update to the previous Risk Assessment Profiles published in 2000, 2003, 2006 and 2009.
The 2012 Profile is organized utilizing the six Life Areas of the New York State Touchstones
model: Community, Citizenship, Physical and Emotional Health, Family, Economic Security, and
Education, and incorporates the New York State Department of Health’s Prevention Agenda’s
Priority Health Areas into the Physical and Emotional Health section of the document.
We hope that the 2012 Risk Assessment Profile provides information that will help your agency
assess the scale and scope of community needs. We also hope that it can be used as a resource as
you plan for services that impact the health and well-being of Herkimer County’s residents.
The 2012 Herkimer County Risk Assessment Profile is available for download in PDF format from
the Herkimer County HealthNet, Inc. website, www.herkimerhealthnet.com and the Herkimer
County website, www.herkimercounty.org.
If you have any questions or comments regarding the 2012 Risk Assessment Profile, please contact
Herkimer County Integrated County Planning or Herkimer County HealthNet, Inc.
Sincerely,
Darlene Haman Adam Hutchinson
Strategic Planning Coordinator Executive Director
Herkimer County Integrated County Planning Herkimer County HealthNet, Inc.
Co-Chair Comprehensive Assessment Task Force Co-Chair Comprehensive Assessment Task Force
4.
5. ACKNOWLEDGEMENTS
Herkimer County Integrated County Planning and Herkimer County HealthNet, Inc. would
like to acknowledge with appreciation the following individuals, agencies and planning
groups for their contributions to the development of the 2012 Risk Assessment Profile:
The Herkimer County Legislature and James Wallace, County Administrator, for their
leadership, vision and support of this initiative.
The Herkimer County Health Net, Inc. Board of Directors & the ICP Human Resource
Planning Team for their vision, leadership and financial support.
The members of the Comprehensive Assessment Task Force, for contributing their time
collecting, organizing, and interpreting the data collected.
The individuals, agencies and organizations which provided the data, narrative, and
commentary included in the Profile.
Thomas Dennison, PhD., and interns Jill Hayes and Sarah Irish of Maxwell School at
Syracuse University, for their work facilitating the six Profile Life Area Focus Groups,
and for compiling and presenting the Risk Factor prioritization results.
The many focus group participants who volunteered their time to provide valuable
insight into the issues that affect the residents of Herkimer County.
Matthew Clark, Herkimer County College Corps Program student intern, and Daniel
Adamek, student intern from the Regional Program for Excellence, for their assistance
with producing the document. Additional thanks to Tim Seymour and Linda Patten from
the Herkimer County Department of Social Services for their help securing the interns
for this project.
Phyllis Spinner and Bart Carrig for the use of their photos of Herkimer County which
are displayed on the cover and throughout the document.
Mary Scanlon, retired Director of the Herkimer County Office for the Aging, for her
hard work and dedication to this project.
The New York State Office of Children and Family Services and the Department of
Health - Charles D. Cook Office of Rural Health for their support of this initiative.
Without the support and collaboration of all the individuals and agencies listed above, the
creation of the 2012 Herkimer County Risk Assessment Profile would not have been
possible. Thank You.
i
6. Herkimer County Comprehensive Assessment Task Force (CATF)
Darlene Haman, Co-Chair
Strategic Planning Coordinator
Herkimer County Integrated County Planning
Adam Hutchinson, Co-Chair
Executive Director
Herkimer County HealthNet, Inc.
Mark Barbano
Regional Economist
New York State Department of Labor
Chip Bassett
Principal Planner
Herkimer—Oneida Counties Comprehensive Planning
Christopher Farber
Herkimer County Sheriff
Joanne Favat
Director of Services
Herkimer County Department of Social Services
Kathy Fox
Director
Herkimer County Office for the Aging
Gina Giacovelli
Director
Herkimer County Youth Bureau
Sandra Jones
(former) Supervisor, Special Programs for Children
Herkimer County Public Health
Dale Miller
Principal Planner
Herkimer—Oneida Counties Comprehensive Planning
Robin Robinson
Director of Community Investment
United Way of the Valley and Greater Utica Area
Ed Scudder
Director
Herkimer County Department of Mental Health
Josephine Sohnn
Supervisor
Herkimer County Probation
Carolyn Trimbach
Community Representative
Town of Webb
Mark Vivacqua
Superintendent
Herkimer County BOCES
Karin Zipko
Director
Herkimer County Employment & Training Adm.
ii
7. The 2009 Herkimer County Risk Assessment Profile is an update to the previous Risk
Assessment Profiles published in 2000, 2003 and 2006. It represents the collaboration
The 2012 Herkimer County Risk Assessment Profile is an update to the previous Risk
Assessment Profiles published in 2000, 2003, 2006 and 2009. The document is the
result of the collaboration between Herkimer County Integrated County Planning (ICP),
Herkimer County HealthNet, Inc. (HCHN) and the various agencies that make up the
Comprehensive Assessment Task Force. The data collected within the Profile gives a
snapshot of the level of risk that exists in Herkimer County and the areas in which there
is a need to work collaboratively to improve outcomes.
The 2012 Profile is organized in accordance with the six Life Areas of the New York
State Touchstones model; Community, Citizenship, Physical and Emotional Health, Family,
Economic Security, and Education. This format was also used in 2006 and 2009, and has
allowed for a more comprehensive look at the needs of Herkimer County residents than
the former structure used in 2000 and 2003. The 2012 Profile also incorporates the New
York State Department of Health’s Prevention Agenda’s Priority Health Areas into the
Physical and Emotional Health section of the document.
Background
HCHN has been in existence since 1990 when the Herkimer County Health Care
Consortium successfully applied for funding from New York State Department of Health
to establish itself as a Rural Health Network. Its membership comprised of
governmental agencies and health and human services providers, has as its mission to
improve the health and well being of Herkimer County residents.
In 1998, Herkimer County developed a collaborative, integrated planning process to
address the needs of children, youth, families and vulnerable adults. This ICP process has
worked to identify issues that affect the health and well-being of youth and families,
improve the coordination of human service delivery, reduce fragmentation and duplication
of effort, and make more efficient and effective use of federal, state, and local tax
dollars.
Input and involvement from the community is a vital component of ICP. Community
members, along with representatives from the areas of health, mental health, human
services, education and law enforcement, began meeting in January of 1999 to
collaboratively identify and respond to the needs of children, youth and families. The
Communities That Care model of risk-focused prevention was adopted as a strategic
planning tool to accomplish this goal.
Since 1999, ICP and HCHN have been working collaboratively to provide a comprehensive
assessment of health and human service needs in Herkimer County. They have co-chaired
iii
Introduction
8. the Comprehensive Assessment Task Force, whose mission is to assemble a diverse group
of stakeholders in government, health, education, and human services to facilitate
comprehensive long term planning geared to improve the quality of life for the residents
of Herkimer County.
In 2000, data - based predictors were collected and organized into the Communities That
Care format. Focus groups were held with community stakeholders, including youth, to
review data and identify priority needs. Out of the Risk Assessment process in 2000, five
risk factors emerged as priorities for Herkimer County:
In October 2000, the Herkimer County Risk Assessment Profile was published. Herkimer
County departments, service providers and various community groups began to discuss
ways to better support children, youth and families in order to address identified needs.
A Resource Inventory was created to identify gaps in services, and promising approaches
were researched that would reduce risks. Resources were allocated to address the
issues identified, and various grants were pursued to address major service gaps.
In March 2003, ICP again partnered with HCHN to update the data collected within the
original profile. An analysis of the 2003 Herkimer County Risk Assessment Profile
confirmed the need to address the five priority risk factors identified during the 2000
planning process. In addition, other risk factors were identified in 2003 as emerging
areas of concern: the Availability of Drugs, Lack of Commitment to School, and Alienation
and Rebelliousness. Herkimer County planning groups continued to meet to address these
concerns.
In 2006, HCHN and ICP partnered for the third time to create an updated Risk
Assessment Profile. The Touchstones format was used, which expanded the scale and
scope of the document and allowed for a more comprehensive look at the needs of
Herkimer County residents, particularly in the areas of community demographics, physical
and emotional health, the elderly, and children from birth to five. Herkimer County
planning groups utilized the information presented to establish goals and identify
strategies that reduced risks, addressed needs, and improved outcomes in their specific
areas of focus.
In 2009, the Touchstones format was utilized again with slight changes. The NYSDOH,
in partnership with federal, state and local partners, unveiled a new "Public Health
iv
Extreme Economic
Deprivation
Family Management
Family Conflict Early and Persistent Antisocial Behavior
Early Initiation of the Problem Behavior
9. Prevention Agenda for the Healthiest State" in 2009 which identified ten priorities for
improving the health of all New Yorkers and asks communities to work together to
address them.
These ten priorities were used to organize the data in the Physical and Emotional Health
Life Area of the Profile. In addition to this change, a Key Findings and Commentary
section was added at the end of each of the six Life Area sections within the Profile to
provide data highlights, key informant information and focus group summaries.
In 2012, the New York State Public Health Prevention Agenda was updated for the 2013-
2017 period. The updated Prevention Agenda will serve as a guide to local health
departments as they work with their community to develop mandated Community Health
Assessments and to hospitals as they develop mandated Community Service Plans and
Community Health Needs Assessments required by the Affordable Care Act over. Its ten
priority areas were condensed into the following five areas:
In addition to this change in 2012, a series of six Profile Life Area Focus Groups were
held to review the information included in the 2012 Risk Assessment Profile and to
identify priority areas of need. A new section was added to 2012 Risk Assessment Profile
summarizing these Focus Group results.
It is hoped that the 2012 Herkimer County Risk Assessment Profile will be utilized by
Herkimer County departments, service providers and various community groups to
identify strategies that reduce risks, address needs, and improve outcomes in their
specific areas of focus.
v
Access to Quality Health
Care
Chronic Disease
Community Preparedness Healthy Environment
Healthy Mothers, Healthy
Babies, Healthy Children
Infectious Disease
Mental Health and
Substance Abuse
Physical Activity and
Nutrition
Tobacco Use Unintentional Injury
Prevent chronic diseases Promote healthy and safe
environments
Promote healthy women,
infants and children
Promote mental health and
prevent substance abuse
Prevent HIV, sexually transmitted diseases, vaccine-
preventable diseases and healthcare-associated Infections
10.
11. Community Identified Priorities
A series of six Profile Life Area Focus Groups were held in March 2013 with community
stakeholders to review the data included in the 2012 Herkimer County Risk Assessment
Profile and identify priority needs. These six focus groups were facilitated by Dr. Thomas
Dennison, Maxwell School of Citizenship and Public Policy at Syracuse University, and
Interns Sarah Irish and Jill Hayes. Out of this process, the following areas listed below
emerged as priorities for Herkimer County.
Priority Areas of Focus Identified by Life Area
I. Community
Employment Opportunities
~ Limited options
Transportation
~ Access
Demographic Profile
~ Elderly population is increasing
Care-giving
~ Older adult
~ Child (day care)
Statewide Economic Climate
II. Citizenship
Programs for at-risk youth in Herkimer County are strong and have been
supported. The outcomes are clear. These programs, with an added emphasis
on literacy, should be nurtured.
Management of social media among youth should be redirected toward positive
social media and away from negative dimensions such as bullying and sexting
activities.
Economic conditions and their impact on citizenship issues such as:
DWI
Domestic violence
Adult incarceration
Retention of successful youth
Integrity of the family
vii
12. viii
III. Physical and Emotional Health
Access to Quality Health Care
Supply of Health Care Providers
~ Primary Care and Mental Health Care
Transportation
Prevent Chronic Disease
Obesity
~ Physical Activity and Nutrition
Tobacco Use
Promote Healthy and Safe Environments
Falls in the Elderly
Lead Exposure
Promote Healthy Women. Infants and Children
Dental Health
Unintended Pregnancy
~ Pregnancy and Sexual Activity among Youth
Promote Mental Health and Prevent Substance Abuse
Access to Mental Health Care Services
Drug Abuse
Prevent HIV, Sexually Transmitted Diseases, Vaccine-Preventable Diseases and
Healthcare-Associated Infections
Child Immunization Rates
Hospital-Acquired Infections
IV. Family
Domestic Violence
~ Economic well-being and stability
Homelessness
~ Access to Resources
~ Affordable housing options
Availability of Services
Family Wellness
~ Disintegration of the family
~ Parenting skills
Age Distribution
13. ix
~ Elderly population
~ Migration of youth
V. Economic Security
Opportunities
~ Jobs
~ Retention of qualified people in the community
Transportation
~ Access to healthcare and other vital needs
Categorical Benefits
~ Need for a continuous safety net of support services that are non-
stigmatized and adequately resourced
Motivation
~ Promotion of Values
Stigma Support
~ Support those who have difficulty requesting assistance with no stigma
VI. Education
Relationship of school, community, family
Proficiency and performance in school
School safety
Bullying
Pre-school and after-school activities and programs
These priority areas were presented to the ICP Leadership Committee and will be used
by this and other groups to identify strategies that reduce risks, address needs, and
improve outcomes in select areas of focus.
14.
15. Acknowledgements ................................................................................................................ i
Task Force Members ........................................................................................................... ii
Introduction.......................................................................................................................... iii
Community Identified Priorities ..................................................................................... vii
Life Areas
Community..........................................................................................................................1
History & Demographics ............................................................................................................. 1
Population by Age/Community .................................................................................................12
Older Adults in the Community.............................................................................................. 23
Housing......................................................................................................................................... 28
Religious Affiliation .................................................................................................................. 34
Transportation ........................................................................................................................... 36
Employment & Industry ........................................................................................................... 43
Quality of Life ........................................................................................................................... 52
Youth Perceptions of the Community.................................................................................... 59
Youth Development/Employment ........................................................................................... 63
Availability of Daycare..............................................................................................................71
Key Findings & Commentary .................................................................................................... 76
Citizenship......................................................................................................................80
Voting ........................................................................................................................................... 80
Engaged & Informed Citizens................................................................................................. 84
Youth Citizenship....................................................................................................................... 92
Firearms ...................................................................................................................................... 97
Table of Contents
16. Youth Arrests ...........................................................................................................................100
Adult Arrests & Convictions ..................................................................................................104
DWI..............................................................................................................................................111
Probation and Correctional Alternatives............................................................................. 115
Juvenile Delinquency................................................................................................................123
Persons in Need of Supervision (PINS) ..............................................................................126
Incarceration ............................................................................................................................130
Key Findings & Commentary ...................................................................................................134
Physical & Emotional Health.....................................................................................137
New York State Prevention Agenda.....................................................................................137
Access to Healthcare..............................................................................................................139
Prevent Chronic Disease ........................................................................................................ 151
Promote a Healthy & Safe Environment .............................................................................183
Promote Healthy Women, Infants, and Children .............................................................193
Promote Mental Health and Prevent Substance Abuse .................................................209
Prevent HIV, STD’s, Vaccine– Preventable Diseases & Healthcare Associated
Infections ................................................................................................................................227
Key Findings & Commentary .................................................................................................233
Family............................................................................................................................ 235
Household Composition...........................................................................................................235
Family Management.................................................................................................................247
Family Conflict ..........................................................................................................................261
Parental Attitudes & Family Norms ....................................................................................273
Key Findings & Commentary ..................................................................................................278
Economic Security ..................................................................................................... 282
Employment & Income ............................................................................................................282
Poverty (Extreme Economic Deprivation) ..........................................................................293
Economic Assistance for Basic Needs................................................................................300
Health Coverage .......................................................................................................................315
Key Findings & Commentary ..................................................................................................325
17. Education ..................................................................................................................... 328
K-12 Demographics & Environment......................................................................................328
Attendance & Completion Rates...........................................................................................338
Academic Proficiency .............................................................................................................343
Perceptions & Attitudes Towards School..........................................................................357
Continuing & Adult Education ...............................................................................................362
Continuing & Adult Education: Community College ...........................................................364
Key Findings & Commentary ..................................................................................................369
Appendices
Index of Tables & Graphs................................................................................................................374
Human Resource Planning Team of ICP........................................................................................390
Focus Group Participants ..................................................................................................................391
Understanding the U. S. Census American Community Survey ............................................397
18. Community
History & Demographics
Herkimer County is located in central New York State,
situated northwest of Albany and east of Syracuse. The
northern part of the county is in the Adirondack State Park,
and the Mohawk River flows across the southern part of the
county. Herkimer County is bordered by St. Lawrence County
to the north, Otsego County to the south, Hamilton, Fulton
and Montgomery Counties to the east, and Lewis and Oneida
Counties to the west.
Herkimer County is the longest county in New York State and
has the sixth largest land area (1,412 square miles). Forty-
seven square miles of the county is covered in water (3.23%).
The New York Agricultural Statistics Service estimates that
14% of the land (136,600 acres) is used in farming.
There are nineteen towns, ten villages and one city in Herkimer
County. The city of Little Falls has 4,946 residents and is
ranked 61st
in population out of the 62 cities in New York State.
The majority of the county’s population resides in the towns,
villages and city that surround the Mohawk River, referred to as
the Mohawk Valley Corridor. The county seat is the Village of
Herkimer, which is home to the county’s only community college.
The county is named after General Nicholas Herkimer, who died
from battle wounds in 1777 after taking part in the Battle of
Oriskany.
County History
When counties were established in New York State in 1683,
the present Herkimer County was part of Albany County.
This was an enormous county, including the northern part
of New York State as well as all of the present State of
Vermont and, in theory, extending westward to the
Pacific Ocean. This county was reduced in size on July 3,
1766 by the creation of Cumberland County, and further
on March 16, 1770 by the creation of Gloucester County,
both containing territory now in Vermont.
WHERE WE STAND
1
19. On March 12, 1772, what was left of Albany County was split into three parts, one remaining
under the name Albany County. One of the other pieces, Tryon County, contained the western
portion (and thus, since no western boundary was specified, theoretically still extended west to
the Pacific). The eastern boundary of Tryon County was approximately five miles west of the
present city of Schenectady, and the county included the western part of the Adirondack
Mountains and the area west of the West Branch of the Delaware River. The area then
designated as Tryon County now includes 37 counties of New York State. The county was named
for William Tryon, colonial governor of New York.
In the years prior to 1776, most of the Loyalists in Tryon County fled to Canada. General
Nicholas Herkimer’s force of 800 Palatines succeeded in holding off an attack of British and
Indians at Fort Stanwix in 1777, thereby protecting the Mohawk Valley. Fort Herkimer and
Fort Dayton provided protection for the settlers who were able to maintain their prosperous
farms at the end of the hostilities.
In 1784, following the peace treaty that ended the American Revolutionary War, the name of
Tryon County was changed to Montgomery County to honor the general, Richard Montgomery,
who had captured several places in Canada and died attempting to capture the city of Quebec,
replacing the name of the hated British governor.
In 1789, the size of Montgomery County was reduced by the splitting off of Ontario County
from Montgomery. The actual area split off from Montgomery County was much larger than the
present county, also including the present Allegany, Cattaraugus, Chautauqua, Erie, Genesee,
Livingston, Monroe, Niagara, Orleans, Steuben, Wyoming, Yates, and part of Schuyler and Wayne
Counties.
In 1791, Herkimer County was one of three counties split off from Montgomery (the other two
being Otsego and Tioga Counties). This was much larger than the present county, however, and
was reduced by a number of subsequent splits. These splits helped to form Onondaga, Oneida,
Chenango and St. Lawrence Counties.
Herkimer County assumed its present form in 1817. Herkimer County now extends from the
Adirondacks to the Mohawk Valley. The vast forests to the north provide wood products and
recreational opportunities in the Adirondack Park, while the southern valleys are favorable for
agriculture and dairying.
As westward expansion provided access to land more suitable for growing wheat, Herkimer
County farmers realized that dairying would be a more profitable use of their land. The lack of
a mass market for milk led to the production of cheese. By the 1850s, Little Falls was the
location of a world famous cheese market. Later the railroads gave access to the downstate
market for milk, and the cheese industry began to decline.
2
Community
History & Demographics
20. Salisbury Center Covered Bridge
The Erie Canal caused the development of large valley villages and provided a means to transport
goods east and west. The oldest Herkimer County industry, Remington Arms, still plays a major
role in the county’s economy. During the last 200 years, many products were produced in
Herkimer County including rifles, typewriters, farm equipment, furniture, textiles, shoes, data
recorders, bicycles, nutcrackers, paper, and dairying equipment. Immigrants from Ireland and
later from eastern and southern Europe arrived to work in local industries and agriculture,
providing a diversity of culture. (source: Herkimer County Historical Society)
Herkimer County’s rich history dates back hundreds of years. Many landmarks in Herkimer
County have been included in the National Register of Historic Places. A complete listing (as of
2011) is included below.
National Register of Historic Places — Listing For Herkimer County (2011)
• Village of Cold Brook—Cold Brook Feed Mill
• Town of Danube—Herkimer Home
• Town of Danube—Indian Castle Church
• Town of Danube—Mohawk Upper Castle Archeological District
• Town of Danube—Zoller-Frasier Round Barn (torn down)
• Village of Dolgeville—Alfred Dolge Hose Company No. 1
• Village of Dolgeville—Breckwoldt-Ward House
• Village of Dolgeville—Menge House Complex
• Village of Dolgeville—Dolge Company Factory Complex
• Village of Dolgeville—Post Office
• Town of Fairfield—Trinity Episcopal Church
• Town of Fairfield—Lalino Stone Arch Bridge (Route 29)
• Town of Fairfield—Old City Stone Arch Bridge
• Town of Frankfort—Balloon Farm
• Town of Frankfort—Frankfort Town Hall
• Town of Frankfort—Remington House
• Village of Frankfort—Post Office
• Town of German Flatts—Fort Herkimer Church
• Village of Herkimer—Herkimer County Court House
• Village of Herkimer—Herkimer County Historical Society
• Village of Herkimer—Herkimer County 1834 Jail
• Village of Herkimer—The Reformed Church of Herkimer
• Village of Herkimer—Post Office
• Town of Herkimer—Palatine German Frame House
• Village of Ilion—Remington Stables
• Village of Ilion—First United Methodist Church
• Village of Ilion—Thomas Richardson House
• Village of Ilion—Post Office
3
Community
History & Demographics
21. Herkimer County Court House
• City of Little Falls—Herkimer County
Trust Company Building (Little Falls
Historical Society)
• City of Little Falls—Post Office
• Town of Manheim—Snells Bush Church
and Cemetery
• Village of Newport—Benjamin Bowen
House
• Village of Newport—Newport Stone
Arch Bridge
• Village of Newport—Yale-Cady
Octagon House and Yale Lock Factory
Site
• Village of Newport—Masonic Temple—
Newport Lodge No 445 F. & A.M.
• Town of Norway—Norway Baptist
Church
• Town of Russia—Russia Corners
Historic District
• Town of Salisbury—Salisbury Center
Covered Bridge
• Town of Salisbury—Salisbury Center
Grange Hall
• Town of Salisbury—Augustus Frisbie House
• Town of Warren—Jordanville Public Library
• Town of Warren—Church of the Good Shepherd
• Town of Warren—Sunset Hill
• Town of Webb—Covewood Lodge
• Town of Webb—Goodsell Memorial Home (Town of Webb Historical Association)
Source: Herkimer County Historical Society (County History & National Register)
Population and Demographics
The table on the following page depicts Herkimer County demographics from both the 2000 and
2010 U.S. Census.
According to the 2010 U.S. Census, there were 64,519 people living in Herkimer County, an
increase of approximately 0.1%, or 92 residents, since 2000. This population ranked 40th
out of
the 62 counties in New York State. The percentage of males and females in the population have
remained relatively consistent during this time period. There has also been a slight increase in
the median age between 2000 and 2010.
4
Community
History & Demographics
22. Age
As illustrated in the chart below, the population of Herkimer County tends to be slightly older
than that of New York State and the United States.
Race and Ancestry
Herkimer County is less diverse when compared with NYS and the U.S. in the categories of race
and ancestral heritage.
5
Table 1Herkimer County Demographics: 2000 & 2010 Census
Table 2Herkimer County, NYS and US by Age: 2010 Census
Herkimer County NYS US
Population 64,519 19,370,102 308,745,538
Median Age 42.1 years 38.0 years 37.2 years
Under Age 5 5.6% 6.0% 6.5%
5 to 19 years 20.0% 19.4% 20.4%
20 to 34 years 16.1% 21.0% 20.3%
35 to 54 years 27.7% 28.4% 27.9%
55 to 74 years 22.4% 18.9% 18.8%
75 and above 8.2% 6.5% 6.0%
Source: U.S. Census Bureau, 2010 Census Summary File 1, Tables P12 & P13
2000 U.S. Census Percent 2010 U.S. Census Percent
Population 64,427 100% 64,519 100%
Male 31,248 48.5% 31,579 48.9%
Female 33,179 51.5% 32,940 51.1%
Median Age 39 — 41.2 —
Total Households 25,734 100% 26,324 100%
Average Household Size 2.46 — 2.40 —
Family Households 17,101 66.5% 16,871 64.1%
Average Family Size 2.99 — 2.95 —
Source: U.S. Census Bureau, 2000 & 2010 Census
Community
History & Demographics
23. Income and Poverty
The median incomes for Herkimer County are decreasing, and incomes remain lower in the county
than in NYS and the U.S. The percentage of individuals who make over $100,000 per year has
nearly tripled since 2000 (from 3.7% to 10.4%), but this percentage continues to be much lower
than the state and US percentages in the same time period.
6
Source: U.S. Census Bureau, 2000 & 2010 Censuses and 2008–2010 American Community Survey—all tables this page
Table 3Herkimer County, NYS and US by Race and Ancestry
Herkimer County NYS US
Population 64,519 19,370,102 308,745,538
White 96.6% 65.7% 72.4%
Black or African American 1.1% 15.9% 12.6%
Asian 0.5% 7.3% 4.8%
Some Other Race 0.6% 8.1% 7.3%
Two Races 1.2% 3.0% 2.9%
Hispanic or Latino (any race) 1.6% 17.6 16.3%
Ancestry Top 5 in HC
Irish 13.9% 8.7% 7.2%
Italian 13.8% 11.5% 4.4%
German 13.3% 6.8% 11.2%
English 8.1% 3.6% 5.9%
Polish 5.7% 3.5% 2.1%
Herkimer County New York State United States
2000* 2008–2010 2000* 2008–2010 2000* 2008–2010
Median H.H. Income $43,092 $42,318 $56,795 $55,603 $54,964 $51,914
Per Capita Income $21,126 $21,908 $30,613 $30,948 $28,254 $27,334
<$10,000 11.4% 7.7% 11.5% 8.1% 9.5% 7.2%
<$25,000 38.2% 28.3% 29.6% 23.4% 28.6% 23.5%
$100,000+ 3.7% 10.4% 15.3% 13.2% 12.3% 20.9%
Table 4Herkimer County, NYS and US by Income
* 2000 incomes have been adjusted for inflation.
Community
History & Demographics
24. According to the 2008–2010 American Community Survey, the percentage of families and
individuals in poverty in Herkimer County are relatively similar to the percentages recorded for
both NYS and the U.S.
Households and Families
According to the 2008–2010 American Community Survey, there are 26,478 households and
17,365 families in Herkimer County. 30.9% of all families include children below the age of 18.
7
Table 5Percent of Persons Living Below Poverty: Herkimer County, NYS, US
1990 2000
HC
2008–2010
NYS
2008–2010
US
2008–2010
Families 8.7% 8.9% 10.3% 11.0% 10.5%
Individuals 13.1% 12.5% 14.6% 14.4% 14.4%
Children (<18) 16.8% 16.1% 21.2% 20.3% 20.1%
Adults (18–64) 14.8% 11.7% 12.9% 13.0% 13.1%
Seniors (65+) 13.9% 10.4% 11.9% 11.4% 9.4%
Source: U.S. Census Bureau, 1990 & 2000 Censuses and 2008–2010 American Community Survey
2000 2008–2010
Population 64,427 64,519
Households 25,734 26,478
Average Household Size 2.46 2.38
Families 17,101 17,365
Average Family Size 2.99 2.93
Households With Children <18 32.8% 30.9%
Source: U.S. Census Bureau, 2000 Census and 2008–2010 American Community Survey
Table 6Herkimer County Households and Families
Community
History & Demographics
25. Number of Farms and Acreage Used in Farming, Herkimer County
Agriculture and Farming
Herkimer County is rich in scenic beauty and historical roots that are closely tied to agriculture.
Historical perspective: Throughout the eighteenth and nineteenth centuries, farming was the
primary livelihood of the majority of the county’s residents and thus a major force in its
economic life. In the eighteenth century, 90 percent were farmers; by 1900, 30 percent were
employed in agriculture or agriculture-related industries. In 1991, less than 2 percent of the
population of the county worked at farming.
Herkimer County dairy farms numbered 1,433 in 1941 with 36,800 cows (an average of 26 cows
per farm) and in 1991 fell to 378 dairy farms, with 23,000 cows (average 61 cows). In 1960,
1,100 producers were shipping over 260 million pounds of milk a year (about 30.5 million gallons).
By 1990, despite far fewer farms, production was still over 400 million pounds of milk a year,
maintaining Herkimer County’s long standing place among the top dozen dairy counties in New
York milkshed. In that year, Herkimer County’s agricultural production totaled more than
$55 million. (Source: “Herkimer County at 200” published by the Herkimer County Historical
Society 1992)
Present Day: Farming is an important aspect of the economy, culture, and way of life in
Herkimer County. According to the 2010 New York State Agricultural Statistics, there were
675 farms and 136,600 farmed acres in Herkimer County, accounting for 14% of the total land
area in the county. Dairy farming is the dominant agricultural activity in Herkimer County. The
1997 Census of Agriculture reported a total of 583 farms of which 46%,or 267 farms, involved
dairy cattle and milk production.
Farming activities are located almost exclusively within the southern portion of the county
outside of the Adirondack Park. It is important to note that a significant portion of the county
is located within the Adirondack Park (555,690 out of 931,923 total acres) where the majority
of the land is forested with little agricultural activity. Approximately 41% of the total acreage
of all lands south of the Adirondack Park is farmland.
Information from the NYS Agricultural Statistics suggests that there has been a decrease in
the number of farms and land used in farming in Herkimer County between 2000 and 2010.8
Source: 2000 and 2010 NYS Agricultural Statistics
2000 2002 2010
Number of Farms 710 690 675
Land in Farms 154,200 acres 159,258 acres 136,600 acres
Average Size of Farm 217 acres 231 acres 243 acres
Table 7
Community
History & Demographics
26. The number of dairy farms
in Herkimer County as of
2007 was 187 with the
value of milk and other
dairy products for 2007 at
$47,597,000.
In 2007, the market value
of Herkimer County
agricultural products sold
was $62,141,000. Total
farm production expenses
were approximately
$48,385,000, and net farm
income was an average of
$25,224 per farm. The
chart to the left
illustrates the top
livestock and the value of
sales in 2007.
Challenges Facing Herkimer County Dairy Farmers and Trends for 2013
While stress has always been part of farm family life, the depressed economy, cost of producing
milk for dairy farmers, and the resulting increased stress on family members is placing demands
on area farmers. Call volume at New York State FarmNet, a program that provides support to
farming families, continues at high levels with over 6,000 contacts each year. More men are
calling for help from family consultants at FarmNet; where, in the past, more women called for
this support. Divorce rates are also increasing in the farm community. And with the challenging
weather conditions during the summer of 2012, many farmers had lower harvests, so meeting
forage needs this winter will be a major concern.
Government Structure and Legislative Districts
Herkimer County has 17 legislative districts. The Chairman of the Legislature is the Chief
Elected Officer in Herkimer County. Herkimer County is one of nineteen Charter counties in
New York State, and is one of twenty-two counties in New York State that employs a County
Administrator. The Herkimer County Administrator is appointed by, and is responsible to, the
Legislature and handles all the administrative operations of the county.
Portions of Herkimer County are included in the 49th
and 51st
Districts of the New York State
Senate and the 101st
,117th
, and 118th
Districts of the New York State Assembly. At the federal
level, sections of the county are included in the 21st
and 22nd
Congressional Districts of the U.S.
House of Representatives.
9
Top Livestock and Value of Sales, Herkimer County
Source: 2007 Census of Agriculture County Profile
2007 Quantity State Rank
Top Livestock (number)
Cattle and Calves 29,162 23
Pigeons or Squab 7,009 2
Layers 4,995 25
Colonies of Bees 4,449 2
Top Value of Sales by Commodity Group ($)
Milk and Other Dairy 47,597,000 20
Crops and Hay 3,065,000 22
Vegetables, melons, potatoes and sweet
potatoes
2,213,000 30
Grains, Oil Seeds, Dried Beans and Peas 1,558,000 35
Nursery, Greenhouse and Sod 536,000 48
Table 8
Community
History & Demographics
27. Expenditures Per Capita
The table below illustrates the expenditures and debt per capita for Herkimer County, with
benchmark comparisons to upstate small counties, the Mohawk Valley region, and New York
State (minus NYC).
Herkimer County spent approximately $559 less per capita than the average upstate small
county in 2010. Expenditures for public safety and contributions to employee benefits were
ranked among the lowest in the Mohawk Valley region and in New York State. Debt, taxes per
capita and government expenditures were also lower in Herkimer County than in comparable
counties.
10
Source: Office of State Comptroller, with further calculations by the Public Policy Institute, research affiliate of The Business Council
of New York State, and the Empire Center for New York State Policy
Herkimer
County
Upstate Small
County
Average
Upstate County
Rank
(out of 50)
Mohawk Valley
Region Rank
(out of 6)
NYS Rank
(minus NYC
57 Counties)
2007 2010 2007 2010 2007 2010 2007 2010 2007 2010
Total Expenditures
Per Capita
$1,535 $1,695 $1,961 $2,254 45 43 6 6 50 53
Effective Property
Tax rate
0.60% 0.51% 0.75% 0.68% 33 36 5 5 33 36
Debt Per Capita $134 $132 $409 $484 40 43 3 3 47 50
Taxes Per Capita $841 $862 $908 $930 32 31 4 4 38 38
Total Revenues Per
Capita
$1,563 $1,505 $1,958 $2,048 43 47 5 6 48 53
General Government
Per Capita
$248 $237 $306 $325 37 41 6 6 43 46
Education Per Capita $138 $84 $71 $72 2 21 1 2 5 26
Public Safety Per
Capita
$109 $97 $162 $172 49 48 6 6 56 55
Social Services Per
Capita
$505 $460 $491 $500 27 31 3 4 28 33
Economic Development
Per Capita
$15 $23 $21 $20 20 17 3 3 22 19
Culture and
Recreation Per Capita
$12 $12 $12 $13 20 21 1 3 26 27
Employee Benefits Per
Capita
$134 $160 $264 $320 46 45 5 5 53 52
Table 9
Herkimer County Benchmarks: 2007 & 2010 Expenditures, Tax Rates and Debt Per Capita
Community
History & Demographics
28. DATA SOURCES
In 2007, Herkimer County’s expenditures for education (instruction, pupil services,
transportation and the community college) were almost twice the average expenditure of similar
counties, and ranked #1 in the Mohawk Valley region, #2 for all upstate counties, and #5 in New
York State (excluding NYC). Since then, expenditures have fallen towards the average: the
county’s rank among other upstate counties has fallen to #21, and its rank among the rest of
New York State (excluding NYC) has fallen to #26. Since 2007, Herkimer County’s ranking in
Public Safety per Capita, Economic Development per Capita, and Employee Benefits per Capita
have slightly increased; however, between 2009 and 2010 a majority of rankings have declined.
2007 Census of Agriculture Herkimer County Profile
Empire Center for New York State Policy
http://seethroughny.net/benchmarking-ny/#/single?id=210100000000&date=2010
Herkimer County Historical Society: “Herkimer County at 200”
http://www.rootsweb.com/~nyhchs/history.html
http://legislators.com/congressorg/officials/locality/?entity_id=2620&state=NY
Mohawk Valley Community Action Agency
http://mvcaa.com/userfiles/images/hc%20map.jpg
National Association of Counties
http://www.naco.org/Template.cfm?Section=Find_a_County&Template=/cffiles/counties/
state.cfm&statecode=ny
New York Agricultural Statistics Service
New York State Association of Counties
http://www.nysac.org/pdf/countygovernmentorganization.pdf
New York State Office of Comptroller
NYS Dairy Statistics 2008 Annual Summary from NYS Department of Agriculture and Markets
Division of Milk Control and Dairy Services
http://www.agmkt.state.ny.us/
“Stress Among Farmers” article for “Farming …the Journal of Northeast Agriculture”,
December 2009 issue.
Public Policy Institute
U.S. Census Bureau
11
Community
History & Demographics
29. The place where a family resides can impact activities of daily living, including children and
families accessing health services and day care, youth engaging in activities, adults commuting to
work and shopping venues, and seniors accessing valuable supports and services.
Understanding population trends can help communities plan for needed services and supports for
their residents.
Population Trends
Herkimer County has seen a slight increase in population between 1950 and 2010. The overall
population in Herkimer County has risen by 3,112 people, or 5.1%, over the last six decades.
Between 1950 and 1970, the population in Herkimer County increased by over
6,200 people (10%).This was followed by a 3,100 persons decline (5%) between 1970 and 2010.
The median age of Herkimer County residents has changed considerably over the last 50 years.
This change has not, however, simply been one of a stagnantly aging population. As a matter of
fact, the median age of the population actually declined for a period of twenty years, from 1950
to 1970. During those 20 years, the median age dropped from 33.6 in 1950 to 31.1 in 1970.
After 1970, the median age began to climb, rising to the 2010 level of 42.1 years.
WHY THIS IS IMPORTANT
WHERE WE STAND
12
61,407
66,370
67,633
66,714
65,797
64,427 64,519
56,000
58,000
60,000
62,000
64,000
66,000
68,000
70,000
1950 1960 1970 1980 1990 2000 2010
Herkimer County Population
1950–2010
Graph 1
Source: U.S. Census Bureau, 1950–2010 Censuses
Community
Population by Age/Community
30. Source: Herkimer-Oneida Counties Comprehensive Planning Program
The median age of females in Herkimer County has been consistently higher than that of males
between 1960 and 2010.
The advance of the “baby boomers” among age cohorts has clearly led to an aging population
within Herkimer County. With the current median age at 42.1 years, the baby boomer population
has made its transition from young adulthood to middle age felt.
Year
Median Age
Male
Median Age
Female
Median Age
All
1950 — — 33.6
1960 32.1 34.0 33.0
1970 29.1 33.3 31.1
1980 30.5 33.9 32.2
1990 33.9 36.7 35.3
2000 37.7 40.2 39.0
2010 41.1 43.1 42.1
Table 10Median Age of Males & Females (1950–2010)
13
33.6 33.0
31.1 32.2
35.3
39.0
42.1
0
10
20
30
40
50
1950 1960 1970 1980 1990 2000 2010
Herkimer County Median Age
1950–2010
Source: U.S. Census Bureau, 2010 Census
Graph 2
Community
Population by Age/Community
31. More than half (57.7%) of the
county’s population is between
the age of 20 and 64. In
addition, almost one in six
county residents (16.8%) are
age 65 or older. About one out
of every five people (19.9%) in
Herkimer County is between
ages 5 and 19. The county’s
youngest cohort, those age 5
and under, makes up 5.6% of
the total population.
The growth of the county’s
elderly population (those age
65 and older) has increased
significantly since 1950. While about 7,000 persons were in this category at the midway point
of the last century, by its end this age group had grown to about 11,000 persons, an increase of
nearly 60%.
In contrast, the population of children under the age of five has decreased from 6,268 in 1950
to 3,592 in 2010, a decline of 42.7%.
Source: U.S. Census Bureau, 2010 Census Summary File 2, Table PCT3
Source: U.S. Census Bureau, 1950–2010 Censuses
1950 1960 1970 1980 1990 2000 2010
Under 5 6,268 6,947 5,686 4,583 4,502 3,591 3,592
65 Plus 6,839 8,383 8,440 9,265 11,069 10,844 10,856
0
2,000
4,000
6,000
8,000
10,000
12,000
Trends Among Selected Age Groups
1950–2010
14
Graph 4
Under 5,
5.6% 5 to 19,
19.9%
20 to 64,
57.7%
65 and over,
16.8%
Herkimer County Population by Age
Graph 3
Community
Population by Age/Community
32. Table 11Herkimer County Births By Municipality 2002 to 2010
Between 2002 and 2010, approximately 6,100 children were born in Herkimer County. The city
of Little Falls and the towns of Newport and German Flatts (includes the village of Ilion) have
experienced an increase in births during this time period. Conversely, the town of Schuyler has
seen the greatest decline in the number of births recorded. The live birth rate (the number of
pregnancies continued to live births) has actually increased during this timeframe.
While Herkimer County’s birth rate is slightly below that of the rest of Upstate New York, out
of wedlock births are above New York State rates. In 2010, 51% of all births in Herkimer Coun-
ty were to unmarried mothers.
Source: NYS Department of Health, Vital Statistics of NYS 2010, Table 55
15
City 2002 2003 2004 2005 2006 2007 2008 2009 2010
Little Falls 53 65 63 65 69 70 65 57 55
Town 2002 2003 2004 2005 2006 2007 2008 2009 2010
Columbia 15 22 19 20 18 17 19 8 17
Danube 10 9 13 12 2 9 8 16 7
Fairfield 13 19 20 21 19 21 18 17 13
Frankfort 74 70 87 65 62 76 62 62 65
German Flatts 140 170 158 147 158 170 147 170 162
Herkimer 109 113 113 114 91 115 97 110 106
Litchfield 13 15 20 16 17 21 16 13 15
Little Falls 17 13 7 12 14 14 14 12 9
Manheim 38 32 36 26 37 40 35 41 29
Newport 14 25 18 24 24 30 24 28 23
Norway 7 7 10 6 12 8 8 3 9
Ohio 16 12 11 6 6 6 10 4 7
Russia 33 19 29 27 21 28 27 23 23
Salisbury 30 31 20 26 23 20 24 17 15
Schuyler 50 32 32 21 30 21 32 36 22
Stark 10 7 7 6 8 10 6 6 17
Warren 8 11 13 14 12 8 9 17 8
Webb 18 9 14 12 11 10 6 12 10
Winfield 19 33 24 31 17 17 19 19 23
Towns Total 634 649 651 606 582 641 581 614 580
County Total 687 714 714 671 651 711 646 671 635
Community
Population by Age/Community
33. Source: NYS Department of Health, Vital Statistics of NYS, Table 7
Table 13Live Births in Herkimer County by Mother’s Age 2000–2010
Table 12
16
Village 2002 2003 2004 2005 2006 2007 2008 2009 2010
Cold Brook 5 3 4 2 2 4 4 5 2
Dolgeville 27 21 23 16 25 32 24 25 18
Frankfort 31 25 38 28 27 32 28 27 26
Herkimer 84 95 94 89 78 101 81 87 91
Ilion 89 117 108 104 109 119 106 109 114
Middleville 0 8 2 5 0 8 6 9 5
Mohawk 25 28 30 25 31 35 25 40 30
Newport 4 6 3 6 6 8 9 6 9
Poland 6 5 7 8 3 12 7 7 9
West
Winfield
2 10 14 12 5 10 8 8 11
Source: NYS Department of Health, Vital Statistics of NYS 2010, Table 55
Herkimer County Births By Village 2002 to 2010
The table below illustrates the number of live births in Herkimer County by mother’s age
between 2000 and 2010. The number of births to teen mothers ages 15–17 have decreased by
67% during this timeframe, and births to mothers ages 18–19 have been reduced by 42%. Births
to mothers over age 30 have also decreased, from 297 births in 2000 to 218 births in 2010, a
decline of almost 27%.
2000 2001 2002 2003 2004 2005 2006 2007 2008 2009 2010
<15 2 2 1 1 2 2 0 2 0 0 0
15–17 46 17 26 32 22 12 13 16 20 23 15
18–19 83 45 44 54 70 43 40 44 34 50 48
20–24 202 219 189 204 198 196 197 192 188 177 171
25–29 218 185 187 200 194 194 204 219 176 200 183
30–34 173 143 155 132 128 127 132 148 148 144 143
35–39 102 48 66 61 62 71 51 73 63 61 60
40–44 21 11 13 17 20 26 14 17 15 14 14
45+ 1 2 0 1 2 1 0 0 2 2 0
NS 0 0 1 0 0 0 0 0 0 0 1
Community
Population by Age/Community
34. Graph 5
17
Out of Wedlock Births v. Births to Wedded Mothers
Herkimer County has a high ratio of unwed women giving birth as a component of total live births
in the county each year. In 2010, 51% of all births in Herkimer County were to unmarried
mothers. This exceeded the 42% New York State and 39% Rest of State rates for that year.
Households headed by single mothers, on average, have a lower median household income than
either male headed households or household with two parents. (Please refer to the “Economic
Security” section of this document for additional information)
The Decline of Herkimer County Post-College and Early Employment Cohorts
This drain on the area’s young people appears to be something that has been going on for at least
the last 30 years and is of great concern to Herkimer County families and communities.
In the chart on the next page, six age cohorts are shown as they existed in one census, and then
re-examined at the time of the following census. These cohorts include:
• Cohort A—youth age 10 to 14 in 1980, who would be ages 20 to 24 in the 1990 census
• Cohort B—youth age 15 to 19 in 1980, who would be ages 25 to 29 in the 1990 census
• Cohort C—youth age 10 to 14 in 1990, who would be ages 20 to 24 in the 2000 census
• Cohort D—youth age 15 to 19 in 1990, who would be ages 25 to 29 in the 2000 census
• Cohort E—youth age 10 to 14 in 2000, who would be ages 20 to 24 in the 2010 census
• Cohort F—youth age 15 to 19 in 2000, who would be ages 25 to 29 in the 2010 census
Source: NYS Department of Health, Vital Statistics of NYS, Table 10
2004 2005 2006 2007 2008 2009 2010
Out of Wedlock Births 303 257 295 294 287 313 324
Births to Wedded Mothers 395 415 356 417 359 358 311
57%
62%
55% 59% 56% 53%
49%
43%
38%
45% 41% 44% 47%
51%
0%
10%
20%
30%
40%
50%
60%
70%
80%
90%
100%
Community
Population by Age/Community
35. The Decline of Herkimer County Post-College and Early Employment Cohorts:
A Comparison of Cohort Changes Between Censuses (1980–90, 1990–2000 and 2000–10)
In each case, the cohorts experienced considerable losses over each 10 year period. These
losses are higher than for other cohorts found in either of the censuses. As Cohort A aged
between 1980 and 1990, their number shrank by more than a quarter (28%). During the same
time period, Cohort B (youth aged 15 to 19 in 1980) also lost 28% of their members. What this
suggests is that as young people age 10 to 19 grew older through the decade of the 1980s, many
chose to leave the area. By the time they reached the ages of 20 to 29, which represents
primarily post-college and early employment ages, these two cohorts were only three quarters
the size they had been in 1980.
This same pattern holds true in the 1990s for Herkimer County youth as well. As youth 10 to 14
years old (Cohort C) and 15 to 19 years old (Cohort D) aged through the period from 1990 to
2000, they appear to have left the area in large numbers. Between 1990 and 2000, Cohort C
lost more than a quarter of its members, dropping by 26%. The area lost almost 30% of Cohort
D’s members as they aged and the decade came to a close.
When reviewing the Cohort data for 2000 (Cohorts E and F), the same trend continues with
population losses recorded between 2000 and 2010 of approximately 25% within each age range.
The data shows remarkable consistency in the county’s loss of its post-college and early
employment populations as they entered their twenties from 1980 through the year 2010.
18
Source: Herkimer-Oneida Counties Comprehensive Planning Program
Age10to14in1980
Age15to19in1980
Age20to24in1990
Age25to29in1990
Age10to14in1990
Age15to19in1990
Age20to24in2000
Age25to29in2000
Age10to14in2000
Age15to19in2000
Age20to24in2010
Age25to29in2010
0
1000
2000
3000
4000
5000
6000
7000
Cohort A Cohort B Cohort C Cohort D Cohort E Cohort F
Graph 6
Community
Population by Age/Community
36. Population by Municipality
There are 19 towns, 10 villages and one city that lie within Herkimer County’s borders. The
chart below illustrates the percentage of Herkimer County residents that live in these various
areas. One-half of all residents that
live in Herkimer County reside in
towns. The remaining half resides in
villages (41%) and in the City of Little
Falls (8%). Approximately 56% of the
total population resides along the
valley corridor in the Town of German
Flatts (which includes the villages of
Ilion and Mohawk), the Town of
Herkimer (which includes the village of
Herkimer), the Town of Frankfort
(which includes the village of
Frankfort), and the City of Little Falls.
Herkimer County Age and Municipality Data Census 2000 & 2010
TOWNS
and CITY
5 and
under 6 to 18 19 to 64
65 and
over
2010
TOTAL
2000
TOTAL
% Change
2000–2010
Columbia 86 271 997 226 1,580 1,604 -1.5%
Danube 55 185 649 150 1,039 1,104 -5.9%
Fairfield 93 300 998 236 1,627 1,643 -1.0%
Frankfort 359 1365 4672 1,240 7,636 7,478 2.1%
German Flatts 824 2,264 8,039 2,131 13,258 13,657 -2.9%
Herkimer 554 1,322 6,265 2,034 10,175 9,944 2.3%
Litchfield 94 260 970 189 1,513 1,436 5.4%
Little Falls City 309 812 2,927 898 4,946 5,160 -4.1%
Little Falls 77 288 972 250 1,587 1,541 3.0%
Manheim 215 599 1,980 540 3,334 3,170 5.2%
Newport 135 445 1,398 324 2,302 2,198 4.7%
Norway 41 135 489 97 762 669 13.9%
Ohio 40 160 666 136 1,002 911 10.0%
Russia 155 427 1,607 398 2,587 2,473 4.6%
Salisbury 111 388 1,211 248 1,958 1,954 0.2%
Schuyler 157 524 2,086 653 3,420 3,403 0.5%
Stark 55 131 459 112 757 764 -0.9%
Warren 61 214 683 185 1,143 1,175 -2.7%
Webb 50 220 1,100 437 1,807 1,937 -6.7%
Winfield 121 396 1,197 372 2,086 2,206 -5.4%
TOTAL 3,592 10,706 39,365 10,856 64,519 64,427 0.1%
Table 14
Source: U.S. Census Bureau, 2010 Census
19
City, 8%
Village, 41%
Town (minus
village
residents),
51%
Place of Residence:
Herkimer County, 2010 Graph 7
Source: U.S. Census Bureau, 2000 & 2010 Censuses
Community
Population by Age/Community
37. Racial Composition by Municipality
The table below depicts the racial composition of Herkimer County as recorded in the 2000 and
2010 U.S. Census.
According to the 2010 Census, 96.6% of Herkimer County residents are white. Herkimer County
has seen an increase in racial diversity in its population between 2000 and 2010, however, with
an increase in residents reporting that they are Black or African American, Hispanic or Latino,
or multiple races. The communities along the valley corridor are the most racially diverse.
20
Table 15
Race
Total Single White
Black or African
American Other Multiple Hispanic or
Population Race (only) (only) (only) Race Latino
2000 2010 2000 2010 2000 2010 2000 2010 2000 2010 2000 2010 2000 2010
Herkimer County 64,427 64,519 63,886 63,740 63,031 62,320 329 700 526 720 541 779 580 1,040
CITIES
Little Falls 5,188 4,946 5,138 4,865 5,073 4,788 15 31 50 46 50 81 28 71
TOWNS (Include village populations)
Columbia 1,630 1,580 1,618 1,557 1,606 1,533 1 9 12 15 12 23 6 21
Danube 1,098 1,039 1,088 1,032 1,064 1,023 9 1 10 8 10 7 10 5
Fairfield 1,607 1,627 1,591 1,611 1,582 1,599 6 7 16 5 16 16 4 15
Frankfort 7,478 7,636 7,392 7,533 7,323 7,418 37 52 86 63 86 103 76 100
German Flatts 13,629 13,258 13,487 13,066 13,339 12,757 80 158 142 151 142 192 196 267
Herkimer 9,962 10,175 9,906 10,038 9,646 9,480 97 360 56 198 56 137 117 279
Litchfield 1,453 1,513 1,446 1,497 1,433 1,485 1 6 7 6 7 16 9 17
Little Falls 1,544 1,587 1,538 1,572 1,521 1,548 4 7 6 17 6 15 4 14
Manheim 3,171 3,334 3,144 3,313 3,103 3,249 11 13 27 51 27 21 22 38
Newport 2,192 2,302 2,180 2,271 2,165 2,249 9 13 12 9 12 31 18 18
Norway 711 762 705 762 704 757 0 1 6 4 6 0 3 15
Ohio 922 1,002 918 997 894 980 5 2 4 15 4 5 5 7
Russia 2,487 2,587 2,474 2,569 2,431 2,546 8 2 13 21 13 18 11 26
Salisbury 1,953 1,958 1,935 1,942 1,921 1,917 3 4 18 21 18 16 3 37
Schuyler 3,385 3,420 3,356 3,393 3,316 3,346 17 14 29 33 29 27 21 48
Stark 767 757 766 753 760 731 3 6 1 16 1 4 2 12
Warren 1,136 1,143 1,118 1,128 1,103 1,119 7 4 18 5 18 15 15 3
Webb 1,912 1,807 1,899 1,785 1,873 1,764 13 9 13 12 13 22 17 20
Winfield 2,202 2,086 2,187 2,056 2,174 2,031 3 1 15 24 15 30 13 27
Source: U.S. Census Bureau, Census 2000 Summary File 1, Tables P7 & P8
U.S. Census Bureau, 2010 Census Summary File 1, Tables P5 & P8
Municipalities by Race, 2000 & 2010 Census
Community
Population by Age/Community
38. Population Changes by Municipality
Herkimer County has seen an overall population increase of 0.1% between 2000 and 2010. The
chart below depicts the population changes within each municipality during this time period.
Herkimer County Population Changes (2000–2010)
Source: Herkimer-Oneida Counties Comprehensive Planning Program
Table 16
21
NAME 2000 2010 % CHG # CHG
Herkimer County 64,427 64,519 0.14% 92
CITIES
Little Falls 5,188 4,946 -4.66% -242
TOWNS
Columbia 1,630 1,580 -3.07% -50
Danube 1,098 1,039 -5.47% -59
Fairfield 1,607 1,627 1.24% 20
Frankfort 7,478 7,636 2.11% 158
German Flatts 13,629 13,258 -2.72% -371
Herkimer 9,962 10,175 2.14% 213
Litchfield 1,453 1,513 4.13% 60
Little Falls 1,544 1,587 2.78% 43
Manheim 3,171 3,334 5.14% 163
Newport 2,192 2,302 5.02% 110
Norway 711 762 7.17% 51
Ohio 922 1,002 8.68% 80
Russia 2,487 2,587 4.02% 100
Salisbury 1,953 1,958 0.26% 5
Schuyler 3,385 3,420 1.03% 35
Stark 767 757 1.30% -10
Warren 1,136 1,143 0.62% 7
Webb 1,912 1,807 -5.49% -105
Winfield 2,202 2,086 -5.27% -116
VILLAGES
Cold Brook 336 329 -2.08% -7
Dolgeville* 2,066 2,206 6.78% 140
Frankfort 2,537 2,598 2.40% 61
Herkimer 7,498 7,743 3.27% 245
Ilion 8,610 8,053 -6.47% -557
Mohawk 2,660 2,731 2.67% 71
Middleville 550 512 -6.91% -38
Newport 640 640 0.00% 0
Poland 451 508 12.64% 57
West Winfield 862 826 -4.18% -36
* Herkimer County portion only
Community
Population by Age/Community
39. DATA SOURCES
Population declines can be seen in various municipalities within Herkimer County between 2000
and 2010. The City of Little Falls has seen a 4.66% decline in population during this time period.
Five towns in Herkimer County experienced population losses of between 2.7% and 5.5%., and
four of the ten villages in Herkimer County experienced declines in population ranging from 2.1%
to 6.9%.
Overall, most municipalities in Herkimer County experienced population increases between 2000
and 2010. Fourteen of the nineteen towns in Herkimer County saw growth in their populations,
with the largest increases located in the Towns of Ohio (8.68%) and Norway (7.17%). The
Villages of Poland (12.64%) and Dolgeville (6.78%) saw the greatest increase in residents.
Herkimer-Oneida Counties Comprehensive Planning Program
New York State Department of Health, Vital Statistics of New York
http://www.health.ny.gov/statistics/vital_statistics/
U.S. Census Bureau
22
Community
Population by Age/Community
40. Senior citizens are a vital part of our community; they are our parents, grandparents, and great-
grandparents, part of our individual and community family. Seniors deserve our attention as
many of them are as vulnerable as our youth. The senior population is diverse, ranging from age
60 to over 100 years of age, at least two generations.
Many seniors suffer from serious health issues that restrict their ability to perform activities
of daily living such as driving, housekeeping, and even their own personal care. Many of them live
alone due to the death of their partner; this usually results in a loss of household income,
sometimes a very dramatic income loss that can result in a myriad of aftereffects. Although
there are programs to assist seniors, a number of factors can limit their ability to access these
services or for the services to be adequate to meet their needs.
Certainly not all seniors suffer from serious health issues or inadequate income levels. In the
“Physical & Emotional Health” section of this Profile, we see that the number of seniors
receiving home delivered meals for example is only 740 out of a total senior population of
15,022, only about 5% of the total senior population. Although for a variety of reasons there
are more seniors in need of home delivered meals than actually receive them, the majority of
seniors are independent and self-supporting.
The population of Herkimer County is getting older. The table on the next page illustrates the
increase in the senior citizen population between 1960 and 2010 in Herkimer County, New York
State and the United States.
Senior Population: Herkimer County has a high percentage of senior citizens. Since 1960, the
total County population has decreased (by 1,851), while the senior population has increased (by
3,434). The percentage of seniors increased from 17% of the total County population to 23%.
Our aged 85 and older population has more than tripled since 1960, from 547 to 1,737.
This increase in the senior population is even more dramatic when considering that between 1990
& the 2000 Census, the population between the ages of 62–74 decreased considerably. For
these age groups during this 10-year period, the size dropped by 1,621 people, a 19.25%
decrease. Without this decrease, the senior population would be even higher, approaching 24%.
One possible reason for the decrease in this age group of 62–74 is that they are part of what is
known as the “birth dearth”, a drop in the Country’s population that occurred after the Great
Depression. Another possible reason is that many may have moved to an area with a milder
winter. See the section describing the changes in population by age group.
WHY THIS IS IMPORTANT
WHERE WE STAND
23
Community
Older Adults in the Community
41. Aged 60+ population: Herkimer County has a high percentage of the older senior citizens. Out
of the 62 counties in NYS, Herkimer County ranks #10 in its aged 60+ population with 23.28%
of the total County Population (2010 Census). Hamilton County ranked #1 in NYS with 32.42%
and the Bronx ranked lowest with only 14.93%. With a United States comparison, Herkimer
County ranked 824 out of the 3,141 counties; just shy of falling within the top 25%.
The age 85+ population in Herkimer County has more than tripled since 1960, from 547 people in
1960 to 1,737 in 2010. These 85+ seniors are much more likely to be in need of services in order
to keep them at home and out of nursing homes. Please refer to the Meals-on-Wheels and
congregate meal statistics in the “Physical & Emotional Health” section of this document.
The percentage of seniors in Herkimer County has consistently exceeded the percentage of
seniors in New York State and the United States from 1960 to 2010.
Source: U.S. Census Bureau, 1960–2010 Censuses
Table 17
24
Herkimer County Senior Citizen Population
Herkimer County 1960 1970 1980 1990 2000 2010
Total Population 66,370 67,633 66,714 65,797 64,427 64,519
Total Senior Population
(aged 60 & over)
11,588 11,545 13,164 14,243 13,781 15,022
Percentage of total population
(rounded)
17% 17% 20% 22% 21% 23%
Total Aged 85 & over 547 740 910 1,157 1,443 1,737
Percentage of SENIOR
population
4.7% 6.4% 6.9% 8.1% 10.5% 11.6%
Seniors (60+)
as a percentage of TOTAL Pop 1960 1970 1980 1990 2000 2010
United States 14% 14% 16% 17% 15% 18%
New York State 15% 16% 17% 18% 17% 19%
Herkimer County 17% 17% 20% 22% 21% 23%
Total Aged 85+
as a percentage of TOTAL Pop
United States 0.5% 0.7% 1.0% 1.2% 1.5% 1.8%
New York State 0.5% 0.7% 1.1% 1.4% 1.6% 2.0%
Herkimer County 0.8% 1.1% 1.4% 1.8% 2.2% 2.7%
Community
Older Adults in the Community
42. As a result of being “elder rich”, our County is presented with unique challenges and
opportunities well ahead of the rest of the nation. The areas of Health Care, Elder Care,
Poverty and Quality of Life will be impacted greatly by these changes.
Change in Population by Age Group, 2000 and 2010 Census
Source: Herkimer-Oneida Counties Comprehensive Planning Program
Herkimer County Population Changes by Age Group
Age 2000 2010 % change
50–54 4,333 5,089 17.45%
25.99%
55–59 3,461 4,731 36.69%
60–61 1,233 1,770 43.55% 43.55%
62–64 1,704 2,396 40.61%
16.67%65–69 2,525 3,114 43.55%
70–74 2,569 2,421 -5.76%
75–79 2,454 1,937 -21.07%
-7.46%80–84 1,853 1,647 -11.12%
85+ 1,443 1,737 20.37%
Total 21,575 24,842 15.14%
Table 18
25
1960 1970 1980 1990 2000 2010
United States 14% 14% 16% 17% 15% 18%
New York State 15% 16% 17% 18% 17% 19%
Herkimer County 17% 17% 20% 22% 21% 23%
0%
10%
20%
30%
Percentage of Seniors (60+) 1960 to 2010 Graph 8
Source: Herkimer-Oneida Counties Comprehensive Planning Program
Community
Older Adults in the Community
43. Herkimer County’s older population (age 50 and above) has increased by 15.14% between 2000
and 2010. As Table 19 illustrates, the percentage of change for individual age groups over 50
differed dramatically between 2000 and 2010.
Adults in their 50s have increased by nearly 26% between 2000 and 2010. Over the next few
years, these people will ‘officially become seniors.’
The adults between age 62 and 74 have increased by nearly 17% during this same time period.
The number of adults aged 75+ have decreased by 7.46%; the number of adults aged 80+
increased by 3%; and the number of adults aged 85+ increased by 20% during this 10-year
period.
Projected Growth of the Elderly Population
The chart below illustrates the projected growth of Herkimer County’s older population between
the years 2010 and 2040.
Population Projections for Herkimer County 2010 to 2040
While it is projected that the overall population of Herkimer County will decrease over the next
30 years, the population of adults over age 60 is expected to increase by 34.5% during the same
time period. These data are only an educated guess and actual population changes may vary from
the above projections.
Table 19
26
2010 2015 2020 2025 2030 2035 2040
Total Population 62,185 62,005 61,942 61,938 61,942 61,942 61,952
Ages 60 and over 14,333 15,844 17,596 19,228 19,643 19,553 19,272
Ages 65 and over 10,289 11,458 12,933 14,543 15,941 16,155 15,807
Ages 75 and over 4,867 4,830 5,289 6,224 7,253 8,277 9,026
Ages 85 and over 1,588 1,603 1,529 1,547 1,738 2,130 2,459
Ages 60–74 9,466 11,014 12,307 13,004 12,390 11,276 10,246
Ages 75–84 3,279 3,227 3,760 4,677 5,515 6,147 6,567
Source: New York State Office for the Aging, County Data Book 2011
Community
Older Adults in the Community
44. Herkimer County’s older population, as a proportion of the total projected county population, is
expected to increase over the next 30 years.
Herkimer County Office for the Aging
Herkimer-Oneida Counties Comprehensive Planning Program
New York State Office for the Aging
County Data Book 2011
http://www.aging.ny.gov/ReportsAndData/CountyDataBooks/22Herkimer.pdf
U.S. Census Bureau
DATA SOURCES
27
14,333 15,844 17,596 19,228 19,643 19,553 19,272
47,852 46,161 44,346 42,710 42,299 42,389 42,680
62,185 62,005 61,942 61,938 61,942 61,942 61,952
0
10,000
20,000
30,000
40,000
50,000
60,000
70,000
2010 2015 2020 2025 2030 2035 2040
Population Projections
Herkimer County 2010–2040
Ages 60 and Over Under 60
Graph 9
Source: New York State Office for the Aging, County Data Book 2011
Community
Older Adults in the Community
45. Decent, safe, and affordable housing is a luxury that many take for granted. But for those
unable to provide their families with adequate accommodations, housing is an important issue.
Only 67 percent of the nation currently owns their own home. The development of new housing,
combined with the rehabilitation and preservation of existing housing stock, is a significant
contributing factor to the stability and growth of communities.
The 2010 Census indicates that there are 33,314 housing units in Herkimer County. Two percent
these homes are located in an urban area (City of Little Falls) and 13,869 (42%) of these homes
are considered to be within an urban cluster area (village or suburb). Rural homes make up
18,762 (56%) of the homes in Herkimer County.
WHY THIS IS IMPORTANT
WHERE WE STAND
28
Source: U.S. Census Bureau, 2010 Census Summary File 1, Table H2
Graph 10
Urbanized Area
2%
Urban Cluster
Areas
42%
Rural Areas
56%
Housing Units in Herkimer County—2010
Community
Housing
46. The median year of construction for year-round housing in Herkimer County is 1952. Herkimer
County, and neighboring counties Fulton, Montgomery, Otsego and Oneida fall below the NYS
average for their age of housing stock.
The 2008-2010 American Community Survey estimates that there are 33,314 housing units in
Herkimer County. Of those, 26,478 (79.5%) are occupied. Of the 26,478 occupied housing units
in Herkimer County, approximately 71.6% (18,950) are owner occupied and 7,528 (28.4%) are
occupied by a renter. The average household size of an owner-occupied unit is 2.47 persons, and
the average household size of a renter-occupied unit is 2.16 persons. The median value of an
owner-occupied home in Herkimer County is $89,500.
Fifty-five percent of the 18,950 owner-occupied units in Herkimer County have a mortgage
(10,344), compared to 65.3% in NYS and 67.8% in the United States. Table 21 on the next page
illustrates monthly owner costs for the 10,344 housing units in Herkimer County with a
mortgage. The median owner cost for a home with a mortgage in Herkimer County is $1,071; the
median monthly cost of home expenses without a mortgage is $446.
Table 22 on the next page illustrates the monthly owner costs as a percentage of household
income for Herkimer County and the U.S. According to the 2008-2010 American Community
Survey, one in five (19.4%) Herkimer County homeowners with a mortgage spent over 35% of
their household income on home expenses, compared to more than one in four (28.8%) of
mortgaged homeowners in the United States.
Almost half of all homeowners with a mortgage (47.6%), and 65% of homeowners without a
mortgage, spent less than 20% of their income on housing expenses.
County Median Year Built
Herkimer County 1952
Madison County 1960
Fulton County 1952
Montgomery County 1943
Columbia County 1960
Otsego County 1955
Oneida County 1954
New York State 1955
Source: U.S. Census Bureau, 2008–2010 ACS
Table 20Median Year of Construction for Year-Round Housing
29
Community
Housing
47. Of the 26,478 occupied housing units in Herkimer County, 28.4% (7,528) are occupied by a
renter. The 2008-2010 American Community Survey indicates that the median rent paid in
Herkimer County is $582. The gross rent paid by percentage of renters is listed in the table on
the next page.
Table 22
30
Source: U.S. Census Bureau, 2008–2010 American Community Survey
Table 21Selected Monthly Owner Costs, Herkimer County
Housing units with a mortgage
Total Number
10,344
Percentage of Total Housing
Units w/Mortgage
Less than $300/month 5 0.05%
$300 to $499/month 322 3.11%
$500 to $699/month 1,326 12.82%
$700 to $999/month 2,855 27.60%
$1,000 to $1,499/month 3,937 38.06%
$1,500 to $1,999/month 1,030 9.96%
$2,000 or more/month 869 8.40%
Median Cost (dollars) 1,071
Monthly Owner Costs as a Percentage of Household Income,
Herkimer County and U.S.: 2006-2008
Housing units with
mortgage
# of Units
Herkimer County
10,344
Herkimer County
PERCENT
United States
PERCENT
Less than 20.0 percent 4,926 47.6% 34.0%
20.0 to 24.9 percent 1,509 14.6% 15.9%
25.0 to 29.9 percent 933 9.0% 12.4%
30.0 to 34.9 percent 814 7.9% 8.9%
35.0 percent or more 2,002 19.4% 28.8%
Not computed 80
Source: U.S. Census Bureau, 2008–2010 American Community Survey
Community
Housing
48. Table 24
Safe and decent rental housing at fair market levels was reported as the primary housing need
in Herkimer County by focus group participants in an affordable housing needs study done by the
NYS Division of Housing and Community Renewal in 2009. The issue of absentee landlords was
also identified, as rental housing is increasingly owned by entities located outside the Region.
Rehab and modernization funds for existing housing stock was cited as a need for both owner-
occupied homes and rental stock. Although affordability of homeownership was found in much of
31
Gross Rent Paid, Herkimer County: 2008-2010
Occupied units
paying rent
6,935 Percent
Less than $200 103 1.5%
$200 to $299 708 10.2%
$300 to $499 1,684 24.3%
$500 to $749 2,633 38.0%
$750 to $999 1,350 19.5%
$1,000 to $1,499 448 6.5%
$1,500 or more 9 0.1%
Median Rent
(dollars)
582
Gross Rent as a Percentage of Household Income,
Herkimer County and U.S.: 2008-2010
Occupied units
paying rent
# of Units
Herkimer County
7,528
Herkimer County
PERCENT
United States
PERCENT
Less than 15.0 percent 1,034 15.3% 11.9%
15.0 to 19.9 percent 601 8.9% 12.2%
20.0 to 24.9 percent 955 14.2% 12.7%
25.0 to 29.9 percent 844 12.5% 11.6%
30.0 to 34.9 percent 694 10.3% 9.2%
35.0 percent or more 2,611 38.7% 42.5%
Not computed 789
Source: 2008–2010 American Community Survey
Table 23
The table below illustrates the monthly
rental costs as a percentage of
household income for Herkimer County
and the U.S. According to the 2008-
2010 American Community Survey,
almost 39% of Herkimer County renters
spent over 35% of their household
income on home expenses, which is
slightly lower than the percentage who
spent over 35% of their income in the
United States (42.5%).
Based on the ACS data, it appears that
renters in Herkimer County spend a
greater percentage of their income on
home related expenses than homeowners
(with or without a mortgage).
Source: U.S. Census Bureau, 2008–2010 American Community Survey
Community
Housing
49. Source: 2011 New York State Statistical Yearbook, Table I-19
the Region, it was noted that a preponderance of second home purchases in the Old Forge area
has exerted strong upward pressure on home prices, making it difficult for year round residents
to afford homes.
Home Sales
Sales of existing single family homes decreased by 10.0% in Herkimer County between 2008 and
2010. Home sales also fell in most neighboring counties and in NYS during this time period.
Sales of Existing Single-Family Homes 2008–2010
The median sales price of existing single-family homes in Herkimer County rose by 5.1% between
2008 and 2010, but prices have remained lower than in neighboring counties. In NYS, the
median sales price of homes rose by 2.4% between 2008 and 2010, but big declines were
recorded in Sullivan (-16.4%) and Putnam (-15.5%) counties. The greatest gains in price during
this time period were recorded in Lewis (21.1%), Chemung (17.6%), Cayuga (15.8%) and
Fulton (15.7%) counties.
Source: 2011 New York State Statistical Yearbook, Table I-17
County 2008 2009 2010
% Change
2008 to 2010
Herkimer 220 15.4% 254 -22.0% 198 -10.0%
Madison 590 -15.9% 496 -6.0% 466 -21.0%
Montgomery 264 -14.0% 227 -10.1% 204 -22.7%
Otsego 309 -1.6% 304 4.9% 319 3.2%
Oneida 1,588 -9.1% 1,443 0.3% 1,448 -8.8%
New York State 80,521 -2.7% -4.6% 74,718 -7.2%78,327
County 2008 2009
% Change
2008 to 2010
2010
Herkimer $82,750 $81,757 5.1%$86,960
Madison $129,450 $125,000 -3.4%$125,000
Montgomery $95,150 $110,000 -4.1%$91,250
Otsego $131,000 $126,523 -8.8%$119,500
Oneida $105,000 $103,900 4.8%$110,000
New York State $210,000 $195,000 2.4%$215,000
Table 25
Table 26
Median Sales Price of Existing Single-Family Homes 2008–2010
32
Community
Housing
50. Foreclosure Rates and Subprime Mortgages
Despite the downturn in the economy, foreclosure rates in Herkimer County have remained
relatively low. Six foreclosure filings were made in Herkimer County in the first quarter of
2009, up from 4 filings during the same time period in 2008. According to research done by the
Kaiser group in June 2012, NYS ranks 39th
of all states in foreclosure activity.
In a report by the NYS Office of the Comptroller, subprime loans were not used as extensively
in New York as in other states, in part because of tighter banking laws and better oversight. As
a share of all loans, subprime mortgages constitute only 5.4 percent of the total portfolio.
Roughly half of the subprime mortgages in New York State are variable rate loans, and of those,
approximately one-third reset in 2008.
Within the State, subprime usage varies dramatically; as of January 2008, there were roughly
150,000 subprime mortgages in New York. Most of these mortgages (73 percent), were used to
fund properties located downstate. Approximately 400 of these subprime mortgages were in
Herkimer County and existed at a rate of 12 per 1,000 housing units. 49% of these loans had a
delinquent payment within 12 months, and 7.3% went into foreclosure.
2011 New York State Statistical Yearbook
http://rockinst.org/nys_statistics/2011
Kaiser Health Facts
http://www.statehealthfacts.org/profileind.jsp?ind=649&cat=1&rgn=34
NYS Association of Realtors
NYS Banking Department
NYS Division of Housing and Community Renewal , February 2009
Statewide Affordable Needs Study: Mohawk Valley Regional Report
Office of the NYS Comptroller
“Meltdown: The Housing Crisis and its Impact on New York State’s Local Governments”
U.S. Census Bureau
DATA SOURCES
33
Community
Housing
51. Religious affiliation is the self-identified association of a person with a religion, denomination or
sub-denominational religious group. A denomination is the church or religious sect that forms a
subgroup of a religion.
Religiosity and religious involvement encompasses such dimensions as commitment to the religion,
the strength of religious beliefs, and participation in religious activities individually or as part of
a congregation. Research has indicated that religious affiliation affects economic and
demographic behavior because of its impact on many interrelated decisions that people make
over the life cycle. Religious involvement has also been associated with beneficial effects
related to health and well-being.
The table below lists the number of churches and synagogues in existence in Herkimer County
from 1980 through 2010. The types of churches and synagogues in existence have fluctuated
during this time period but the total number has remained relatively unchanged.
WHY THIS IS IMPORTANT
WHERE WE STAND
Herkimer County Churches and Synagogues 1980–2010
Religious Denomination 1980 1990 2000 2010
Baptist 13 13 11 13
Catholic 16 19 11 12
Episcopal 4 5 4 5
Jewish 1 1 1 1
Lutheran 5 5 5 3
Methodist 24 23 20 19
Presbyterian 6 5 6 5
Reformed 2 2 2 2
Russian Orthodox Not Available 1 1 2
Universalist 4 2 2 2
Other 9 10 13 21
Total 84 86 76 85
Source: The Association of Religion Data Archives
Table 27
34
Community
Religious Affiliation
52. A nation-wide study done in 2010 by the Association of Religion Data Archives that included
Herkimer County found that religious affiliation had dropped between 2000 and 2010. The
population of Herkimer County in 2000 was 64,627; in 2010 it was 64,519. The total population
changed 0.1%. The adherent totals for 2000 (35,086) represented 54.5% of the 2000
population. The adherent totals for 2010 (24,805) represented 38.4% of the total population in
2010.
In the United States, the unadjusted adherent totals of religious groups include 48.8% of the
total population in 2010 (150,596,792).
A local pastor has stated that the ratio of people who are affiliated with a religious group to
those who actually attend church is about 4 to 1 or 25%. A great concern among Roman
Catholics is the dwindling number of priests who will be available to serve Herkimer County.
The 2009 Teen Assessment Project Survey results show a decrease in the number of youth who
report attending religious, education or prayer services at least one hour per week, from 48.8%
in 2001 to 39.4% in 2009.
Catholic Charities of Herkimer County
The Association of Religion Data Archives
http://www.thearda.com/mapsReports/reports/counties/36043_2010.asp
2009 Herkimer County Teen Assessment Project Survey
35
Source: The Association of Religion Data Archives
Table 28Religious Affiliation—Herkimer County, 1980–2010
Religious Denomination 1980 1990 2000 2010
Evangelical Protestant 932 821 1,096 1,461
Mainline Protestant 14,932 11,763 9,654 7,135
Orthodox — — 397 334
Catholic 23,732 16,630 23,534 15,425
Other 419 745 405 —
Unclaimed/Not Affiliated 26,699 35,838 29,341 39,714
DATA SOURCES
Community
Religious Affiliation
53. Having adequate transportation allows individuals to access work, shopping and other activities
necessary for daily living. It also allows residents to attend appointments and events, and to access
services that help individuals maintain a good quality of life. Ensuring that transportation is available
to all residents is critical, especially in counties such as Herkimer.
Of the 26,478 households in 2010, approximately 89% had access to at least one vehicle. On aver-
age, there were 1.59 vehicles per household in Herkimer County in 2000 compared to 1.57 in 2010.
Approximately 2,831 households, or over one in ten Herkimer County households (10.7%), do not
have access to a vehicle. Approximately two-thirds of the households without a vehicle (64%)
are one-person households.
WHY THIS IS IMPORTANT
WHERE WE STAND
2000 Census 2010 Census Change 2000 to 2010
Subject Number Percent Number Percent Number Percent
Total population 64,427 100 64,519 100 92 0.1
HOUSEHOLD SIZE
Total households 25,740 100 26,478 100 738 2.9
1-person household 7,099 27.6 7,816 29.5 717 10.1
2-person household 8,688 33.8 9,438 35.6 750 8.6
3-person household 4,283 16.6 3,754 14.2 -529 -12.4
4-person household 3,420 13.3 3,188 12.0 -232 -6.8
5-or-more-person
household 2,250 8.7 2,282 8.6 32 1.4
Mean number of
persons per house-
hold 2.46 (X) 2.38 (X) 0.08 (X)
VEHICLES AVAILABLE
Total households 25,740 100 26,478 100 738 2.9
No vehicle available 2,524 9.8 2,831 10.7 307 12.2%
1 vehicle available 10,014 38.9 9,257 35.0 -757 -7.6%
2 vehicles available 9,747 37.9 10,313 38.9 566 5.8%
3 vehicles available 2,667 10.4 2,958 11.2 291 10.9%
4 vehicles available 577 2.2 806 3.0 229 39.7%
5 or more vehicles
available 211 0.8 313 1.2 102 48.3%
Mean vehicles per
household 1.59 (X) — (X) — (X)
Herkimer County—Household Size and Vehicles Available (2000 & 2010)
The 2010 U.S. Census
indicates that there
are 26,478 households
in Herkimer County, a
2.9% increase from
2000.
More households were
comprised of one or
two persons in 2010
than in 2000. One-
person households
increased by 10.1%, and
two-person households
rose by 8.6%.
Households that
contained three or
four persons
decreased by 12.4%
and 6.8% respectively,
and those with 5 or
more persons increased
by 1.4%.
Source: U.S. Census Bureau, Census of Population and Housing, long-form (sample) data.
Table 29
36
Community
Transportation
54. One-third of the households without a vehicle are made up of two people (19%), three
people (5%), or four or more people (12%).
Consistent and reliable transportation is an integral part of maintaining employment. The chart
below depicts the means of transportation used by workers 16 years and over in Herkimer
County to get to their place of employment.
Means of Transportation to Work
2000 Census 2010 Census Change 2000 to 2010
NUMBER PERCENT NUMBER PERCENT NUMBER PERCENT
Workers 16 years and over 28,622 100 28,163 100 -459 -1.6
Drove alone 22,132 77.3 23,023 81.7 891 4.0
Carpooled 3,570 12.5 2,360 8.4 -1,210 -33.9
Public transportation
(including taxicab)
302 1.1 97 0.3 -205 -67.9
Bicycle or walked 1,539 5.4 2,244 8.0 705 45.8
Motorcycle or other means 111 0.4 109 0.4 -2 -1.8
Worked at home 968 3.4 1,325 4.7 357 36.9
Source: U.S. Census Bureau, 2000 & 2010 Censuses
Table 30
37
Source: U.S. Census Bureau, 2008–2010 ACS Graph 11
Community
Transportation
55. Nine out of ten workers in Herkimer County used a car or other vehicle to get to work in 2010,
by either driving alone (81.7%), carpooling (8.4%), or driving a motorcycle (0.4%). One in twelve
workers rode a bicycle or walked, and one out of every three hundred workers used public trans-
portation (which is two-thirds the number that used public transportation in 2000). Approxi-
mately 1,300 workers (4.7%) worked at home.
It takes a Herkimer County resident an average of 22.8 minutes to commute to work. About one
in five workers (21%) commute less than 10 minutes to work and three in ten (29%) travel more
than 30 minutes to work each day. One half of all workers take between 10 and 30 minutes.
Public Transportation
There is very limited public transportation available in Herkimer County. Commuter bus service
is available between Little Falls and Utica (Oneida County), along the Routes 5 and 5S valley
corridor. There are also two companies in Herkimer County that provide commercial taxi
services.
Source: U.S. Census Bureau, 2008–2010 ACS
38
Graph 12
Community
Transportation
56. Community and Agency Assistance
Several communities and agencies have created small, localized services to meet the
transportation needs of specific areas and/or populations. These services, however, are limited
and do not fully meet the needs of the general population.
Examples of these types of services include the RSVP (Retired Senior Volunteers Program), the
Herkimer County Office for the Aging Transportation Program, and the Town of Webb volunteer
transportation program.
RSVP RIDE Program
The RSVP RIDE Program provides transportation for non-Medicaid ambulatory individuals, 55
years of age and older, to needed medical and health related services at facilities in Herkimer,
Oneida, and Otsego Counties. The program has been in existence since 1985. In recent years,
the program has expanded coverage to include destinations in Fulton, Onondaga, Monroe and
Albany Counties. Calls for transportation have to be received 48 hours in advance of scheduled
appointments. No weekend coverage is provided. The most common destinations include the
Dialysis Center at Faxton/St. Luke’s, Masonic Home Dialysis, Slocum Dickson, Faxton Hospital,
and the medical providers on Genesee Street in Utica. Clients are not permitted to give the
volunteer driver any reimbursement for the ride; however, donations can be made to the agency.
Volunteer drivers are allowed to submit mileage reimbursement requests to the program.
Drivers and clients are covered by CIMA excess auto, liability, and accidental insurance.
The RSVP RIDE Program is considered a valuable community asset as there is no other program
that provides this one-on-one, door-through-door, escort and transportation service for seniors
to destinations outside of Herkimer County from the Valley Corridor. Volunteers use their own
vehicles and must submit to background checks and training before becoming active in the
program.
On the next page is a chart showing the activity of the RSVP RIDE Program from 2003 to 2012.
One unmet need identified in this program has been the lack of volunteer drivers to meet the
trip requests of residents, which was most evident in 2007 and 2008. This could have been the
result of higher gas prices, the reduced number of calls a volunteer will accept, the loss of
experienced drivers in the program due to health issues, ‘snow birds’ who vacation half the year
in warmer climates, and the slow response to advertisements and presentations geared to
recruiting drivers.
The overall number of rides has decreased between 2007 and 2011, but rose by over 350 rides
in 2012. Although the number of volunteer drivers decreased from 32 drivers in 2003 to 21
drivers in 2012, the average number of volunteer hours per driver increased.
39
Community
Transportation
57. In 2012, a Client Satisfaction Survey was completed for the RSVP RIDE program. Two hundred
surveys were mailed and 65 were returned.
• Regarding the drivers, 100% agreed that the drivers were punctual, helpful and
courteous.
• 100% of clients stated that the transportation service is important to extremely
important in helping access medical services.
• 95% of clients stated that the transportation has helped to improve and/or maintain
their health status.
• 98% of clients agreed to strongly agreed that the transportation makes them better able
to stay in their home.
Herkimer County Office for the Aging Transportation Services
The Herkimer County Office for the Aging (OFA) provides transportation services to senior
citizens aged 60 and older. This service is a demand-response system, that is, rides are door-to
-door, not traveling from one bus stop to another. Rides are provided for medical appointments,
grocery store/pharmacy, banking, hairdresser, visiting, etc., basically wherever the senior wants
to go. Due to the demand for services, the OFA does not travel outside the County and basically
services the Valley Corridor from the town of Schuyler to Dolgeville. The OFA currently has
two vehicles, both equipped with wheelchair lifts; one vehicle operates 5 days/week and the
second operates 2 days/week.
40
2003 2004 2005 2006 2007 2008 2009 2010 2011 2012
Volunteer
Drivers
32 32 32 26 22 22 27 22 18 21
Volunteer
Hrs.
3,239 3,159 2,575 2,703 2,381 2,110 1,814 2,056 2,105 3,671
Mileage 46,815 38,006 26,119 48,408 48,057 41,001 32,300 32,958 30,815 44,524
Clients
Transported
1,599 1,133 1,154 1,169 1,158 950 746 847 701 1,058
Unmet
Needs*
9 — — — 63 134 — — — —
Source: Catholic Charities of Herkimer County *driver unavailable
Table 31RSVP RIDE Program Statistics 2003 to 2012
Community
Transportation
58. The number of rides provided from 2005 through 2011 has not changed significantly; this is
because the buses are basically at capacity. When the price of gasoline rose so dramatically in
2008, the demand for the OFA transportation service also rose dramatically. Many seniors were
unable to be served because the demand was far beyond the OFA’s capacity to absorb. Since
2008, the number of rides has returned to previous service levels.
During 2011, 176 seniors received transportation from the OFA (unduplicated count). The
average number of rides per senior served was 30 rides.
The demographics of seniors served with the OFA transportation service during 2011 was
81% females and 19% males. The ages of those served were 32% age 85 and older, 34% ages 75
to 84 and 35% ages 60 to 74.
Webb Community Transportation Services (CTS)
Community Transportation Services, Ltd. was incorporated in 1987 as a not-for-profit
(501, c, 3) organization. Its Certificate of Incorporation, Article 3, states “the purpose is to
assist the elderly, disabled and disadvantaged in the Central Adirondack area by providing
necessary transportation, without cost, for medical, health and other related necessary
services”. CTS is not a taxi service; it is a totally volunteer organization with no payroll. CTS
exists strictly on “free will” donations.
The chart on the next page depicts CTS program statistics for 2007 through 2012.
41
OFA Transportation
2005–2011
Year
# Rides
Provided
2011 5,326
2010 5,532
2009 5,403
2008 6,059
2007 5,297
2006 5,291
2005 5,659
Age of Clients Served with
OFA Transportation 2011
Age # %
85+ 56 32%
75–84 59 34%
60–74 61 35%
Total 176 100%
Source: Herkimer County OFA
Table 33
Source: Herkimer County OFA
Table 32
Community
Transportation
59. DATA SOURCES
In 2012, a total of 398 trips were made to the following destinations: Utica (195),
Syracuse (22), Albany (2), Rome (3), Indian Lake (2), Herkimer (2), Ilion (1), Barneveld (43),
Hamilton (2), Boonville (8), and Old Forge (118). The percentage of rides given to Utica, Barne-
veld, and Old Forge has remained fairly steady for 2010–2012. Since 2010, the overall number
of rides has been decreasing.
Catholic Charities of Herkimer County, RSVP Ride Program
Herkimer County Office for the Aging
U.S. Census Bureau
Webb Community Transportation Services, Ltd.
42
Webb Community Transportation Service
2007 2008 2009 2010 2011 2012
Total Trips 286 332 396 466 421 398
# of Riders 627 676 812 941 797 748
Riders for Medical 299 376 427 419 436 348
Riders Over 60 Years Old 94% 96% 97% 97% 97% 97%*
Total Mileage 31,516 34,541 38,496 39,680 40,477 38,663
Areas Served:
Town of Webb
Other
97%
3%
98%
2%
98%
2%
98%
2%
98%
2%
98%*
2%*
Days of the Week 7 7 7 7 7 7
# of Volunteer Drivers 30 32 34 32 29 30
Table 34
Source: Webb CTS Program * estimated
Community
Transportation
60. Herkimer County Labor Statistics 1990–2011
County Labor Force and Employment
The following chart depicts the average annual number of individuals in the Herkimer County
labor force, the number of individuals employed, the number of individuals that were unemployed
and the unemployment rate from 1990 to 2011.
WHY THIS IS IMPORTANT
WHERE WE STAND
Source: NYS Department of Labor, Local Area Unemployment Statistics Program
Year Herkimer County
Labor Force
Number Employed
(annual average)
Number Unemployed
(annual average)
Unemployment Rate
(annual average)
1990 30,200 28,400 1,800 6.1%
1991 30,400 27,700 2,700 9.0%
1992 30,200 27,600 2,700 8.8%
1993 30,300 27,900 2,300 7.7%
1994 30,700 28,600 2,100 6.7%
1995 31,400 29,200 2,200 7.0%
1996 31,500 29,400 2,100 6.7%
1997 31,600 29,500 2,100 6.7%
1998 31,500 29,600 1,900 5.9%
1999 31,400 29,700 1,600 5.2%
2000 31,700 30,400 1,300 4.3%
2001 31,400 29,900 1,400 4.5%
2002 31,400 29,700 1,700 5.4%
2003 31,400 29,600 1,800 5.7%
2004 31,500 29,700 1,800 5.6%
2005 31,700 30,000 1,700 5.3%
2006 31,300 29,800 1,600 5.1%
2007 31,000 29,500 1,500 5.0%
2008 31,200 29,300 1,900 6.1%
2009 31,100 28,600 2,500 8.0%
2010 31,400 28,700 2,700 8.5%
2011 30,900 28,300 2,600 8.4%
Employment breakouts by industry show the diversity of the economy. Wage data by industry
depicts the varied income levels of jobs in the area. The unemployment rate can be used as a
barometer of the general economic health of an area. Since all of these statistics are
calculated uniformly, comparison with other geographic areas can easily be done.
Table 35
43
Community
Employment & Industry