Download to read offline
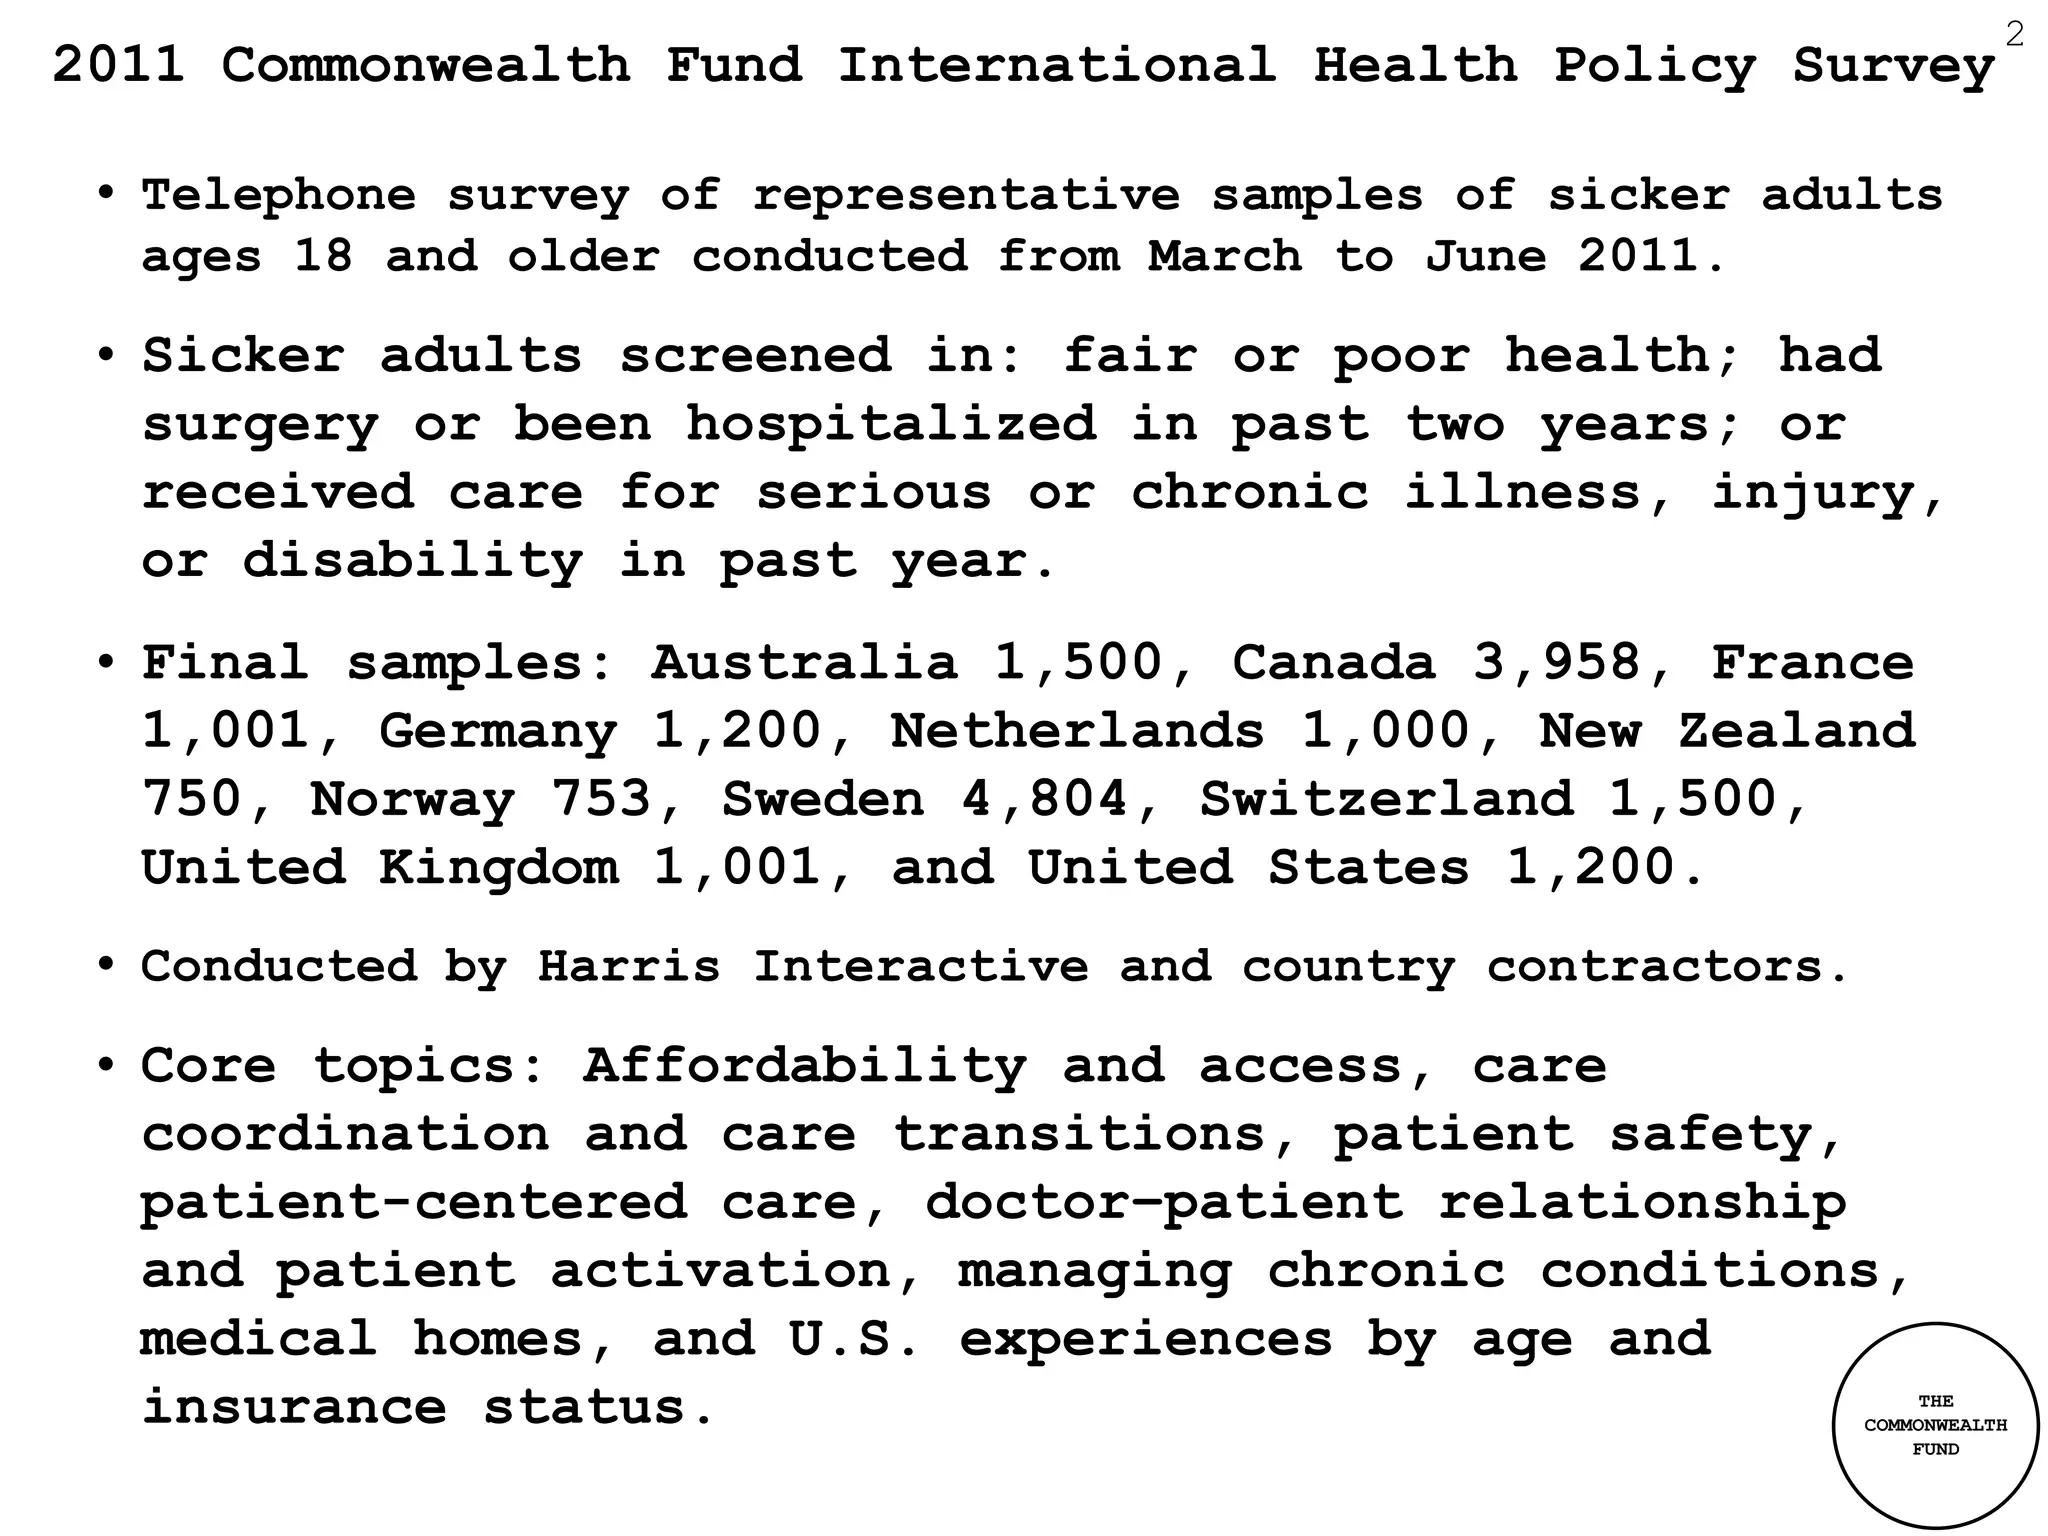
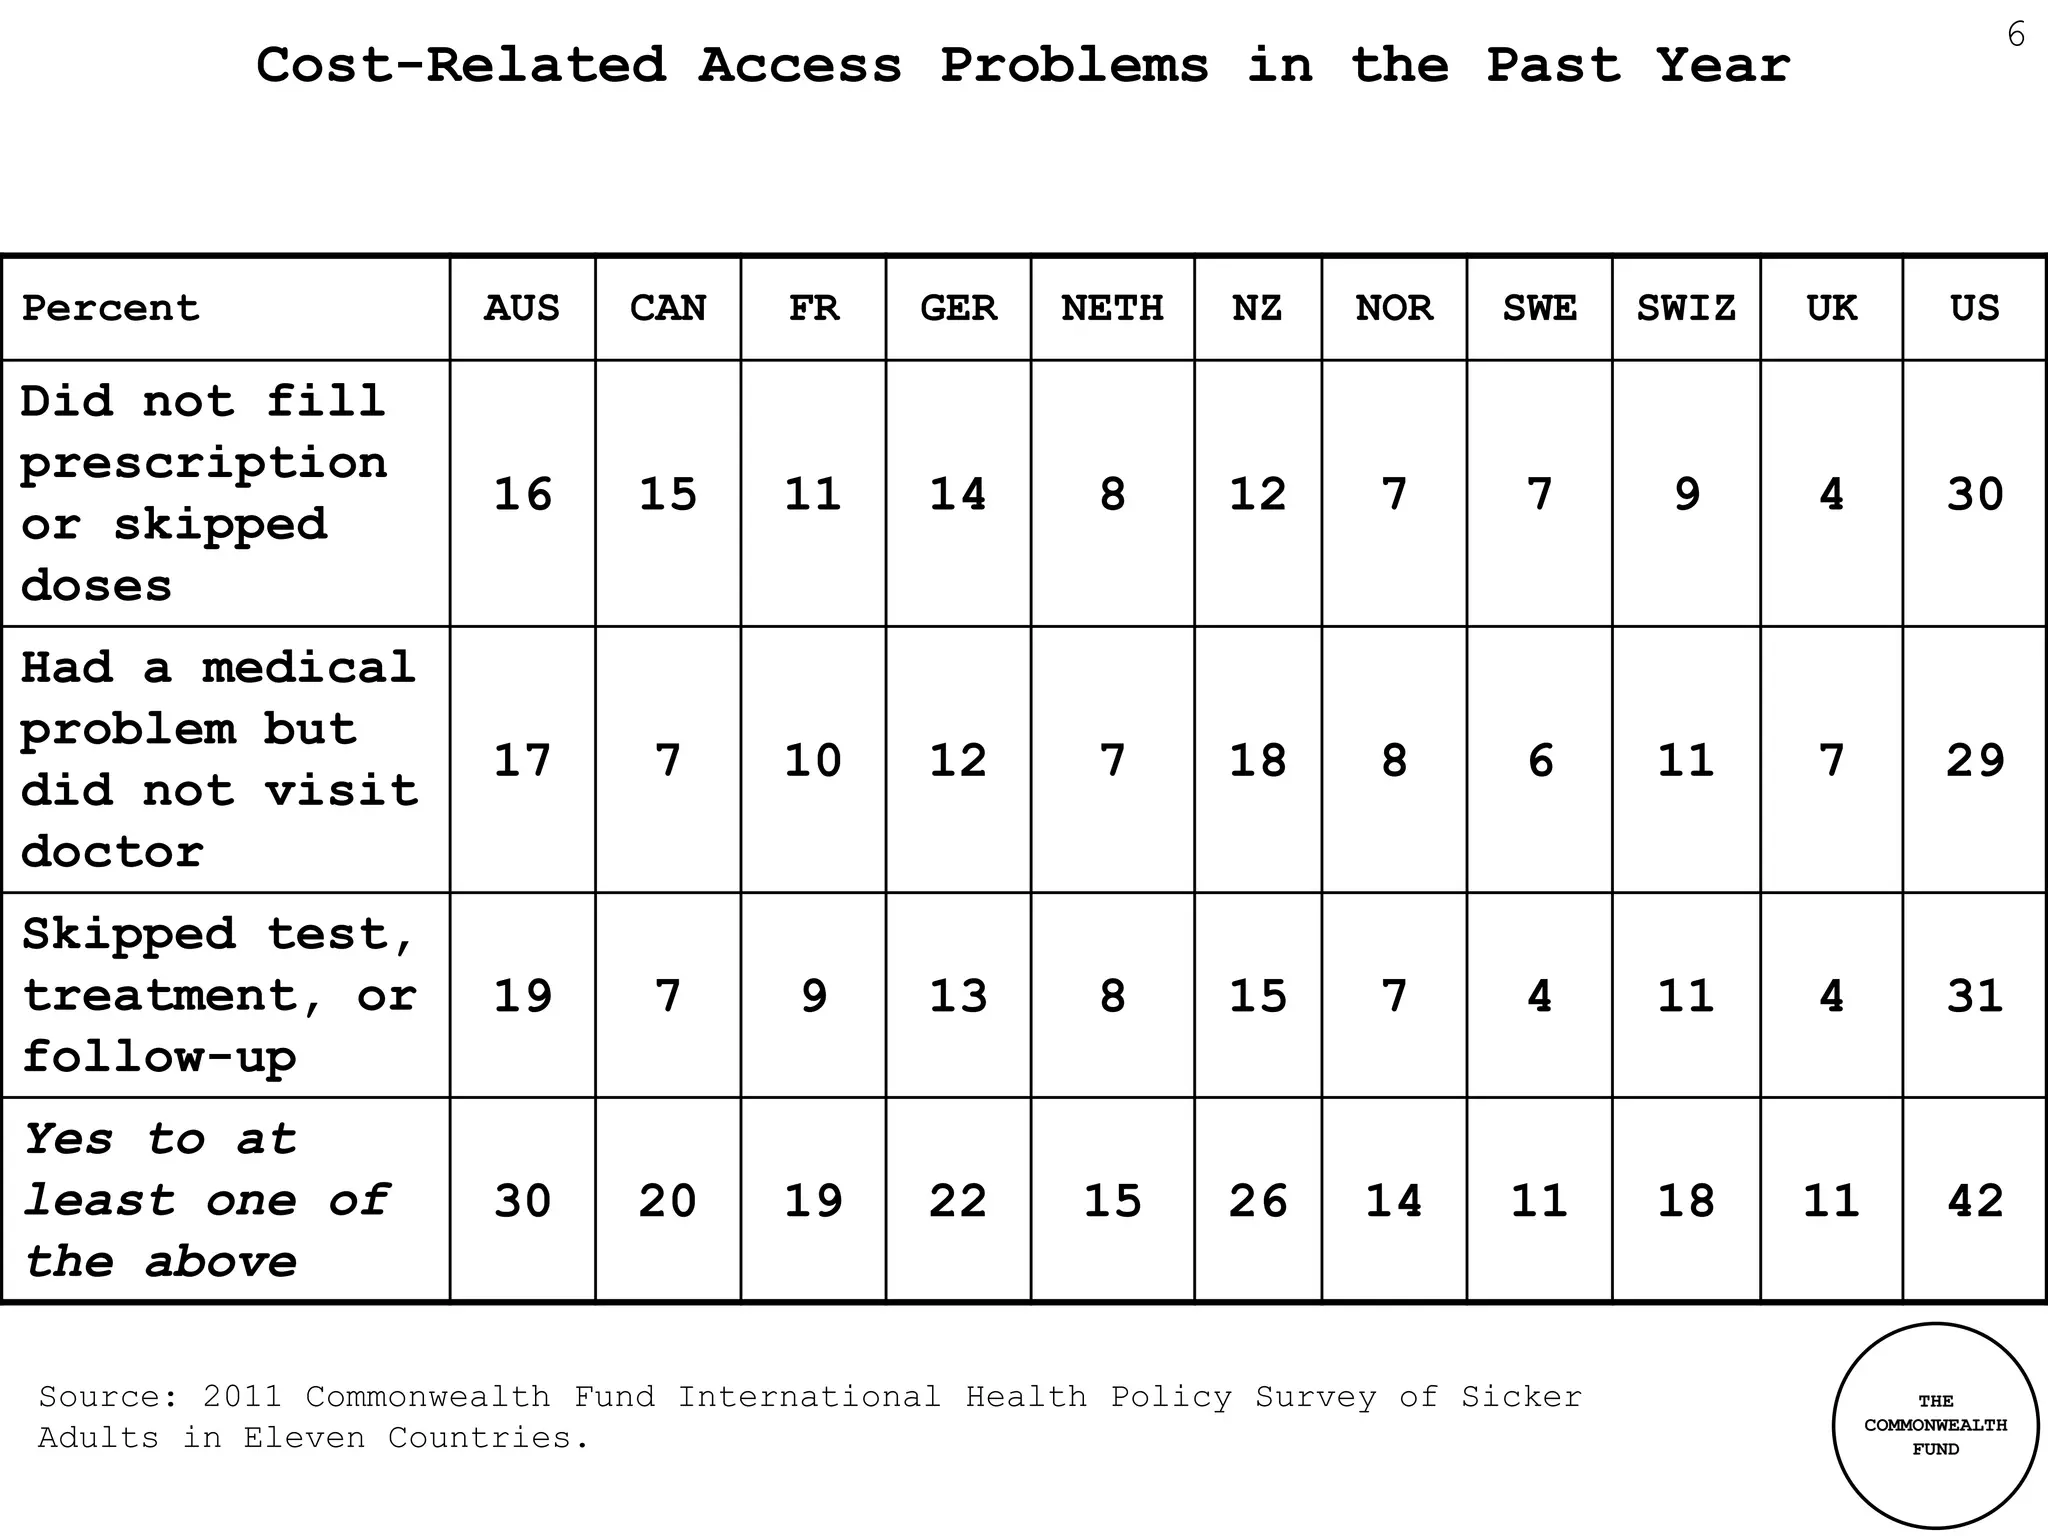
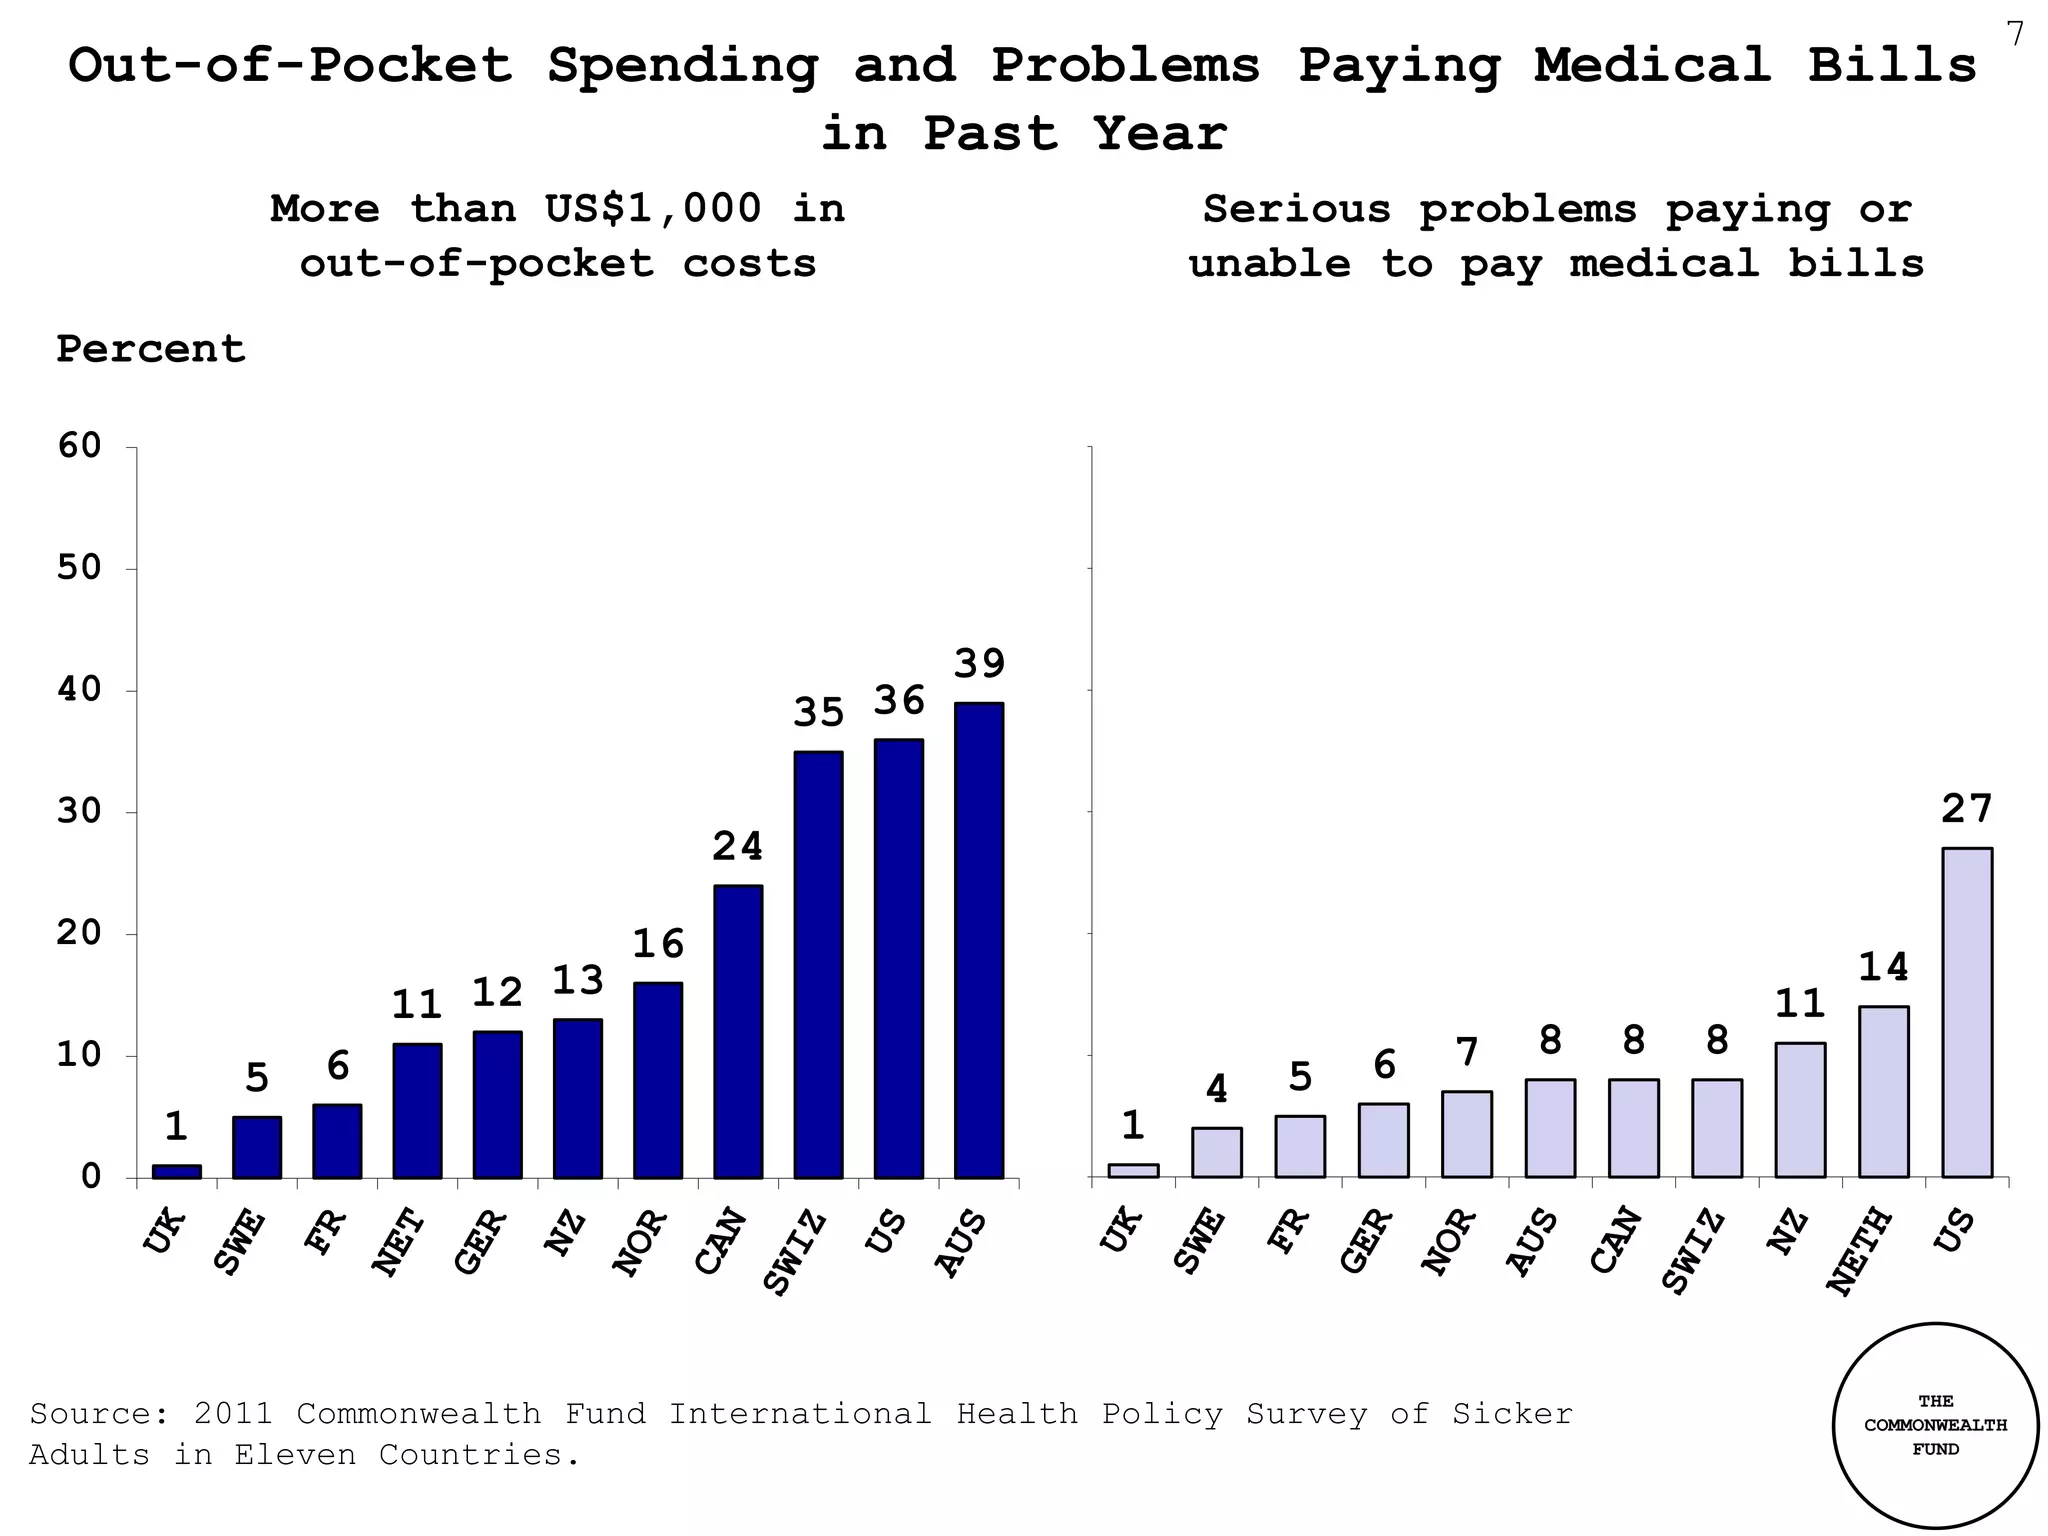
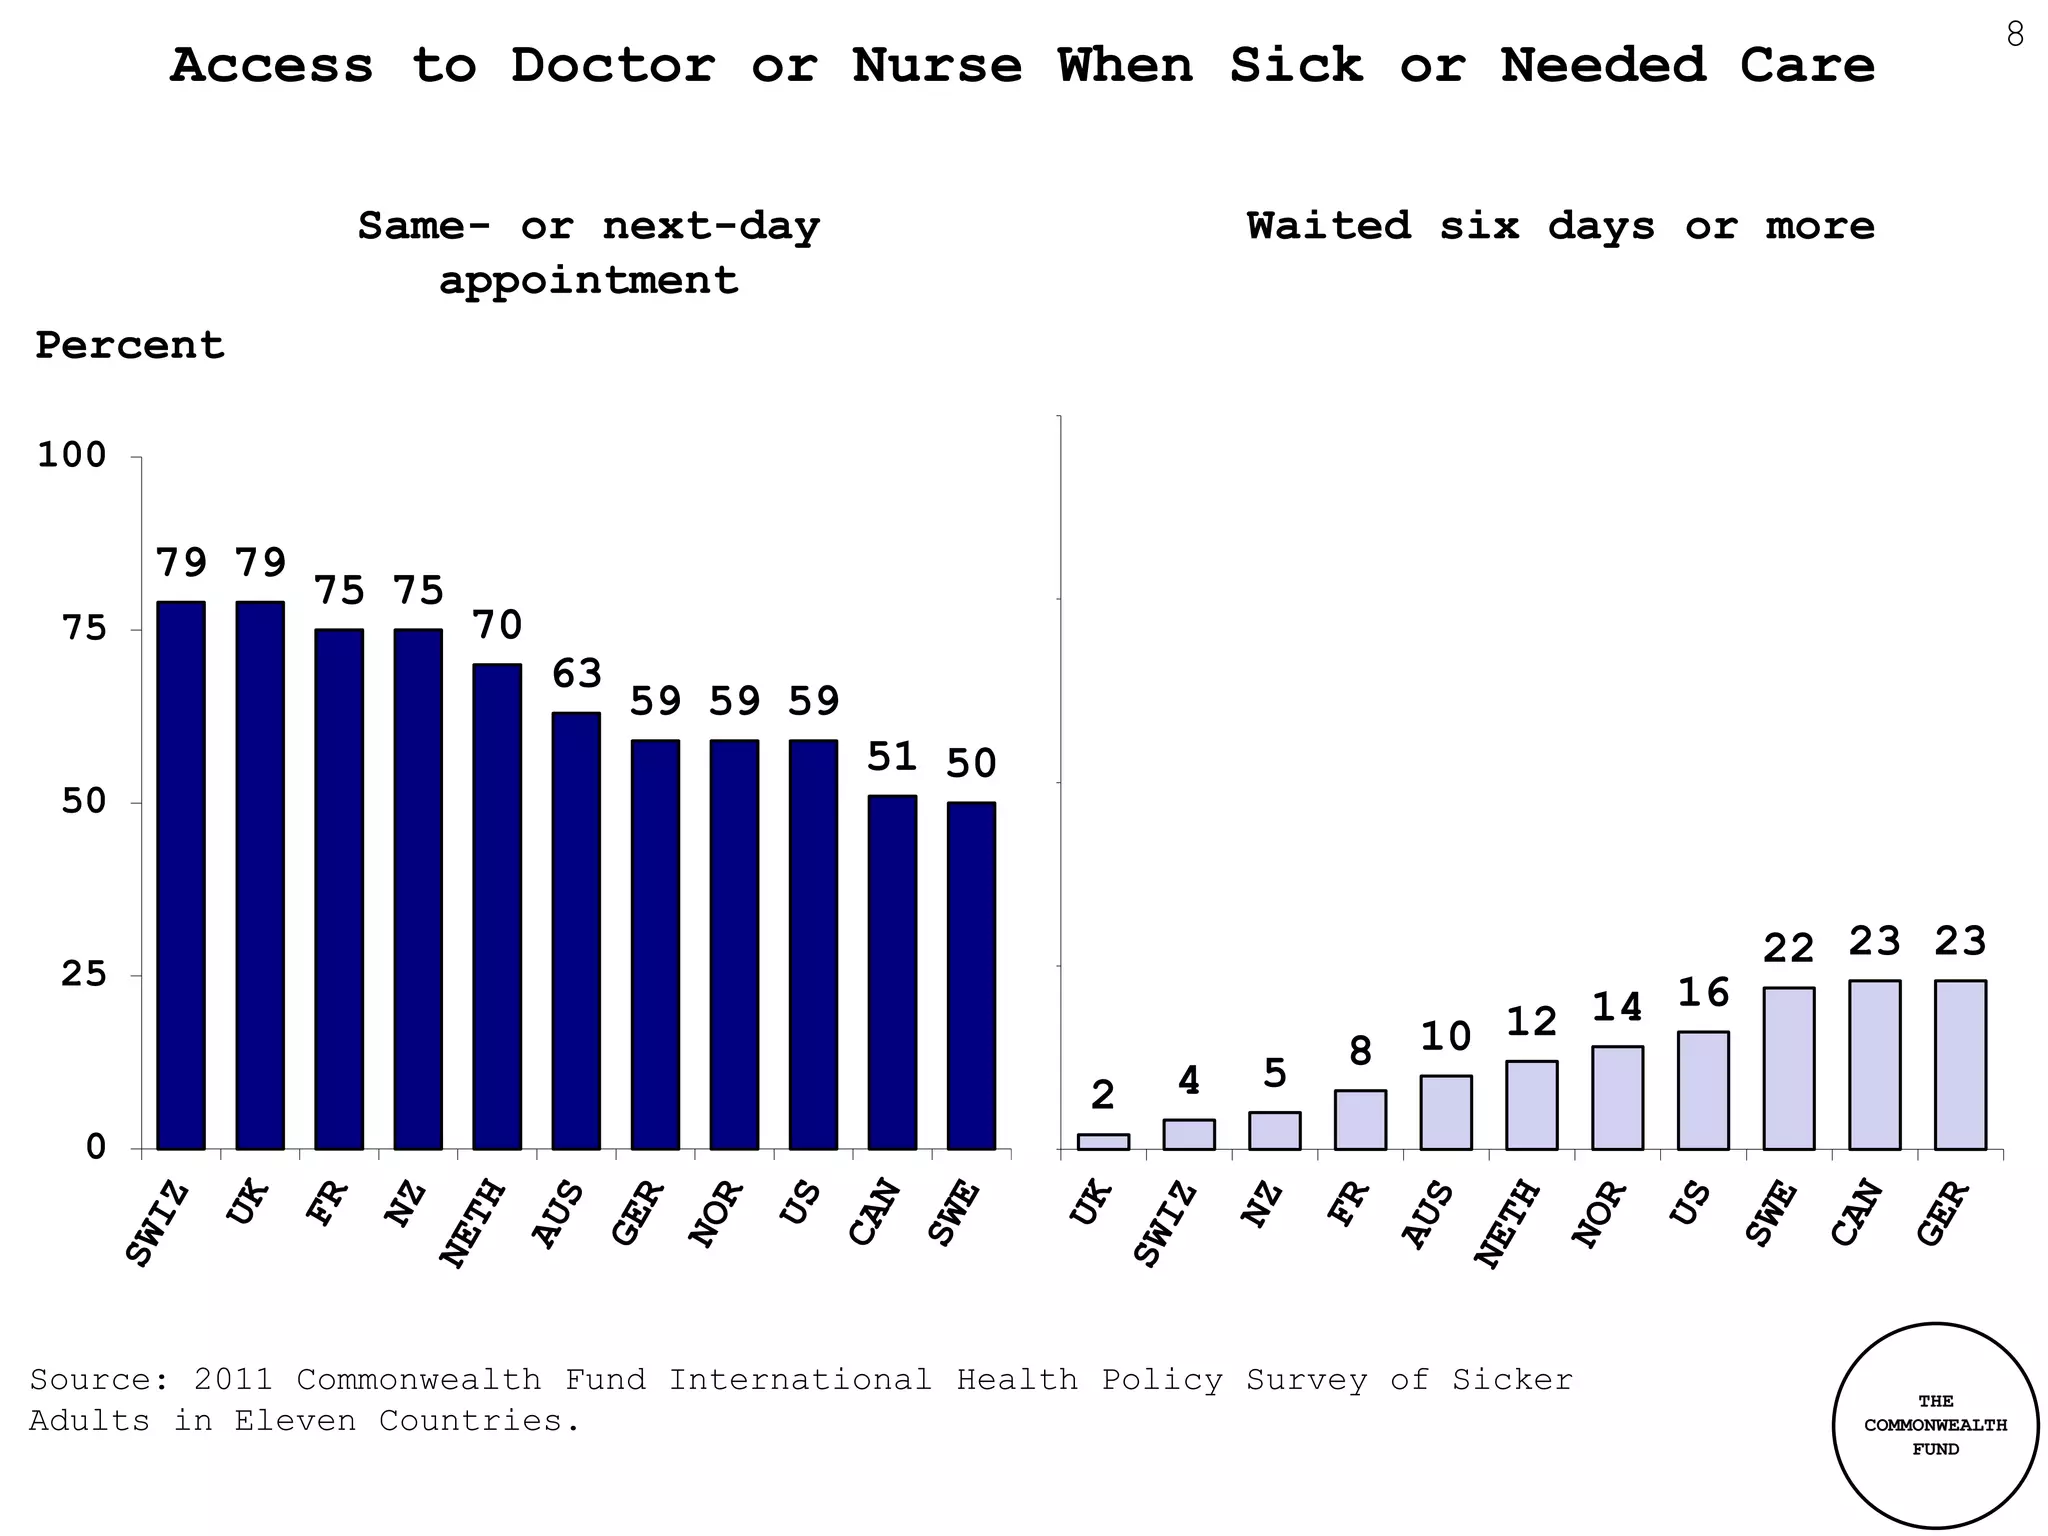
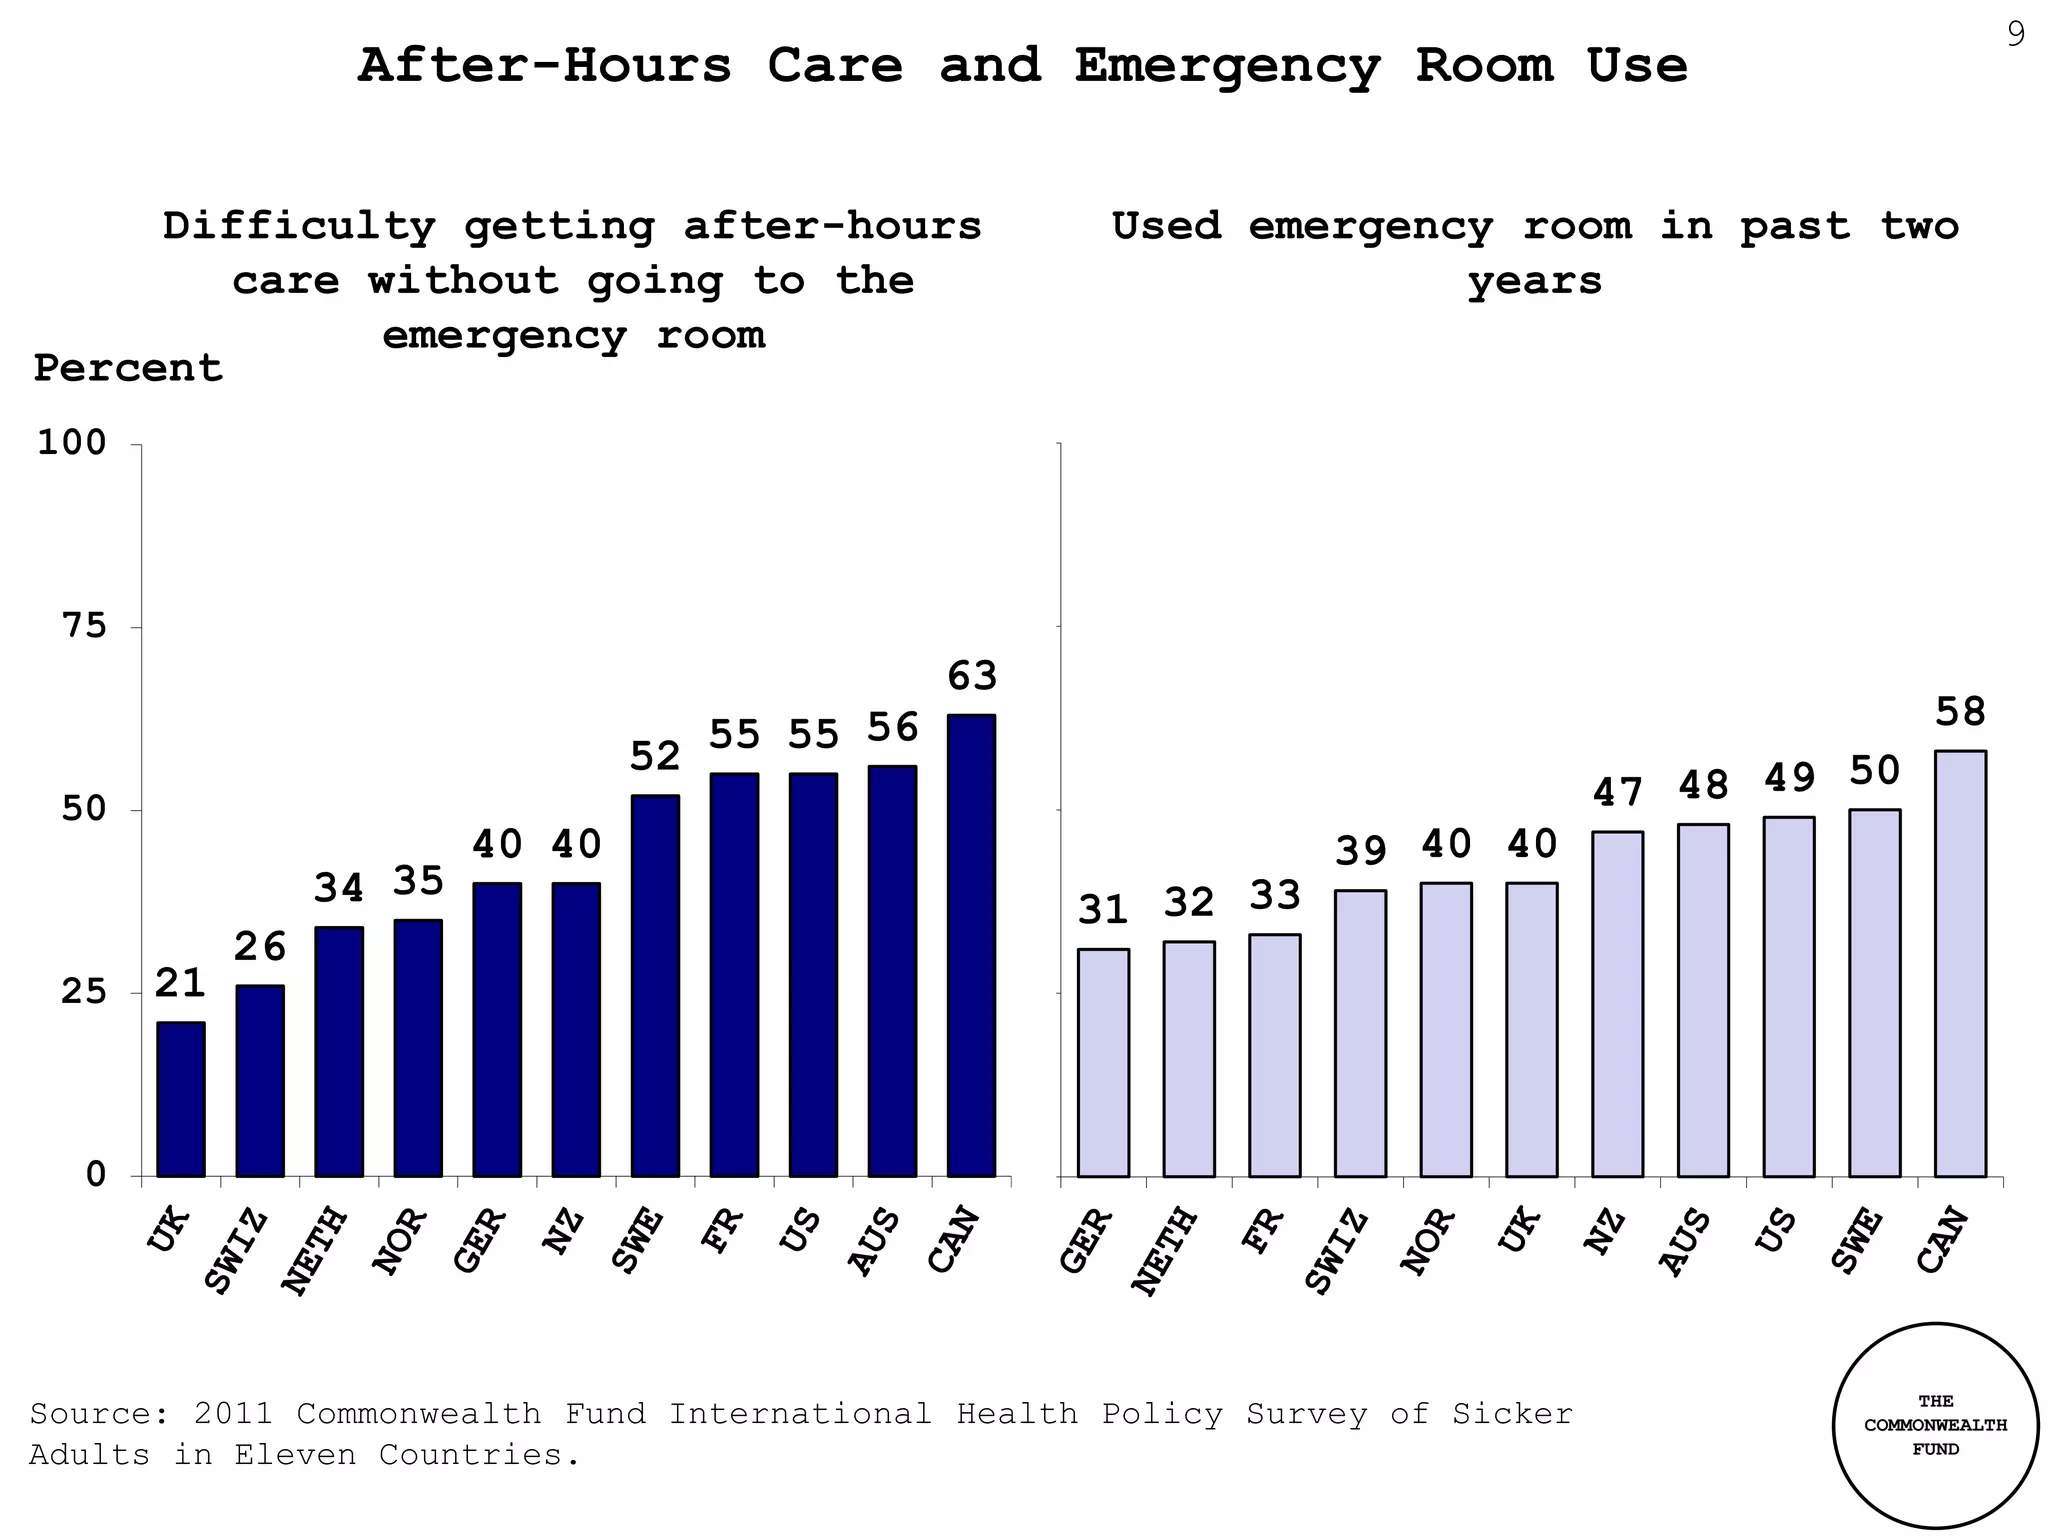
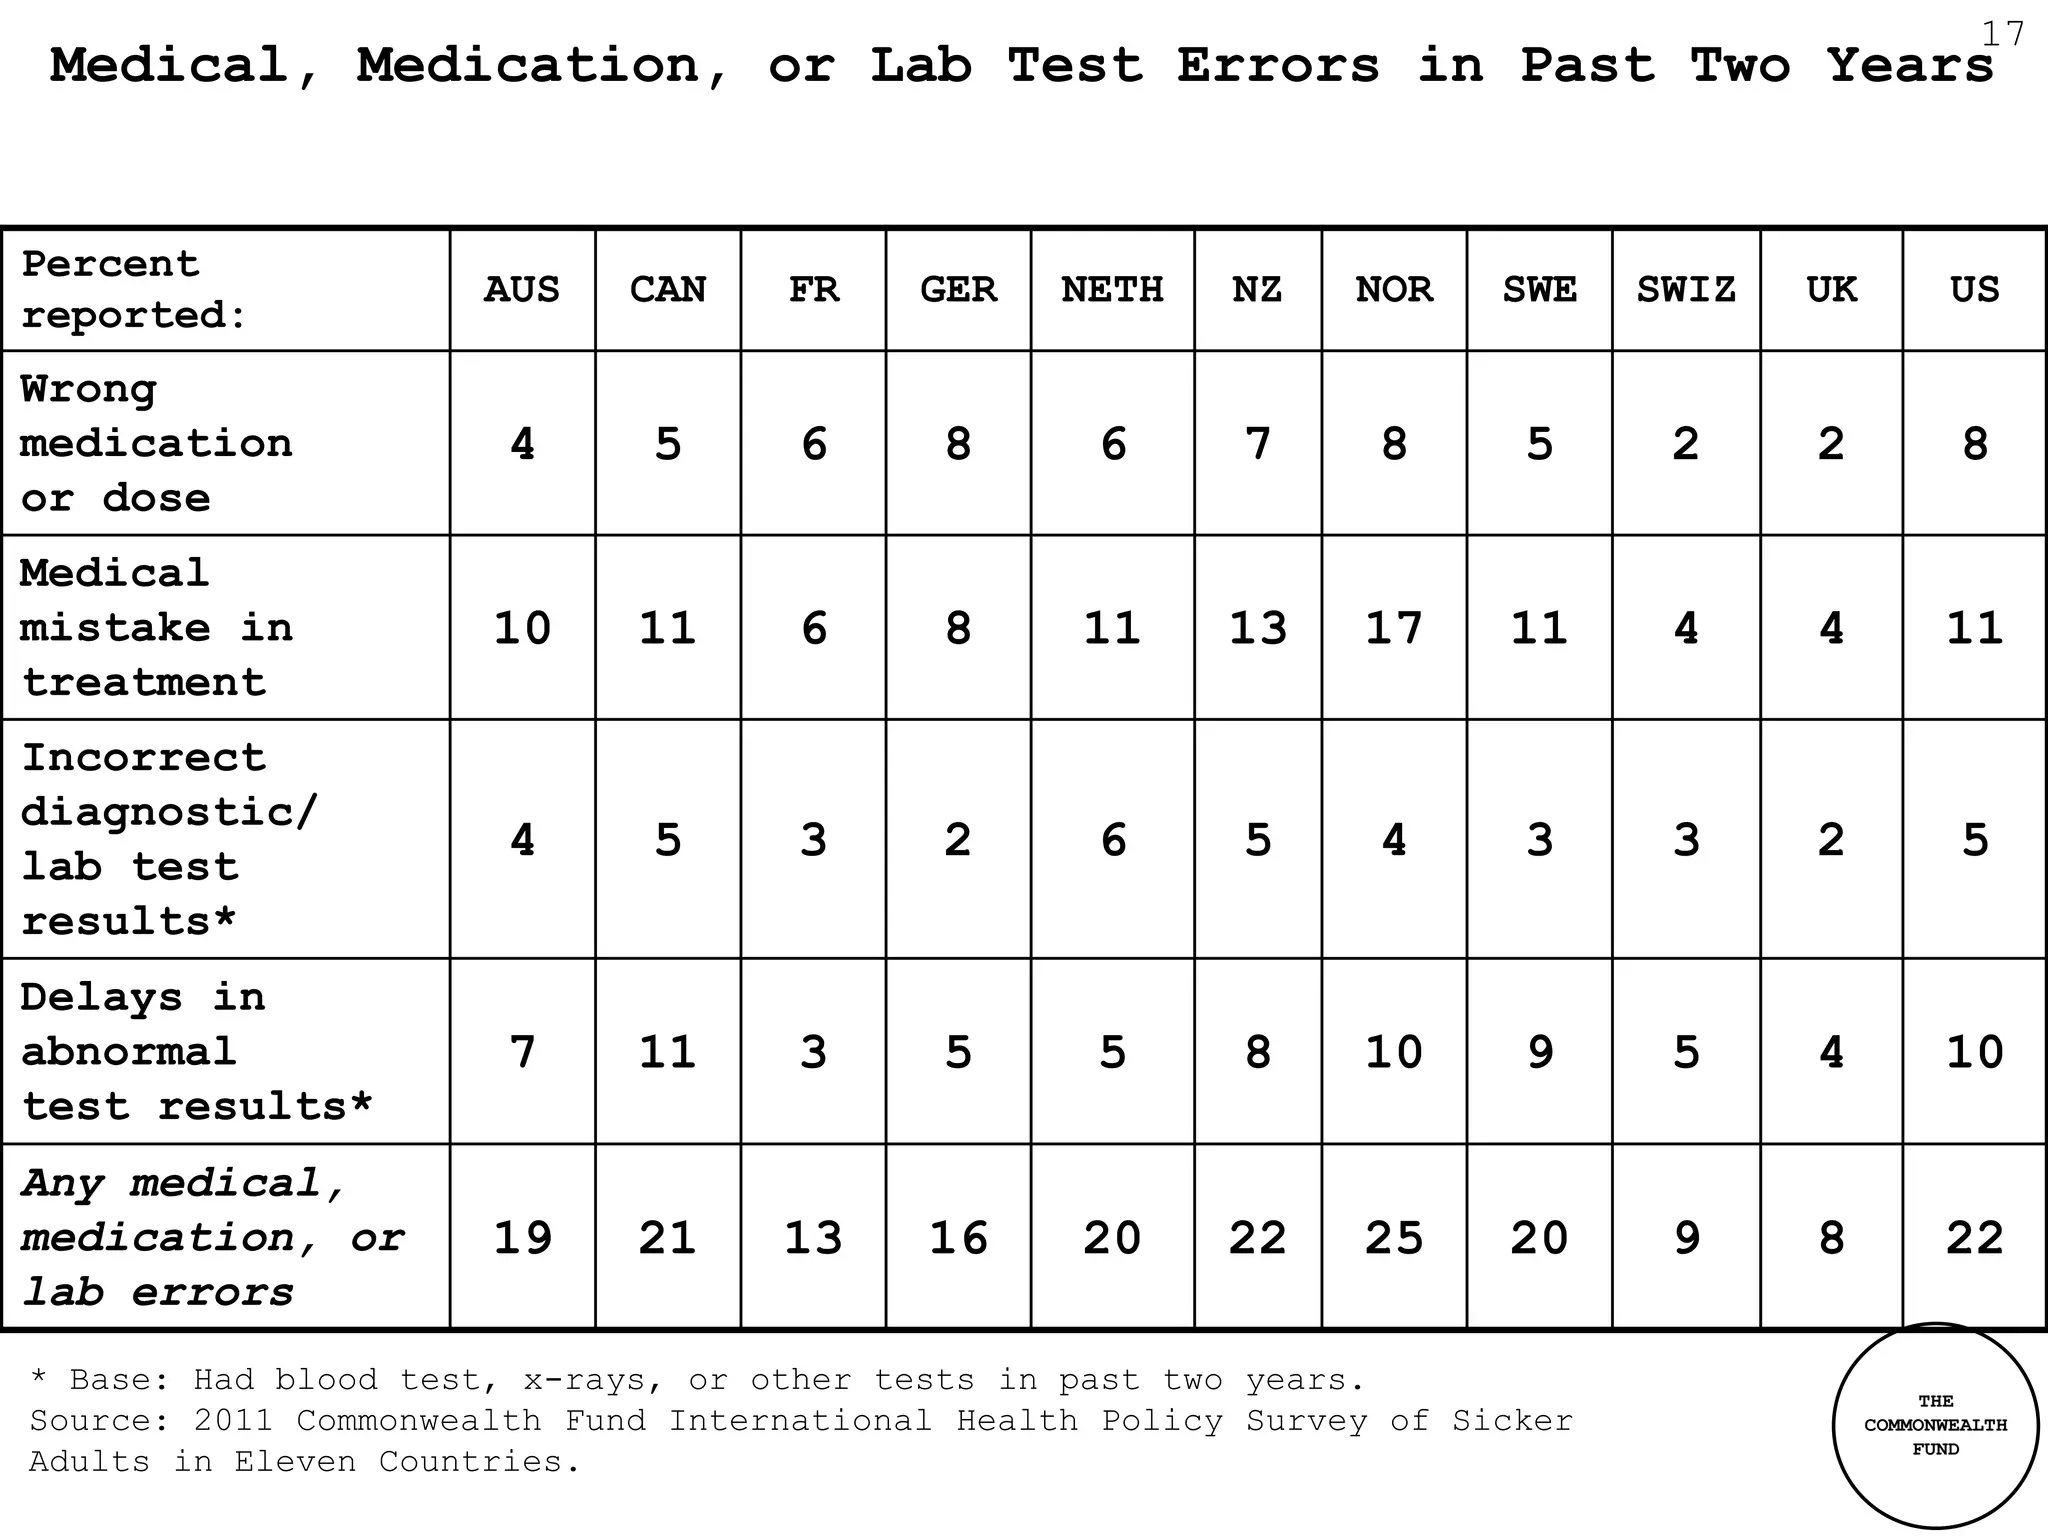
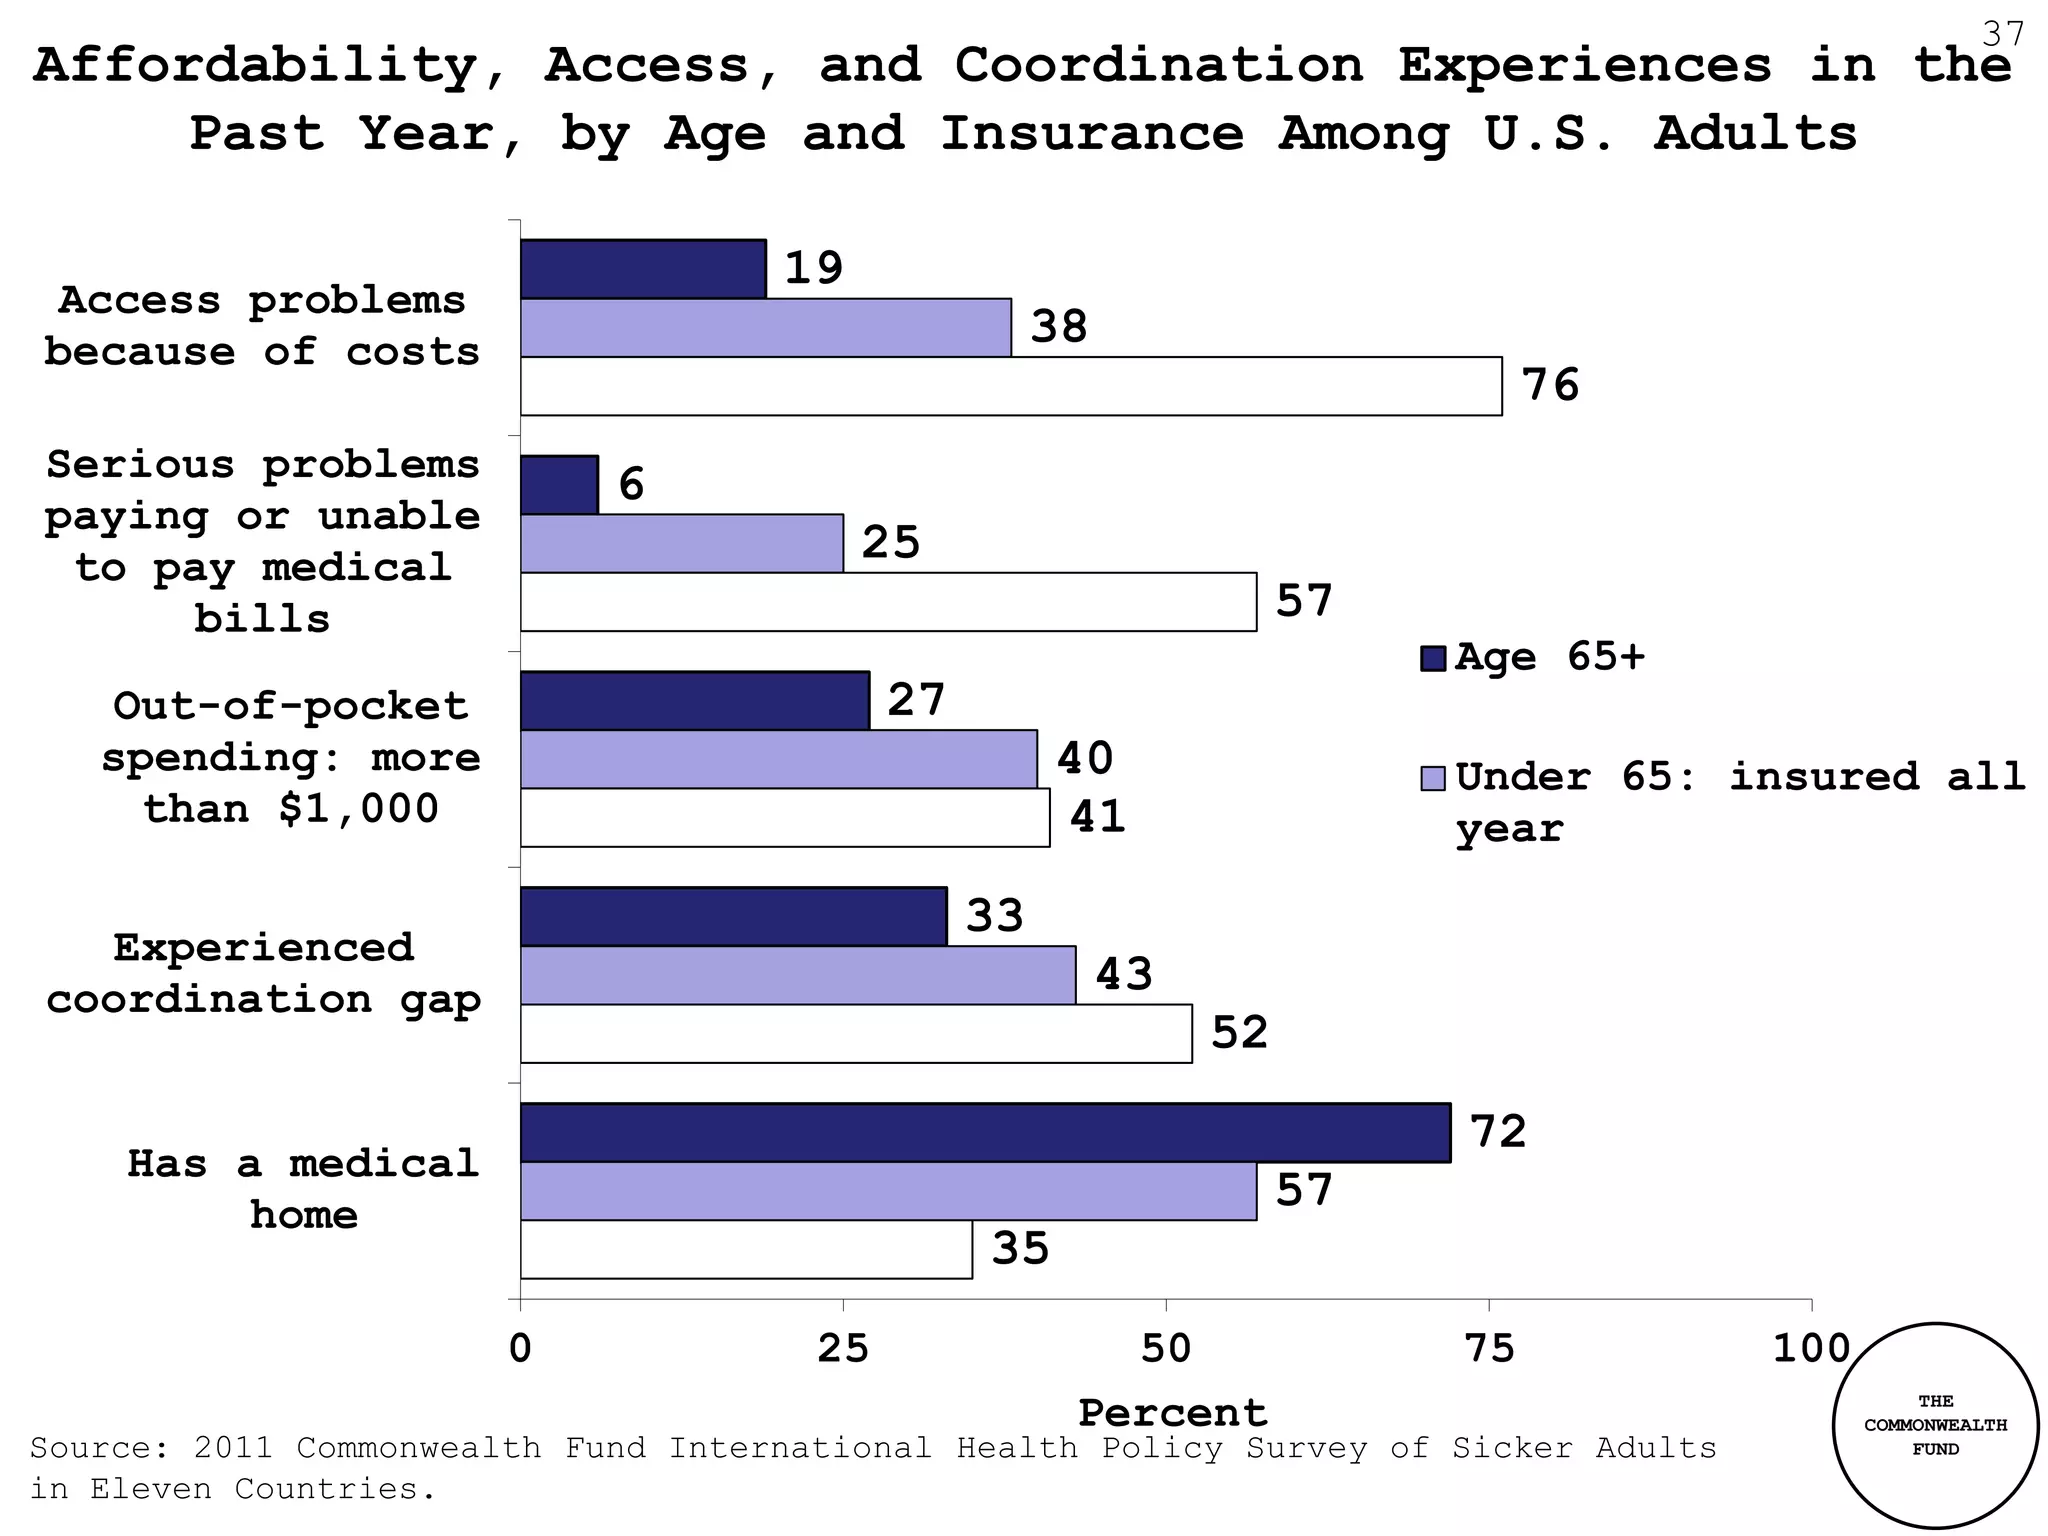

The document summarizes key findings from a 2011 survey of sicker adults in 11 countries that assessed access, affordability, quality of care and health system performance. Some of the main results presented include: 1) Out-of-pocket costs and problems paying medical bills were highest in the U.S. compared to other countries; 2) Access to same-day doctor appointments was best in Norway, Sweden and the UK, and worst in the U.S.; 3) Difficulty obtaining after-hours care without going to the emergency room was also greatest in the U.S.


![Klaus naivasha1 2011 nc ds[1]](https://cdn.slidesharecdn.com/ss_thumbnails/klausnaivasha12011ncds1-110829133819-phpapp02-thumbnail.jpg?width=640&height=640&fit=bounds)


![York integration seminar [5.4.12] (c brand et al)](https://cdn.slidesharecdn.com/ss_thumbnails/yorkintegrationseminar5-4-12cbrandetal-121014152821-phpapp02-thumbnail.jpg?width=640&height=640&fit=bounds)


