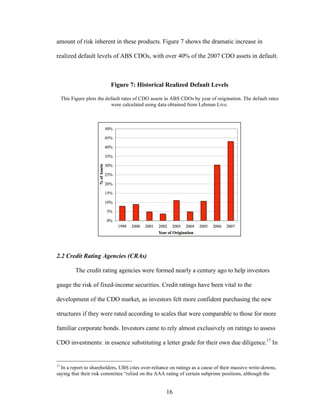
The Story of the CDO Market Meltdown:

         An Empirical Analysis


      Anna Katherine Barnett-Hart


Presented to the Department of Economics
 in partial fulfillment of the requirements
for a Bachelor of Arts degree with Honors


           Harvard College
        Cambridge, Massachusetts


             March 19, 2009


                    1
The Story of the CDO Market Meltdown:

                                      An Empirical Analysis*


                                               Abstract:


        Collateralized debt obligations (CDOs) have been responsible for $542 billion in
write-downs at financial institutions since the beginning of the credit crisis. In this paper,
I conduct an empirical investigation into the causes of this adverse performance, looking
specifically at asset-backed CDO’s (ABS CDO’s). Using novel, hand-collected data from
735 ABS CDO’s, I document several main findings. First, poor CDO performance was
primarily a result of the inclusion of low quality collateral originated in 2006 and 2007
with exposure to the U.S. residential housing market. Second, CDO underwriters played
an important role in determining CDO performance. Lastly, the failure of the credit
ratings agencies to accurately assess the risk of CDO securities stemmed from an over-
reliance on computer models with imprecise inputs. Overall, my findings suggest that the
problems in the CDO market were caused by a combination of poorly constructed CDOs,
irresponsible underwriting practices, and flawed credit rating procedures.


*
  I would like to thank the following people and businesses who willingly gave of their time and expertise
to help me tell the story of the CDO market meltdown: Michael Blum, Michael Blum Consulting, Ann
Rutledge, Sylvain Raynes, R&R Consulting, Eliot Smith, Sam Jones, Mark Adelson, Mark McKenna,
Thomas Giardi, Arturo Cifuentes, Douglas Lucas, Paul Muolo, Richard Baker, Eric Siegel, and Richard
Gugliada. I am also grateful for the guidance and advising of the following Harvard Professors and doctoral
students: Efraim Benmelech, Paul Healy, Erik Stafford, Allen Ferrell, Martin Feldstein, Erkko Etula, Laura
Serban, Jenn Dlugosz, and David Seif. All remaining errors are my own.


                                                    2
1. Introduction

        Collateralized debt obligations (CDOs), once a money making machine on Wall

Street, have been responsible for $542 billion of the nearly trillion dollars in losses

suffered by financial institutions since 2007.1 Perhaps most disturbing about these losses

is that most of the securities being marked down were initially given a rating of AAA by

one or more of the three nationally recognized credit rating agencies,2 essentially marking

them as “safe” investments.3 While the credit rating agencies have taken heavy criticism

for their role in mis-rating billions of dollars in CDO tranches,4 they were not alone in

their mistake. Indeed, almost all market participants, from investment banks to hedge

funds, failed to question the validity of the models that were luring them into a false

sense of security about the safety of these manufactured securities. How could so many

brilliant financial minds have misjudged, or worse, simply ignored, the true risks

associated with CDOs? In this paper, I use novel, hand-collected data from 735 ABS

CDOs to shed light on this mystery, investigating the causes of adverse performance in

CDOs backed by asset-backed securities (ABS CDOs).5 I characterize the relative

importance of general CDO properties, underwriting banks, and credit rating agencies in

contributing to the collapse of the CDO market and document several findings.

        First, the properties of the CDO collateral, including asset class and vintage, are

the most important factor in explaining the variation in CDO performance. In particular,


1
  According to CreditFlux Newsletter, as of January 8, 2008.
2
  Moody’s, S&P, and Fitch.
3
  According to financial consultant Mike Blum, underwriters would often pay for all three agencies to rate
their deals to “convey the impression that these bonds were rock-solid.”
4
  See Roger Lowenstein’s article, “Triple-A Failure,” for an overview of the criticism of the rating
agencies.
5
  ABS CDOs are CDOs whose collateral consists primarily of asset-backed securities, as opposed to CDOs
backed by corporate bonds or whole loans. ABS CDOs accounted for more than 90% of the U.S. CDOs
downgraded in 2007.


                                                    3
CDOs with a high level of exposure to residential mortgage securities, specifically those

backed by subprime and Alt-A adjustable-rate mortgages, consistently underperformed

other CDOs. In addition, losses were higher for CDOs with a large amount of 2006 and

2007 vintage collateral. Secondly, the identity of the CDO underwriter is a significant

predictor for CDO performance, even after controlling for collateral type. This finding

shows that there was variation among banks’ underwriting standards, with some banks

consistently more careful in their collateral selection. For example, J.P. Morgan’s CDOs

consistently underperformed, while those from Goldman Sachs were among the top

performers. Lastly, the original credit ratings assigned to CDOs failed to capture the true

risks of these securities. There was a striking uniformity in the initial proportion of AAA

given to all CDO deals, despite the wide variety in the characteristics of their collateral

and the quality of their underwriters. On the whole, the original credit ratings of CDO

bonds, most notably those given to the senior tranches, were grossly inflated.

       The structure of the paper is as follows: Section 2 gives an overview of CDOs, the

role of the rating agencies, and the involvement of investment banks. Section 3 outlines

guiding questions and hypotheses. Section 4 presents results of the multivariate

regression analysis. Section 5 discusses key findings and Section 6 concludes.


                                              4
2. Background: The Rise and Fall of the CDO

2.1 The Evolution of Collateralized Debt Obligations

       The basic principle behind a CDO involves the re-packaging of fixed income

securities and the division of their cash flows according to a strict waterfall structure. A

CDO is constructed by creating a “brain-dead” company, a special purpose entity (SPE)

or structured investment vehicle (SIV), which buys assets and issues bonds backed by the

assets’ cash flows. The bonds are divided into a number of tranches with different claims

on the principal and interest generated by the CDO’s assets. The mechanics of a typical

CDO are illustrated in Diagram A.


                            Diagram A: Mechanics of a CDO
                                Source: Bionicturtle.com


                                              5
In order to understand the recent implosion of the CDO market, it is helpful to

examine the factors that fueled the market’s explosive growth since 2004, as illustrated in

Diagram B. There are two main factors that made the pooling and tranching of loans so

attractive to the investors and investment banks that created CDOs – regulatory capital

relief and risk reallocation.6


                              Diagram B: CDO Issuance in Billions
                                   Source: Asset-Backed Alert


6
  Bluhm (2003) analyzes the different factors that have contributed to the success of CDO trading: spread
arbitrage opportunities, regulatory capital relief, funding, and economic risk transfer. Mitchell (2004)
argues that tranching only creates value in the presence of market imperfections, such as asymmetric
information and adverse selection, and that originators can only profit from underwriting if they “possess
some sort of comparative advantage…to the extent that other intermediaries can acquire identical assets,
any potential profit form tranching may be quickly driven to zero”(Mitchell 11).


                                                     6
Securitization helped many banks to free up their balance sheets, allowing them to pool

and tranche a bundle of loans and either sell the tranches to outside investors or put them

in off-balance sheet vehicles. By removing loans from their books, underwriters of CDOs

could decrease the capital charges imposed by the Basel Accords and their own internal

risk requirements and thereby free up cash to make new loans.7

           The second rationale for CDOs involved the pooling and re-allocation of risk. In

theory, by pooling together a number of imperfectly correlated assets, it is possible to use

diversification to decrease idiosyncratic risk. Furthermore, tranching the cash flows made

        it possible to create securities with different risk profiles appropriate to specific

     investors.8 This was especially important for institutional investors, many of who can

    purchase only investment-grade securities (defined as those with a credit rating of BBB-

    or higher). CDOs allowed these investors to gain exposure to assets that, on their own,

      had been too risky, while investors looking to take more risk and receive potentially

higher returns could buy the most junior or “equity” CDO tranches.9 Table 1 summarizes

    the typical liability structures of ABS CDOs, showing the average subordination levels

     and yields for each rated tranche. The average number of tranches is 7.4 and the most

      common structure is the following: three AAA-rated tranches (2 of which are super

senior bonds), one A-rated tranche, one BBB-rated tranche, and one unrated tranche. The

     average transaction size is $829 million and the average tranche size is $109 million.


7
  Basel I required that banks hold capital of at least 8% of their loans. Basel II modified this slightly by
imposing different charges based on the riskiness of the asset, often determined by the assets’ credit ratings.
See Garcia et. al. (2008) for a more detailed explanation of capital requirement calculations.
8
  Krahnen (2005) finds that the senior tranches bear the highest degree of systematic risk, and Gibson
(2004) shows that most of the credit risk is contained in the equity tranche, regardless of the size of its
notional amount.
9
  According to Lehman Brother’s estimates, as of November 13, 2007, the biggest holders of AAA-rated
CDO tranches included bond insurers, insurance companies, CDO commercial paper put providers, SIV
and ABCP conduits, and investment banks.


                                                      7
Table 1: Capital Structure in CDOs

      This table summarizes the average liability structure of 735 ABS CDOs issued from 1999-2007. The %
       with tranche is the percent of CDOs that contained a tranche with the given rating at its issuance. The
      average number of tranches refers to the number per CDO with the given rating. The yield refers to the
     average coupon paid to the tranches, and the subordination refers to the percent of credit enhancement of
                                                 the given tranche.
                                               Source: Lehman Live

           Rating     % With Tranche Average # of Tranches Yield Subordination
           AAA           100.0%               2.5          3.4%     21.5%
           AA+            7.4%                0.1                   16.8%
           AA             81.7%               0.9          4.1%     14.0%
           AA-            12.7%               0.1                   11.0%
           A+             8.1%                0.1                   16.8%
           A              59.6%               0.6          4.3%     11.0%
           A-             25.5%               0.3                   12.0%
           BBB+           11.3%               0.1                   14.5%
           BBB            80.1%               0.9          4.4%      6.8%
           BBB-           19.3%               0.2                   10.2%
           Below BBB-     37.2%               0.5                      --
           Unrated        86.3%               1.1                      --
                            --                7.4                      --


            Initially, it seemed that every player was benefiting from CDOs and issuance

exploded, reaching $50 billion in 2006.10 The rating agencies were making record profits

as the demand for rated structured products skyrocketed.11 Institutional investors loved

the high-yielding AAA securities created from ABS CDOs, CDO underwriters collected

fees and achieved regulatory capital relief by off-loading their assets, and CDO collateral

managers earned hefty returns by retaining the equity tranches, benefiting from the low

cost of funding senior tranches. However, by 2003, several changes in CDOs were

working to create the perfect storm that was unleashed upon financial markets in 2007.


10
  Source: Securities Industry and Financial Markets Association
11
  According to a PBS special report, structured finance represented at least 40% of the revenues at the
CRAs since 2000. Over that time, Moody’s went public, saw its stock increase six fold, and its earnings
grow by 900%.


                                                        8
First, the collateral composition of CDOs changed as collateral managers looked

for ways to earn higher yields. The managers began investing more heavily in structured

finance securities, most notably subprime RMBS, as opposed to corporate bonds.

Furthermore, they invested in the mezzanine tranches of these securities, moves designed

to create higher-yielding collateral pools. Table 2 documents the evolution of ABS CDO

assets from 1999-2007, illustrating the profound increase in subprime RMBS (HEL)

collateral, with 36% of the 2007 CDO collateral comprised of HEL bonds. Figure 1

depicts a detailed breakdown of the collateral backing the 2005-2007 vintage ABS CDOs

and shows that the majority of collateral came from subprime and midprime RMBS.


                   Table 2: Average Principal Allocations by Asset-Class

 This table summarizes the average collateral composition for of 735 ABS CDO deals originated between
  1999-2007. The abbreviations stand for: HEL – home equity loan (includes all RMBS less than prime),
  RMBS – residential mortgage-backed securities (by prime borrowers), CMBS – commercial mortgage-
   backed securities, other ABS – other asset-backed securities (including auto-loans, credit-cards, etc.).
                                           Source: Lehman Live

 Year of Origination Deals % HEL % RMBS % CMBS % CDO % Other ABS
        1999           1    0%     14%     9%   3%      74%
        2000           16   5%      1%     2%   12%     80%
        2001           28   7%      6%     8%   18%     61%
        2002           47   16%     6%     7%   8%      63%
        2003           44   29%    14%     3%   18%     37%
        2004          101   35%    14%     6%   17%     28%
        2005          153   37%    16%    10%   11%     25%
        2006          217   33%    16%     7%   9%      35%
        2007          135   36%    12%     8%   14%     29%
      TOTAL           742   34%    14%     8%   12%     32%


                                                     9
Figure 1: Collateral Composition of ABS CDOs, 2005-2007 Vintage

 This Figure presents the collateral makeup of 2005-2007 ABS CDOs. Abbreviations – ARM: adjustable-
                                rate mortgage, CES: closed-end second lien.
                                       Source: OpenSource Model.


        In response to the explosion in CDO issuance, the increased demand for subprime

mezzanine bonds began to outpace their supply.12 Figure 2 shows the percentage of

subprime bonds that were repackaged into CDOs, illustrating the drastic increase in

subprime demand by CDOs. This surge in demand for subprime mezzanine bonds helped

to push spreads down – so much so that the bond insurers and real estate investors that

had traditionally held this risk were priced out of the market. The CDO managers that

now purchased these mortgage bonds were often less stringent in their risk analysis than

the previous investors, and willingly purchased bonds backed by ever-more exotic


12
  Deng et. al. (2008) find that the demand for subprime mezzanine bonds for CDOs was so great that it was
a significant factor in causing a tightening in the subprime ABS-treasury spread prior to 2007.


                                                   10
mortgage loans.13 Figure 3 looks specifically at the performance of the subprime

collateral, comparing the rating downgrades of the subprime bonds that were in CDOs

versus those that were not put in CDOs. Clearly, the bonds in the CDOs have performed

worse, indicating that there might have been a degree of adverse selection in choosing the

subprime bonds for CDOs 14


                   Figure 2: Repackaging of Subprime Bonds into CDOs

This figure shows the percent of subprime bonds repackaged into CDOs. “In CDO” includes bonds listed in
 either Lehman Live (LL) or Open Source (OS). “Not in CDO” includes all bonds in ABSNet database not
                                        in either LL or OS CDOs.


13
   A recent note by Adelson and Jacob (2008) argues that CDOs’ increasing demand for subprime bonds
was the key event that fundamentally changed the market.
14
   However, this result needs further investigation as it may be a result of the fact that the mezzanine
tranches, most common in CDOs, have all performed the worst, or that the rating agencies had an incentive
to monitor subprime bonds in CDOs more carefully, leading to a higher level of downgrades.


                                                   11
Figure 3: Rating Downgrades of Subprime Bonds

 This Figure plots the number of notches of the average downgrade for subprime bonds in CDOs vs. those
                     never repackaged. Sources: Lehman Live, Open Source, ABSNet.


        In addition to the increased investment in risky mortgage collateral, the next

development was the creation of the notorious “CDO squared,” (and the occasional

“CDO cubed”), which repackaged the hard-to-sell mezzanine CDO tranches to create

more AAA bonds for institutional investors. Figure 4 shows the amount of CDO tranches

that were repackaged into new CDOs, creating CDO squareds. The x-axis gives the

tranche category by waterfall priority (i.e. seniority, 1 = first paid, last loss), and the y-

axis shows the number of total tranches that were issued and repackaged. As expected,

the highest percent of repackaging occurred with lower seniority CDO tranches, with few

of the most senior tranches being resecuritized.


                                                  12
Figure 4: Repackaging of CDO Tranches
  This Figure illustrates the total number of tranches issued with a given waterfall priority (1 being most
senior) and the number of those tranches that were resecuritized into a CDO squared. Source: Open Source.


        Lastly, the advent of synthetic CDOs significantly altered the evolution of the

CDO market. Rather than investing in cash bonds, synthetic CDOs were created from

pools of credit-default swap contracts (CDS), essentially insurance contracts protecting

against default of specific asset-backed securities.15 The use of CDS could give the same

payoff profile as cash bonds, but did not require the upfront funding of buying a cash

bond. Furthermore, using CDS as opposed to cash bonds gave CDO managers the

freedom to securitize any bond without the need to locate, purchase, or own it prior to


15
   The advent of certain CDS indices with reference to pools of asset-backed securities encouraged this
trend. The ABX Index is a series of credit-default swaps based on 20 bonds that consist of subprime
mortgages. ABX contracts are commonly used by investors to speculate on or to hedge against the risk that
the underling mortgage securities are not repaid as expected. The ABX swaps offer protection if the
securities are not repaid as expected, in return for regular insurance-like premiums. The CMBX is a similar
index referencing a basket of commercial mortgage-backed securities.


                                                    13
issuance.16 Figure 5 shows two changes in CDO investments since 1999: the decrease in

collateral backed by fixed-rate assets and the increased use of synthetic assets (i.e. CDS).

Taken together, these observations indicate that CDOs began to invest in more risky

assets over time, especially in subprime floating rate assets. Essentially, CDOs became a

dumping ground for bonds that could not be sold on their own – bonds now referred to as

“toxic waste.” As former Goldman Sachs CMBS surveillance expert Mike Blum

explains: Wall Street reaped huge profits from “creating filet mignon AAAs out of BB

manure.”


                   Figure 5: Collateral Composition Trends in ABS CDOs

     This Figure shows the historical changes in CDO bond collateral among fixed rate, floating rate, and
                                 synthetic bond types. Source: Lehman Live.


16
  The demand for ABS bonds for CDOs was so high, that underwriters and managers often had trouble
securing enough bonds for a CDO. Several former CDO managers described this situation as “extremely
frustrating,” as they would often spend significant amounts of time analyzing new bond issues, only to find
out that they were oversold or that they could purchase just a small amount. Using CDS guaranteed that
CDO managers could take “bets” on any bond they found desirable, regardless of its limited supply.


                                                     14
The deterioration in CDO collateral quality was matched by a decrease in the

credit support of the rated tranches, leaving investors more exposed to losses on the

collateral. Figure 6 gives a graphical presentation of the subordination levels over time:

the subordination levels have decreased slightly for all tranches, with the most

pronounced decline visible in the AAA-rated tranches, which went from an average of

25% subordination in 2002 to less than 15% in 2007.


                 Figure 6: CDO Weighted Average Subordination Levels

 This Figure plots the annual average percentage of subordination by bond class for 697 CDOs originated
                                between 2002-2007. Source: Lehman Live.


        With the issuance of CDOs growing unabated and the quality of their collateral

declining, both the rating agencies and the investment banks failed to recognize the


                                                  15
amount of risk inherent in these products. Figure 7 shows the dramatic increase in

realized default levels of ABS CDOs, with over 40% of the 2007 CDO assets in default.


                            Figure 7: Historical Realized Default Levels

     This Figure plots the default rates of CDO assets in ABS CDOs by year of origination. The default rates
                             were calculated using data obtained from Lehman Live.


2.2 Credit Rating Agencies (CRAs)

           The credit rating agencies were formed nearly a century ago to help investors

gauge the risk of fixed-income securities. Credit ratings have been vital to the

development of the CDO market, as investors felt more confident purchasing the new

structures if they were rated according to scales that were comparable to those for more

familiar corporate bonds. Investors came to rely almost exclusively on ratings to assess

CDO investments: in essence substituting a letter grade for their own due diligence.17 In


17
  In a report to shareholders, UBS cites over-reliance on ratings as a cause of their massive write-downs,
saying that their risk committee “relied on the AAA rating of certain subprime positions, although the


                                                      16
addition, credit ratings from agencies deemed to be “nationally recognized statistical

organizations” (NRSRO) were used for regulatory purposes by the SEC. While there are

five credit rating agencies with the NRSRO qualification, only three were major players

in the U.S. structured finance market: Moody’s, Fitch, and Standard and Poor’s (S&P).18

Figure 8 shows the percent of CDO deals that contained a rating by the each of these

three rating agencies (the sum is greater than 100% because many deals were rated by

more than one agency). While S&P and Moody’s rated almost all CDO deals, Fitch’s

market share declined to less than 10% by 2007. The rating agencies earned high fees

from the CDO underwriters for rating structured finance deals, generating record profits

as seen in Diagram C. Table 3 shows the amount of CDO business each of the CRAs did

with the various CDO originators.19

         Problems with CDO ratings rapidly developed as the rating agencies came under

enormous pressure to quickly crank out CDO ratings and the market exploded faster than

the number or knowledge of analysts. Analysis of CDOs came to rely almost completely

on automated models, with very little human intervention and little incentive to check the

accuracy of the underlying collateral ratings.20


CDOs were built from lower-rated tranches of RMBS. This appears to have been common across the
industry. A comprehensive analysis of the portfolios may have indicated that the positions would not
necessarily perform consistent with their ratings”(UBS 39).
18
   The other two NRSROs are A.M. Best and Dominion Bond Rating Service (DBRS).
19
   Not surprisingly, all three CRAs did the most CDO ratings for Merrill Lynch, the biggest CDO
originator. After Merrill Lynch, the ranks of S&P and Moody’s clients are almost identical. However, Fitch
derived more of their CDO business from non-U.S. originators such as Calyon, UBS, and WestLB.
20
   In his testimony before congress, Frank Raiter, a former RMBS analyst at S&P, testified that he was
often asked to give RMBS ratings for CDOs without essential credit information. According to Raiter, the
managing director of CDO ratings, Richard Gugliada, said: “Any request for loan level tapes is TOTALLY
UNREASONABLE!! Most investors don’t have it and can’t provide it. Nevertheless we MUST produce a
credit estimate…It is your responsibility to provide those credit estimates and your responsibility to devise
some method to do so.” (Testimony before the Committee on Oversight and Government Reform, October
22, 2008).


                                                     17
Figure 8: Credit Rating Agency’s Market Share in CDO Ratings


This Figure plots the percent of all CDOs (both ABS and corporate) rated by each of the three rating
                               agencies. Source: UBS CDO Research.


           Diagram C: Revenue of the Big 3 Rating Agencies, 2002-2007
                                  Source: thismatter.com/money


                                                18
Table 3: Biggest Clients of the Credit Rating Agencies

  This table shows the amount of business each CDO originator did with the three main CRAs.
 Ranks are based on the total par amount of CDO tranches rated by the agency: the higher ranks
correspond to more business. The total amount rated by the agency is shown in parentheses under
                       the rank. The results are sorted by average ranking.

                                  Average       Moody's       Fitch Rank    S&P Rank
                Originator         Rank            Rank         ($mm)        ($mm)
                                                  ($mm)
       Merrill Lynch                 1               1              1             1
                                                ($76,908)      ($31,269)     ($77,275)
       Citigroup                     2               2              6             2
                                                ($28,497)       ($2,972)     ($29,106)
       UBS                           3               6              2             4
                                                ($17,124)       ($6,962)     ($20,396)
       Wachovia                      4               4              7             5
                                                ($20,328)       ($2,527)     ($20,337)
       Calyon                        5               7              3             7
                                                ($16,877)       ($4,656)     ($16,848)
       Goldman Sachs                 6               3             14             3
                                                ($22,477)       ($0,798)     ($22,617)
       Deutsche Bank                 7              10              5             8
                                                ($12,251)       ($3,390)     ($14,471)
       Various Small Banks           8               5             13             6
                                                ($18,742)       ($0,947)     ($18,689)
       Credit Suisse                 9               8              8             9
                                                ($13,330)       ($1,893)     ($14,088)
       RBS                           10             12              9            12
                                                ($10,686)       ($1,673)     ($11,704)
       Lehman Brothers               11             11             12            11
                                                ($11,985)       ($1,085)     ($12,024)
       Bear Stearns                  12              9             16            10
                                                ($13,252)       ($0,296)     ($13,530)
       Unknown                       13             13             11            13
                                                ($10,596)       ($1,248)     ($10,566)
       Bank of America               14             14             10            14
                                                 ($7,994)       ($1,259)      ($8,412)
       WestLB                        15             17              4            19
                                                 ($4,178)       ($3,935)      ($1,345)
       Dresdner Bank                 16             15            none           15
                                                 ($7,732)                     ($7,732)
       Morgan Stanley                17             16            17             16
                                                 ($6,091)      ($0,242)       ($6,091)
       Barclays Capital              18             18            15             17
                                                 ($3,005)      ($0,479)       ($3,417)
       JP Morgan                     19             19           none            18
                                                 ($1,769)                     ($1,755)


                                              19
According to Mark Adelson, now Chief Credit Officer at S&P:

      The advent of CDOs in the mid-1980s was a watershed event for the
      evolution of rating definitions. Until the first CDOs, rating agencies were
      only producers of ratings; they were not consumers. With the arrival of
      CDOs, rating agencies made use of their previous ratings as ingredients for
      making new ratings – they had to eat their own cooking. For rating CDOs,
      the agencies used ratings as the primary basis for ascribing mathematical
      properties (e.g., default probabilities or expected losses) to bonds.21

Not only did the rating agencies fail to examine the accuracy of their own prior collateral

ratings, but in many cases, they also used other agency’s ratings without checking for

accuracy. To correct for any shortcomings in the other agency’s rating methodology, they

created the practice of “notching,” whereby they would simply decrease the rating of any

collateral security that they did not rate by one notch.22 In other words, if Moody’s rated a

CDO that was composed of collateral rated BB+ by Fitch only, Moody’s would instead

use a rating of BB in their own CDO model because it was not their rating. They never

went back and reanalyzed the other rating agency’s rating, conveniently assuming that

decreasing it by a notch would compensate for any shortcomings in the initial risk

analysis.

      The inputs and definitions associated with the models were frequently changed,

generating confusion and inconsistencies in the ratings: Fitch’s model showed such

unreliable results using its own correlation matrix that it was dubbed the “Fitch’s

Random Ratings Model.”23 Furthermore, it became clear that similarly rated bonds from

different sectors (i.e. ABS vs. corporate bonds, RMBS vs. CMBS) had markedly different

track records of realized default probabilities, and the agencies began to adjust their

meanings and models haphazardly in an attempt to correct their previous mistakes. In

21
   Adelson (2006), pg. 5
22
   SEC Report on Rating Agencies
23
   Tavakoli (2005), pg. 3


                                             20
S&P’s 3.0 version of the CDO Evaluator, released in December 2005, the agency

published complete tables of default probabilities for ABS/MBS, corporate bonds, and

CDOs with conflicting definitions depending on the asset it was used to rate. Adelson

voiced concerns about this lack of consistency in 2006, stating that:

      The different meanings had some bizarre implications. Suppose you have a
      seven-year ABS rated AA+. According to the tables, the instrument has an
      idealized default probability of 0.168%. If we repackage the security (all by
      itself) and call the repackaged instrument a CDO, it ought to get a rating of
      AAA because the idealized default rate for a AAA-rated CDO is 0.285%.24
      This seems simply an affront to common sense. It illustrates why variable
      definitions of rating symbols are a problem.25


However, investors thought, and were encouraged to believe, that the ratings of CDOs

corresponded to similar default distributions as individual corporate bonds, thereby

further fueling the asset-backed frenzy. Lastly, as CDO structures became more complex,

incorporating features such as super senior tranches, payment-in-kind (PIK) provisions,26

and a diversity of trigger events that could change the priority of liability payments, CDO

ratings became even less meaningful.27

      In addition to the problems with the accuracy of the ratings, there was also the fact

that the ratings themselves were not meaningful indicators for assessing portfolio risk. As

Coval et. al. (2009) notes, credit ratings, “by design only provide an assessment of the

risks of the security’s expected payoff, with no information regarding whether the

security is particularly likely to default at the same time as there is a large scale decline in

24
   This means that a CDO was allowed to have a higher default rate (worse performance) than other
securities, and still garner an AAA rating.
25
   Adelson (2006), pg. 6
26
   In the case of an interest shortfall, PIK provisions say that investors can be paid with more bonds, instead
of cash. Thus, investors accrue principal as opposed to receiving their interest.
27
   According to Tavakoli, the CRAs did not acknowledge the existence of super senior tranches. They were
only concerned with solving for the proper AAA attachment point. In reality though, an investor should not
be indifferent to owning the AAA tranche from a CDO with a super senior and one without, for the former
tranche is a first-loss tranche supporting the super senior.


                                                      21
the stock market or that the economy is in recession.” 28 Furthermore, ratings are a static

measure, designed to give a representation of expected losses at a certain point in time

with given assumptions. It is not possible for a single rating to encompass all the

information about the probability distribution that investors need to assess its risk. Dr.

Clarida, an executive vice president at PIMCO, points out that, “distributions are

complicated beasts – they have means, variances, skews, and tails that can be skinny or,

more often, fat. Also – they have kurtosis, fourth moments, and transition

probabilities.”29 Investors often overcame these limitations by looking at ratings history,

filling in their missing information with data about the track record of defaults for a given

rating. Since there was little historical data for CDOs, investors instead looked at

corporate bond performance. However, as noted above, asset-backed ratings have proven

to have very different default distributions than corporate bonds, leading to false

assessments.

         The heavy reliance on CDO credit ratings made it more devastating when

problems with the models and processes used to rate structured finance securities became

apparent.30 The Bank for International Settlements commissioned a report summarizing

the difficulties in rating subprime RMBS.31 They found that the credit rating agencies

underestimated the severity of the housing market downturn, which in turn caused a sharp

increase in both the correlation among subprime mezzanine tranche defaults and their

overall level of realized defaults, while decreasing the amount recovered in the event of a


28
   Coval et. al. (2007) find that “in fixed income markets, many investors focus exclusively on estimates of
expected payoffs, without considering the state of the economy in which default is likely to occur,” and
show that “many structured finance instruments can be characterized as economic catastrophe bonds, but
offer far less compensation than alternatives with comparable payoff profiles.”
29
   PIMCO Global Perspectives, March 2009.
30
   For a detailed explanation of the rating methodologies of the three CRAs, see Fender and Kiff (2004).
31
   See BIS Committee on the Financial System (2008).


                                                     22
default (i.e. loss given default). In addition, the ratings of subprime RMBS relied on

historical data confined to a relatively benign economic environment, with very little data

on periods of significant declines in house prices.

           Figure 9 reveals the level of optimism of original CDO ratings, showing the credit

ratings of the CDO tranches and of their collateral asset pools, both at issuance and

currently.32 This Figure shows that the CRAs somehow manufactured huge amounts of

AAA CDO securities from collateral with much lower ratings, confirming that one of the

reason CDOs were so profitable in 2005-2007 was that it was possible to manufacture a

high proportion of highly rated securities from lower quality assets. That practice has

backfired, resulting in massive downgrades of the CDO tranches as it became apparent

that the rating agencies had been overly optimistic. While in 2005-2007, the initial ratings

given to CDO tranches were on average better than the ratings of their underlying

collateral assets, current CDO tranche ratings for these years are now significantly worse

than their associated collateral pool ratings.

           Figure 10 provides a display of the devastating level of downgrades associated

with CDO bonds, showing the average tranche downgrade of each CDO vintage grouped

by initial tranche rating. The AAA tranches have suffered a profound increase in

downgrades; while the average downgrade for AAA tranches of the 2002 vintage was

just 3 notches (to a rating of AA-), the average downgrade for AAA tranches from 2007

is 16 notches, meaning AAA tranches now carry an average rating of CCC+, 7 notches

below the minimum investment-grade ranking (BBB-).


32
     The numbers on the y-axis correspond with the rating scores in Appendix B (1=AAA, 22=D).


                                                    23
Figure 9: Evolution of CDO Tranche and Collateral Asset Ratings

This Figure shows the weighted average ratings of the CDO tranches and their underlying asset pools in the
high information sample both at issuance and currently, broken down by CDO vintage. The numbers on the
 y-axis correspond to the rating scale outlined in Appendix B, with lower numbers equal to higher-quality
                                          ratings (1=AAA, 22=D).


                  Figure 10: Downgrades of CDO Tranches Across Time

   This Figure shows the average downgrade of CDO ratings from each CDO vintage, by initial tranche
   rating. The numbers on the y-axis correspond to the rating scale outlined in Appendix B, with lower
                        numbers equal to higher-quality ratings (1=AAA, 22=D).


                                                   24
While all three rating agencies severely underestimated the true risk of CDO

bonds, there has been some distinction in the ex-post performance of CDOs rated by

different combinations of the three CRAs. Figure 11 shows the percent of CDOs rated by

each agency combination that experienced an event of default (EOD) as of June 2008.

This shows that CDOs rated by Fitch generally had less defaults than those without a

Fitch rating. However, this result is not conclusive, as a number of other factors could be

responsible for the lower level of defaults in Fitch-rated CDOs.


            Figure 11: Event of Default Frequency by Rating Combination

 This Figure plots the percent of CDOs that experienced an event of default as a function of the agencies
                                who rated it. Source: UBS CDO Research.


                                                   25
Overall, the credit ratings of CDOs have been an utter disaster. According to Arturo

Cifuentes: “The rating agencies failed twice…first when they misrated a huge number of

subprime securitizations; and a second time, when they misrated CDOs of ABS. And to

cap it all: they all failed together…making the same mistakes at the same time.”33


2.3 Investment Banks

         Wall Street quickly pounced on CDOs, seeing an opportunity to offload unwanted

risks and make a fortune in the process.34 Table 5 presents a list of the top CDO

underwriters for each year. Merrill Lynch was by far the biggest underwriter of ABS

CDOs, with a total of 107 deals, and Citigroup came in second with 80 deals.


                               Table 4: Top CDO Underwriters
     This table presents the number of ABS CDO deals underwritten by the top 10 underwriters
              between 2002-2007. The data were obtained from S&P’s CDO Interface.

         Underwriter           2002 2003 2004 2005 2006 2007 TOTAL
         Merrill Lynch             0    3   20   22   33   18   107
         Citigroup                 3    7   13   14   27   14    80
         Credit Suisse            10    7    8    9   14    6    64
         Goldman Sachs             3    2    6   17   24    7    62
         Bear Stearns              5    2    5   13   11   15    60
         Wachovia                  5    6    9   16   11    5    52
         Deutsche Bank             6    3    7   10   16    5    50
         UBS                       5    2    5   10   16    6    46
         Lehman Brothers           3    4    3    6    5    6    35
         Bank of America           2    2    4    9   10    2    32
         TOTAL DEALS              47   44 101 153 217 135       697


33
  Testimony of Cifuentes (2008), pg. 2
34
  Merrill was rumored to have made between $400-$500 million in fees from its CDO business in 2006,
according to a former employee.


                                                 26
As the CDO wave continued, Wall Street banks tired of relying on mortgage

banks and other loan originators to provide them with CDO collateral acquired mortgage

subsidiaries and began repackaging their own collateral into CDOs. Table 5 shows the

amount of in-house RMBS and CDO collateral used by each CDO underwriter.35 Panel A

shows that Bear Stearns underwrote CDOs with as much as 30% of the collateral issued

by their in-house RMBS business, and Merrill Lynch itself bought 32% of all of its in-

house RMBS used in CDOs. However, Countrywide remained the biggest RMBS

supplier to almost every CDO underwriter. Panel B shows that Merrill Lynch created

CDO squareds with as much as 15% of the assets from their prior CDO transactions, and

that Merrill bought 59% of its CDO tranches that were resold into CDO squareds. As the

complexity of CDOs increased, the amount of CDO repackaging multiplied. In Panel B,

the column “Level” summarizes the amount of repackaging done by the various banks.

On average, Merrill Lynch’s CDO assets were made of CDOs that had undergone 4.79

iterations of securitization. This illustrates the high level of complexity apparent in these

securities and shows why performing analysis of the collateral was very difficult.


35
   Both tables show the average and maximum percent of each CDO originator’s CDO collateral issued by
itself or a subsidiary. In addition, they show how much of the originator’s CDO bonds they put in their
own CDOs as well as listing the largest buyers and sellers between each originator/originator pair.


                                                  27
Table 5: Banks as CDO Originators and Collateral Originators
                             Panel A: Bank’s RMBS Originators

This table looks at whether CDO originator’s used their own RMBS assets in CDOs. Columns 3-
4 show how much of the bank’s CDO collateral came from their own originator, Column 5 looks
at the share of the originator’s bonds in ABS CDOs that are in their parent bank’s CDOs, Column
  5 gives the name of the largest RMBS originator that contributed bonds to each bank’s CDOs.


Bank        Name of          Avg. %       Max %         % of bonds in   Largest RMBS
            Bank’s RMBS      from         from          parent’s        Supplier to Bank’s
            Originator       originator   originator    CDOs            CDOs
BoA         ABFC             2.9%         7.7%          3.7%            Countrywide
BoA         Countrywide      7.4%         17.9%         3.2%            Countrywide
Barclays    Securitized      2.6%         4.7%          3.6%
            ABR.                                                        Countrywide
Barclays    EquiFirst        0.1%         0.4%          0.8%            Countrywide
Bear        Bear Stearns     7.0%         30.7%         7.9%            Countrywide
Bear        Encore           0.3%         1.4%          4.1%            Countrywide
Citigroup   Citigroup        2.5%         10.0%         13.9%           Countrywide
Credit S.   HEAT             4.1%         10.0%         8.4%            Countrywide
Credit S.   DLJ Mortgage     2.0%         5.2%          7.5%            Countrywide
Deutsche    Deutsche Bank    0.3%         5.2%          20.8%           Countrywide
Goldman     GSAA             2.2%         10.1%         22.2%           Countrywide
Goldman     Goldman Sachs    3.8%         10.5%         10.6%           Countrywide
JP Morgan   JPMorganChase    4.2%         6.5%          0.8%            Goldman Sachs
Lehman      SASCO            5.5%         13.4%         6.5%            Countrywide
Merrill     First Franklin   3.1%         9.5%          25.6%           Countrywide
Merrill     Merrill Lynch    3.3%         9.7%          32.8%           Countrywide
Morgan      Ixis             0.5%         2.6%          3.7%            Countrywide
Morgan      Morgan Stanley   5.7%         15.9%         2.5%            Countrywide
Morgan      Saxon            0.3%         2.0%          1.5%            Countrywide
RBS         HarborView       1.6%         10.0%         18.3%           Morgan Stanley
RBS         SoundView        2.6%         11.4%         8.9%            Morgan Stanley
UBS         MASTR            4.3%         12.3%         19.7%           Bear Stearns
UBS         UBS              0.5%         6.5%          6.7%            Bear Stearns
Wachovia    Wachovia         1.4%         6.7%          22.7%           Countrywide


                                              28
Panel B: Banks using their own CDOs as collateral for CDO-squared deals

 This table looks at the amount of CDO collateral underwriters repackaged into subsequent CDO
  deals (CDO squareds). “Total # of tranches” equals the number of tranches per underwriter that
  were put into subsequent securitizations. The next two columns (Avg. % and Max %) show the
    average and maximum amount of the bank’s CDO collateral that came from their own CDO
   securities. Column 5 (% of originator’s CDO bonds) shows the percent of the total number of
 tranches (from Column 2) that ended up in the underwriter’s own CDO squared deals. Column 6
     gives the name of the largest buyer of each bank’s CDO bonds used in CDO squared deals.
   Column 7 provides the name of the largest provider of CDO bonds to each bank used in their
CDO squared deals. Lastly, Column 7 (“Level”) shows the average number of resecuritizations of
the CDO collateral used by each underwriter, calculated as the weighted average number of CDO
  repackaging iterations in each underwriter’s CDOs (for example, 3 would mean that on average
    their CDOs had collateral that had undergone 3 securitizations: these assets would be CDOs
                    containing CDO collateral which itself had CDO collateral).


                          Avg. %       Max %                                       Largest
               Total #                                 % of
                             of           of                                         CDO
                 of                                originator's    Largest CDO
                         collateral   collateral                                   Supplier
  Bank        Tranches                                CDO            Buyer of                 LEVEL
                           from         from                                          to
               in any                               bonds in       Bank’s CDOs
                            own          own                                        Bank’s
                CDO                                own CDOs
                           CDOs         CDOs                                        CDOs
BoA           7          1.2%         12.8%        6.3%           Citigroup       Bank of     3.00
                                                                                  America
Barclays      2          0.2%         0.9%         22.4%          Merrill Lynch   Barclays    2.79
                                                                                  Capital
Bear          10         0.5%         0.3%         4.6%           Citigroup       Bear        3.94
Stearns                                                                           Stearns
Calyon        10         0.3%         1.9%         10.2%          Merrill Lynch   Calyon      3.73
Citigroup     117        1.7%         11.1%        32.5%          Citigroup       Citigroup   4.17
Credit        15         0.9%         7.4%         7.2%           Merrill Lynch   Credit      2.07
Suisse                                                                            Suisse
Deutsche      6          0.2%         3.8%         1.6%           Merrill Lynch   Deutsche    1.62
Bank                                                                              Bank
Dresdner      1          0.0%         0.2%         2.2%           Citigroup       Dresdner    4.91
Bank                                                                              Bank
Goldman       41         0.9%         5.0%         34.5%          Goldman Sachs   Goldman     2.32
Sachs                                                                             Sachs
JP            2          0.3%         1.0%         5.3%           Merrill Lynch   JP          2.79
Morgan                                                                            Morgan
Lehman        7          0.2%         1.1%         4.4%           Merrill Lynch   Lehman      2.99
                                                                                  Brothers
Merrill       384        3.4%         15.3%        59.3%          Merrill Lynch   Merrill     4.79
Lynch                                                                             Lynch
Morgan        1          0.1%         0.7%         1.0%           Citigroup       Morgan      2.13
Stanley                                                                           Stanley
RBS           15         0.4%         3.3%         4.3%           Merrill Lynch   RBS         5.32
UBS           10         0.4%         6.3%         3.3%           Merrill Lynch   UBS         1.27
Wachovia      18         0.8%         4.1%         17.1%          Goldman Sachs   Wachovia    2.05
WestLB        7          0.0%         0.0%         0.0%           Goldman Sachs   WestLB      2.19


                                                   29
While the investment banks earned what they thought to be “riskless” profits from

CDOs, they were actually loading up on more CDO risk than they realized thanks to so-

called “super senior” tranches, created in part to generate even higher-yielding AAA

tranches for CDO investors. To manufacture a super senior tranche, the AAA portion of a

CDO was chopped up into smaller AAA tiers, enabling the “subordinate” AAA tranche

to yield more and the “super senior” AAA tranche to carry an extremely low level of

credit risk. Many banks found it convenient to simply retain the super senior tranches, as

the Basel Accords imposed only a small capital charge for AAA securities.36 In addition,

a significant amount of super senior exposure was retained not by choice, but rather

because underwriters had difficulty selling these bonds.37 While certainly not all CDO

underwriters held super senior tranches, a JP Morgan report released in 2007 estimated

that banks alone held around $216 billion worth of super senior tranches of ABS CDOs

issued in 2006 and 2007.38 Many of these banks were untroubled by the increasing

amounts of SS exposure on their books, assuming that the risk of default was almost zero;

as one economist described it:

      In order to cause a hit on a super senior tranche, the economy has to turn
      down so heavily that it is very likely that problems will have reached a level
      where an upper senior swap hit is just the tip of the iceberg of a heavy
      global financial crisis.39


36
   In the beginning days of CDOs, it was common for underwriters to keep the most junior or equity piece
of their CDOs as a way to protect against adverse selection and moral hazard. However, the Basel Accords
imposed a 100% capital charge against equity tranches, deterring banks from holding these bonds.
37
   Krahen and Wilde (2005) gave a warning to regulators in 2005 about the increasing number of banks
retaining senior tranches, saying that: “To the extent that senior tranches absorb extreme systematic losses,
banks should be encouraged to sell these tranches to outside investors. In the interest of financial system
stability, these outside buyers of bank risk should not be financial intermediaries themselves. Only if this
requirement is fulfilled will the bank and the financial system be hedged against systematic shocks. Since
this is supposedly one of the macroeconomic objectives of regulators, one would expect that regulatory
requirements stipulate the sale of senior tranches, rather than encouraging their retention.
38
   Quoted in: “Super-senior blundering.” The Economist, December 6, 2007.
39
   Bluhm (2003), pg. 2.


                                                     30
Some banks simply chose to “forget” certain super senior tranches for the purposes

of risk-management – assuming that the risk of default was so insignificant that they

could be treated as if they were perfectly hedged. Other SS tranches were only partially

hedged – usually by way of credit-default swaps.40 However, this method of hedging left

the banks exposed to counter-party risk from other financial institutions. UBS explains

how partially hedged CDOs led to 63% of their CDO write-downs: “we used a hedging

methodology that enabled [the CDO desk] to buy relatively low levels of market loss

protection but consider the position as fully hedged.”41 In the end, these positions, once

considered “riskless,” were responsible for creating the majority of bank’s write-downs.

After reporting a $7.9 billion dollar write-down in the third quarter of 2007, Merrill

Lynch described their rationale behind the $13.6 billion in SS tranches they kept, saying,

      The bottom line is that we got it wrong by being over-exposed to subprime.
      As the market for these (subprime) securities began to deteriorate, we began
      substantially reducing our warehouse risk by constructing CDOs and
      retaining the highest parts of the capital structure, which we expected then to
      be more resistant to market disruptions in terms of both liquidity and
      price…our hedging of the higher-rated tranches was not sufficiently
      aggressive nor was it fast enough.42


        The survival of some of Wall Street’s big investment banks became bound to the

quality of their CDO underwriting. Figures 12 and 13 give a snapshot of different

underwriters’ CDOs. The first shows the amount of subprime and CDO collateral used by

specific underwriters and the second shows the realized default rates of underwriters’


40
   Many banks actually obtained this protection by issuing its own CDS contracts through off-balance sheet
conduits, which sold the bank CDS contracts and pooled the obligations into an SIV, issuing asset-backed
commercial paper (ABCP) against them. These ABCP conduits had to be taken back on-balance sheet
when the market for commercial paper dried up.
41
   UBS had three categories for CDO hedging. In negative basis trades, they bought 100% protection, but
were exposed to counterparty risk. Amplified mortgage portfolio (AMPs) trades were partially hedged, and
the remainder was unhedged in anticipation of buying protection before the market crashed.
42
   Merrill Lynch 3Q Earnings Conference Call. Oct. 27, 2007.


                                                   31
CDOs. While the banks with the highest combined amounts of CDO and subprime assets,

Merrill Lynch, Citigroup, and Lehman Brothers, took write-downs of $51.2, $46.8, and

$15.3 billion as of November 2008,43 the superior performance of Goldman Sachs has

mirrored that of its CDOs. CDO losses have spread far beyond the investment banks on

Wall Street, affecting every pool of investment money from pension funds to Norwegian

villages.44 The ultimate principal losses on these CDO positions will not be known until

the CDO bonds mature or are liquidated,45 but the mark-to-market losses have been

staggering.46 The massive write-downs of AAA CDO positions has caused irreparable

damage to many financial institutions, helping to destroy Merrill Lynch, and leaving

others like AIG and Citigroup on the brink of disaster.47 While much has been written

about why market participants made crucial misjudgments about CDO risk,48 it is still

unclear how their mistakes resulted in the exponential losses that have wrought havoc on

the global economy. In this paper, I show that it was a combination of poor collateral

quality, lax underwriting standards, and inaccurate credit ratings that allowed the

construction of a trillion-dollar CDO “house of cards.”

43
   Source: Asset-Backed Alert, November 18, 2008.
44
   In the CNBC documentary, “House of Cards,” reporter David Faber travels to the small town of Narvik,
Norway, which invested $200 million in American CDOs, lured in by their AAA ratings and the assurance
by Citigroup of their safety. These CDO bonds are now essentially worthless, and the town has had to close
schools, slash expenditure to the elderly, and cut back on fire department hours. The Mayor of Narvik says
that she has “learned not to trust nice man in Armani suit,” although this lesson has come too late to save
her city’s budget.
45
   Some CDOs that experienced an event of default have chosen not to liquidate their assets, hoping that the
housing market will eventually recover. According to Moody’s CDO research, as of June 2008, only 38
CDOs had been liquidated, out of 758 CDOs (including both ABS and cash CDOs) that had experienced an
event of default (EOD).
46
   FASB 157 requires many financial institutions to mark their positions at “fair value,” defined as “the
price that would be received to sell an asset or paid to transfer a liability in an orderly transaction between
market participants at the measurement date.” As the market for CDOs dried up, positions had to be marked
to “fire-sale” prices, leading to the billions in paper losses. There has been an active debate surrounding
mark-to-market accounting, but the SEC decided in December 2008 not to suspend the practice.
47
   AIG suffered mainly from having sold CDS protection on senior CDO tranches, valuing them with their
own faulty models. Citigroup’s troubles have been mainly a result of having to take their SIVs back on
their balance sheet, many of which contained senior CDO tranches.
48
   For an overview of the credit crisis, see Brunnermeier (2008), Gorton (2008), and Calomiris (2008).


                                                      32
Figure 12: Percent of Underwriters’ CDO Assets that are Subprime or CDO

This Figure plots the percent of collateral that is classified as CDO or subprime in all deals underwritten by
                           the bank. Source: S&P CDO Interface, Lehman Live.


                      Figure 13: Performance of Underwriters’ CDO’s

 This Figure plots the percent of CDO collateral that had defaulted as of December 2008 broken down by
                         underwriter. Source: S&P CDO Interface, Lehman Live.


                                                     33
3. Questions and Hypothesis Development

         In the following sections of this paper, I conduct a broad investigation of the

factors that engendered the rise and fall of the CDO market – a process that has destroyed

the credibility and the financial strength of some of the world’s largest financial

institutions. While there has been a wealth of opinions from the media, politicians,

economists, and market practitioners about what went wrong with CDOs, there is a

noticeable absence of empirical analysis surrounding the CDO market. This is most

likely due to the difficulty in obtaining data as well as the complexity of CDO securities.

The purpose of this paper is to use empirical data to provide one of the first windows

inside the world of CDOs, looking at the factors that can explain their poor performance

as well as the roles played by underwriting banks, collateral originators, and credit rating

agencies. This broad analysis, meant to clarify some of the mystique currently

surrounding the arcane CDO market,49 will focus on three guiding questions: 1) How

much of the poor performance of CDO securities is explained by the properties of their

assets and liabilities?; 2) Has CDO performance varied across different underwriters and

collateral originators?; and 3) How well did original CDO credit ratings forecast realized

performance?

         In order to answer these questions, it is necessary to find a variable that quantifies

CDO “performance.” Since there is no direct measure of CDO loss available, I will use

two different dependent variables as proxies for CDO performance.50 The first measure is

the percentage of CDO collateral that has defaulted as of December 2008, calculated as

49
   CDOs are most commonly referred to in the popular press as “toxic assets” or “highly complex
securities,” with little explanation of why they are toxic or what makes them so complex.
50
   If it were possible to calculate an accurate measure of loss for a CDO, the banks would arguably not be
facing many of the current problems in regards to CDOs. One of the major problems facing financial
institutions is the challenge in putting a present value on their CDO holdings.


                                                    34
the par value of defaulted securities over the total par value of the CDO collateral. There

are several weaknesses with using asset defaults as a proxy for CDO performance. First,

CDOs are actively managed instruments that buy and sell collateral; the identity of the

collateral applies to a specific point in time and does not necessarily represent the

collateral at issuance or the collateral that will be present at the time the CDO is

terminated. Second, losses on specific tranches depend not only on the performance of

the CDO collateral, but also on the liability structure of the CDO; tranches from CDOs

with a high level of defaulted collateral may nevertheless be paid in full depending on the

amount of subordination they have to absorb losses. Lastly, the actual monetary losses in

a CDO will depend not only on the number of assets that have defaulted, but also on the

recovery rate of those assets. For instance, it is possible that some defaulted assets may

recover much of their value after their underlying collateral is seized and liquidated.

       The second measure of performance used in this study is the severity of credit

rating downgrades of the CDO tranches. This measure of performance has an obvious

weakness: the accuracy of credit ratings is highly questionable and downgrades may not

translate into actual losses. Despite these weaknesses, using both defaults and

downgrades as a proxy for CDO performance can give a general idea of the expected

losses that will eventually materialize for a CDO transaction. I will now outline the

specific questions and hypotheses that guide the remainder of my analysis.


                                             35
3.1 General CDO characteristics

        A CDO is essentially a corporate entity, constructed to purchase assets and sell

the cash flows to investors. Like any business, the properties of a CDO’s assets and

liabilities will affect its ability to remain solvent and generate a profit for its equity

holders. CDO assets can include any type of fixed-income security, but my analysis

focuses on a specific type of CDO that invests in asset-backed securities, which are

themselves structured products backed by collateral assets such as mortgages, credit-card

payments, or even other CDO bonds. The liabilities of a CDO are the bonds it issues to

fund its asset purchases, and consist of a series of “tranches” with unique risk and return

profiles. The most senior tranches are paid before subordinate tranches, with the equity

tranche exposed to the first losses.

        The types of assets held by a CDO as well as their issuance date (“vintage”) are

likely to explain much of the variation in CDO performance. First, it is widely known

that residential mortgage collateral has performed poorly, caused by a combination of

declining underwriting standards by mortgage originators and the collapse in home

values [Mayer et. al. (2008), Gan (2006), Mian et. al. (2008)].51

        Hypothesis 1A: “The Housing Effect”

Increasing exposure to residential mortgages, specifically subprime and Alt-A RMBS, is

associated with worse CDO performance as measured by defaults.


51
  For example, The Federal Reserve Board found that “the main factors underlying the rise in mortgage
defaults appear to be declines in house prices and deteriorated underwriting standards, in particular an
increase in loan-to-value ratios and in the share of mortgages with little or no documentation.”


                                                    36
Second, collateral from 2006 and 2007 vintages is expected to show worse

performance. In addition to the declines in underwriting standards during 2006 and 2007,

these assets have had little time to amortize, leaving a greater amount of their principal at

risk of defaults associated with the overall deterioration in economic conditions.

Furthermore, liquidity for refinancing has dried up due to the credit crunch, leaving fewer

options for troubled borrowers and exacerbating the effects of interest rate increases.

       Hypothesis 1B: “The Vintage Effect”

Increasing exposure to 2006 and 2007 vintage collateral, particularly assets with floating

interest rates, is associated with worse CDO performance as measured by defaults.


       Lastly, increasing complexity in CDO assets might be associated with poor

performance. Increasing the complexity of CDO assets makes it harder for investors to

perform accurate risk assessments, increasing the likelihood that bad assets go unnoticed

or overall risk is underestimated. Multiple repackaging of structured products increases

this complexity, and Coval, Jurek, and Stafford (2009) show that losses become

exponentially more sensitive to small imprecision in evaluating the probability of default

on the underlying collateral with each new round of securitization.

       Hypothesis 1C: “The Complexity Effect”

Increasing the amount of synthetic collateral, the amount of pre-securitized CDO

collateral, and the overall number of collateral assets is associated with worse CDO

performance as measured by defaults.


                                             37
The liability structure of a CDO can be as unique as its asset pool, with variation

in the number and sizes of the tranches, the rules for distributing proceeds (the

“waterfall”), the credit support of the tranches, and the coupon payments offered to

various note holders. The size and subordination levels of the individual tranches will

affect their performance, as measured by the severity of credit rating downgrades, as

these factors determine the amount of asset losses a certain class of note holder must

absorb. It is also possible that the overall CDO default rate might be associated with

certain liability characteristics, such as the number of tranches issued or the overall size

of the deal.


3.2 Underwriters and Originators

        The underwriter of a CDO, often an investment bank, plays a central role in the

development and marketing of the CDO, earning a fee for its service and often retaining

some of the CDO securities. The underwriter is responsible for structuring the tranches,

setting criteria for the collateral assets, and making sure that the risks are appropriately

communicated to investors. The amount of due diligence conducted by the underwriter is

likely to influence the ultimate performance of the CDO transaction.

        Hypothesis 2A: “The Underwriter Effect”

Holding constant general CDO characteristics, CDO performance varies based on the

underwriting bank.


                                              38
While certain banks might have been “better” CDO underwriters for unknown

reasons, it is possible that the variation in underwriting standards is a function of the size

of the bank’s CDO business. For instance, the most aggressive CDO underwriters may

have spent less time understanding each transaction, decreasing their level of due

diligence. It is also possible that very small CDO underwriters had less experience in

understanding CDOs, causing less accurate risk-assessments.

       Hypothesis 2B: “The Size Effect”

The performance of an underwriter’s CDOs varies according to the size of their CDO

business, with overly-aggressive or very inexperienced banks issuing worse CDOs, as

measured by their ex-post defaults and rating downgrades.


       In addition to the CDO underwriter, an equally important party in determining the

success of a CDO is the originator of its collateral assets. I will limit my examination to

originators of residential mortgage collateral; these originators range from small

residential mortgage banks to the same large investment banks underwriting the CDOs.

The lending standards of the originating entity will affect the ultimate performance of the

CDO assets.

       Hypothesis 2C: “The Originator Effect”

Controlling for the type of mortgages issued, as measured by average FICO, CLTV, and

DTI scores, the performance of a CDO depends on the specific entities that originated its

collateral assets.


                                              39
Lastly, I will look at whether CDO performance was affected by the emergence of

banks that acted as both CDO underwriters and collateral originators. This became the

norm as the market for CDOs exploded, with new issuance limited only by the

underwriter’s ability to access fresh collateral, in particular the high-yielding RMBS

securities so sought after by CDOs. It is not a coincidence, therefore, that the biggest

CDO underwriters either had an in-house mortgage business or acquired a mortgage bank

subsidiary. In addition to repackaging their own mortgage collateral, underwriters also

used retained tranches of their previous CDO transactions as assets for new CDOs. It is

reasonable to assume that a CDO underwriter would have had inside information about

its own assets, leading to a situation of asymmetric information between the underwriting

bank and the investors.

       It is unclear whether this asymmetry would lead to better or worse selection in

CDO collateral. On the one hand, the CDO underwriter might choose the best collateral

for its CDOs in order to uphold its reputation and encourage investors to continue buying

its CDOs. However, the asymmetric information problem could lead to adverse selection

or moral hazard, causing worse performance in CDOs with collateral issued by the

underwriting bank. It seems likely that banks might use CDOs as a vehicle to unload

unwanted assets from their balance sheet – the lack of transparency in the CDO allowing

bad assets to go unnoticed by investors. Furthermore, if the bank is also the servicer of

the asset, it might have less incentive to monitor its performance after it has been sold,

leading to a moral hazard problem. Several papers find evidence of adverse selection and


                                             40
moral hazard associated with the securitization of loans [Gan (2006), Mian et. al. (2008),

Drucker (2008)].52

         Hypothesis 2D: “The Asymmetric Information Effect”

CDO performance will be affected if it contains collateral originated by its underwriter,

although the performance might improve or decline, depending on the importance of

reputation vs. adverse selection and moral hazard.


3.3 Credit Ratings

         Perhaps the most important players in the CDO market were the credit rating

agencies, whose ratings helped investors to gauge the risk of CDO bonds. There are two

main rating methodologies used in rating CDOs: 1) the binomial expansion technique

(BET); or 2) Monte Carlo simulations.53 In both methods, rating agencies simplified their

models to require only five inputs on the underlying CDO collateral: current credit rating,

maturity, asset type, country, and industry. These inputs are then used to determine the

three assumptions that went into the loss model: default probability, recovery rate, and

asset correlation. The CRAs have been widely blamed for mis-rating CDOs [Griffin et.

al. (2008), Mason et. al. (2007), Benmelech et. al. (2008), An et. al. (2006)].54 The SEC


52
   Gan et al. (2006) shows that mortgage servicing is more efficient in deals where servicers have retained
an equity stake. See Mian et al. (2008) and Keys et al. (2008) for empirical evidence that increased
securitization caused a decline in loan quality. Drucker et al. (2008) show that when an underwriter
declines to submit a bid at a secondary market sale, delinquent loans are up to four times more likely to be
reported as missing their next payment and that when they do bid on the securities, the underlying
mortgage pools have higher payoff rates in the subsequent four months.
53
   See BIS Working Paper 163 for a detailed explanation of ratings methodologies.
54
   Griffin and Tang (2008) explore what drove the mismatch between initial CDO credit ratings and
subsequent performance, and find evidence of assumption errors, misleading inputs, and conflicts of
interests playing a role in CDO ratings. Mason and Rosner (2007) investigate CDOs backed by non-agency
MBS and find that even investment grade rated CDOs experience significant losses as a result of home
price depreciation. Benmelech and Dlugosz (2008) examine collateralized loan obligations (a specific type
of CDO backed by whole loans) and find a mismatch between the rating of CDO tranches and the credit
quality of the underlying assets, saying that “while the credit rating of the majority of tranches is AAA, the


                                                     41
investigated claims against the rating agencies and found significant problems, observing

that “there was a substantial increase in the number and complexity of RMBS and CDO

deals since 2002, and some of the rating agencies appear to have struggled with the

growth,” and that “significant aspects of the ratings process were not disclosed, including

the rationale for deviations from their models.” Most troubling, they found extensive

evidence that employees were aware of the shortcomings in their models, but did nothing

about them. For instance, one employee wrote an email about how the rating agencies

were creating an “even bigger monster – the CDO market. Let’s hope we are all wealthy

and retired by the time this house of cards falters. ;)”55

         In this section, I will investigate four major questions surrounding CDO credit

ratings: 1) What factors were important in determining initial CDO credit ratings?; 2)

What factors have driven the wave of CDO downgrades?; 3) How well did original

collateral asset and CDO tranche ratings predict performance?; and 4) What factors

explain the mistakes made in forecasting performance?

         To answer the first question, I will look at the percent of each CDO that was

given a AAA rating by Fitch, S&P, and Moody’s. When rating CDOs, it has been found

that the rating agencies relied almost exclusively on the prior ratings of the underlying

collateral, without making sufficient distinctions for different asset types.56


average credit rating of the collateral is B+”(Benmelech 1). Finally, An et. al. (2006) examine the
subordination levels in commercial mortgage-backed securities (CMBS) and find that expected losses can
explain less then 30% of the variation in subordination levels, indicating the difficulty in determining
appropriate subordination for structured finance tranches apriori.
55
   Summary Report of Issues Identified in the Commission Staff’s Examinations of Select Credit rating
Agencies (2008).
56
   The SEC report found that the credit analysis “does not include an analysis of the underlying asset pools
in the RMBS,” instead relying on the underlying assets’ prior credit ratings.


                                                     42
Hypothesis 3A: “Recycled Ratings Effect”

The most important factor in explaining initial levels of AAA given to a CDO are the

credit ratings of their collateral pool.


         Another factor that might affect the initial percent of AAA assigned to a CDO is

the number of rating agencies rating the deal. Multiple ratings might have encouraged the

agencies to spend more time judging the risks, causing a more conservative rating.

However, it might also be the case that the CRAs were worried about “ratings shopping,”

causing more liberal ratings when they knew another agency was also rating the deal, in

fear that they would loose business if their rating were less desirable than their

competitors.

         Hypothesis 3B: “Peer Pressure Effect”

The % of AAA given to a CDO will depend on the number of rating agencies rating the

deal.


         In looking at the tranche downgrades, it has been noted that the senior tranches

have been disproportionately affected by CDO losses, due to the sensitivity of these

tranches to initial risk miscalculations [Heitfield (2008)].57


57
  Heitfield (2008) shows the sensitivity of different tranches to changes in correlation and probability of
default inputs in a Gaussian Copula model, and finds that CDO notes with greater seniority are more
sensitive to model parameters that describe the distribution of collateral losses. He notes that, “even small
errors in estimating these parameters have significant effects on measures of credit risk for senior CDO
notes. Typically, it is more difficult to estimate such parameters when collateral defaults are rare”(Heitfield
37).


                                                      43
Hypothesis 3C: “Seniority Effect”

Controlling for the default rate of the CDO collateral, senior tranches have experienced

more severe downgrades.


        To answer the third question, I will first look at how well CDO collateral asset

ratings predicted asset default rates. It is likely that lower initial collateral ratings of

certain asset classes (such as subprime) translated into more realized defaults.

        Hypothesis 3D: “The Asset-Class Effect”

The realized defaults associated with a given credit grade varies based on the asset type.


        In addition to looking at the predictive power of the collateral ratings, I will look

at how the AAA losses relate to the initial percent of the CDO rated AAA. As a proxy for

AAA losses, I will use the default rate on the collateral assets minus the current amount

of AAA subordination.

        Hypothesis 3E: “The Super-Senior Effect”

Rating agencies were overly optimistic in giving AAA ratings. CDOs given more initial

AAA ratings, in terms of number of AAA tranches and percent of the transaction rated

AAA, are now exposed to larger losses.


        Lastly, I will look at the factors that explained the difference between the

collateral default rate predicted by its credit ratings and the realized default rate. The

results to all four questions in this section will help to address the possibility that there

might be a conflict of interest arising from the fee system of the rating agencies. Many


                                               44
people have alleged that this system, in which the rating agencies are paid directly by the

banks whose products they are rating, gives them an incentive to assign more “desirable”

ratings to the products of their biggest clients, in order to retain market share and

continue to drive business. 58 For example, the SEC investigation concluded that analysts

appeared to be aware, when rating an originator’s products, of the rating agency’s

business interest in securing the rating of the deal and the importance of increasing

market share.59

         Hypothesis 3F: “Conflicts of Interest”

Conflicts of interest caused by the fee system of credit ratings would result in more

aggressive initial ratings, subsequently more downgrades, and worse accuracy in

prediction for the CDOs of large underwriters. If these conflicts exist, we would expect

the results to questions (1)-(4) to depend on the amount of business done between the

CDO underwriter and the rating agency,


58
   Several people have conducted studies regarding conflicts of interest at the CRA’s. Covitz (2003) finds
that reputation incentives outweigh the desire to please big originators and that conflicts of interest are not a
problem.
59
   Summary Report of Issues Identified in the Commission Staff’s Examinations of Select Credit rating
Agencies (2008).


                                                      45
4. Regression Analysis

       This section uses multivariate regression analysis to answer the questions and

hypotheses outlined in Section 3. Each sub-section corresponds to one of my three

guiding questions: 1) How much of the poor performance of CDO securities is explained

by the properties of their assets and liabilities?; 2) Has CDO performance varied across

different underwriters and collateral originators?; and 3) How well do the CDO credit

ratings capture their performance?


4.1 Data Description

       The data used in this study comes from several sources. The first source is

LehmanLive, a web-based platform that provides access to Lehman’s (now Barclay’s)

research and fixed income, credit, and equities markets analytics. This database contains

detailed surveillance information on virtually the entire population of U.S. CDOs issued

from January 1, 1999 through the present. The data used from this source consists of 735

ABS CDOs, and will be referred to as the “full sample.” The next source of data is the

“OpenSource Model,” compiled by the hedge fund Pershing Capital Management, which

contains detailed information on the 2005-2007 vintage ABS CDOs. While the data from

this source only includes information on 430 of the 735 ABS CDOs in the full sample, it

provides much more detail about each CDO in terms of their collateral composition. I

refer to this dataset as the “high-information sample.” Lastly, the datasets were

supplemented by information from S&P Ratings Direct, CreditFlux, and proprietary CDO

research from UBS.


                                            46
Summary statistics for the variables of interest are presented in Appendix A, as

well as detailed definitions of these variables. Panel A describes variables that are

observed at the CDO level; Panel B describes variables that are observed at the tranche

level; Panel C describes variables that are observed about the assets within the CDOs;

Panel D summarizes the CDOs of the top underwriting banks; and Panel E summarizes

the RMBS collateral of the biggest RMBS originators of the CDO collateral. Appendix B

gives the credit rating grades used by the three CRAs and translates them into numerical

scores that I use throughout my analysis.60


4.2 The Effects of Asset and Liability Characteristics on CDO Performance

Methodology

         To test for the effects of general CDO characteristics on CDO performance, I

perform a number of regressions relating CDO asset and liability properties to CDO

performance. These are shown in Table 6 (Panels A.1, A.2, and B). The OLS regressions

in Panels A.1 and A.2 are run at the CDO level, using Default as the performance

measure (the percent of defaulted collateral per CDO), while those in Panel B are run at

the tranche level, using credit rating downgrades as the performance measure (translated

into numerical notches according to the rating scale in Appendix B).61 As a robustness

check, the OLS specifications are supplemented by Probit regressions using binary

dependent variables: regressions (5) in Panels A.1 and A.2 use a dummy dependent

variable, Default Dummy, that equals one if the CDO’s Default is higher than the median

Default (16% for the full sample and 36% for the high-information sample), and zero

60
  See Appendix C for the probability of default associated with the letter grades.
61
  For CDO-level regressions, the unit of observation is the entire CDO transaction, while for tranche-level
regressions, the unit of observation is a single CDO tranche.


                                                    47
otherwise; regressions (2) and (4) in Panel B use a dummy variable, Downgrade Dummy,

that equals one if the CDO tranche experienced a downgrade of any severity and zero if

the tranche rating was upgraded or unchanged. All regressions are performed separately

on the full sample and on the high-information sample. The high-information sample

regressions contain more independent variables but fewer observations. Year fixed effect

variables are added to control for changes in market conditions over the sample periods

(1999-2007 for the full sample, 2004-2007 for the high-information sample). T-statistics

and significance levels are computed using standard errors clustered by the CDO

underwriter.

        Panel A.1 presents the results of the CDO-level regressions on Default and

Default Dummy using the full sample of 735 CDOs. The independent variables

describing the CDO’s liability properties are Original CDO Balance, Number of

Tranches, Average initial CDO rating (a weighted average of the tranche ratings), and

WAC (a weighted average of the tranche coupons). The independent variables describing

the CDO’s assets include Number of assets, variables giving the percent invested in each

asset class: HEL, CDO, RMBS, CMBS (Other is excluded),62 the percent of synthetic

collateral (Synthetic), and the percent of collateral paying a fixed-rate coupon (Fixed

Rate). The specification of the initial model is:

(1)              Defaulti = α + ß1(Original CDO Balance)i + ß2(Number of assets)i +

                 ß3(Number of Tranches)i + ß4(Average Initial CDO Rating)i + ß5(WAC)i +

                 ß7(IYear_) + εi

62
  The full sample only divides residential mortgage securities into two buckets: HEL (home equity loan)
securities include those backed by non-prime mortgages, while RMBS securities are those backed by prime
mortgages. The high-information has seven RMBS categories, splitting the HEL category into securities
backed by subprime, midprime, Alt-A fixed-rate, Alt-A ARM, HELOC (home equity line of credit), and
CES (closed-end second) mortgages.


                                                  48
Panel A.2 presents similar regressions, instead using the high-information sample of 430

CDOs. This sample includes more independent variables describing the CDO assets:

RMBS and HEL securities are broken into seven asset classes (Prime, Midprime,

Subprime, Alt-A Fixed Rate, Alt-A ARM, HELOC, and CES), and variables are added for

the average initial credit rating of the collateral (Average Initial Collateral Rating) and

the percent of the collateral issued in 2006 and 2007 (2006-vintage collateral, 2007-

vintage collateral).

          Panel B of Table 6 presents the results of the tranche-level regressions relating

asset and liability properties to tranche credit rating changes or Downgrade Dummy. The

asset variables are the same as those in Panels A.1 and A.2, but the liability variables are

replaced for tranche-specific variables: % Subordination (the initial level of the tranche’s

credit support), Tranche Coupon, Original Tranche Balance, and % of Transaction (the

size or “width” of the tranche). In addition, dummy variables are added to control for the

initial rating of the tranche (AAA-Below IG).


Results

          Overall, the regressions in Table 6 show the importance of CDO asset and

liability properties in determining CDO performance – properties which account for

approximately half of the variation in CDO defaults and credit rating downgrades. In

terms of collateral defaults, the highest adjusted R-squared from A.1 is 41%, while in

A.2, the additional detail provided by the high-information sample variables gives a value

of 68%. In Panel B, the adjusted R-squared values from both samples show that the asset

and liability properties explain 57-58% of the variation in tranche credit-rating changes.


                                               49
Looking at the liability variables, we see that Original Balance has a significant

negative coefficient in Panel A.1, indicating that smaller CDOs performed worse after

controlling for other factors. One interpretation might be that these smaller CDOs were

made up of “left-over” assets from other transactions that the bank needed to dispose of

and were not purposefully selected. However, the coefficient becomes less significant

when we add the amount of synthetic and fixed rate collateral; this could still be

consistent with the “left-over” interpretation if small CDOs had more synthetic collateral

and were created by banks needing to hedge certain positions, or wanting to get rid of

previously written CDS contracts. As expected, the amount of tranche subordination is

negatively related to downgrades in Panel B, as is the size of the tranche, with thinner

tranches experiencing more downgrades. The CDO coupon payment is only significant in

the probit specifications of Panels A.1 and B, but they are positive, indicating that the

market correctly demanded a higher yield for CDOs that were “riskier than average.”

Lastly, the CDO’s initial credit rating is inversely proportional to defaults and is

significant in Panel A.2, indicating that CDOs with more favorable credit ratings later

faced more defaults; Panel B shows that the more senior CDO tranches have faced more

severe downgrades.

       Turning to CDO asset characteristics, we find support for hypothesis 1A: there is

a significant and consistently negative “housing effect,” with low quality RMBS assets

associated with worse CDO performance. The coefficient on % HEL is highly significant

in every specification, with an increase of one standard deviation (S.D.) in % HEL (25%)

associated with an increase of 9% (or 1/3 of a S.D.) in Default and a two-notch increase

in downgrades. The high-information sample splits HEL securities into more detailed


                                             50
categories, revealing that it is specifically the Alt-A ARM mortgages that have the most

pronounced effect on CDO performance. Panel A.2 of Table 6 provides support for the

“vintage effect” of hypothesis 1B, showing that CDOs with more collateral from 2006

and 2007 have had increased defaults and the effect is significant in all specifications.

The economic significance of the 2006-vintage collateral is worse than for 2007: when all

the control variables are included, a one S.D. increase in % 2006-vintage collateral

(29%) is associated with a 10% increase in Default, while increasing % 2007-vintage

collateral by one S.D. (13.5%) is associated with a 5% increase in Default. Also as

predicted, we find that floating-rate collateral is associated with worse performance,

although the coefficient is only significant in the probit specifications.

       Lastly, there is a negative “complexity effect,” as predicted by hypothesis 1C: the

coefficients on Number of Assets, % Synthetic, and % CDO are all positive. A higher

number of CDO assets is associated with higher Default and more rating downgrades,

supporting the interpretation that a larger number of assets made it easier for bad assets to

go unnoticed by decreasing the CDO’s transparency. The coefficient is statistically

significant, except when % Synthetic is added in Panels A.1 and A.2. However, since

% Synthetic is also related to the level of complexity in the CDO, perhaps this variable

now picks up the negative “complexity effect.” Both % Synthetic and % CDO are

associated with worse performance in most specifications, although the coefficient on

%CDO is not consistently significant. Taken together, the results in Table 6 indicate that

adverse CDO performance was due primarily to the inclusion of poor quality 2006 and

2007-vintage RMBS assets backed by subprime and Alt-A ARM mortgages, assets

whose risks were easily overlooked amidst the high level of complexity in the CDOs.


                                              51
Table 6: Determinants of CDO Performance -
                                General CDO Characteristics
                             Panel A: Results based on Collateral Defaults

    These tables present the results of the regressions for section 5.1. The dependent variable
     “Default” refers to the percent of the CDOs collateral in default as of January 2009. All
  regressions are OLS except for (5), which uses a Probit regression on a dummy variable that
 equals 1 if the variable “Default” is greater than the median “Default” (16% for the full sample
  and 36% for the high-information sample), and zero otherwise. The unit of observation is the
  entire CDO, thus no tranche-specific variables are included. Standard errors are clustered by
   CDO Underwriter. Coefficients are significant at the +10%, *5%, **1% significance level.

1. Full-Sample Results, n = 735
                                               (1)             (2)         (3)         (4)           (5)
         Dependent variable:                 Default         Default     Default     Default      Default
                                                                                                  Dummy
REGRESSOR:                                  OLS                 OLS         OLS         OLS        Probit
Original CDO Balance                    -.000073**          -0.0001**   -0.0001**   -0.00003*   -0.00007
                                        (.000017)           (0.00002)   (0.00001)   (0.00001)   (0.00004)
Number of assets                        .0007799**          0.00059**   0.00042*    0.00017     0.00032
                                        (.000146)           (0.00016)   (0.00016)   (0.00019)   (0.00047)
Number of Tranches                      -.00736             0.00006     0.00263     0.0071+     0.01159
                                        (.00482)            (0.00563)   (0.00444)   (0.00389)   (0.01155)
Average initial CDO rating              -0.00411            -0.009      -0.01119    -0.01044    -0.01005
                                        (0.01061)           (0.00952)   (0.0092)    (0.00995)   (0.02744)
WAC                                     -0.00371            -0.00234    0.00243     0.0010      0.04598*
                                        (0.0114)            (0.01106)   (0.01027)   (0.00787)   (0.02154)
% HEL                                   __                  0.29273**   0.23393**   0.35219**   0.84396**
                                                            (0.06171)   (0.06739)   (0.05559)   (0.16486)
% CDO                                   __                  0.06614     -0.02133    0.08007     0.20596
                                                            (0.07051)   (0.0751)    (0.05959)   (0.16726)
% RMBS                                  __                  __          -0.1149*    0.03151     0.38458+
                                                                        (0.04948)   (0.05568)   (0.21857)
% CMBS                                  __                  __          -0.3208**   -0.16394*   -0.50782
                                                                        (0.07443)   (0.07207)   (0.31586)
% Synthetic                             __                  __          __          0.32089**   0.70235**
                                                                                    (0.1022)    (0.21271)
% Fixed Rate                            __                  __          __          -0.04315    -0.17871+
                                                                                    (0.03438)   (0.10663)
IYear2001                               0.08262*            0.04505     0.04106     0.05033     0.59573**
                                        (0.03833)           (0.03472)   (0.03682)   (0.03415)   (0.03617)
IYear2002                               0.02913             -0.03147    -0.03445    -0.04553+   0.63248**
                                        (0.02875)           (0.03062)   (0.03128)   (0.02483)   (0.03531)
IYear2003                               0.04042             -0.05269    -0.03969    -0.07246    0.61793**
                                        (0.04430)           (0.05422)   (0.05554)   (0.05078)   (0.03684)
IYear2004                               -0.0006             -0.10759*   -0.06889+   -0.1192**   0.71464**
                                        (0.03522)           (0.03959)   (0.03584)   (0.02686)   (0.03117)
IYear2005                               0.11137*            -0.00424    0.03141     -0.04046    0.82197**
                                        (0.04753)           (0.04773)   (0.04433)   (0.03438)   (0.02464)
IYear2006                               0.24766**           0.13581**   0.16536**   0.057       0.92947**
                                        (0.05092)           (0.047)     (0.04658)   (0.04527)   (0.01756)
IYear2007                               0.42614**           0.30813**   0.33452**   0.21686**   0.84737**
                                        (0.05750)           (0.05396)   (0.04492)   (0.0436)    (0.02424)
Intercept                               0.06203             0.02461     0.05353     -0.02267    -0.02267
Regression summary statistics
Adj. R2                                 0.3058              0.3600      0.3878      0.4125      __
SER                                     0.2280              0.2189      0.2141      0.2098      __


                                                       52
2. High-Information Sample Results, n = 430
                                           (1)            (2)            (3)        (4)          (5)
       Dependent variable:               Default        Default        Default    Default      Default
                                                                                               Dummy
REGRESSOR:                               OLS           OLS            OLS            OLS        Probit
Original CDO Balance                0.00001        0.00002        -0.00002       0.0000     -0.0001
                                    (0.00003)      (0.0001)       (0.0001)       (0.0001)   (0.00007)
Number of assets                    0.00072*       0.00041        0.00068*       0.00031    0.00209**
                                    (0.0003)       (0.0003)       (0.0003)       (0.0002)   (0.00076)
Number of Tranches                  -0.00052       -0.00129       -0.00701       -0.004     -0.01008
                                    (0.00804)      (0.0046)       (0.0094)       (0.0045)   (0.02023)
Average Initial CDO Rating          -0.046**       -0.030**       -0.040**       -0.0258*   -0.14894**
                                    (0.01275)      (0.0105)       (0.0116)       (0.0098)   (0.05571)
                                    0.0507**       0.04174*       0.0644**       0.0478**   0.21422**
Average Initial Collateral Rating   (0.01823)      (0.0171)       (0.0156)       (0.0149)   (0.04342)
                                    -0.0036        0.00882        -0.00719       0.00743    0.03583
WAC                                 (0.01279)      (0.0118)       (0.0143)       (0.0111)   (0.03751)
                                    0.3645**       -0.11709       __             -0.24477   -0.22927
% Subprime                          (0.12454)      (0.2985)                      (0.2265)   (1.576)
                                    0.02609        0.10733        __             -0.10481   1.71031
% Alt-A Fixed Rate                  (0.21156)      (0.2808)                      (0.2295)   (1.72197)
                                    0.702*         0.79671*       __             0.44669    3.72806*
% Alt-A ARM                         (0.27614)      (0.3528)                      (0.3004)   (1.7405)
                                    0.3711**       0.44547        __             0.2154     1.57222
% CDO                               (0.08841)      (0.3154)                      (0.2484)   (1.63275)
                                    __             -0.28299       __             -0.37225   -0.00754
% Prime RMBS                                       (0.2934)                      (0.2268)   (1.70039)
                                    __             0.35639        __             0.23627    1.6933
% Midprime RMBS                                    (0.2824)                      (0.2174)   (1.51327)
                                    __             0.5629         __             0.25367    1.28413
% CES RMBS                                         (0.3480)                      (0.2898)   (1.51272)
                                    __             -0.05239       __             0.90136    -7.31818
% HELOC                                            (2.0859)                      (1.7005)   (5.53717)
                                    __             -0.902**       __             -0.996**   -2.31828
% CLO                                              (0.3068)                      (0.2453)   (1.72703)
                                    __             -0.50936       __             -0.5851+   -0.16002
% CMBS                                             (0.3816)                      (0.3094)   (1.91292)
                                    __             -0.00529       __             -0.02481   -0.4151**
% Fixed Rate                                       (0.0337)                      (0.0383)   (0.15021)
                                    __             0.05301        __             0.08675    0.35217
% Synthetic                                        (0.0999)                      (0.0825)   (0.23053)
                                    __             __             0.4129**       0.3530**   0.79254**
% 2006-vintage collateral                                         (0.0449)       (0.0352)   (0.18029)
                                    __             __             0.3065**       0.3932**   1.34165**
% 2007-vintage collateral                                         (0.0917)       (0.0868)   (0.39527)
                                    0.0268         -0.0795*       0.01866        -0.0620*   0.77072
IYear2005                           (0.033)        (0.0321)       (0.0265)       (0.0289)   (0.68969)
                                    0.2441**       0.02278        0.05938+       -0.0913*   0.76903
IYear2006                           (0.03711)      (0.0376)       (0.0315)       (0.0359)   (0.83893)
                                    0.3948**       0.1846**       0.13432*       -0.04017   0.75362
IYear2007                           (0.04569)      (0.0412)       (0.0567)       (0.0515)   (0.67228)
Intercept                           -0.3400*       -0.04102       -0.2351+       0.04292    __
Regression Summary Statistics
Adj. R2                             0.4478         0.6256         0.4859         0.6823     __
SER                                 0.2171         0.1752         0.2053         0.1614     __


                                                   53
Panel B: Results based on Credit Ratings

The dependent variables in these regressions are 1) the overall change in the tranche credit using
    notches outlined in Table 2, and 2) a dummy variable that equals 1 if the tranche has been
  downgraded, and equals zero if the rating was unchanged or upgraded. Dummy variables are
    included for the initial rating of the tranche. The observations here are the individual CDO
 tranches, making the sample size much larger than in Panel A. Standard errors are clustered by
    CDO Underwriter. Coefficients are significant at the +10%, *5%, **1% significance level.


                                                     Full Sample              High-Information Sample
          Dependent Variable                  Change in       Downgrade       Change in      Downgrade
                                            credit rating       Dummy       credit rating      Dummy
                                             (# Notches)                     (# Notches)
REGRESSOR:                                OLS               Probit        OLS              Probit
                                          -5.516**          -0.142        -6.031**         -0.036
% Subordination                           (1.24)            (0.10)        (1.20)           (0.02)
                                          -0.091            0.017*        -0.102           0.008**
Tranche Coupon                            (0.07)            (0.01)        (0.06)           (0.00)
                                          1E-04             -6E-05        -0.001           -3E-06
Original Tranche Balance                  (0.00)            (0.00)        (0.00)           (0.00)
                                          -3.847**          -0.048        -2.653*          -0.009
% of Transaction                          (1.06)            (0.06)        (1.27)           (0.02)
                                          0.013**           0.001**       0.010*           0.000**
Number of assets                          (0.00)            (0.00)        (0.00)           (0.00)
                                          -0.065            0.006         -0.069           -0.002
Number of Tranches                        (0.06)            (0.01)        (0.09)           (0.00)
                                          8.245**           0.618**
% HEL                                     (1.96)            (0.15)        -               -
                                          3.102+            0.224*
% RMBS                                    (1.65)            (0.11)        -               -
                                          -4.801**          -0.041        -5.795          0.035
% CMBS                                    (1.29)            (0.08)        (10.36)         (0.09)
                                          4.100*            0.267**       10.420          0.166+
% CDO                                     (1.68)            (0.09)        (10.67)         (0.10)
                                          1.370*            0.091         0.470           -0.008
% Fixed Rate                              (0.67)            (0.05)        (0.86)          (0.02)
                                          2.948             0.226*        -0.375          0.029*
% Synthetic                               (2.07)            (0.09)        (0.74)          (0.01)
                                                                          3.214           0.105
% Subprime                                -                -              (10.33)         (0.09)
                                                                          1.106           0.114
% Alt-A Fixed Rate                        -                -              (10.85)         (0.11)
                                                                          26.939*         0.573**
% Alt-A ARM                               -                -              (10.10)         (0.18)
                                                                          -2.881          0.054
% Prime RMBS                              -                -              (10.94)         (0.09)
                                                                          11.411          0.187*
% Midprime RMBS                           -                -              (10.20)         (0.09)
                                                                          17.252          0.229
% CES RMBS                                -                -              (10.71)         (0.16)
                                                                          28.985          1.060
% HELOC                                   -                -              (18.68)         (0.80)
                                                                          -10.741         0.002
% CLO                                     -                -              (10.58)         (0.10)
                                                                          -0.220          -0.007
Average initial collateral rating         -                -              (0.32)          (0.01)
                                          0.254**          0.012**        0.106           0.008**
Average current collateral rating         (0.07)           (0.00)         (0.10)          (0.00)


                                                    54
Full Sample             High-Information Sample
            Dependent Variable       Change in       Downgrade      Change in      Downgrade
                                   credit rating       Dummy      credit rating     Dummy
                                    (# Notches)                    (# Notches)
REGRESSOR:                       OLS               Probit        OLS             Probit
                                 -2.379            -0.476**
IYear2001                        (2.04)            (0.14)        -              -
                                 -5.003**          -0.717**
IYear2002                        (1.52)            (0.10)        -              -
                                 -6.329**          -0.841**
IYear2003                        (1.51)            (0.05)        -              -
                                 -6.556**          -0.831**
IYear2004                        (1.63)            (0.07)        -              -
                                 -3.661*           -0.600**      -0.301         0.008
IYear2005                        (1.71)            (0.16)        (0.60)         (0.01)
                                 -1.376            -0.468**      1.052+         0.019+
IYear2006                        (1.69)            (0.15)        (0.55)         (0.01)
                                 -1.147            -0.550**      1.426*         0.024*
IYear2007                        (1.67)            (0.17)        (0.56)         (0.01)
Initial Tranche Rating Dummies
                                 1.831+           -0.084         4.656**        0.000
AAA                              (0.96)           (0.06)         (0.64)         (0.01)
                                 1.064                           3.969**        0.006
AA+                              (0.86)                          (0.78)         (0.01)
                                 1.887*           -0.016         4.188**        0.015
AA                               (0.88)           (0.06)         (0.47)         (0.01)
                                 1.673+           0.051          3.076**        0.011
AA-                              (0.85)           (0.04)         (0.35)         (0.01)
                                                  -0.038         3.485**
A+                               omit             (0.08)         (0.91)
                                 -0.289           -0.055         1.608**        0.008
A                                (0.82)           (0.07)         (0.45)         (0.01)
                                 -0.826           -0.109         1.417**        0.011
A-                               (0.94)           (0.09)         (0.42)         (0.01)
                                 -1.135           -0.001                        0.018**
BBB+                             (0.82)           (0.06)         omit           (0.01)
                                 -1.477+          -0.046         -0.535         0.005
BBB                              (0.83)           (0.06)         (0.46)         (0.01)
                                 -2.778**         -0.222**       -2.503**       -0.074*
BBB-                             (0.70)           (0.09)         (0.49)         (0.05)
                                 -3.923**         -0.357**       -3.192**       -0.145**
Below IG                         (0.75)           (0.10)         (0.41)         (0.06)
                                 6.127**                         4.895
Intercept                        (2.05)           -              (10.25)        -
Regression Summary Statistics
Adj. R2                          0.585            -              0.572          -
SER                              4.68             -              3.83           -
n                                4511             4511           2711           2711


                                            55
4.3 The Effects of CDO Underwriters and Collateral Originators

        Next, I investigate the link between CDO performance and specific CDO

underwriters and collateral originators. The first series of regressions looks at whether

variation in CDO performance across underwriters is merely a result of the asset and

liability properties of those CDOs, or whether the identity of the underwriter is a

significant predictor of CDO performance after controlling for CDO properties

(hypothesis 2A).63 To do this, I rerun certain regressions from Section 4.2, adding fixed

effect dummies for the largest 17 CDO underwriters. Panels A.1 and A.2 of Table 7 rank

the underwriters from 1-17 according to the performance of their CDOs (after controlling

for the CDO characteristics), with 1 being the “best” underwriter and 17 being the

“worst.” The regression specifications for (1) –(4) in Panel A.1 are identical to

regressions (4)-(5) in Panels A.1 and A.2 of Table 6, and regressions (1)-(4) in Panel A.2

are identical to (1)-(4) in Panel B of Table 6, with the addition of the underwriter fixed

effect dummies. The estimated regression coefficients are shown in parentheses

underneath the ranking of the underwriter. The t-statistics used to calculate significance

levels are based on standard errors clustered by the CDO underwriter.

        The results in Panel A support hypothesis 2A, showing evidence of an

“underwriter effect” on CDO performance. The adjusted R-squared values of all

regressions are higher with the added underwriter dummies than those from Table 6 – in

A.1 (1), the value increases by 0.03 to 0.44, in (3) by 0.02 to 0.70, in A.2 (1) and (3) the

value increases to by 0.01, to 0.59 and 0.58 respectively. The specific underwriter

coefficients are most consistently significant for the best or the worst underwriters, and it

63
  In other words, we want to ask whether Bank A’s CDOs were bad because, for example, they used bad
assets (subprime) or whether their CDOs were worse than Bank B’s CDOs, who had the same amount of
subprime. This would indicate a lesser ability or lower amount of due diligence on the part of Bank A.


                                                  56
is interesting that the rankings based on Default are not always the same as those based

on credit rating changes. Based on the rankings in A.1, we can say that the CDOs of

Goldman Sachs consistently outperformed, and are associated with a decrease of 6% in

Default after controlling for CDO asset and liability characteristics. Among the consistent

underperformers are Morgan Stanley, Merrill Lynch, Deutsche Bank, and JP Morgan –

JP Morgan’s CDOs are associated with a staggering 18% increase in Default on average,

after controlling for CDO asset and liability characteristics.

       Panel B examines whether the size of the bank’s CDO underwriting practice is

related to the performance of their CDOs (hypothesis 2B). In Panels B.1 and B.2 of Table

7, the underwriter fixed effect dummies are replaced with two variables describing the

size of the CDO underwriter: Underwriter Market Share is equal to the number of CDOs

underwritten by the bank divided by the total number of CDOs, and Par Value of

Underwriter’s CDO Issuance is equal to the natural log of the total dollar balance (in

millions) of all CDOs underwritten by the bank. The results of Panel B show evidence

supporting the “size effect” of hypothesis 2B. The coefficients on Underwriter Market

Share indicate that the more aggressive the underwriter, in terms of the number of CDOs

issued, the worse their CDO’s performance. However, the coefficient on Balance of Total

Issuance is consistently negative, indicating that for a given level of aggressiveness, more

CDO issuance is better. The interpretation of this result is ambiguous, but it could support

the experience portion of hypothesis 2B, namely that CDO quality improves with the

experience of the underwriter. Taken together, the results of Table 7 provide strong

evidence in favor of an “underwriter effect,” and suggest that at least part of the variation


                                             57
in CDO underwriting quality was due to the size of the bank’s CDO business, with larger

banks underwriting lower quality CDOs.

       The next series of regressions ranks specific RMBS originators based on the

performance of CDOs containing their collateral (hypothesis 2C). Originator variables

are created for the largest 56 RMBS originators in the high-information sample CDO

asset pools, equal to the percent of the CDO’s assets they issued. Table 8 shows the

rankings of the RMBS originators, based on the same regression specifications as Table

7, replacing the underwriter dummy variables with the RMBS originator variables. In

addition, control variables are added for the average FICO, DTI, and CLTV of the RMBS

collateral, whose coefficients are shown at the bottom of Panel A. The results of these

rankings indicate the effect of a specific originator’s collateral on CDO performance,

holding constant the observable characteristics of their mortgages.

       Like the rankings of the CDO underwriters, it is noteworthy that the rankings of

the originators are different according to the regressions based on Default and those

based on credit ratings. For the analysis here, I will again focus on the Default rankings,

saving the analysis of credit rating accuracy for section 4.4. There are only a few

originators that show statistically significant effects on CDO performance, indicating that

most of the originator effects are a result of observable characteristics of the mortgages

they issued, rather than a difference in originator ability or due diligence. In particular,

the coefficient on the average CLTV of the originator’s mortgages is significant and

positive, confirming that CDOs containing RMBS collateral with high combined loan-to-

value ratios have been adversely affected. Even after controlling for FICO, DTI, and

CLTV, there are several originators that are associated with significant


                                              58
underperformance in terms of CDO defaults. CDOs with more collateral issued by

HSBC, Cairn, Deutsche Bank, and RALI (owned by GMAC), all experienced higher

levels of defaults, controlling for other CDO asset and liability characteristics. Overall,

Table 8 provides only weak support for a specific “originator effect” proposed in

hypothesis 2C.

       In Table 9, I explore the relationship between banks that acted as both CDO

underwriters and as suppliers of CDO collateral, specifically looking at the effect of

banks “rolling over” their CDO tranches into new CDOs (hypothesis 2D). I introduce

interaction terms into the regression analysis, equal to the percent of CDO collateral that

is invested in CDO bonds underwritten by the same bank underwriting the current CDO.

The regression specifications are identical to those run on the high-information sample in

Table 7, with the addition of the interaction terms. Table 9 gives the coefficients on both

the underwriter fixed effect dummy (F.E.) as well as the interaction term measuring the

effects of re-used collateral from the underwriter (Int.). The fixed effect coefficient

reflects the overall effect of a certain underwriter on CDO performance (due to their

ability, due diligence, and other unobservable factors), while the interaction terms show

whether the underwriter’s CDOs are improved or weakened by using their own CDO

bonds as collateral.

       Like the results in Tables 7-8, the results that use Default as the dependent

variable do not match those that use credit rating changes. Basing the analysis on the

Default results, we see that the effect of an underwriter using its own collateral (for which

it is assumed to possess an informational advantage) is contingent on the specific

underwriter, with some interaction coefficients positive and others negative. For


                                             59
underwriters with negative interaction coefficients, the over-riding incentive seems to be

maintaining their reputation, with the asymmetric information situation leading to higher

quality CDOs (thus a lower value for Default). This is the case for Barclays, Bear

Stearns, Calyon, Credit Suisse, Lehman Brothers, and RBS. Note that this does not mean

that these bank’s CDOs showed better performance overall, only that the additional

effects of using their own collateral enhanced CDO performance. For example, Bear

Stearns had an overall adverse effect on its CDOs, which were associated with a 9%

increase in Default; however, among the Bear Stearns CDOs, those that used in-house

CDO collateral performed relatively better than its other CDOs. Unlike the banks with a

“positive asymmetric information effect,” the interaction terms of other banks support the

theories of adverse selection and moral hazard: the CDOs of Bank of America, Citigroup,

Goldman Sachs, JP Morgan, and Morgan Stanley were adversely affected by the

inclusion of in-house CDO collateral.

       Incorporating all of the results from Tables 7-9, we can say that while the actions

of the CDO underwriters had a big effect on the performance of their CDOs, the specific

identity of the collateral originator was not as important as the characteristics of the

mortgages they issued. The fact that the “underwriter effect” is more important in

determining CDO performance than the “originator effect” could be due to the relatively

high level of time and expertise needed to structure CDOs as compared to issuing

mortgages.

       While Table 7 distinguishes among the best and worst CDO underwriters, it does

not explain why some of these banks were destroyed by CDO write-downs while others

remained untainted by ABS CDOs. It is impossible to directly explain the ABS CDO


                                              60
write-downs of specific banks, as they have not disclosed the exact nature of their

exposures. It is possible that bank CDO write-downs are completely unrelated to their

own CDO underwriting if they did not retain their own securities and/or bought CDOs

from other underwriters. However, the anecdotal evidence in Section 2 suggests that for

the banks hit worst by CDO write-downs, the bulk of the blame fell on retained CDO

securities from their underwriting business. To further clarify the link between CDO

underwriting quality and ultimate write-downs, I perform regressions looking at the ABS

CDO write-downs (as of February 2009) of the 17 largest CDO underwriters. The

dependent variable used is the dollar value of the bank’s write-downs divided by the

bank’s total assets at year-end 2007. Independent variables (shown in all capital letters)

are calculated by taking the dollar-weighted average of the CDO independent variables

using all of the underwriter’s CDOs. The specification used for the initial model is:

(2)            (Write-down/Total Assets)i = α + ß1DEFAULTi + ß2DOWNGRADEi +

               ß3AAASUBi + ß5YR2005i + ß6YR2006i + ß7YR2007i + εi

The variables YR200_ represent the total CDO issuance of each underwriter in the given

year.

        The results of these write-down regressions are presented in Table 10. These

regressions show that bank write-downs are surprisingly unrelated to the quality of their

own CDOs, as measured by the average DEFAULT and DOWNGRADE of their CDOs.

In fact, the most significant predictor of CDO write-downs is the dollar amount of CDOs

a bank underwrote in the year 2007. To gauge the economic significance of the

coefficient on YR2007, we can look at the average effect of underwriting ten more CDOs

in 2007 (with a balance of $1 billion): an increase in YR2007 by $ 1 billion is associated


                                             61
with an increase in ABS CDO write-downs of .05% of total assets, and with the average

value of the banks’ assets equal to 1.5 trillion, this .05% translates into a $735 million

increase in write-downs. Continuing this line of analysis, we can say that on average,

2007 CDOs caused their underwriters write-downs of 74% of their par value. This

number is consistent with the statements presented in Section 2 that showed banks

suffered the most write-downs from retained AAA portions of their own CDO

securitizations. When the market for CDOs broke down in 2007, the most aggressive

underwriters were stuck holding almost 100% of these AAA securities, which have been

marked down to an average of 10 cents on the dollar according to CreditFlux. The key

takeaway in this preliminary analysis is that bank CDO write-downs are not necessarily

an accurate reflection of the underwriting quality of their CDO business. Instead, write-

downs were primarily a result of the complete destruction of demand for CDO securities,

which, combined with mark-to-market accounting, forced banks to realize losses of

almost 100% of the par amount of retained AAA CDO securities.64


64
   The implications of these results are not straightforward. On the one hand, it might seem that certain
banks were unfairly punished by mark-to-market accounting, causing them to mark their CDO securities to
reflect the worst CDOs (essentially throwing out the baby with the bath-water so to speak), and that this
exacerbated the financial crisis by overstating the capital needs of banks. However, the purpose of mark-to-
market accounting is to accurately reflect the current financial strength of the institution: if they had to
liquidate today, these securities would be worth virtually nothing. Furthermore, these banks violated the
first rule of responsible underwriting: never complete a transaction before you have investors to buy the
securities.


                                                    62
Table 7: Effects of Underwriter on CDO Performance
                                                           Panel A: Regression Rankings
          These tables are the results of section 5.3. Each underwriter is ranked according to the performance of their CDOs, using either
       defaults or ratings as the measure of performance. The regressions used are identical to (4)-(5) in Panels A.1 and A.2 of Table 6, and
                 Panel B of Table 6, adding in underwriter fixed effect dummies. Regression coefficients are given under ranking.

     Ranking based on CDO defaults                                                                    Ranking based on CDO downgrades
                                                                                                       Originator        Average   OLS Full        Probit         OLS           Probit
     Originator        Average   OLS Full            Probit            OLS             Probit
                                                                                                                          Rank                      Full          H.I.           H.I.
                        Rank                          Full             H.I.             H.I.
     Goldman              1            2                 3                2              2             Calyon              1           6               4             2             2
                                 (-0.06**)         (-0.180*)        (-0.060*)        (-0.210+)                                       (0.38)        (0.001) (-1 . 1 6 ) (-. 1 9 * * )
     Lehman              2             5                 7                1              1             Wachovia            2           1               1             15            6
                                   (0.008)           (0.050)        (-0.09**)        (-0.32**)                                      (-0 . 3 9 )    (-0 . 0 3 )    ( 0 . 4 6 ) (-. 0 7 + )
     Dresdner            3             1                 1                3              10            Deutsche            3           2               3             9            11
                                  (-0 . 0 8 * )   (-0.300**)         (-0 . 0 0 8 )    (0.290)                                       (-0 . 3 8 )   (-0 . 0 0 4 ) ( 0 . 0 6 )    (-0 . 0 3 )
     Barclays            4             3                 5                8             omit           Dresdner            4           16              8             1             1
                                  (-0 . 0 3 0 )     (-0 . 0 4 5 )     (0.018)                                                       (2.28+)         (0.04)       (-1 . 4 + ) (-. 3 * * )
     Bank of America     5             6               10                 7                3           Barclays            5           11              2             12            3
                                   (0.024)           (0.080)          (0.016)         (-0 . 0 2 2 )                                   (1.1)        (-0 . 0 2 )    ( 0 . 2 4 ) (-. 1 8 * * )


63
     Wachovia            6             4                 2                6              14            Bear Stearns        6           5               5             8            10
                                 (-0.030+)        (-0.250**)          (0.012)        (0.415**)                                        (0.2)         ( 0 . 0 2 ) (0.0033) (-0 . 0 4 )
     Credit S.           7             7                 8                5                7           UBS                 7           7               10            5             7
                                   (0.030)           (0.050)          (0.005)          (0.160)                                       (0.44)         (0.06)        (-0 . 6 )    (-0 . 0 7 )
     UBS                 8             8                 9                4                6           Bank of America     8           12              11            3             4
                                  (0.050*)           (0.060)         (-0 . 0 0 4 )     (0.090)                                      (1.19+)        (.056+) (-1 . 1 3 ) (-. 1 1 3 * )
     Citigroup           9             9                 6                9                5           Citigroup           9           8               7             7             9
                                 (0.060**)           (0.030)          (0.030)          (0.030)                                        (0.7)         (0.04)       (-0 . 0 3 ) (-0 . 0 5 )
     RBS                 10          12                  4              11               12            Lehman              10          4               9             13         omit
                                  (0.07**)          (-0 . 0 5 6 )    (0.050*)        (0.406**)                                       (0.17)        (0.056) (0.255)
     WestLB              11          10                11               16                 4           Goldman             11          3               12            10           13
                                  (0.060*)           (0.093)        (0.160**)         (-0 . 0 1 0 )                                 (-0 . 0 7 )     (.07*)        (0.19)       (-0 . 0 2 )
     Bear Stearns        12          11                13               13                 9           JP Morgan           12          15              15            6             8
                                  (0.07**)           (0.110)         (0.073*)         (0.200+)                                     (2.16**)        (.11**) (-0 . 3 1 ) (-0 . 0 7 )
     Calyon              13          16                12               10                 8           Credit S.           13          14              13            14            5
                                 (0.130**)           (0.100)          (0.045)          (0.170)                                      (1.33+)        (.08**)        ( 0 . 2 7 ) (-. 0 9 + )
     Morgan              14          14                14               15               11            RBS                 14          9               6             16           16
                                  (0.09**)           (0.130)        (0.132**)        (0.380**)                                       (0.78)         (0.02)        ( 0 . 4 8 ) (-0 . 0 0 1 )
     Merrill             15          15                16               12               13            WestLB              15          17              14            4            12
                                 (0.100**)         (0.230**)         (0.050*)        (0.409**)                                      (2.4**)         (.1**)       (-0 . 6 9 ) (-0 . 0 4 )
     Deutsche            16          13                15               14               15            Merrill             16          13              17            11           15
                                 (0.080**)          (0.160*)         (0.075*)        (0.460**)                                       (1.2+)       (.144**) ( 0 . 2 3 )         (-0 . 0 1 )
     JP Morgan           17          17                17               17               16            Morgan              17          10              16            17           14
                                 (0.170**)         (0.300**)        (0.190**)        (0.460**)                                       (1.03)       (.117**)         (1.1)       (-0 . 0 2 )
Panel B: Effects of Underwriter Size and Market Share

  These regressions examine the effects of the market share of each Underwriter and the overall
issuance on CDO performance. Underwriter market share is defined as the number of CDOs per
Underwriter divided by the total number of CDOs. The par value of the Underwriter’s issuance is
the sum of all their CDO par values. In the regression, I use the natural log of total issuance. The
   tables below display only these two coefficients of interest from the set of regressions. The
    specifications in the first table are identical to those in Panel A, replacing the underwriter
 dummies with the variables presented below. Clustered standard errors are given in parentheses
 under estimated coefficients. Coefficients are significant at the +10%, *5%, **1% significance
                                                  level.

1. Results based on Collateral Defaults

                                            Full Sample                 High-Information Sample
     Dependent Variable               Default          Default           Default        Default
                                                       Dummy                            Dummy
REGRESSOR                         OLS              Probit            OLS            Probit
Underwriter Market Share          2.3558**         6.3339**          1.6261**       5.9599**
(by # of CDOs)                    (0.6107)         (1.3171)          (0.2951)       (1.4985)
Par value of Underwriter’s        -0.1160**        -0.2979**         -0.118**       -0.3428**
CDO Issuance (natural log)        (0.0296)         (0.0590)          (0.0210)       (0.1052)


2. Results based on Credit Ratings

                                            Full Sample                High-Information Sample
     Dependent Variable              Change in      Downgrade          Change in      Downgrade
                                   credit rating      Dummy          credit rating     Dummy
                                    (# Notches)                       (# Notches)
REGRESSOR                         OLS              Probit           OLS             Probit
Underwriter Market Share          23.274**         2.574**          4.1483          0.3005*
(by # of CDOs)                    (8.37615)        (0.7615)         (5.5567)        (0.1667)
Par value of Underwriter’s        -1.2312*         -0.0922+         -0.1139         -0.0073
CDO Issuance (natural log)        (0.5044)         (0.5044)         (0.4237)        (0.0117)


                                                64
Table 8: Effects of Collateral Originators –
                               Ranking RMBS Originators
  This table examines the effect of the collateral’s Underwriter on the performance of the CDO
 using the H-I sample. For each CDO, a variable is created for the percent of collateral issued by
 each of the top 56 originators. The specifications are identical to those in Table 7, replacing the
  underwriter dummies with the originator variables, and adding variables based on the average
     FICO, CLTV, and DTI of the RMBS collateral (their coefficients are shown at bottom).
 Coefficients are significant at the +10%, *5%, **1% significance level. The final column gives
  the name of the CDO underwriter who bought the largest share of each originator’s collateral.
                    The data are sorted by originator rank from best to worst.

Originator             Average    Default     Default         Rating     Downgrade     Largest Buyer
                        Rank                  Dummy          Change       Dummy
                                    OLS        Probit           OLS        Probit
EquiFirst                 1           2          1**              1            3        Merrill Lynch
(Barclays)                        (-1.44 )    (-33.89)       (-52.33 )     (-0.45 )
Ixis                      2           4           6*              8           1*        Merrill Lynch
(Morgan Stanley)                  (-1.13 )    (-14.92)       (-22.49 )     (-0.51)
ACA                       3          14          5**             4*            8        Merrill Lynch
                                  (-0.58 )    (-16.63)       (-32.60)      (-0.16 )
Delta                     4           8          3**             3*           20        Merrill Lynch
                                  (-0.98 )    (-24.83)       (-37.60)       (0.04 )
RAMP                      5          21           9+             9*            9        Merrill Lynch
(GMAC)                            (-0.24 )     (-6.06)       (-20.23)      (-0.15 )
Carrington                6           9          10+             27            5        Merrill Lynch
                                  (-0.95 )     (-5.66)        (-4.01 )     (-0.21 )
UBS                       7           3          4**             14           34       Goldman Sachs
                                  (-1.40 )    (-19.32)       (-13.97 )      (0.14 )
Long Beach                8          15          13+            13*           18        Merrill Lynch
(WAMU)                            (-0.56 )     (-5.29)       (-14.79)       (0.01 )
Encore                    9           7           12             19           39            UBS
(Bear Stearns)                    (-1.03 )    (-5.43 )        (-8.60 )      (0.20 )
MASTR                    10          20           18             20           24        Merrill Lynch
(UBS)                             (-0.32 )    (-2.93 )        (-7.25 )      (0.06 )
Citigroup                11          29           31             11           12        Merrill Lynch
                                  (-0.13 )     (1.57 )       (-14.95 )     (-0.11 )
Goldman Sachs            12          25           20             16           22        Merrill Lynch
                                  (-0.17 )    (-1.73 )       (-10.44 )      (0.05 )
First Franklin           13          32          15+             32           6*        Merrill Lynch
(Merrill Lynch)                   (-0.01 )     (-4.22)        (-1.60 )     (-0.19)
WAMU                     14          13          11+             47           17        Merrill Lynch
                                  (-0.73 )     (-5.47)         (8.98 )     (-0.02 )
HEAT                     15          35           14             22           19        Merrill Lynch
(Credit Suisse)                    (0.15 )    (-4.99 )        (-6.50 )      (0.03 )
Wells Fargo              16         10**          19             35           26            UBS
                                  (-0.91)     (-2.66 )        (-0.51 )      (0.07 )
Wachovia                 17          44           22             5+           21         Wachovia
                                   (0.37 )    (-0.43 )       (-31.68)       (0.04 )
Aegis                    18          18           26             37           14        Merrill Lynch
                                  (-0.49 )     (0.28 )        (-0.20 )     (-0.06 )
ACE                      19          12          8**             30          46*        Merrill Lynch
                                  (-0.78 )     (-7.63)        (-1.81 )      (0.35)
Saxon                    20           6          7**             28          55+        Merrill Lynch
(Morgan Stanley)                  (-1.05 )    (-14.63)        (-3.69 )      (0.56)
Ameriquest               21          36           24             21           16        Merrill Lynch
                                   (0.19 )     (0.01 )        (-6.69 )     (-0.05 )


                                                 65
Originator          Average   Default    Default     Rating     Downgrade    Largest Buyer
                     Rank                Dummy      Change       Dummy
                                OLS       Probit      OLS         Probit
SASCO                 22         17          16*        38           27      Merrill Lynch
(Lehman Brothers)             (-0.50 )    (-3.74)    (1.28 )      (0.07 )
ABFC                  23         34          21         24           23      Merrill Lynch
(Bank of America)             (0.15 )    (-1.30 )    (-5.76 )     (0.06 )
New Century           24         46          30        15+           13      Merrill Lynch
                              (0.50 )     (1.30 )   (-13.17)      (-0.06 )
Popular               25         41          49*       12+            4          UBS
                              (0.33 )      (9.86)   (-14.82)      (-0.22 )
DLJ Mortgage          26         11          17         29           52      Merrill Lynch
(Credit Suisse)               (-0.81 )   (-3.05 )    (-1.89 )     (0.46 )
BayView               27         5           51*        31           25      Merrill Lynch
                              (-1.10 )   (11.01)     (-1.60 )     (0.07 )
Fremont               28         39          34         26           15      Merrill Lynch
                              (0.32 )     (1.75 )    (-4.32 )     (-0.06 )
RALI                  29        55*         53**        6*          2**      Merrill Lynch
(GMAC)                         (1.64)    (11.70)    (-26.19)      (-0.47)
RASC                  30         22         54**        33           7+      Merrill Lynch
(GMAC)                        (-0.22 )   (12.08)     (-1.50 )     (-0.19)
Merrill Lynch         31         40          41         10*          29      Merrill Lynch
                              (0.32 )     (3.68 )   (-16.79)      (0.09 )
OWNIT                 32         24          42         17          49*      Merrill Lynch
                              (-0.19 )    (4.13 )   (-10.32 )      (0.40)
C-Bass                33         27          25        46+           37        Bank of
                              (-0.14 )    (0.06 )     (8.49)      (0.15 )      America
Option One            34         28          43         56           11      Merrill Lynch
                              (-0.14 )    (4.22 )   (19.49 )      (-0.12 )
Aames Mortgage        35         54         50+         25           10      Merrill Lynch
                              (1.54 )    (11.00)     (-4.52 )     (-0.12 )
Countrywide           36         42         37+         34          30+      Merrill Lynch
                              (0.34 )      (2.40)    (-1.25 )      (0.10)
Deutsche Bank         37        53*          48*        18           28      Deutsche Bank
                               (1.33)      (8.65)    (-9.48 )     (0.08 )
NovaStar              38         43          28         44          36+      Merrill Lynch
                              (0.36 )     (0.55 )    (7.16 )       (0.14)
GSAA                  39         16          44        59**          33      Goldman Sachs
(Goldman Sachs)               (-0.51 )    (4.87 )    (35.48)      (0.13 )
Impac                 40        58+          52          7           35      Merrill Lynch
                               (2.96)    (11.50 )   (-24.14 )     (0.14 )
JPMorganChase         41         48          32         42          31+      Merrill Lynch
                              (0.65 )     (1.63 )    (5.54 )       (0.11)
IndyMac               42         23          35        57**         41+      Merrill Lynch
                              (-0.19 )    (1.88 )    (24.50)       (0.23)
Park Place            43         26          45         53          32+      Merrill Lynch
                              (-0.17 )    (5.25 )   (16.01 )       (0.13)
Morgan Stanley        44         33          39*       43+          44**     Merrill Lynch
                              (0.07 )      (2.81)     (6.32)       (0.25)
Cairn                 45        57+         59**        2*          47**     Merrill Lynch
                               (2.45)    (36.97)    (-47.24)       (0.35)
Bear Stearns          46         38         40+        45+          43*      Merrill Lynch
                              (0.27 )      (3.39)     (7.27)       (0.24)
Argent                47         45          23         50*         51**     Merrill Lynch
(Citigroup)                   (0.40 )    (-0.27 )    (14.37)       (0.43)
Residential Asset     48         31          33        58**         48**     Merrill Lynch
(GMAC)                        (-0.02 )    (1.66 )    (28.73)       (0.38)
SoundView             49         50          36        48+          40+      Merrill Lynch
(RBS)                         (0.95 )     (1.89 )    (11.59)       (0.21)


                                           66
Originator            Average   Default      Default      Rating     Downgrade   Largest Buyer
                       Rank                  Dummy        Change      Dummy
                                  OLS         Probit        OLS        Probit
Barclays                50         37           46           55          42      Merrill Lynch
                                (0.21 )       (5.31 )     (18.47 )     (0.24 )
HarborView              51         49           27          51+         53**         RBS
(RBS)                           (0.67 )       (0.53 )     (14.48)      (0.51)
Accredited Mortgage     52         51           38           54          38      Merrill Lynch
                                (1.07 )       (2.69 )     (16.61 )     (0.19 )
Terwin                  53         47           29          49+         56**     Merrill Lynch
                                (0.53 )       (0.93 )     (12.66)      (0.87)
Fieldstone              54         30          57**          41         54*      Merrill Lynch
                                (-0.08 )     (18.48)       (4.53 )     (0.56)
Nomura                  55         52          55**          40         50+      Merrill Lynch
                                (1.24 )      (14.71)       (2.93 )     (0.42)
HSBC                    56        56+          56**          52         45**     Merrill Lynch
                                 (2.09)      (15.26)      (15.75 )     (0.27)
MORTGAGE CHARACTERISTICS
FICO              -      -0.0048           -0.0172      0.0477       -0.0002           -
                         (0.0051)          (0.0195)     (0.0684)     (0.0006)
CLTV              -      0.0190+           0.2269**     -0.1681      0.0022            -
                         (0.0103)          (0.0569)     (0.2003)     (0.0015)
DTI               -      0.0091            -0.0182      -0.0171      0.0085            -
                         (0.0068)           (0.0378)    (0.1073)     (0.0015)


                                                67
Table 9: Asymmetric Information:
                  Effects of Banks using their own CDOs as Collateral


This table examines whether there is a relationship between CDO performance and the amount of
CDO collateral that is issued by the bank that acts as the CDOs Underwriter. The regressions are
   identical those in Table 7 using the high-information sample, with the addition of interaction
 terms equal to the percent of CDO collateral coming from the underwriter times the underwriter
    fixed effect dummy. The coefficients are given for the effect of the fixed effect underwriter
   dummies (F.E.) and the interaction of the percent of CDO collateral coming from the CDOs
     underwriter (Int.). Coefficients are significant at the +10%, *5%, **1% significance level.


              Bank              Coefficient    Default    Default     Rating     Rating
                                  Type          OLS        Probit      OLS       Probit
              Bank of America      F.E        -0.01      -0.19       -1.21+     -0.13**
                                   Int.       2.16**     drop        -35.70**   -1.50
              Barclays             F.E        0.09+      drop        -0.80      -0.32**
                                   Int.       -20.86**   drop        372.48**   drop
              Bear Stearns         F.E        0.09*      -0.24+      -0.78      -0.10*
                                   Int.       -5.15**    37.77**     98.52**    1.96**
              Calyon               F.E        0.09*      0.43**      -1.21+     -0.18**
                                   Int.       -7.92**    -129.53**   -81.07**   -2.14**
              Citigroup            F.E        0.01       -0.22*      -0.54      -0.08*
                                   Int.       1.17+      12.13*      11.24      0.05
              Credit Suisse        F.E        0.09**     0.47**      0.11       -0.12*
                                   Int.       -3.69**    -14.32**    16.57+     drop
              Deutsche Bank        F.E        0.06+      0.41**      0.27       -0.04
                                   Int.       -0.82      drop        -6.02      drop
              Dresdner Bank        F.E        0.00       0.41*       -1.91*     -0.34**
                                   Int.       2.62       drop        15.75      -11.32**
              Goldman Sachs        F.E        -0.08*     -0.33       -0.61      -0.07+
                                   Int.       3.85**     25.65**     32.37**    0.45+
              JP Morgan            F.E        0.15**     0.54**      -1.13      -0.33**
                                   Int.       12.93+     -156.79     276.85**   drop
              Lehman Brothers      F.E        -0.02      -0.10       -0.21      drop
                                   Int.       -17.84**   drop        124.78**   drop
              Merrill Lynch        F.E        0.04       0.23        -0.09      -0.04+
                                   Int.       0.47       5.37**      1.46       0.84**
              Morgan Stanley       F.E        0.12**     0.34**      0.54       -0.03
                                   Int.       28.84**    drop        -120.05    -5.44+
              RBS                  F.E        0.05       0.48**      -0.09      -0.04
                                   Int.       -4.87*     -86.96**    31.09      -0.45
              UBS                  F.E        0.02       -0.05       -1.05+     -0.13*
                                   Int.       -1.29      drop        64.00**    drop
              Wachovia             F.E        0.05       0.40*       -0.27      -0.15+
                                   Int.       -2.30      8.05        14.93      0.80
              WestLB               F.E        0.18**     0.01        -0.62      -0.09
                                   Int.       drop       drop        drop       drop


                                                68
Table 10: Determinants of Banks’ ABS CDO Writedowns


These regressions look at how each Underwriter’s CDO characteristics relate to the total amount
of write-downs they reported on ABS CDOs. The value of their ABS CDO write-downs is taken
  from CreditFlux and includes all information reported as of February 6, 2009. The dependent
   variable is the total amount of ABS CDO writedowns as a percent of the total assets on each
bank’s balance sheet at year-end 2007. All of the independent variables are weighted averages of
 the characteristics of each bank’s CDOs. Heteroskedasticity robust standard errors are given in
  parentheses under estimated coefficients. Coefficients are significant at the +10%, *5%, **1%
                                        significance level.


Dependent Variable: ABS CDO write-downs($) divided by total assets($), by underwriting bank

                                          (1)         (2)         (3)          (4)          (5)
       REGRESSOR:                        OLS         OLS         OLS          OLS          OLS
       Permarket                    __           0.0520**     0.0494*      0.0481+      0.051*
                                                 (6.28E-08)   (5.05E-03)   (1.03E-02)   (5.90E-03)
       DEFAULT                      -0.010       0.01160      0.00273      0.0031       9.03E-03
                                    (1.89E-02)   (6.23E-03)   (6.48E-03)   (1.43E-02)   (1.03E-02)
       AAASUB                       -9.11E-03    -0.00230     -0.0093      -0.0373      -1.05E-02
                                    (2.72E-02)   (9.79E-03)   (6.62E-03)   (1.38E-02)   (1.21E-02)
       DOWNGRADE                    -5.03E-04    8.00E-05*    -5.157-04    -1.17E-03    -9.26E-04
                                    (1.30E-03)   (3.17E-04)   (3.17E-04)   (7.15E-04)   (6.63E-04)
       NUMBER OF ASSETS             __           __           -1.25E-05    -3.32E-06    8.30E-04
                                                              (1.35E-05)   (3.03E-05)   (3.60E-04)
       NUMBER OF TRANCHES           __           __           0.00103*     1.08E-03     0.0013+
                                                              (2.36E-04)   (5.48E-04)   (3.60E-04)
       % HEL                        __           __           __           4.28E-03     __
                                                                           (1.46E-02)
       % CMBS                       __           __           __           0.0291       __
                                                                           (2.06E-02)
       % RMBS                       __           __           __           -1.29E-02    __
                                                                           (1.36E-02)
       % CDO                        __           __           __           -1.33E-02    __
                                                                           (1.25E-02)
       % SYNTHETIC                  __           __           __           __           -5.85E-03
                                                                                        (2.75E-02)
       % FIXED RATE                 __           __           __           __           -4.42E-04
                                                                                        (1.11E-02)
       Issuance                     -1.16E-06    2.63E-07     -1.60E-07    -7.93E-07    -3.51E-07
       2005 ($mm)                   (1.07E-06)   (2.31E-07)   (2.13E-07)   (4.06E-07)   (3.35E-07)
       Issuance                     6.85E-07     -2.02E-07+   -7.15E-08    3.26E-09     4.49E-07+
       2006 ($mm)                   (6.44E-07)   (2.01E-07)   (1.19E-07)   (1.96E-07)   (1.71E-07)
       Issuance                     5.74E-07*    4.26E-07**   5.83E-07*    6.13E-07*    5.83E-07*
       2007 ($mm)                   (3.15E-07)   (8.01E-08)   (6.64E-08)   (9.10E-08)   (8.44E-08)
       Intercept                    1.16E-02     8.04E-03     5.77E-03     1.62E-02     5.96E-03
                                    (2.28E-02)   (7.53E-03)   (3.94E-03)   (7.71E-03)   (5.94E-03)
       Regression summary statistics
       Adj. R2                       0.671       0.898        0.915        0.914        0.913
       SER                           0.004       0.001        0.001        0.001        0.001
       n                             17          17           17           17           17


                                                  69
4.4 CDO Credit Ratings

       This final section analyzes the credit ratings given to CDO tranches and their

collateral assets by Moody’s, Fitch, and S&P. It is organized around the four questions

given in Section 3: 1) What factors were important in determining initial CDO credit

ratings?; 2) What factors have driven the wave of CDO downgrades?; 3) How well did

original collateral asset and CDO tranche ratings predict performance?; and 4) What

factors explain the mistakes made in forecasting performance?

Original CDO Credit Ratings

        First, I consider the factors explaining the percent of the CDO that was initially

rated AAA by each of the three agencies, essentially trying to “back-out” those factors

that were important in the agencies’ models. I limit my analysis to the CDOs in the high-

information sample, because I have data on the original credit ratings of their collateral,

which was an important input used by the CRAs for determining CDO ratings. There are

three different dependent variables, one for the %AAA assigned by each agency. One

complicating factor is that for most CDOs, a given CRA rated only a portion of the

tranches; because of this, CDOs are only included in the regressions if the rating agency

assigned ratings to 75% or more of the tranches. This means that for the regression using

Fitch % AAA as the dependent variable, there are only 86 observations. The initial

specification for these regressions is:

(3)            %AAA (M/F/SP)i = α + ß1Original Balancei + ß2HGi + ß3# Assetsi +

               ß4# Tranchesi + ß5Average initial collateral ratingi + ß6WACi +

               ß7IYear2005i + ß8IYear2006i + ß9IYear2007i +εi


                                             70
The results of these regressions are presented in Panel A of Table 11. The most

notable finding from Table 11 is that much of the variation in the % AAA can be

explained by the initial credit ratings of the underlying collateral. This finding strongly

supports the “recycled ratings effect” of hypothesis 3A. Reliance on prior ratings is seen

in two variables – HG (a dummy that equals 1 if the CDO had an original weighted

average rating factor of less than 180 and zero otherwise) and average initial collateral

rating. For S&P, an HG CDO is associated with a 6% increase in % AAA, and a one S.D.

decrease in average initial collateral rating (3.5 notches) is associated with a 5.6%

increase in %AAA; both of these variables on their own explain approximately half of the

S.D. of %AAA. Perhaps this finding is less impressive given that there is a very low level

of variation in the %AAA of the CDOs in the sample – the standard deviation is only

around 10%. However, the heavy reliance on just two input variables implies that either

the agencies’ rating models had been incredibly simplified, or that inputs to the models

were “tweaked” until they gave the desired amount of AAA. The inclusion of additional

independent variables to the regressions only slightly increases the adjusted R-squared

for S&P and Moody’s, and none at all for Fitch, and the coefficients on HG and average

initial collateral rating are relatively unchanged.

       The other interesting finding from Table 11 is the positive coefficient on

% Collateral rated by Agency, although this effect is only statistically significant for

S&P. This effect might reflect the CRAs’ use of “notching.” Notching refers to the

practice of incorporating the ratings of another CRA into a CRA’s own rating model.

Because it was rare that a single CRA had rated all CDO assets and since it was too

expensive to re-rate all the CDO’s underlying assets, a CRA would instead use ratings


                                             71
given by its competitors, but “adjust” these ratings downward before using them in their

own CDO models. This would explain why a CDO would receive a higher fraction of

AAA from a CRA when more of its assets were rated by that agency, as their ratings did

not have to be “notched.” It also shows that CDOs could receive the most AAA if they

were rated by the CRA who had rated the highest percent of its collateral. This could

explain the near elimination of Fitch from the CDO rating business by 2005; Fitch had a

significantly lower market share in rating subprime RMBS securities, which became the

main collateral for CDOs.

       Next, I add underwriter fixed effects to test for differential treatment among the

banks. Panel B of Table 11 ranks the underwriters based on their effect on % AAA, after

controlling for observable CDO asset and liability properties. Deutsche Bank CDOs were

associated with statistically significant smaller % AAA by all three CRAs, while CDOs

from Citigroup, RBS, and Bank of America had a larger % AAA by Moody’s and S&P.

The reasons for these variations in % AAA across underwriters arise from some

unobservable variable. Likely candidates include the correlation inputs associated with

the underwriter’s CDO asset pools or the type of relationship between the underwriter

and the CRA.

       Lastly, Panel C of Table 11 shows the effects of certain CRA combinations and

the overall number of ratings on the % AAA, through the addition of independent

variables equal to the percent of a CDO’s par value rated by the given rating agency

combination, and a variable equal to the average number of ratings on the CDO tranches

(0-3). The results in Panel C provide evidence for a negative “peer pressure effect”

(discussed in hypothesis 3B) on % AAA. The number of ratings is negatively correlated


                                            72
with the % AAA, indicating that having fewer CRAs per CDO led to more generous AAA

allotments. However, this effect might be due solely to the influence of a Fitch rating;

while CDOs rated by Fitch + Moody’s or Fitch + S&P were given less AAA, CDOs rated

by Moody’s + S&P were given more AAA. One possible explanation for this “Fitch

effect” is that a Fitch rating decreased the “recycled ratings effect.” Given that Fitch had

rated relatively few of the assets used as CDO collateral, it would not normally be

desirable to get a Fitch rating because of the notching effects. Presumably, CDO

underwriters would use Fitch only if: 1) Moody’s or S&P would not give an agreeable

rating; or 2) most of the collateral assets had no rating and Fitch would re-rate all of the

assets at a lesser cost than would the other two CRAs. Both of these actions might be the

reason why the association of Fitch + Moody’s and Fitch + S&P CDOs are correlated

with lower % AAA.


Determinants of CDO Tranche Downgrades

       Having ascertained the determinants of the initial CDO credit ratings, I next

revisit the factors that have affected the magnitude of downgrades on CDO tranches.

These regressions are similar to those performed in section 4.2; however, the dependent

variables used here are specific to each rating agency, rather than the average downgrade.

Fitch is not included in the present analysis because there are very few CDO tranches that

carry both an original and a current Fitch rating. Also, Default is included as an

independent variable. The results are presented in Panel A of Table 12. There is strong

evidence supporting the “seniority effect” of hypothesis 3C; controlling for Default, the

more senior tranches have experienced most downgrades. For example, the AAA


                                             73
tranches rated by Moody’s are associated with a 4-notch increase in downgrades. The

coefficients of the other independent variables repeat many of the results from Section

4.2.

       One somewhat surprising result from Panel A is the fact that even using all of

these independent variables, the regressions only account for 53% of the variation in

Moody’s Downgrades and 54% in S&P Downgrades, as seen by the adjusted R-squared

values. Adding the underwriter fixed effect dummy variables in Panel B only increases

these values by 1%, indicating that primary unobservable variables are not related to

CDO underwriter. One plausible explanation for the mismatch between observable CDO

variables and credit-rating downgrades is that downgrades usually come after some time

lag, as rating agencies wait to see a “trend” in performance before changing the rating.

Further regression analysis could test for this by adding lags of the Default variables;

unfortunately, I only had Default data for a single point in time. A second possible

explanation for the mismatch of observable CDO performance and tranche downgrades is

that the rating agencies only periodically conduct surveillance analysis on previously

rated deals. Perhaps some CDO deals have not been recently revisited, or perhaps the

level of post-issuance CDO surveillance is related to the amount of publicity or investor

concern surrounding certain CDOs or CDO types.


How well did initial ratings predict outcomes?

       Table 13 addresses the relationship between ex-ante credit ratings and ex-post

performance. Panel A looks specifically at the relationship between the ratings of the

CDO collateral assets and the realized asset default rate, while Panel B explores the


                                             74
relationship between initial AAA CDO tranche ratings and current losses on AAA

tranches. Panel A regresses the average initial collateral rating by each agency

(separately) on the realized Default. Control variables are added for the percent of assets

that were rated by the CRA in question, as it would be expected that the predictive power

of the average rating would be much less if the CRA only rated a few assets. In the

second regression specifications for each CRA, I add interaction terms to test if the effect

of a given average rating on Default varies depending on the asset characteristics.

       Overall, the results in Panel A provide support for the “asset-class effect”

discussed in hypothesis 3D. In other words, the same credit rating translated into a

different effect on Default depending on observable characteristics of the asset, indicating

that the credit ratings did not incorporate this information. Specifically, a lower credit

rating led to a less pronounced increase in Default if it described a CMBS asset, but led to

a much higher increase in Default if it described an RMBS backed by Alt-A ARM

mortgages. These findings confirm allegations mentioned in Section 2 that credit ratings

have had inconsistent meanings over time and across different asset types.

       Finally, Panel B examines the relationship between AAA losses and the amount

of initial AAA given to a CDO. As discussed in Section 3, there is no direct measure for

realized losses on individual tranches. For the purpose of these regressions, I create a

variable that calculates the exposure of the AAA bondholders to losses on the underlying

collateral: the variable Loss is calculated as (Default – Current Credit Support). I regress

the %AAA and the number of AAA tranches given by each agency on Loss, with the

addition of the CDO asset and liability control variables.


                                             75
The results in Panel B partially support the “super-senior effect” of hypothesis 3E.

While the initial %AAA is not a significant predictor of Loss, the number of AAA

tranches is positively correlated to Loss. This indicates that the losses facing AAA

bondholders are related to the number of AAA tranches originally issued, and that the

more AAA tranches, the more losses facing the note-holders. However, the Loss measure

is based on the AAA tranche with the lowest level of current credit enhancement, thus

overstating losses to the holders of super-senior tranches. Therefore, the average measure

of Loss may not depend on the number of initial AAA tranches, but the Loss to different

classes of AAA tranches will depend on the number of AAA tranches, with higher Loss

to the least senior AAA note-holders in CDOs with super-senior tranches. It is possible

that investors failed to realize the nonequivalence of a AAA tranche of a CDO with

super-senior tranches and a tranche from a CDO without super-seniors. On the other

hand, the underwriting bank often retained the super-senior tranches and many were

never rated, making it difficult for an outside AAA investor to ascertain the number or

existence of such tranches.


Why did CDO credit ratings fail?

       The final regressions take a first look at some possible reasons for the inaccuracy

of the CDO credit ratings. In order to quantify the level of credit-rating accuracy, I create

a variable based on the discrepancy of predicted and realized default levels. Using the

default matrix from S&P’s CDO Evaluator, version 3 (see Appendix C), I calculate the


                                             76
predicted value for Default.65 The regressions presented in Table 14 use the difference in

Default and predicted default for the CDO collateral by each agency as the dependent

variable.

         The most striking result in Panel A is the association of credit-rating failures with

the presence of 2006 and 2007-vintage collateral, whose coefficients are large and

significant in all specifications. This finding supports earlier evidence showing that

collateral quality declined significantly in those years, and furthermore shows that the

rating agencies failed to identify this decline in quality. Also of interest are the negative

and significant coefficients on % CLO and % CMBS, showing that these assets had more

accurate ratings.66 Lastly, the coefficient on % Collateral rated by Fitch is negative and

significant, while the coefficient on % Collateral rated by Moody’s is positive and

significant. However, it is hard to compare the accuracy of Fitch against S&P and

Moody’s due to Fitch’s markedly lower participation in the CDO rating business. The

apparent superiority of Fitch ratings might result simply because Fitch had fewer

opportunities to make mistakes with CDO ratings. They were no longer significant

participants in CDOs when the most pronounced deterioration in collateral quality and

increases in CDO complexity were occurring.

         In Panel B, I rerun the regressions from Panel A with the addition of underwriter

fixed effect dummies, to see if the severity of rating “mistakes” varied across

underwriters. The results from these regressions show that the severity of rating

“mistakes” was dependent on the identity of the underwriter. However, this does not

65
   It is difficult to ascertain whether the values used from the S&P matrix in Appendix C were the intended
probability of default numbers for all three CRAs, or even for S&P, due to the lack of clear ratings
definitions from the CRA publications.
66
   However, the default data is only current as of February 2009. The CMBS market has very recently
experienced a prolific increase in defaults, which is not captured by my data.


                                                    77
mean that certain underwriters received differential treatment by the rating agencies; on

the other hand, it is actually evidence that the underwriters didn’t receive differential

treatment, but that this lack of differentiation among underwriters was itself the problem.

Looking at the average rankings in Panel B, we see that the severity of the rating

mistakes directly mirror the quality of the underwriter’s CDOs, with the “best”

underwriters like Goldman Sachs associated with smaller mistakes, and the “worst”

underwriters with more mistakes. Similar to the lack of variation in the % AAA, these

results show that the rating agencies failed to realize that some underwriters were doing a

better job than others. However, it might have been impossible for the rating agencies to

quantify “underwriter quality,” given the finding of Section 4.3 that the “underwriter

effect” is not easily explained by any observable CDO asset and liability properties or by

the size of the underwriter.67

        Finally, Table 15 begins a cursory investigation of the potential “conflict of

interest” problems discussed in hypothesis 3F. I create variables to indicate the amount of

CDO business a CRA received for each underwriter, equal to the total par value of all of

the underwriter’s tranches rated by the CRA. Since the rating agencies are paid a fee

based on the par value of the securities they rate, conflicts of interest would suggest that

they would give more desirable ratings to bigger underwriters in order to increase their

own profits. I rerun the regressions from Table 11 – Table 14, adding in the variables for

the amount of business between the underwriter and CRA, and present their coefficients

in Table 15.


67
  One solution might have been to use the historical performance of the underwriter’s CDOs to proxy for
“underwriter quality,” but this too would be problematic in that the history of most underwriters only
spanned a few years.


                                                   78
The signs of the coefficients for Moody’s and S&P are consistent with the conflict

of interest problem: bigger underwriters were associated with a higher initial % AAA,

resulting in a subsequent higher level of downgrades, AAA Loss, and an overall higher

level of prediction mistakes as calculated by the difference in predicted and actual levels

of Default. However, these results could just as easily be caused by the fact that the most

prolific underwriters were producing worse CDOs, and that rather than receive

preferential treatment by the rating agencies, the problem was merely that these

originators were treated the same as other underwriters, although in reality they were

producing worse CDOs. Given the striking uniformity of initial CDO credit ratings and

the fact that the prediction value of the asset credit ratings depended mainly on the

quality of the underwriter, the latter explanation seems more likely, suggesting that the

conflicts of interest is not as much to blame as simply a failure to distinguish among

underwriter quality.


                                             79
Table 11: Determinants of %AAA by each CRA
                              Panel A: Effect of CDO Characteristics

  This table examines the factors that affected the initial amount of each CDO that was given an
   AAA rating by each of the three CRAs. The dependent variables are the % of AAA by S&P,
   Fitch, or Moody’s at issuance. Standard errors, clustered by CDO underwriter, are shown in
  parentheses under estimated coefficients. Coefficients are significant at the +10%, *5%, **1%
                                          significant level.
                                  (1)           (2)            (3)      (4)         (5)          (6)
     Dependent Variable          S&P           S&P          F %AAA   F %AAA       M %AAA       M %AAA
                               %AAA          %AAA
                             0.0641**      0.0728**     0.0574+      0.0414       0.0669**     0.0801**
HG                           (0.0126)      (0.0124)     (0.0301)     (0.0404)     (0.0157)     (0.0154)
                             2E-05**       2E-05**      3E-05        4E-05        2E-05**      1E-05**
Original CDO Balance         (0.0000)      (0.0000)     (0.0000)     (0.0000)     (0.0000)     (0.0000)
                             0.0001+       0.0001+      -0.0001      -0.0001      0.0002**     0.0002*
Number of assets             (0.0001)      (0.0001)     (0.0002)     (0.0002)     (0.0001)     (0.0001)
                             -0.0036+      -0.0048*     -0.0004      -0.0002      -0.0039+     -0.0053*
Number of Tranches           (0.0018)      (0.0018)     (0.0025)     (0.0029)     (0.0019)     (0.0021)
Average initial collateral   -0.0161**     -0.0143**    -0.0163*     -0.0172*     -0.0161**    -0.0126**
rating                       (0.0033)      (0.0033)     (0.0061)     (0.0081)     (0.0038)     (0.0039)
                             -0.0054       -0.0048      0.0053       0.0006       -0.0059      -0.0042
WAC                          (0.0043)      (0.0032)     (0.0076)     (0.0114)     (0.0041)     (0.0030)
                                           -0.1088*                  0.0044                    -0.1093+
% Subprime                   -             (0.0411)     -            (0.0694)     -            (0.0594)
                                           -0.0781+                  0.0118                    -0.0947
% Alt-A Fixed Rate           -             (0.0429)     -            (0.0909)     -            (0.0738)
                                           -0.0753                   -0.0145                   -0.1379
% Alt-A ARM                  -             (0.1007)     -            (0.2287)     -            (0.1218)
                                           -0.1395**                 -0.0061                   -0.1176*
% CDO                        -             (0.0263)     -            (0.0850)     -            (0.0507)
                                           -0.1900**                 -0.0621                   -0.0960+
% Prime                      -             (0.0467)     -            (0.1201)     -            (0.0497)
                                           -0.1363**                 -0.0358                   -0.1088*
% Midprime                   -             (0.0297)     -            (0.0586)     -            (0.0526)
                                           -0.2389+                  -0.0453                   -0.2168
% CES RMBS                   -             (0.1190)     -            (0.1861)     -            (0.1310)
                                           -0.0248                   -1.6955                   -0.2736
% HELOC                      -             (0.6567)     -            (1.8949)     -            (0.7329)
                                           -0.3533**                 -0.0307                   -0.3347**
% CLO                        -             (0.0464)     -            (0.3230)     -            (0.0729)
                                           -0.1056                   -0.0164                   -0.0783
% CMBS                       -             (0.0657)     -            (0.0822)     -            (0.0830)
                                           -0.0197                   -0.0195                   -0.0195
% Fixed Rate                 -             (0.0157)     -            (0.0393)     -            (0.0149)
                                           0.0003                    -0.0297                   0.0021
% Synthetic                  -             (0.0143)     -            (0.0196)     -            (0.0165)
                                           0.0021                    -0.0622                   0.0036
% 2006-vintage collateral    -             (0.0146)     -            (0.0368)     -            (0.0113)
                                           0.0152                    -0.0209                   0.0128
% 2007-vintage collateral     -            (0.0175)     -            (0.0659)     -            (0.0174)
% Collateral rated by                      0.1019+                   0.1275                    0.0604
Agency                        -            (.0615)      -            (0.1211)     -            (0.0500)
Intercept                     0.8974**     1.0498**     0.8911**     0.9350**     0.8930**     1.0173**
Regression Summary Statistics
Adj. R2                       0.72355642   0.77984287   0.63409497   0.63409497   0.74993314   0.79321172
SER                              0.05272      0.04705      0.05237      0.05237      0.05056      0.04598


                                                   80
Panel B: Effect of CDO Underwriter

  This table examines whether the identity of the CDO underwriter affected the amount of AAA
 given to a CDO. The regressions are identical to (2), (4), and (6) in Panel A, with the addition of
 fixed effect dummies for the underwriter. The results are listed according to the average rank of
the underwriter, with lower numbers corresponding to lower amounts of AAA given to the bank’s
 CDOs. The estimated coefficients shown in parentheses underneath the ranking are significant at
                                  the +10%, *5%, **1% level.

                Underwriter        Average Rank   S&P %AAA     F %AAA       M %AAA
                Deutsche Bank           1              1*          1*          2**
                                                   (-0.0181)   (-0.1626)    (-0.0247)
                Dresdner Bank           2               3         omit          3
                                                   (-0.0031)                (-0.0116)
                UBS                     3               2            6          4
                                                   (-0.0110)    (-0.0329)   (-0.0060)
                WestLB                  4             14+            3         1**
                                                    (0.0164)    (-0.0787)   (-0.0530)
                Lehman Brothers         5               5           11          5
                                                    (0.0059)    (-0.0024)   (0.0033)
                Barclays Capital        6               4           14          6
                                                    (0.0022)     (0.0230)   (0.0041)
                JP Morgan               7               7          omit         9
                                                    (0.0090)                (0.0108)
                Merrill Lynch           8              10            8          8
                                                    (0.0128)    (-0.0260)   (0.0095)
                Credit Suisse           9              13*           7          7
                                                    (0.0157)    (-0.0309)   (0.0063)
                Morgan Stanley          10            11+            4         12+
                                                    (0.0133)    (-0.0651)   (0.0139)
                Calyon                  11              8           10          11
                                                    (0.0117)    (-0.0200)   (0.0123)
                Bear Stearns            12              6           15          10
                                                    (0.0079)     (0.0454)   (0.0112)
                Wachovia                13              9           12         13+
                                                    (0.0120)    (-0.0008)   (0.0143)
                Citigroup               14            12+            9         15*
                                                    (0.0148)    (-0.0245)   (0.0164)
                RBS                     15             17*          2*        17**
                                                    (0.0217)    (-0.1229)   (0.0321)
                Bank of America         16            16**           5         16*
                                                    (0.0217)    (-0.0595)   (0.0184)
                Goldman Sachs           17             15*          13          14
                                                    (0.0202)     (0.0041)   (0.0148)


                                                  81
Panel C: Effect of Specific CRA Combinations and # Ratings

    This panel shows the effect of specific CRA ratings on the average % AAA per CDO. The
 regression is identical to (2) in panel A, with the addition of dummies based on the combination
and number of ratings of the CDO. The dependent variable is the average % AAA of S&P, F, and
                                               Moody’s.
                                   REGRESSOR       Coefficient
                                   F only          0.0519
                                   SP only         0.0409**
                                   F/M only        -0.0316**
                                   F/SP only       -0.0069
                                   M/SP only       0.0040
                                   M/SP/F          0.0081+
                                   # Ratings       -0.0123*


             Table 12: Determinants of Downgrades by Moody’s and S&P
                               Panel A: Effect of CDO Characteristics

   This table examines the factors that determined the magnitude of tranche downgrades by
Moody’s and S&P. Fitch is not included because very few tranches contain an initial and current
     rating from Fitch. The dependent variables are the number of notches the tranche was
downgraded by Moody’s or S&P. Standard errors, clustered by CDO underwriter, are shown in
 parentheses under estimated coefficients. Coefficients are significant at the +10%, *5%, **1%
                                        significant level.

                     Dependent Variable         M Downgrade      S&P Downgrade
                     REGRESSOR:                 OLS              OLS
                                                1.6197*          3.2437**
                     Default                    (0.7418)         (0.8744)
                                                -6.3645**        -6.3076**
                     % Subordination            (1.3163)         (1.0485)
                                                -0.1590*         -0.1382**
                     Tranche coupon             (0.0649)         (0.0472)
                                                -0.0006          -0.0006
                     Original Tranche Balance   (0.0008)         (0.0009)
                                                -3.9982**        -2.8395*
                     % of Transaction           (1.2180)         (1.2626)
                                                -0.2442          -0.8938
                     HG                         (0.4379)         (0.6558)
                                                0.0093*          0.0084*
                     Number of assets           (0.0036)         (0.0039)
                                                -0.0261          -0.0792
                     Number of Tranches         (0.1189)         (0.1280)
                                                1.5494           4.3683
                     % Subprime                 (10.1112)        (9.0855)
                                                -2.5218          1.9671
                     % Alt-A Fixed Rate         (11.0595)        (8.9815)
                                                17.2572          21.8594*
                     % Alt-A ARM                (10.1751)        (9.7084)
                                                7.5923           10.0938
                     % CDO                      (10.5940)        (9.2455)


                                                82
S&P
Dependent Variable        M Downgrade       Downgrade
REGRESSOR:                OLS               OLS
                          15.0931           12.3975
% CES RMBS                (10.6224)         (8.0916)
                          9.7576            41.6293+
% HELOC                   (28.6049)         (22.1986)
                          -12.7820          -8.9135
% CLO                     (10.5058)         (9.4269)
                          -9.6451           -2.9709
% CMBS                    (10.4932)         (9.1305)
                          0.5802            0.1781
% Fixed Rate              (0.8780)          (0.8294)
                          -0.8205           -1.0549
% Synthetic               (0.6243)          (0.7566)
Change in average         -0.0906           -0.1415*
collateral rating         (0.0856)          (0.0554)
% 2006-vintage            2.5242**          1.2596
collateral                (0.5617)          (0.7656)
% 2007-vintage            1.5900            -0.0911
collateral                (1.6712)          (1.5429)
                          0.0423            0.4651
Number of ratings         (0.3165)          (0.4277)
                          -1.4905**         0.5336
IYear2005                 (0.5141)          (0.6801)
                          0.1350            2.1820**
IYear2006                 (0.6283)          (0.5409)
                          0.3591            2.1227**
IYear2007                 (0.7140)          (0.6715)
Initial Tranche Rating Dummies
                          4.0069**          1.5041+
AAA                       (0.6860)          (0.7869)
                          2.0619*           0.4176
AA+                       (0.9674)          (0.8148)
                          3.7332**          1.3306+
AA                        (0.5615)          (0.6850)
                          2.6571**          0.1168
AA-                       (0.6612)          (0.7816)
                          3.4266**
A+                        (0.8303)          omit
                          1.7604**          -1.5958*
A                         (0.5387)          (0.7396)
                          1.4577+           -1.5122*
A-                        (0.7273)          (0.7058)
                                            -3.2824**
BBB+                      omit              (0.7680)
                          -0.2509           -3.7138**
BBB                       (0.5642)          (0.8029)
                          -2.1127**         -5.6114**
BBB-                      (0.5083)          (0.6355)
                          -3.0050**         -6.3979**
Below IG                  (0.4817)          (0.6657)
Intercept                 6.5363            4.3406
Regression Summary Statistics
Adj. R2                       0.52907397         0.5283653
SER                                3.9859           3.9849
n                                    2542             2555


                            83
Panel B: Effect of CDO Underwriter

  This table examines whether the identity of the CDO underwriter affected the magnitude that a
tranche was downgraded by Moody’s and S&P. The regressions are identical to those in Panel A,
 with the addition of fixed effect dummies for the underwriter. The results are listed according to
the average rank of the underwriter, with lower numbers corresponding to fewer downgrades. The
  estimated coefficients shown in parentheses underneath the ranking are significant at the +10%,
                                        *5%, **1% level.

                 Underwriter          Average Rank    M Downgrade   S&P Downgrade
                 Dresdner Bank             1                1*            2**
                                                        (-1.6759)      (-2.6149)
                 Bank of America           2                3              3+
                                                        (-0.7140)      (-1.6657)
                 Calyon                    3                2               4
                                                        (-0.9431)      (-1.1587)
                 WestLB                    4                5             1**
                                                        (-0.4627)      (-2.6855)
                 JP Morgan                 5                6               5
                                                        (-0.1211)      (-0.4372)
                 UBS                       6                7               7
                                                        (-0.0472)      (-0.2726)
                 Bear Stearns              7                9               8
                                                        (0.2398)       (-0.0339)
                 Wachovia                  8                8               9
                                                        (0.0300)        (0.0434)
                 Lehman Brothers           9                12              6
                                                        (0.6000)       (-0.3736)
                 Deutsche Bank             10               4              17
                                                        (-0.5001)       (0.7837)
                 Citigroup                 11               11             11
                                                        (0.3886)        (0.0925)
                 RBS                       12               13             10
                                                        (0.6419)        (0.0552)
                 Goldman Sachs             13               10             14
                                                        (0.2572)        (0.3960)
                 Barclays Capital          14               15             13
                                                        (0.9504)        (0.3728)
                 Credit Suisse             15              17*             12
                                                        (1.7464)        (0.3214)
                 Merrill Lynch             16               14             15
                                                        (0.6985)        (0.6638)
                 Morgan Stanley            17               16             16
                                                        (1.0870)        (0.7457)


                                                 84
Table 13: Predictive Power of Original Credit Ratings of the CRAs
  Panel A: Significance of ex-ante collateral pool ratings in forecasting ex-post default rate

 This table looks at the relationship between the original collateral ratings of the CDO assets by
    each of the three CRAs (“Moody”, “Fitch”, or “S&P”) and the realized default rate. The
  dependent variable is the realized default rate of the assets in each CDO collateral pool. The
 interaction terms are computed as the collateral rating by agency “x” times the given variable.
   Standard errors, clustered by CDO underwriter, are shown in parentheses under estimated
       coefficients. Coefficients are significant at the +10%, *5%, **1% significant level.

                            M (1)       M (2)        F (1)       F (2)         SP (1)        SP (2)
Dependent Variable:     Default     Default     Default       Default      Default       Default
                        0.0511**    0.0324+
Moody                   (0.0083)    (0.0163)    -             -            -             -
                                                0.0499**      0.0242
Fitch                   -           -           (0.0081)      (0.0160)     -             -
                                                                           0.0520**      0.0281
S&P                     -           -           -             -            (0.0085)      (0.0165)
                        -3E-05      -3E-05      -4E-05        -4E-05       -3E-05        -3E-05
Original Balance        (0.0000)    (0.0000)    (0.0000)      (0.0000)     (0.0000)      (0.0000)
                        0.0003      0.0004      0.0004        0.0005+      0.0003        0.0005
Number of assets        (0.0002)    (0.0003)    (0.0002)      (0.0003)     (0.0002)      (0.0003)
% Collateral rated by   0.1937**    0.1477+     0.1760*       0.1019       0.1705*       0.1131
Moody's                 (0.0623)    (0.0782)    (0.0703)      (0.0951)     (0.0664)      (0.0811)
% Collateral rated by   -0.2908**   -0.3058**   -0.2706**     -0.2690**    -0.2853**     -0.3025**
Fitch                   (0.0805)    (0.0842)    (0.0815)      (0.0823)     (0.0816)      (0.0817)
% Collateral rated by   0.0615      0.1056      0.0075        0.0687       0.0501        0.1073
S&P                     (0.1372)    (0.1160)    (0.1272)      (0.1032)     (0.1363)      (0.1225)
                        -0.3176     -0.2907     -0.2531       -0.4059+     -0.2941       -0.3095
% Subprime              (0.2092)    (0.2374)    (0.2215)      (0.2326)     (0.2057)      (0.2366)
                        -0.0096     0.1498      0.0614        0.1395       0.0014        0.1353
% Alt-A Fixed Rate      (0.2092)    (0.1910)    (0.2316)      (0.1978)     (0.2076)      (0.1985)
                        -0.0818     -1.5674*    0.0600        -0.8442      -0.1422       -1.5358**
% Alt-A ARM             (0.3111)    (0.6014)    (0.3295)      (0.6402)     (0.3003)      (0.5424)
                        0.0766      0.2269      0.1374        0.2247       0.0823        0.1961
% CDO                   (0.2472)    (0.1548)    (0.2552)      (0.1601)     (0.2426)      (0.1572)
                        -0.3153     -0.2106     -0.2601       -0.2372+     -0.3104       -0.2393
% Prime RMBS            (0.2056)    (0.1417)    (0.2122)      (0.1388)     (0.1993)      (0.1403)
                        0.1543      0.1562      0.2365        0.1678       0.2090        0.1698
% Midprime RMBS         (0.2003)    (0.1568)    (0.2044)      (0.1641)     (0.1932)      (0.1541)
                        0.3001      0.3372      0.3010        0.2683       0.2841        0.2860
% CES RMBS              (0.2646)    (0.2768)    (0.2751)      (0.2703)     (0.2592)      (0.2716)
                        0.4927      -0.9796     0.8706        -0.6648      0.7884        -0.4542
% HELOC                 (1.8882)    (1.8946)    (1.8050)      (1.8893)     (1.8900)      (1.8660)
                        -0.7043+    -0.0314     -0.6561+      -0.0702      -0.7080+      -0.0780
% CMBS                  (0.3494)    (0.2656)    (0.3503)      (0.2658)     (0.3459)      (0.2761)
                        -1.2661**   -1.1220+    -1.1627**     -1.1630**    -1.2732**     -1.1413+
% CLO                   (0.2415)    (0.6363)    (0.2099)      (0.3399)     (0.2333)      (0.6315)
                        -0.0638     -0.0727+    -0.0540       -0.0625      -0.0615       -0.0691+
% Fixed Rate            (0.0400)    (0.0406)    (0.0404)      (0.0405)     (0.0401)      (0.0401)
                        0.0665      0.0745      0.0704        0.0790       0.0643        0.0743
% Synthetic             (0.0798)    (0.0686)    (0.0789)      (0.0679)     (0.0797)      (0.0689)
% 2006-vintage          0.3297**    0.3590**    0.3307**      0.3526**     0.3251**      0.3425**
collateral              (0.0371)    (0.0894)    (0.0366)      (0.0986)     (0.0375)      (0.0898)
% 2007-vintage          0.3919**    0.4206**    0.3999**      0.4162**     0.3827**      0.4202**
collateral              (0.0839)    (0.1192)    (0.0773)      (0.1037)     (0.0851)      (0.1181)


                                                85
M (1)      M (2)               F (1)          F (2)         SP (1)       SP (2)
Dependent Variable:     Default      Default      Default              Default      Default       Default
                        -0.1240**    -0.1456**    -0.0951*             -0.1452**    -0.1290**     -0.1511**
IYear2005               (0.0386)     (0.0521)     (0.0352)             (0.0289)     (0.0390)      (0.0538)
                        -0.1560**    -0.1898**    -0.1179**            -0.1823**    -0.1552**     -0.1891**
IYear2006               (0.0405)     (0.0523)     (0.0375)             (0.0328)     (0.0409)      (0.0539)
                        -0.1030+     -0.1339+     -0.0673              -0.1286*     -0.1061+      -0.1356+
IYear2007               (0.0533)     (0.0676)     (0.0515)             (0.0531)     (0.0530)      (0.0695)
                        0.0164       -0.0493      -0.0119              0.0311       0.0394        0.0014
Intercept               (0.2324)     (0.1817)     (0.2289)             (0.1851)     (0.2252)      (0.1872)
Interaction Variables
% 2004-vintage                       -0.0148                           -0.0110                    -0.0098
collateral*x            -            (0.0151)     -                    (0.0148)     -             (0.0153)
% 2005-vintage                       0.0211+                           0.0275*                    0.0281*
collateral*x            -            (0.0119)     -                    (0.0120)     -             (0.0119)
% 2006-vintage                       0.0103                            0.0163                     0.0181
collateral*x            -            (0.0181)     -                    (0.0200)     -             (0.0188)
% 2007-vintage                       0.0051                            0.0141                     0.0075
collateral*x            -            (0.0290)     -                    (0.0245)     -             (0.0279)
                                     0.0314                            0.0467+                    0.0324
% Subprime*x            -            (0.0251)     -                    (0.0251)     -             (0.0263)
                                     0.2739**                          0.1875+                    0.2376**
% Alt-A ARM*x           -            (0.0915)     -                    (0.1020)     -             (0.0693)
                                     -0.0802**                         -0.0789**                  -0.0817**
% CMBS*x                -            (0.0207)     -                    (0.0215)     -             (0.0213)
                                     0.0040                            0.0146                     0.0010
% CLO*x               -              (0.0632)     -                    (0.0296)     -             (0.0605)
Regression Summary Statistics
Adj. R2                     0.6784       0.7027               0.6739       0.6969        0.6785          0.7025
SER                         0.1625       0.1562               0.1636       0.1577        0.1624          0.1563
n                              430          430                  430          430           430             430


                                                      86
Panel B: The relationship between AAA losses and initial tranche credit ratings

This table looks at the relationship between the amount and number of AAA tranches given to a
 CDO by each by each of the three CRAs (M/F/SP) and the potential AAA tranche losses. The
 dependent variable (loss) is defined as the % of defaulted assets minus the current amount of
 AAA subordination. Standard errors, clustered by CDO underwriter, are shown in parentheses
 under estimated coefficients. Coefficients are significant at the +10%, *5%, **1% significant
                                              level.

            Dependent Variable                 Loss (M)               Loss (F)            Loss (SP)
                                          0.2883+                0.3388               0.2043
      M or F or SP %AAA                   (0.1417)               (0.2635)             (0.1262)
                                          0.0412**               0.0689*              0.0441**
      M or F or SP # AAA Tranches         (0.0079)               (0.0243)             (0.0078)
                                          -3E-05*                -0.0001              0.0002**
      Original Balance                    (0.0000)               (0.0001)             (0.0001)
                                          0.0003+                0.0004               0.0000
      Number of assets                    (0.0002)               (0.0003)             (0.0001)
                                          -0.0071                -0.0101              -0.0066
      Number of Tranches                  (0.0059)               (0.0075)             (0.0060)
                                          0.0216**               0.0029               0.0278**
      Average initial collateral rating   (0.0062)               (0.0183)             (0.0052)
                                          0.0270**               -0.0306              0.0231*
      WAC                                 (0.0093)               (0.0202)             (0.0083)
                                          0.1979                 0.0068               0.2072+
      % Subprime                          (0.1325)               (0.1114)             (0.1109)
                                          0.3187                 0.6366**             0.1697
      % Alt-A Fixed Rate                  (0.2139)               (0.1400)             (0.1743)
                                          0.5894**               -1.1181*             0.7328**
      % Alt-A ARM                         (0.1908)               (0.4492)             (0.1867)
                                          0.5497**               -0.0469              0.5463**
      % CDO                               (0.1340)               (0.3654)             (0.1137)
                                          0.1759                 0.0357               0.1108
      % Prime RMBS                        (0.1355)               (0.1239)             (0.0876)
                                          0.5048**               0.5547**             0.4760**
      % Midprime RMBS                     (0.1072)               (0.1552)             (0.1079)
                                          0.5730+                0.0325               0.5639*
      % CES RMBS                          (0.2865)               (0.4032)             (0.2207)
                                          -0.3777                -1.8354              -0.6061
      % HELOC                             (1.0480)               (1.4551)             (0.7254)
                                          -0.1777                0.4522               -0.2195
      % CLO                               (0.1559)               (1.2401)             (0.1356)
                                          0.2193                 0.0514               0.1850
      % CMBS                              (0.1960)               (0.2156)             (0.1870)
                                          0.2562**               0.3418**             0.2373**
      % 2006-vintage collateral           (0.0430)               (0.0869)             (0.0404)
                                          0.2347**               0.0701               0.2018*
      % 2007-vintage collateral           (0.0750)               (0.2215)             (0.0744)
                                          0.0221                 0.0857               -0.0084
      % Synthetic                         (0.0385)               (0.0743)             (0.0300)
                                          -0.0066                -0.2389**            0.0006
      % Fixed Rate                        (0.0362)               (0.0766)             (0.0345)
      Intercept                           -0.8017**              -0.2588              -0.7957**
      Regression Summary Statistics
      Adj. R2                                         0.5548                0.5854                0.5756
      SER                                             0.1513                0.1298                0.1469
      n                                                    384                   85                   401


                                                      87
Table 14: Explaining the Rating Agency’s Mistakes
                      Panel A: Mistakes due to general CDO Characteristics

 This table looks at the factors explaining the difference in the probability of default predicted by
the initial collateral ratings of CDO assets given by each agency and the actual default rate (M, F,
  and S&P difference). The regressions use only CDOs from the high-information sample with
n=430. Standard errors, clustered by CDO underwriter, are shown in parentheses under estimated
         coefficients. Coefficients are significant at the +10%, *5%, **1% significant level.

             Dependent Variable           M Difference       F Difference      S&P Difference
                                       -3E-05             -3E-05              -2E-05
       Original Balance                (0.0000)           (0.0000)            (0.0000)
                                       0.0004             0.0004+             0.0004
       Number of assets                (0.0002)           (0.0002)            (0.0002)
                                       -0.2982**          -0.2829**           -0.2929**
       % Collateral rated by Fitch     (0.0809)           (0.0807)            (0.0821)
                                       0.2063**           0.1911*             0.1855**
       % Collateral rated by Moody's   (0.0607)           (0.0698)            (0.0647)
                                       0.0914             0.0545              0.0823
       % Collateral rated by S&P       (0.1330)           (0.1238)            (0.1306)
                                       0.0358*            0.0299*             0.0366*
       Moody or Fitch or S&P           (0.0142)           (0.0126)            (0.0148)
                                       0.0011             0.0014              0.0010
       WAC                             (0.0093)           (0.0094)            (0.0095)
                                       -0.3139            -0.2404             -0.2941
       % Subprime RMBS                 (0.2166)           (0.2233)            (0.2132)
                                       -0.0036            0.0602              0.0061
       % Alt-A Fixed Rate              (0.2098)           (0.2188)            (0.2095)
                                       -0.1161            -0.0072             -0.1618
       % Alt-A ARM                     (0.3094)           (0.3086)            (0.3055)
                                       0.1150             0.1942              0.1225
       % CDO                           (0.2510)           (0.2569)            (0.2487)
                                       -0.3154            -0.2500             -0.3112
       % Prime RMBS                    (0.2097)           (0.2138)            (0.2054)
                                       0.1766             0.2664              0.2270
       % Midprime RMBS                 (0.2066)           (0.2080)            (0.1985)
                                       0.2862             0.3194              0.2724
       % CES RMBS                      (0.2807)           (0.2813)            (0.2778)
                                       0.5213             0.9819              0.7918
       % HELOC                         (1.7991)           (1.6962)            (1.7717)
                                       -1.2791**          -1.1854**           -1.2864**
       % CLO                           (0.2559)           (0.2204)            (0.2482)
                                       -0.7035+           -0.6454+            -0.7081+
       % CMBS                          (0.3569)           (0.3551)            (0.3554)
                                       -0.0622            -0.0547             -0.0603
       % Fixed Rate                    (0.0392)           (0.0397)            (0.0392)
                                       0.0667             0.0706              0.0658
       % Synthetic                     (0.0800)           (0.0804)            (0.0805)
                                       0.3339**           0.3311**            0.3298**
       % 2006-vintage collateral       (0.0331)           (0.0332)            (0.0339)
                                       0.3677**           0.3606**            0.3607**
       % 2007-vintage collateral       (0.0894)           (0.0890)            (0.0913)
       Intercept                       0.0764             0.0687              0.0982
       Regression Summary Statistics
       Adj. R2                                   0.6748              0.6727             0.6766
       SER                                       0.1624              0.1634             0.1627


                                                 88
Panel B: Effect of CDO Underwriter on CRA Mistakes

 This table examines whether the identity of the underwriter affected the accuracy of credit
  ratings. The regressions are identical to those in Panel A with the addition of fixed effect
 dummies for the identity of the CDO underwriter. The data are sorted according to average
   ranking, with lower numbers corresponding to fewer credit rating mistakes. Estimated
coefficients, shown in parentheses under the ranking, are significant at the +10%, *5%, **1%
                                       significant level.
                                  Average                                       S&P
     Underwriter                             M Difference    F Difference
                                   Rank                                      Difference
     Lehman Brothers                 1             1*              1*            1*
                                               (-0.0713)       (-0.0813)     (-0.0756)
     Goldman Sachs                   2             2+              2*            2*
                                               (-0.0540)       (-0.0422)     (-0.0468)
     Dresdner Bank                   3              3              3*            3+
                                               (0.0002)        (-0.0070)     (-0.0006)
     Barclays Capital                4              4               4            4+
                                               (0.0098)        (0.0090)       (0.0164)
     Credit Suisse                   5              6               6             5
                                               (0.0269)        (0.0273)       (0.0287)
     UBS                             6              5             7**            6**
                                               (0.0266)        (0.0294)       (0.0297)
     Bank of America                 7              7              5*            7*
                                               (0.0312)        (0.0250)       (0.0319)
     Citigroup                       8             8+               8             8
                                               (0.0416)        (0.0491)       (0.0438)
     Wachovia                        9             9+             9**            9**
                                               (0.0435)        (0.0559)       (0.0475)
     RBS                            10            10*            10**           10**
                                               (0.0609)        (0.0611)       (0.0613)
     Calyon                         11            11+              11            11
                                               (0.0622)        (0.0699)       (0.0624)
     Merrill Lynch                  12           12**            12**           12**
                                               (0.0677)        (0.0727)       (0.0690)
     Deutsche Bank                  13           13**              14            13
                                               (0.0876)        (0.0943)       (0.0884)
     Bear Stearns                   14           14**              13            14
                                               (0.0931)        (0.0926)       (0.0938)
     Morgan Stanley                 15           15**            15**           15**
                                               (0.1306)        (0.1372)       (0.1369)
     WestLB                         16           16**            16**           16**
                                               (0.1995)        (0.1927)       (0.2024)
     JP Morgan                      17           17**             17*            17*
                                               (0.2092)        (0.2086)       (0.2127)


                                             89
Table 15: Potential Conflicts of Interest at the Rating Agencies
   This table looks at whether ratings were affected by the amount of business done with the
underwriter. The coefficients are shown for the amount ($mm) of the underwriter’s CDOs rated
by the CRA (“Balance”). The regressions specifications are: for (1) - (2) (4) and (6) in Table 11;
     for (2) – Table 12 panel A; for (3) – Table 13 Panel B; and for (4) – Table 14, panel A.
                        Coefficients are significant at +10%, *5%, **1%.
                                (1)                (2)              (3)              (4)
     Dependent Variable   % AAA (M/F/SP)   Downgrades (M/F/SP)   AAA Loss    P.D. Diff (M/F/SP)
     Balance Moody's      6E-08            9E-06+                5E-07+      5E-07
     Balance Fitch        3E-07            -                     -5E-07      -1E-06
     Balance S&P          8E-08            1E-05**               5E-07+      9E-07*


5. Discussion: What caused the CDO Market Meltdown?

        While surely not the whole story, the results in Section 4 offer insights into the

CDO market meltdown, illustrating the factors that caused adverse CDO performance

and highlighting the role of various market participants. Table 16 summarizes the major

findings from the regression results. First, adverse CDO performance resulted primarily

from the inclusion of low quality collateral originated in 2006 and 2007. The worst of

these assets were the mezzanine (BBB-rated) tranches of residential mortgage securities

backed by borrowers with poor credit, most specifically the Alt-A adjustable-rate

mortgages. While this finding is not surprising, it is a stark illustration of the

consequences of the excessive (and sometimes fraudulent) mortgage lending that

occurred in 2006 and 2007 – lending that first fueled, but ultimately destroyed CDOs.

The high level of CDO complexity helped to hide the true credit quality (or lack thereof)

of these assets from investors, encouraging the production of even more bad assets to

satiate the CDO feeding frenzy.


                                               90
Table 16: Summary of Important Results
       This table summarizes the main findings of the regressions presented in Section 4.


                                   **Effects of CDO Properties**

   Result                          Explanation                              Possible Interpretations
 CDO Assets
                Increased defaults in CDOs with high levels of         Negative house-price appreciation
"The Housing
                subprime and Alt-A ARM RMBS, most significant          and decline in underwriting
  Effect"
                for Alt-A ARM                                          standards produced more defaults
                Increased defaults in CDOs with collateral             Decline in underwriting standards;
"The Vintage
                originated in 2006 and 2007; magnitude outweighs       originated at peak of credit boom
  Effect"
                the "housing effect"                                   (had farthest to fall)
   "The         Consistently higher defaults in CDOs with more         Complexity decreased
 Complexity     assets; less consistent association of increased       transparency hiding bad assets and
  Effect"       defaults with synthetic and CDO collateral             hindering risk assessments
 Liabilities
                                                                       Smaller deals created from bank's
 Transaction    Smaller CDO deals associated with more                 left-over reject assets; small deals
    size        downgrades                                             created by inexperienced
                                                                       underwriters
                For a given rating, thinner tranches associated with   Thin tranche more likely to be
Tranche size
                more downgrades                                        wiped out by single asset defaults
Subordination   For a given rating, tranches with lower amounts of     Less credit support exposes bond-
    levels      subordination experience more downgrades               holder to more of the asset losses

                                          **Underwriters**

   Result                          Explanation                                   Interpretation
                                                                       Underwriters varied in ability,
"Underwriter    CDO performance varies across underwriters, after
                                                                       level of due diligence, and
  effect"       controlling for asset and liability properties
                                                                       philosophy
                Banks with larger market share of CDO
                                                                       Overly aggressive underwriters
"Size effect"   underwriting produce CDOs with worse
                                                                       had less time for each transaction
                performance
                Identity of most RMBS originators not important in     CLTV, FICO, DTI, and other
 "Originator
                explaining defaults after controlling for mortgage     borrower characteristics more
   effect"
                characteristics                                        important than originator "ability"
"Asymmetric                                                            Different balance of adverse
                Effect of using in-house assets as CDO collateral
 Information                                                           selection and moral hazard vs.
                depends on the specific bank
   Effect"                                                             reputation incentives among banks
                Write-downs best explained by the amount of            The market dried up and 2007
 Writedowns
                CDOs underwritten in 2007                              CDOs could not be sold


                                                  91
**Credit Ratings**

  Result                           Explanation                                    Interpretation
 "Recycled
                Most important determinant of original CDO ratings     No incentive to re-rate underlying
  ratings
                were ratings of the underlying assets                  collateral
  effect"
                                                                       Due diligence increased by more
   "Peer        CDOs rated by more agencies were given less AAA
                                                                       agency ratings; Fitch only rated
  Pressure      in general, but effect limited to addition of Fitch
                                                                       deals rejected by Moody's/S&P
  Effect"       rating
                                                                       which were inherently inferior
 "Seniority     More senior CDO tranches faced most severe             Initial level of optimism was most
  effect"       downgrades for a given level of CDO defaults           inflated for AAA tranches
                                                                       Ratings did not fully capture all
"Asset-class    The meaning of a single credit rating grade varies
                                                                       information about the risk of a
  Effect"       with asset type
                                                                       security
  "Super-                                                              AAA bondholders in CDOs with
                AAA losses are positively associated with a higher
   senior                                                              super seniors are not the first in the
                number of initial AAA tranches
   effect"                                                             waterfall priority
                No strong evidence that credit ratings were affected   Primary reasons for rating agency
"Conflicts of
                by the amount of fees brought by the CDO               problems not associated with fee
 interest"
                underwriter                                            system
Uniformity                                                             High reliance on software that
                Original CDO ratings showed little variation despite
of original                                                            banks learned to manipulate to give
                variation in asset types and underwriter quality
  ratings                                                              desired results
                Accuracy of defaults predicted by original credit
 Prediction                                                            Little information contained in
                rating depends on realized CDO performance since
   power                                                               original CDO credit ratings
                original ratings were very similar


        Second, not all CDO underwriters were equally responsible for the problems in

the CDO market. Controlling for observable CDO asset and liability properties, it is clear

that CDO performance was as much a product of the underwriting bank as it was the type

of collateral. This means that even for CDOs with identical amounts of 2007, BBB, Alt-A

RMBS, there was consistent variation in performance associated with the identity of the

underwriter, most significant for the best and worst CDO underwriters. Some of the

variation in underwriter quality is associated with the bank’s market share in

underwriting CDOs, with the most prolific underwriters on average producing worse

CDOs. Another source of underwriter variation might be the level of sophistication used


                                                    92
to distinguish among superficially identical securities with the same rating, vintage, and

asset class, perhaps by selecting higher quality originators. However, better originator

selection, at least with respect to RMBS collateral, is not enough to explain all the

variation amongst CDO underwriters. The best and worst CDO underwriters used mostly

the same RMBS suppliers for their CDOs; furthermore, the quality of RMBS assets is not

highly correlated with the identity of specific originators after controlling for observable

mortgage characteristics. It is also possible that underwriter quality is linked to the use of

collateral that was originated by the underwriting firm, collateral for which the

underwriter would likely have an informational advantage. Overall though, the effects

associated with the use of in-house CDO collateral are inconsistent, leading to worse

performance for some banks’ CDOs and better performance for others. While the causes

of variation amongst CDO underwriters are unclear, the “underwriter effect” is most

likely a combination of the bank’s ability, effort, and overall philosophy used to structure

and select assets for its CDOs.

       Lastly, credit ratings failed to capture the true amounts of risk associated with

different CDOs. There was a pronounced lack of variation in original CDO ratings, with

most transactions awarded similar amounts of AAA, despite differences in the asset and

liability characteristics and the identity of the underwriter. Initial CDO ratings had little

relationship to the type or vintage of the collateral or the quality of the underwriter,

despite the fact that this information has proved important in explaining ex-post CDO

performance. This lack of variation was most likely a result of the rating agencies’ over-

reliance on computer models. The investment banks were given access to the software

used by the rating agencies, and became skilled at selecting collateral that would give the


                                              93
highest amount of AAA possible. Presumably, underwriters found ways to garner similar

ratings for a multitude of CDOs by manipulating certain modeling inputs, most easily the

correlation number. The realized accuracy of the original credit ratings is a direct result

of the realized performance of the CDO; since most CDOs were initially treated equally,

only the highest quality CDOs have performed as predicted by their initial credit ratings.

The errors of the rating agencies stemmed from neither conflicts of interest nor

preferential treatment given to certain banks. The true culprit behind the rating agencies’

failure was the outsourcing of credit analysis to computer models and the low level of

human input used to rate CDOs.

       Using the anecdotal and empirical evidence presented in this paper, I offer the

following interpretation of the CDO market meltdown. CDOs were flawed from the

outset, used too often as a junkyard for risky and substandard assets. CDOs survived

because of changes in the credit markets that produced an excess quantity of these assets

and herds of investors hungry for higher yields. The first CDO underwriters entered the

market before the peak of the credit boom, and many of their CDOs performed poorly.

For instance, JP Morgan’s CDOs, 80% of which were issued before 2005, showed the

greatest underperformance among the top CDO underwriters. However, JP Morgan

virtually exited the CDO market in 2005, possibly disheartened by its first failed

creations. In contrast, for banks that discovered CDOs post-2005, the situation was

markedly different. The U.S. was experiencing an unprecedented housing boom, kindling

the belief that home prices would rise indefinitely, a belief which in turn incited the

creation of previously unimaginable types of high-yielding mortgage loans. These new


                                             94
mortgages provided the perfect raw material for CDOs, intoxicating underwriters and

rating agencies with record profits.

        The marriage of the CDO and subprime was thus consummated and Wall Street

became inextricably linked with the riskiest homebuyers in America. In 2006, Merrill

Lynch, Citigroup, and Bear Stearns plunged headfirst into the CDO business, loading up

on the steady supply of questionable mortgages coming from a milieu of mortgage

brokers located mostly in Orange County California (prime among them the now defunct

lending giant Countrywide). The CDOs manufactured in 2006 and 2007 were in large

part a direct manifestation of their ingredients - pools of tainted assets precariously

situated atop a wave of home-price appreciation. As investors became addicted to the

higher yields of investment-grade CDOs, their rose-colored glasses focused on the AAA

rating rather than the pool of shoddy subprime mortgages they were really buying. The

rating agencies put too much faith in their formulas, conveniently forgetting that a model

is only as good as its inputs. Since there was little historical data on subprime or CDO

performance, especially during times of economic distress, the inputs were essentially

pulled from thin air, adjusted by the underwriters to maximize their AAA allotment.

“Diversification” was the magic word that could justify the inclusion of anything

remotely resembling a legitimate fixed-income asset, as Wall Street and the rating

agencies claimed that even the lowest quality bonds would not all default at the same

time.

        However, that is exactly what happened. The trillion-dollar CDO market, built

atop a single assumption, crumbled to ruins when house prices did the impossible: they

first stopped rising and then they fell. In the end, who was hurt worst when the CDO


                                             95
market crashed had less to do with what they were doing than with when they were doing

it. The best predictor of banks’ write-downs was not the quality of their CDOs, but

instead the amount of CDOs they issued in 2007, for very few of these CDOs would ever

leave the balance sheets of their creators. The CDO market was a game of musical chairs

and the winners were those who sat down early on. The losers were those that lived by

the philosophy of Citigroup’s ex-CEO, Charles Prince, that, “as long as the music is

playing, you’ve got to get up and dance.” Unfortunately, certain players in the CDO

market, including Merrill Lynch, Citigroup, Bear Stearns, Countrywide, S&P, and

Moody’s, were having too much fun to notice when the music ended, never pausing from

their CDO craze for long enough to see the warning signs develop.

       Once the conveyor belt stopped, it turned out that the hot potato, which had so

efficiently been passed along the chain from mortgage broker to Wall Street and beyond,

had been leaving pieces of itself along the way. Once investors no longer wanted to buy

CDOs, Wall Street banks were left holding the excess of unsold CDOs and yet-to-be-

securitized CDO assets. And once Wall Street CDOs no longer wanted to buy subprime

mortgages, mortgage originators were left holding a huge number of mortgage loans they

knew had little chance of ever being repaid. And once mortgage companies no longer

wanted to originate risky mortgages, homebuyers were left holding the subprime

mortgages they had planned to refinance. And once homebuyers began to default on their

mortgages in mass, it became clear that the credit rating agencies had made a colossal

mistake, and Moody’s, Fitch, and S&P were left holding the burden of a shattered

reputation in a business built on the necessity of trust.


                                              96
While the story of this collapse is now familiar to many, the details of the CDOs

behind it are still becoming known. The empirical analysis of this paper has served to

elucidate the factors that contributed to the collapse of the CDO market, many of which

were already presume to be true, but some of which were not fully understood. At the

broadest level, we can say that the CDO was killed by excess. The excess of complexity,

the excess of subprime, the excess of bets on subprime using credit default swaps, the

excess of AAA ratings, the excess of bad mortgages, even the excess of wealth – all

contributed to the creation of CDOs preordained to a future of adverse performance. At

this point, perhaps the only question that really matters is what to do with the remains of

these excesses that are slowly poisoning the world economy.

        The key to cleaning up the CDO mess is to unravel the layers of complexity to the

point at which investors can once again make informed risk assessments; until there is

increased transparency, investors will assume everything to be worth zero. This paper has

begun the process, documenting the composition of ABS CDOs and evaluating their

performance, but it looks only at broad asset classes and vintages. Given that almost all

of the problem CDOs were composed of 2006/2007-vintage RMBS and CDO collateral,

the analysis needs to go a step further, conducting detailed analysis of the individual

securities inside the CDOs. At this time, few investors have the resources or incentives to

undertake this grueling ordeal.68 Many market participants have suggested that the

government create an aggregator bank, the so-called “bad-bank” structure, to buy the

CDOs and then sell their assets individually.69 This may be the best option, as few


68
   However, it is rumored that certain hedge funds are once again becoming interested in purchasing CDO
and RMBS assets, whose quality might be low, but whose prices are even lower. As the dust settles, more
investors will find ways to spot deals amongst these disfavored assets.
69
   See Appendix D for one such proposal.


                                                   97
investors will ever feel confident in computer models or their own ability to properly

value a CDO. 70


6. Conclusions

        In this paper, I have used empirical data to illuminate some of the causes of the

CDO market collapse. The results show that problems in the CDO market arose from a

combination of poorly constructed CDOs, irresponsible underwriting practices, and

flawed credit rating procedures. One of the main factors associated with the

underperformance of CDOs was the inclusion of low quality collateral originated in 2006

and 2007 that was exposed to the residential housing market. The majority of CDOs

issued after 2005 contained remarkably high levels of this collateral, allowing the decline

in housing prices to cause a rapid deterioration in the financial health of CDOs. Second,

the CDO underwriters played an important role in determining CDO performance, even

after controlling for the asset and liability characteristics of their CDOs. The unobserved

causes for this underwriter effect might be the ability, diligence, or philosophy of the

underwriting bank. Lastly, the credit ratings of CDOs failed in their stated purpose,

namely to provide a reflection of the CDO’s ability to make timely payments of principal

and interest. This failure arose from a combination of over-automation and heavy reliance

on inputs whose accuracy was not easily judged.

        While the findings of this paper begin to sort through the wreckage of the CDO

market, much more analysis is warranted in order to fully understand the causes of this

profound event in financial history. My preliminary investigation into CDOs has


70
  In an interview with David Faber in the CNBC documentary, “House of Cards,” Alan Greenspan
admitted that he did not fully comprehend CDOs.


                                                98
unearthed far more questions than it has answered: 1) What explains the variation in

performance found among superficially identical assets within the CDOs, assets that

carried the same vintage, rating, and underlying collateral?; 2) Was the “underwriter

effect” due to the ability, technology, diligence, or philosophy of the underwriter, or

something else altogether?; 3) What explains the elimination of Fitch from the CDO

rating business, and was it related to the apparent conservatism of its ratings?; and lastly,

4) What allowed a relatively arcane market to grow to such proportions that it was able to

contribute to the loss of billions of dollars and the destruction of large financial

institutions?

       The CDO may be unequivocally dead, but answering these questions is

nevertheless important. While the collateralized debt obligation will not be the cause of

another financial maelstrom, it is likely that the same combination of market

imperfections, misaligned incentives, and human excesses that spawned this financial

monster will not disappear. By understanding the story of the CDO market meltdown, we

can develop more effective regulatory and economic practices to prevent history from

repeating.


                                              99
Bibliography


Adelson, Mark (2006), “Bond Rating Confusion.” Nomura Fixed Income Research, June
29, 2006.

Adelson, Mark, and D. Jacob (2008), “The subprime problem: causes and lessons.”
January 8, 2008.

An, Xudong, et. al. (2006), “Subordinations Levels in Structured Financing.” University
of California at Berkeley, August 15, 2006.

Benmelech, Efraim and Jennifer Dlugosz (2008), “The Alchemy of CDO Credit
Ratings.” Harvard University and NBER.

Bethel, Jennifer, et. al. (2008), “Law and Economic Issues in Subprime Litigation.”
SSRN: Harvard John M. Olin Discussion Paper Series, March, 2008.

BIS Committee on the Global Financial System (2008), “Ratings in structured finance:
what went wrong and what can be done to address shortcomings?” Bank for International
Settlements, July 2008.

Bluhm, Christian (2003), “CDO Modeling: Techniques, Examples and Applications.
HypoVerinsbank, December 10, 2003.

Brennan, Michael J. et al. (2008), “Tranching and Rating.” SSRN,
http://ssrn.com/abstract=1108556, March 10, 2008.

Brunnermeier, Markus K. (2008), “Deciphering the Liquidity and Credit Crunch 2007-
08.” http://www.princeton.edu/~markus/, November 15, 2008.

Calomiris, Charles (2008), The Subprime Turmoil: What’s Old, What’s New, and What’s
Next.” Columbia Business School, August 20, 2008.

Coval, Joshua D. et. al. (2007), “Economic Catastrophe Bonds.” Working Paper, June
2007.

Coval, Joshua et. al. (2009), “The Economics of Structured Finance.” Harvard Business
School.

Deng, Yongheng et. al. (2008), “CDO Market Implosion and the Pricing of CMBS and
Sub-Prime ABS.” University of Southern California, April, 2008.

Drucker, S (2008), “Inside Information and Market Making in Secondary Mortgage
Markets.” Forthcoming, Review of Financial Studies.


                                          100
Fender, Ingo and John Kiff (2004), “CDO rating methodology: Some thoughts on model
risk and its implications.” BIS Working Papers, No. 163, November 2004.

Gan, Yingjin and Christopher Mayer (2006), “Agency Conflicts, Asset Substitution, and
Securitization.” Working Paper 12359, http://www.nber.org/papers/w12359, July 2006.

Garcia, Joao et. al. (2008), “Dynamic Credit Portfolio Management: Linking Credit Risk
Systems, Securitization and Standardized Credit Indices.” Dexia Bank, January 31, 2008.

Gibson, Michael S. (2004), “Understanding the Risk of Synthetic CDOs.” Federal
Reserve Board: Division of Research and Statistics, July 2004.

Gorton, Gary (2008), “The Panic of 2007.” NBER, August 25, 2008.

Griffin, John M. and Dragon Yongjun Tang (2008), “What Drove the Mismatch between
Initial CDO Credit Ratings and Subsequent Performance?” Working paper, University of
Texas.

Heitfield, Erik (2008), “Parameter Uncertainty and the Credit Risk of Collateralized Debt
Obligations.” Federal Reserve Board, working paper.

Jiangli, Wenying, and Matt Pritsker (2008), “The Impacts of Securitization on US Bank
Holding Companies.” SSRN, http://ssrn.com/abstract=1102284, March, 2008.

Kane, Edward (2008), “Regulation and Supervision: An Ethical Perspective.” NBER
Working Paper 13895, http://www.nber.org/papers/w13895, March, 2008.

Krahnen, Jan Pieter, and Christian Wilde (2005), “Risk Transfer with CDOs.” Goethe-
University, March 15, 2005.

Lowenstein, Roger (2008), “Triple-A Failure.” New York Times Sunday Magazine, April
22, 2008.

Mayer, Chris, Karen Pence, and Shane Sherlund (2008), “The Rise in Mortgage
Defaults.” The Federal Reserve Board: Finance and Economics Discussion Series,
November 20, 2008.

Mason, Joseph R. and Joshua Rosner (2007), “Where did the risk go? How Misapplied
Bond Ratings cause Mortgage Backed Securities and Collateralized Debt Obligation
Market Disruptions.” SSRN, http://ssrn.com/abstract=1027475, May 14, 2007.

Mian, Atif and Amir Sufi (2008), “The Consequences of Mortgage Credit Expansion:
Evidence from the 2007 Mortgage Default Crisis.” Working Paper 13936,
http://www.nber.org/papers/w13936, April 2008.


                                          101
Mitchell, Janet (2004), “Financial Intermediation Theory and the Sources of Value in
Structured Finance Markets.” National Bank of Belgium, December, 2004.

Muolo, Paul, and Mathew Padilla (2008). Chain of Blame: How Wall Street Caused the
Mortgage and Credit Crisis. Hoboken, N.J.: John Wiley & Sons, 2008.

Raynes, Sylvain, and Ann Rutledge (2003). The Analysis of Structured Securities,
Oxford University Press, 2003.

SEC (2008), “Summary Report of Issues Identified in the Commission Staff’s
Examinations of Select Credit Rating Agencies.” July 2008.

Tavakoli, Janet (2005), “Structured Finance: Rating the Rating Agencies.” GARP Risk
Review, Issue 22, January/February 2005.

U.S. Senate (2008), “Turmoil in U.S. Credit Markets: The Role of the Credit Rating
Agencies.” Testimony of Arturo Cifuentes before the Senate Committee on Banking,
Housing and Urban Affairs, April 22, 2008.

UBS (2008), “Shareholder Report on UBS’s Write-Downs,” April 18, 2008.


                                          102
Appendix A.1: Variable Definitions


**CDO-Level Variables**

Variable                  Description

General Characteristics

Year                      Year in which CDO was issued

Original CDO Balance      Original par amount of liabilities issued by CDO in millions of dollars

Current CDO Balance       Current par amount of outstanding liabilities issued by CDO in millions of
                          dollars
Original Collateral Par   Par amount of CDO collateral at time of issuance (before ramp-up) in
                          millions of dollars
Current Collateral Par    Par amount of CDO collateral as of December 2008 in millions of dollars

Number of assets          Number of assets held as collateral in CDO

Number of Tranches        Number of tranches issued by CDO

WAC                       Weighted average of tranche coupon payments

% AAA Subordination       Original amount of subordination for the AAA CDO tranche (as a % of total)

Collateral

% Fixed Rate              Percent of CDO collateral that pays fixed rate coupons

% Synthetic               Percent of CDO collateral that is synthetic (credit default swaps)

% HEL                     Percent of total CDO collateral made up of tranches of residential mortgage-
                          backed securities (RMBS) backed by home equity loans (equivalent to
                          subprime)
% RMBS                    Percent of total CDO collateral made up of tranches of residential mortgage-
                          backed securities (RMBS) backed by all mortgages not classified as home
                          equity loans

% CMBS                    Percent of total collateral made up commercial mortgage-backed securities

% CDO                     Percent of total CDO collateral made up of other CDO’s tranches

% Alt-A Fixed Rate        Percent of total CDO collateral made up of tranches of residential mortgage-
                          backed securities (RMBS) backed by Alt-A fixed rate mortgages
% Alt-A ARM               Percent of total CDO collateral made up of RMBS tranches backed by Alt-A
                          adjustable rate mortgages
% Prime                   Percent of total CDO collateral made up of RMBS tranches backed by prime
                          mortgages
% Midprime                Percent of total CDO collateral made up of RMBS tranches backed by
                          midprime mortgages (FICO 625-700)
% Subprime                Percent of total CDO collateral made up of RMBS tranches backed by
                          subprime mortgages (FICO below 625)


                                               103
Variable                Description
% HELOC                 Percent of total CDO collateral made up of tranches from home equity line
                        of credit securitizations
% CLO                   Percent of total CDO collateral made up of tranches from collateralized loan
                        obligations
% CES                   Percent of total CDO collateral made up of RMBS tranches backed by
                        closed-end second lien mortgages
% Other                 Percent of total CDO collateral made up of tranches from other asset-backed
                        securities (including auto loans, credit cards, manufactured housing, etc.)
% 2006-vintage          Percent of total CDO collateral that was originated in 2006

% 2007-vintage          Percent of total CDO collateral that was originated in 2007

Credit Ratings

Original Fitch Rating   Weighted average original rating of CDO tranches by Fitch on a numeric
                        scale
Original S&P Rating     Weighted average original rating of CDO tranches by S&P on a numeric
                        scale
Original Moody Rating   Weighted average original rating of CDO tranches by Moody’s on a numeric
                        scale
Current Fitch Rating    Weighted average current rating of CDO tranches by Fitch on a numeric
                        scale
Current S&P Rating      Weighted average current rating of CDO tranches by S&P on a numeric
                        scale
Current Moody Rating    Weighted average current rating of CDO tranches by Moody’s on a numeric
                        scale
Fitch Downgrade         Weighted average of CDO downgrades by Fitch

S&P Downgrade           Weighted average of CDO downgrades by S&P

Moody Downgrade         Weighted average of CDO downgrades by Moody's

% AAA Fitch*            Average % AAA given by Fitch to CDOs; includes only those CDOs with at
                        least 75% of tranches rated by Fitch
% AAA S&P*              Average % AAA given by S&P to CDOs; includes only those CDOs with at
                        least 75% of tranches rated by S&P
% AAA Moody*            Average % AAA given by Moody's to CDOs; includes only those CDOs
                        with at least 75% of tranches rated by Moody's
% Rated Fitch           Percent of CDO tranches that were originally assigned a rating by Fitch

% Rated S&P             Percent of CDO tranches that were originally assigned a rating by S&P

% Rated Moody           Percent of CDO tranches that were originally assigned a rating by Moody’s

Performance

Fitch Default -P.D.     The difference in realized CDO asset defaults and the probability of default
                        given by original Fitch ratings
S&P Default -P.D.       The difference in realized CDO asset defaults and the probability of default
                        given by original S&P ratings
Moody’s Default -P.D.   The difference in realized CDO asset defaults and the probability of default
                        given by original Moody's ratings
EOD                     Dummy variable that is equal to 1 if the CDO experienced an event of
                        default as of May 2008
Default                 Percent of CDO collateral that has defaulted as of February 2008


                                             104
** Tranche-Level Variables**

Variable                       Description

Tranche #                      Number of tranche in capital structure

Coupon                         Fixed rate equivalent of tranche coupon payment as of December 2008

Original Balance               Original tranche balance in millions of dollars

Current Balance                Current tranche balance in millions of dollars

% of Transaction               Current tranche balance as a percent of all outstanding CDO liabilities

% Subordination                Current tranche subordination

**Other Variables**

Variable                       Description

Fitch Estimated P.D.           Cumulative probability of default predicted by asset's original Fitch rating,
                               according to matrix in Appendix C
S&P Estimated P.D.             Cumulative probability of default predicted by asset's original S&P rating,
                               according to matrix in Appendix C
Moody’s Estimated P.D.         Cumulative probability of default predicted by asset's original Moody's
                               rating, according to matrix in Appendix C
Originator Concentration       Average number of CDO assets originated by a single originator

FICO                           Average FICO score for all mortgages securitized by the given originator
                               and vintage
CLTV                           Average combined loan to value score for all mortgages securitized by the
                               given originator and vintage
DTI                            Average debt-to-income ratio for all mortgages securitized by the given
                               originator and vintage
WALA                           Weighted average life off all mortgages in months

30-60d DQ                      Percent of loans that were either 30-day or 60-day past due as of October
                               2008
REO or FC                      Percent of loans that were real-estate owned or in foreclosure as of
                               October 2008
Cum. Loss                      Weighted average net cumulative loss on underlying collateral pools as of
                               October 2008
% HG                           Percent of CDOs classified as high grade; high grade CDOs are those
                               whose assets had an original weighted average rating factor of less than
                               180, otherwise classified as mezzanine
Write Down                     Total write-downs reported on ABS CDOs as of February 6, 2009, in
                               millions of dollars
WD/Assets                      Write Down divided by the total assets of the bank at year-end 2007


                                                  105
Appendix A.2: Summary Statistics

                                  Panel A: CDO Level Statistics


**General Characteristics**

                         High Information Sample                            Full Sample
Variable         Obs.   Mean     S.D.     Min    Max       Obs.   Mean        S.D.     Min    Max
Year             430    2005.97 0.75      2004   2007      735    2004.95     1.78     1999   2007
Original CDO     430    971.23   665.71 96       5000      735    829.44      682.63 57       6000
Balance
Current CDO      430    904       647.87   68       4976   735    741.28     682.83   28      6000
Balance
Original         430    969.57    659.72   0        4985   735    842.59     699.9    0       6920
Collateral Par
Current          430    1079.03   774.69   5        5701   735    874.28     819.46   5       6640
Collateral Par
Number of        430    152.17    62.24    34       366    735    150.42     86.81    1       552
assets
Number of        430    7.74      1.76     3        16     735    7.51       2.28     2       16
Tranches
WAC              430    2.79      1.2      0        6      735    3.12       1.34     0       10
% AAA            430    0.19      0.13     0        1      735    0.22       0.16     0       1
Subordination

**Collateral**

                          High Information Sample                           Full Sample
Variable         Obs.   Mean      S.D.     Min      Max    Obs.   Mean        S.D.     Min    Max
% Fixed Rate     430    36.73% 28.51% 0%            100%   735    43.10%      32.04% 0%       100%
% Synthetic      430    21.48% 26.91% 0%            100%   735    13.65%      23.55% 0%       100%
% HEL            430    -         -        -        -      735    33.04%      25.46% 0%       100%
% RMBS           430    -         -        -        -      735    13.21%      17.70% 0%       100%
% CMBS           430    4.12%     10.19% 0%         90%    735    6.75%       16.78% 0%       100%
% CDO            430    16.38% 19.76% 0%            100%   735    13.52%      20.08% 0%       100%
% Alt-A          430    3.51%     6.57%    0%       64%    -      -           -        -      -
Fixed Rate
% Alt-A          430    2.24%     4.12%    0%       44%    -      -          -        -       -
ARM
% Prime          430    9.37%     12.88%   0%       92%    -      -          -        -       -
% Midprime       430    30.01%    18.88%   0%       78%    -      -          -        -       -
% Subprime       430    25.37%    16.14%   0%       100%   -      -          -        -       -
% HELOC          430    0.14%     0.43%    0%       3%     -      -          -        -       -
% CLO            430    2.59%     9.05%    0%       66%    -      -          -        -       -
% CES            430    1.85%     3.22%    0%       18%    -      -          -        -       -
% Other          430    3.77%     7.95%    0%       73%    -      -          -        -       -
% 2006-          430    37.42%    28.97%   0%       100%   -      -          -        -       -
vintage
% 2007-          430    8.12%     13.41%   0%       83%    -      -          -        -       -
vintage


                                                106
**Credit Ratings**

                         High Information Sample                            Full Sample
Variable         Obs.   Mean     S.D.     Min    Max        Obs.   Mean       S.D.     Min     Max
Original Fitch   94     2.16     1.16     1.1    6.4        270    2.36       1.29     0       7.6
Rating
Original S&P     426    2.06     0.94     1        6.4      717    2.13      1.19     0.18     13.06
Rating
Original         406    2.04     0.93     1        5.5      681    2.13      1.11     0.18     13.06
Moody Rating
Current Fitch    94     2.16     1.15     1.1      6.4      268    2.8       2.15     1        15.88
Rating
Current S&P      428    14.27    6.05     1        22       715    10.85     7.08     1        22
Rating
Current          406    14.2     6.11     1.1      21       680    10.97     7.02     1        21
Moody Rating
Fitch            94     0        0        0        0        268    0.43      1.79     -0.3     13.9
Downgrade
S&P              426    12.23    6.01     -0.9     19.8     713    8.72      7.12     -2.4     19.8
Downgrade
Moody            406    12.15    6.02     -0.8     19.8     679    8.85      7.01     -2.3     19.8
Downgrade
% AAA            86     81.80%   8.70%    57%      96%      237    79.20%    9.10%    50.30%   97%
Fitch*
% AAA            408    82.60%   10.10%   52%      99%      665    81.60%    9.90%    50.30%   99%
S&P*
% AAA            389    82.80%   10.10%   52%      99%      632    81.70%    10.10%   50.30%   99%
Moody*
% Rated          430    17.70%   34.10%   0%       100%     735    30.00%    40.30%   0%       100%
Fitch
% Rated S&P      430    80.20%   14.00%   0%       100%     735    77.70%    20.10%   0%       100%
% Rated          430    76.90%   22.30%   0%       100%     735    74.10%    24.80%   0%       100%
Moody

**Performance**

                         High Information Sample                            Full Sample
Variable         Obs.   Mean     S.D.     Min    Max        Obs.   Mean       S.D.     Min     Max
Fitch            430    36.24% 28.57% -5.3% 99.60%          -      -          -        -       -
Default -P.D.                                               -      -          -        -       -
S&P              430    36.27%   28.61%   -5.1%    99.70%   -      -          -        -       -
Default -P.D                                                -      -          -        -       -
Moody’s          430    35.94%   28.48%   -5.1%    99.70%   -      -          -        -       -
Default -P.D
EOD              430    0.32     0.47     0        1        735    0.26      0.44     0        1
Default          430    37.60%   28.60%   0%       100%     735    26.50%    27.30%   0%       100%
Downgrade        430    11.77    6.01     -1       20       732    8.62      6.76     -1       19.86


                                                 107
Panel B: Tranche Level Statistics

Variable                                  Obs.         Mean     S.D.       Min     Max
Tranche #                                 5558         4.60     2.76       1       16
Coupon                                    4797         4.83%    2.5%       0%      30%
Original Balance                          5557         109.41   266.15     0       5400
Current Balance                           5558         97.88    256.74     0       5400
% of Transaction                          5558         13%      20%        0%      100%
% Subordination                           5551         15.97%   19.2%      0%      100%
Original Fitch Rating                     1685         5.11     3.85       1       15
Original S&P Rating                       4347         4.70     3.77       1       16
Original Moody’s Rating                   4123         4.62     3.72       1       16
Current Fitch Rating                      4161         14.27    7.45       1       21
Current S&P Rating                        4379         13.79    7.24       1       22
Current Moody’s Rating                    1685         5.57     4.51       1       21
Change in Fitch Rating                    4088         9.60     7.22       -7      20
Change in S&P Rating                      1685         0.46     2.07       -3      17
Change in Moody’s Rating                  4305         9.07     7.23       -6      21


                        Panel C: Individual Collateral Asset Statistics*

Variable                                  Obs.         Mean     S.D.       Min     Max
Original Fitch Rating                     27355        6.22     3.66       1       16
Original S&P Rating                       60672        5.99     3.35       1       16
Original Moody’s Rating                   59011        6.32     3.52       1       16
Current Fitch Rating                      26169        7.43     4.55       1       22
Current S&P Rating                        64018        6.86     4.19       1       22
Current Moody’s Rating                    62551        7.75     4.99       1       22
Fitch Estimated P.D.                      27158        1.35%    1.28%      0.02%   34.94%
S&P Estimated P.D.                        60313        1.23%    1.29%      0.02%   34.97%
Moody’s Estimated P.D.                    58673        1.46%    1.50%      0.02%   34.94%
Originator Concentration                  65394        466.97   431.61     1       1501
FICO                                      34131        625.50   14.00      570     670
LTV                                       34131        81.05%   1.95%      73.5%   87.5%
CLTV                                      34131        85.45%   3.46%      73.5%   93.4%
DTI                                       29952        40.51%   3.08%      28%     44%

* Based on CDOs from the high-information sample.


                                                 108
Panel D: CDO Underwriter Summary Statistics
         Originator     # of Assets   Avg. Asset R a t i n g % Fi x % Syn % HEL          % RMB S   % CMB S % CDO  % 2006 % 2007 D e f a u l t
      Bank of America         142                    4.89     31%     8%     33%             13%       11%    18%   39%     7%      28%
      Barclays                182                    2.84     22%     4%     30%             34%        8%    10%   51%     3%      16%
      Bear Stearns            125                    7.43     47%    30%     32%              9%        3%    12%   45%    14%      57%
      Calyon                  207                    5.13     37%    24%     36%             22%        3%    10%   56%     7%      45%
      Citigroup               179                    5.54     30%    20%     41%             11%        3%    19%   42%     8%      41%
      Credit S.               150                    5.49     36%    25%     30%             16%        2%    20%   42%    10%      38%
      Deutsche                126                    7.68     41%    23%     43%             17%        2%     7%   40%     6%      45%
      Dresdner                204                    2.60     10%     2%     46%             21%        2%    22%   33%     8%      21%
      Goldman                 166                    5.35     34%    10%     36%             13%       26%     8%   30%     3%      15%
      JP Morgan               118                    6.77     61%    52%     20%             12%        2%    26%   42%     3%      68%
      Lehman                  180                    6.55     26%    10%     43%             12%        7%    16%   42%     8%      35%
      Merrill                 218                    4.62     30%    19%     43%             18%        3%    15%   48%    13%      45%
      Morgan                  122                    8.01     49%    32%     36%             11%       10%     9%   34%     5%      52%
      RBS                     158                    6.16     64%    31%     37%             14%        5%    12%   40%     8%      37%
      UBS                     206                    7.72     47%    44%     32%             19%        4%     5%   30%     5%      38%
      Wachovia                171                    4.68     31%    15%     34%             18%        8%    10%   25%    11%      19%
      WestLB                  143                    2.71     34%     0%     30%             13%        8%    17%   23%    10%      19%
      small                   144                    3.27     10%     5%     30%             38%        1%    11%   45%    25%      24%
      unknown                 109                    4.74     50%    39%     14%              2%       20%    18%   56%    18%      38%


109
                                        Total      CDO                                                                                   WD/
                               # of                                   # of     Tranche             %                        Write
               Originator              Balance     Size    Coupon                        % AAA          E O D Downgrade                 Assets
                              CDOs                                  Tranches    Rating             HG                     Down ($mm )
                                       ($mm)      ($mm)                                                                                  (%)
            Bank of America   29      14,982     761.84    3.17     7.55       1.61      85%     56%    0%    13.75       9,089         0.53%
            Barclays          9       13,999     2041.14   3.26     6.97       2.40      93%     96%    45%   14.14       3,254         0.13%
            Bear Stearns      54      26,046     831.56    3.16     7.81       2.10      77%     20%    37%   12.97       2,300         0.58%
            Calyon            15      19,575     1602.78   2.69     8.72       1.79      87%     62%    47%   14.50       3,400         0.42%
            Citigroup         80      75,088     1583.38   2.75     7.74       2.37      87%     60%    68%   15.18       3,4106        1.56%
            Credit S.         63      34,808     944.74    2.72     6.89       1.86      85%     52%    40%   14.40       3,427         0.29%
            Deutsche          47      23,442     798.12    3.02     7.89       2.57      67%     14%    0%    12.02       2,092         0.07%
            Dresdner          7       8,882      1552.33   3.65     10.66      1.34      91%     100%   0%    14.94       1,604         0.29%
            Goldman           59      79,202     1760.99   2.55     8.98       2.36      75%     72%    5%    11.77       0             0.00%
            JP Morgan         10      5,558      756.12    3.00     7.35       2.53      82%     55%    82%   14.07       1,300         0.08%
            Lehman            30      21,627     1222.29   3.49     7.35       2.28      82%     35%    53%   15.42       200           0.03%
            Merrill           104     100,478    1504.75   3.03     8.39       1.54      89%     75%    44%   15.54       26,100        2.56%
            Morgan            20      12,983     849.44    2.57     8.39       2.62      78%     14%    60%   11.48       7,800         0.75%
            RBS               32      22,808     874.27    2.40     7.72       2.35      84%     42%    40%   15.18       3,609         0.10%
            UBS               45      32,651     1218.71   2.62     7.87       2.69      78%     16%    26%   13.15       21,870        1.08%
            Wachovia          49      36,810     1313.86   3.14     7.66       1.97      89%     81%    16%   10.09       1,860         0.24%
            WestLB            8       8,160      1096.39   2.94     5.91       2.60      88%     90%    0%    9.30        0             0.00%
            small             31      30,989     2224.06   3.19     7.62       1.70      91%     81%    25%   9.81        N/A           N/A
            unknown           43      41,551     1477.98   2.50     7.94       1.85      88%     71%    58%   13.63       N/A           N/A
Panel E.1: RMBS Originator Summary Statistics 1

Originator             Parent               Total      Total    WALA     30-60d    REO     Cum.
                                              #      Par ($m)              DQ     or FC    Loss
Aames Mortgage                             187      975         41.54    9.0%     25.3%   3.1%
ABFC                   Bank of America     1,121    7,122       42.41    4.2%     12.7%   2.3%
Accredited Mortgage                        417      2,293       35.78    5.1%     14.5%   2.6%
ACE                                        1,607    8,655       45.92    8.6%     27.6%   5.1%
Aegis                                      270      1,337       46.50    8.8%     19.1%   5.6%
Ameriquest                                 939      5,645       40.67    5.1%     17.9%   1.9%
Argent                 Citigroup           652      4,188       38.23    6.3%     31.9%   3.7%
BayView                                    379      1,255       69.84    5.5%     10.5%   5.0%
Bear Stearns                               2,342    13,716      45.00    7.0%     14.8%   5.2%
Carrington                                 694      4,439       41.75    8.3%     26.4%   1.5%
C-Bass                                     699      3,538       39.90    9.7%     17.9%   3.6%
Citigroup                                  1,194    8,335       37.75    6.2%     18.2%   7.4%
Countrywide            Bank of America     4,390    30,078      43.32    8.4%     12.9%   1.5%
Delta                                      201      1,059       35.61    10.0%    13.0%   1.9%
Deutsche Bank                              221      1,171       38.45    4.5%     12.5%   9.2%
DLJ Mortgage           Credit Suisse       772      4,324       41.91    10.0%    23.0%   3.1%
Encore                 Bear Stearns        169      1,059       34.12    8.4%     23.8%   2.3%
EquiFirst              Barclays            124      549         43.39    5.8%     21.8%   3.2%
Fieldstone                                 310      1,902                10.2%    29.1%   7.7%
First Franklin         Merrill Lynch       1,678    10,220      33.52    7.9%     23.8%   4.4%
Fremont                                    709      3,887       34.82    10.5%    29.8%   6.5%
Goldman Sachs                              1,837    12,330      36.45    9.3%     22.3%   4.7%
GSAA                   Goldman Sachs       553      3,187       39.66    5.5%     18.7%   1.5%
HarborView             RBS                 344      2,094       42.06    6.6%     16.1%   8.3%
HEAT                   Credit Suisse       1,837    11,436      181.39   3.2%     7.2%    5.0%
HSBC                                       500      2,855                6.6%     23.8%   7.9%
IndyMac                                    682      3,923       40.70    4.8%     5.1%    0.4%
Ixis                   Morgan Stanley      243      1,470                9.6%     40.7%   5.3%
JPMorganChase          JP Morgan           1,886    14,064      35.49    5.5%     12.3%   6.5%
Long Beach             Washington Mutual   1,293    8,197       35.47    7.8%     13.1%   4.0%
MASTR                  UBS                 1,184    6,059       62.83    4.7%     9.0%    4.5%
Merrill Lynch                              1,346    7,974       37.39    6.0%     16.1%   8.5%
Morgan Stanley                             3,224    18,273      44.94    6.7%     16.9%   4.8%
New Century                                821      5,390       42.58    7.2%     19.2%   2.3%
Nomura                                     570      2,977       38.78    7.3%     19.9%   8.4%
NovaStar                                   522      3,029       28.05    7.7%     17.5%   3.4%
Option One                                 547      2,774       36.20    6.9%     22.5%   3.1%
Other                                      15,084   103,938     57.80    6.6%     15.4%   5.7%
OWNIT                                      310      1,666                5.6%     9.3%    1.6%
Park Place                                 719      4,409       46.87    7.5%     19.1%   4.5%
Popular                                    343      1,632       22.21    6.9%     17.9%   3.7%
RALI                   GMAC                476      3,324       31.43    7.7%     13.6%   6.7%
RAMP                   GMAC                687      3,571       34.67    6.1%     15.4%   12.3%
RASC                   GMAC                1,024    5,601       37.97    8.4%     22.4%   6.8%
Residential Asset      GMAC                1,086    6,477       32.76    7.6%     18.0%   3.9%
SASCO                  Lehman Brothers     2,721    16,632      32.96    7.2%     18.6%   6.0%
Saxon                  Morgan Stanley      392      2,022       36.85    7.4%     21.9%   2.8%
Securitized ABR.       Barclays            916      5,476       38.58    6.4%     23.1%   4.6%
SoundView              RBS                 1,031    5,809       34.89    8.3%     23.1%   3.7%
Terwin                                     468      2,358       49.00    5.1%     11.2%   3.5%
UBS                                        180      1,544                0.1%     0.2%    0.0%
Wachovia                                   339      3,077       27.55    1.5%     3.9%    3.0%
Wells Fargo                                552      4,203       39.67    4.2%     5.4%    1.0%


                                              110
Panel E.2: RMBS Originator Summary Statistics 2

Originator            Parent              FICO    Com.     Sub     Mid     AltA    Orig      Avg.
                                                  LTV     prime   prime   ARM     Rating   Change
Aames Mortgage                            611     82     0.0%     0.0%    0.0%    7.2      2.9
ABFC                  Bank of America     648     86     10.4%    16.0%   0.0%    5.1      3.5
Accredited Mortgage                       631     85     92.9%    0.0%    0.0%    6.4      2.9
ACE                                                      37.0%    7.6%    22.7%   6.1      3.8
Aegis                                     618     83     100%     0.0%    0.0%    6.9      2.8
Ameriquest                                640     90     0.0%     100%    0.0%    6.0      0.9
Argent                Citigroup           617     86     100%     0.0%    0.0%    5.6      3.3
BayView                                                  100%     0.0%    0.0%    6.5      1.4
Bear Stearns                              618     85     36.3%    63.7%   0.0%    7.0      3.9
Carrington                                613     87     5.7%     83.6%   10.4%   7.6      2.0
C-Bass                                    634     80     0.0%     95.3%   0.0%    6.6      2.9
Citigroup                                                24.8%    54.6%   0.0%    5.8      2.9
Countrywide           Bank of America     606     83     100%     0.0%    0.0%    6.2      3.3
Delta                                     618     76     100%     0.0%    0.0%    5.7      1.1
Deutsche Bank                                            100%     0.0%    0.0%    6.8      2.9
DLJ Mortgage          Credit Suisse                      2.5%     84.8%   0.8%    6.5      1.7
Encore                Bear Stearns                       0.0%     0.0%    0.0%    7.2      1.7
EquiFirst             Barclays                           35.2%    0.0%    0.0%    3.5      0.3
Fieldstone                                               89.7%    10.3%   0.0%    7.7      3.8
First Franklin        Merrill Lynch       651     92     45.6%    2.3%    0.0%    4.6      4.9
Fremont                                   624     88     0.0%     100%    0.0%    4.5      3.7
Goldman Sachs                             627     88     90.9%    9.1%    0.0%    7.5      4.0
GSAA                  Goldman Sachs                      53.3%    16.6%   4.8%    6.3      2.0
HarborView            RBS                                100%     0.0%    0.0%    6.9      1.7
HEAT                  Credit Suisse       627     87     17.5%    27.9%   0.0%    4.7      3.6
HSBC                                                     100%     0.0%    0.0%    7.2      3.3
IndyMac                                   617     83     0.0%     0.0%    0.0%    1.7      2.7
Ixis                  Morgan Stanley      626     81     31.3%    8.8%    3.2%    5.3      3.5
JPMorganChase         JP Morgan           631     82     82.8%    17.2%   0.0%    7.3      2.4
Long Beach            Washington Mutual   636     90     9.9%     90.1%   0.0%    7.7      2.2
MASTR                 UBS                 624     86     34.8%    8.0%    23.6%   4.6      4.5
Merrill Lynch                             641     88     20.7%    78.8%   0.0%    6.2      4.7
Morgan Stanley                            624     82     23.0%    77.0%   0.0%    7.8      2.2
New Century                               625     84     0.0%     100%    0.0%    7.7      2.0
Nomura                                    630     87     0.9%     27.9%   20.2%   4.5      4.0
NovaStar                                  615     85     71.5%    13.0%   0.0%    7.2      2.1
Option One                                609     82     34.3%    18.8%   2.0%    6.5      3.7
Other                                                    21.9%    78.1%   0.0%    7.1      3.2
OWNIT                                     665     84     56.5%    2.8%    2.3%    5.5      7.0
Park Place                                               0.0%     100%    0.0%    7.2      0.8
Popular                                   621     85     0.0%     0.0%    54.4%   3.6      1.7
RALI                  GMAC                               39.1%    11.8%   23.7%   6.4      2.5
RAMP                  GMAC                               11.4%    17.3%   0.0%    5.1      2.9
RASC                  GMAC                618     86     0.0%     1.2%    58.7%   4.4      2.5
Residential Asset     GMAC                               70.0%    30.0%   0.0%    7.9      3.4
SASCO                 Lehman Brothers     626     86     93.9%    6.1%    0.0%    6.9      3.1
Saxon                 Morgan Stanley      612     82     100%     0.0%    0.0%    6.4      1.8
Securitized ABR.      Barclays                           0.0%     100%    0.0%    7.3      2.2
SoundView             RBS                 635     89     100%     0.0%    0.0%    5.6      3.3
Terwin                                    648     82     100.0%   0.0%    0.0%    6.5      6.9
UBS                                                      6.3%     3.2%    28.7%   4.2      2.7
Wachovia                                                 50.4%    42.2%   0.0%    6.9      4.5
Wells Fargo                               625     82     5.4%     8.3%    0.0%    3.8      5.6


                                                 111
Appendix B: Credit Rating Scale


  Moodys   S&P      Fitch    Score
  Aaa      AAA      AAA         1
  Aa1      AA+      AA+         2
  Aa2      AA       AA          3
  Aa3      AA-      AA-         4
  A1       A+       A+          5
  A2       A        A           6
  A3       A-       A-          7
  Baa 1    BBB+     BBB+        8
  Baa 2    BB B     BB B        9
  Baa 3    BB B -   BB B -     10
  Ba1      BB +     BB +       11
  Ba2      BB       BB         12
  Ba3      BB -     BB -       13
  B1       B+       B+         14
  B2       B        B          15
  B3       B-       B-         16
  Caa 1    CCC+     CCC+       17
  Caa 2    CC C     CC C       18
  Caa 3    CC C -   CC C -     19
  Ca       CC       CC         20
  C        C        C          21
  D        D        D          22
  NR       NR       NR          0


              112
Appendix C: S&P Default Matrix
                                                                         Source: S&P CDO Evaluator 3.0,


      Year   AAA      AA+      AA       AA-      A+       A        A-       BBB+     BBB      BBB-     BB+      BB       BB-      B+       B        B-       CCC+     CCC      CCC-
      1      0.0004   0.002    0.013    0.024    0.027    0.033    0.049    0.234    0.353    0.967    1.632    2.525    3.803    4.51     5.824    8.138    23.582   45.56    66.413
      2      0.009    0.017    0.062    0.078    0.097    0.121    0.185    0.514    0.825    2.142    3.211    4.946    7.26     8.885    11.751   16.674   38.104   59.145   79.233
      3      0.03     0.05     0.135    0.166    0.212    0.263    0.396    0.85     1.405    3.415    4.758    7.23     10.401   12.96    17.152   24.004   46.752   64.835   82.905
      4      0.065    0.104    0.232    0.29     0.372    0.459    0.676    1.246    2.073    4.728    6.276    9.38     13.265   16.694   21.921   30.025   52.288   68.078   84.581
      5      0.118    0.182    0.356    0.452    0.578    0.709    1.02     1.704    2.812    6.046    7.763    11.403   15.886   20.087   26.089   34.945   56.158   70.313   85.65
      6      0.19     0.287    0.512    0.654    0.83     1.013    1.424    2.221    3.607    7.352    9.216    13.31    18.291   23.156   29.725   38.996   59.071   72.019   86.454
      7      0.285    0.42     0.701    0.897    1.128    1.368    1.883    2.792    4.443    8.635    10.632   15.11    20.503   25.929   32.903   42.374   61.383   73.396   87.105
      8      0.405    0.584    0.927    1.182    1.472    1.774    2.395    3.413    5.31     9.891    12.007   16.81    22.544   28.435   35.692   45.227   63.284   74.546   87.653
      9      0.552    0.781    1.191    1.509    1.859    2.226    2.954    4.076    6.198    11.116   13.34    18.418   24.432   30.702   38.151   47.666   64.886   75.529   88.124
      10     0.728    1.013    1.493    1.876    2.29     2.724    3.557    4.777    7.103    12.309   14.631   19.941   26.182   32.76    40.331   49.776   66.261   76.383   88.535
      11     0.934    1.28     1.833    2.285    2.762    3.263    4.198    5.51     8.017    13.471   15.881   21.386   27.809   34.633   42.275   51.62    67.459   77.133   88.899
      12     1.173    1.583    2.213    2.733    3.273    3.841    4.873    6.269    8.937    14.602   17.091   22.758   29.326   36.343   44.018   53.245   68.512   77.799   89.223
      13     1.445    1.923    2.631    3.219    3.822    4.454    5.578    7.05     9.86     15.704   18.261   24.064   30.744   37.91    45.589   54.691   69.448   78.396   89.515
      14     1.75     2.3      3.086    3.742    4.404    5.099    6.309    7.85     10.783   16.776   19.394   25.307   32.073   39.353   47.014   55.985   70.287   78.935   89.779
      15     2.089    2.712    3.577    4.299    5.018    5.773    7.063    8.664    11.704   17.822   20.491   26.494   33.323   40.685   48.313   57.154   71.045   79.426   90.02


113
      16     2.463    3.16     4.102    4.887    5.662    6.473    7.836    9.49     12.621   18.841   21.555   27.629   34.501   41.92    49.504   58.214   71.733   79.875   90.241
      17     2.87     3.643    4.659    5.506    6.332    7.195    8.624    10.325   13.534   19.836   22.587   28.716   35.614   43.07    50.6     59.183   72.363   80.288   90.445
      18     3.311    4.158    5.247    6.152    7.026    7.937    9.426    11.167   14.441   20.808   23.589   29.759   36.67    44.145   51.614   60.073   72.943   80.671   90.634
      19     3.784    4.704    5.863    6.823    7.741    8.696    10.238   12.013   15.342   21.757   24.563   30.761   37.674   45.153   52.557   60.895   73.479   81.028   90.81
      20     4.289    5.281    6.506    7.516    8.475    9.47     11.059   12.862   16.235   22.686   25.51    31.727   38.63    46.102   53.438   61.658   73.978   81.362   90.974
      21     4.823    5.885    7.172    8.229    9.225    10.256   11.886   13.713   17.121   23.596   26.434   32.658   39.545   46.998   54.263   62.37    74.445   81.675   91.129
      22     5.386    6.514    7.86     8.961    9.989    11.053   12.718   14.563   17.999   24.487   27.334   33.558   40.42    47.848   55.04    63.036   74.883   81.971   91.275
      23     5.975    7.168    8.567    9.707    10.765   11.857   13.552   15.413   18.869   25.361   28.213   34.429   41.261   48.655   55.774   63.663   75.296   82.252   91.413
      24     6.59     7.843    9.292    10.468   11.552   12.668   14.389   16.261   19.731   26.218   29.071   35.273   42.07    49.426   56.47    64.256   75.686   82.518   91.544
      25     7.229    8.538    10.032   11.24    12.346   13.484   15.226   17.105   20.584   27.06    29.911   36.093   42.851   50.162   57.132   64.817   76.057   82.773   91.67
      26     7.889    9.25     10.786   12.022   13.147   14.303   16.062   17.947   21.428   27.887   30.733   36.89    43.605   50.868   57.764   65.351   76.411   83.017   91.789
      27     8.568    9.979    11.55    12.811   13.954   15.125   16.897   18.784   22.264   28.7     31.538   37.667   44.335   51.546   58.369   65.86    76.75    83.251   91.904
      28     9.266    10.721   12.325   13.608   14.764   15.947   17.729   19.616   23.092   29.499   32.327   38.423   45.043   52.2     58.95    66.348   77.074   83.476   92.015
      29     9.98     11.475   13.108   14.409   15.576   16.77    18.559   20.443   23.911   30.286   33.102   39.162   45.731   52.832   59.508   66.816   77.386   83.693   92.121
      30     10.708   12.24    13.897   15.213   16.39    17.591   19.385   21.265   24.721   31.061   33.863   39.884   46.4     53.443   60.047   67.266   77.687   83.903   92.224
Appendix D: Policy Recommendations
                                Letters to Ben Bernanke

  The following letter was written by Michael Blum, President of Michael Blum Consulting, a
company that provides risk analysis and valuation services for complex structured products. This
       letter gives one proposal for cleaning up the toxic assets left by the CDO collapse.

Letter to Federal Reserve Chairman, Ben Bernanke

Jan. 19, 2008

Dear Governor of the Federal Reserve,

My name is Michael Blum. I am writing you as a private citizen, as a loyal American as well as a
Goldman Sachs alumnus with over 20 years experience in the structured finance markets. I am
concerned by the current credit crisis, and have a suggestion which I believe would help navigate
out of it.

CDOs are like love. When they're good, they're great, but when they're bad, watch out. They
resemble options on options, which regulators would hardly permit in the public equity markets.
They should not have been issued with dubious collateral, but the crux of the credit crisis is that
they have been, and no one knows how bad mortgage defaults are going to get.

When you buy something at a store, and discover after opening it up at home that there is
something wrong with the product, you take it back to the store and return it. The store will take it
back, although they may give you back something less than the price you paid.

My proposal is along these lines. Since the trustee's responsibility is to make bond payments, a
CDO's bondholders can be identified by its trustee, If the dollar majority of the CDO's
bondholders approve, I would make repurchase by the underwriter of all bonds in the CDO
mandatory, so that the underwriter can then collapse the deal and sell the underlying collateral.
There is a simple and intuitive method to calculate the repurchase price at which the underwriter
makes no money on the transaction; the Fed may choose to allow the underwriter a profit as an
incentive to cleaning up the market, or subtract a penalty for the underwriter's prior faulty bond
origination.

The fundamental theory of mortgage securitization is that bonds can be sold at a premium to the
cost of their underlying collateral. The problem arose when greedy originators and underwriters
increased their revenues by introducing dubious collateral. This means that, even if dubious, the
underlying collateral is now worth more than the bonds are, because CDO technology guaranteed
that bond losses would be magnified.

To some extent, this collapse is already happening, as some CDOs have had an "event of
default" triggered by their collateral's dismal performance. However, as this was hardly foreseen
by the underwriters who prepared the offering documents, the mechanics of who gets which
proceeds are murky and often, litigation is the result.

There is no longer a functioning CDO market. CDO bond prices, if marked at all, have been
marked to distressed levels, or zero, by virtue of being in a CDO. Since owning all of the bonds in
a CDO is akin to ownership of the collateral pool, my suggestion is to make it mandatory for
underwriters to buy back all bonds in a CDO when a dollar majority of bondholders approve, so
they can sell the collateral RMBS, CMBS, ABS, etc. for which there are still functioning markets.
In fact, the underwriters can put the collateral up for bid for forward settlement, which allows time
to set up a transaction where the bonds are bought, the collateral sold and the CDO is collapsed
instantaneously. Once the aggregate proceeds at which the collapsed-CDO collateral can be sold


                                                114
are known, proceeds can be allocated either according to the offering memorandum or else,
based on each CDO bond's percentage of the total collateral balance. This may mean ratings are
meaningless, but as a forward-looking measure of likely repayment of principal, we now know
that anyway.

Removing leverage from the system by mandating the collapse of toxic CDOs would be a vital
step in restoring normal capital flow to the securitized debt markets. Thank you for your time and
attention.


                                                                          Sincerely,


                                                                          Michael Blum


                                               115

2009 cd omeltdown

  • 1.
    The Story ofthe CDO Market Meltdown: An Empirical Analysis Anna Katherine Barnett-Hart Presented to the Department of Economics in partial fulfillment of the requirements for a Bachelor of Arts degree with Honors Harvard College Cambridge, Massachusetts March 19, 2009 1
  • 2.
    The Story ofthe CDO Market Meltdown: An Empirical Analysis* Abstract: Collateralized debt obligations (CDOs) have been responsible for $542 billion in write-downs at financial institutions since the beginning of the credit crisis. In this paper, I conduct an empirical investigation into the causes of this adverse performance, looking specifically at asset-backed CDO’s (ABS CDO’s). Using novel, hand-collected data from 735 ABS CDO’s, I document several main findings. First, poor CDO performance was primarily a result of the inclusion of low quality collateral originated in 2006 and 2007 with exposure to the U.S. residential housing market. Second, CDO underwriters played an important role in determining CDO performance. Lastly, the failure of the credit ratings agencies to accurately assess the risk of CDO securities stemmed from an over- reliance on computer models with imprecise inputs. Overall, my findings suggest that the problems in the CDO market were caused by a combination of poorly constructed CDOs, irresponsible underwriting practices, and flawed credit rating procedures. * I would like to thank the following people and businesses who willingly gave of their time and expertise to help me tell the story of the CDO market meltdown: Michael Blum, Michael Blum Consulting, Ann Rutledge, Sylvain Raynes, R&R Consulting, Eliot Smith, Sam Jones, Mark Adelson, Mark McKenna, Thomas Giardi, Arturo Cifuentes, Douglas Lucas, Paul Muolo, Richard Baker, Eric Siegel, and Richard Gugliada. I am also grateful for the guidance and advising of the following Harvard Professors and doctoral students: Efraim Benmelech, Paul Healy, Erik Stafford, Allen Ferrell, Martin Feldstein, Erkko Etula, Laura Serban, Jenn Dlugosz, and David Seif. All remaining errors are my own. 2
  • 3.
    1. Introduction Collateralized debt obligations (CDOs), once a money making machine on Wall Street, have been responsible for $542 billion of the nearly trillion dollars in losses suffered by financial institutions since 2007.1 Perhaps most disturbing about these losses is that most of the securities being marked down were initially given a rating of AAA by one or more of the three nationally recognized credit rating agencies,2 essentially marking them as “safe” investments.3 While the credit rating agencies have taken heavy criticism for their role in mis-rating billions of dollars in CDO tranches,4 they were not alone in their mistake. Indeed, almost all market participants, from investment banks to hedge funds, failed to question the validity of the models that were luring them into a false sense of security about the safety of these manufactured securities. How could so many brilliant financial minds have misjudged, or worse, simply ignored, the true risks associated with CDOs? In this paper, I use novel, hand-collected data from 735 ABS CDOs to shed light on this mystery, investigating the causes of adverse performance in CDOs backed by asset-backed securities (ABS CDOs).5 I characterize the relative importance of general CDO properties, underwriting banks, and credit rating agencies in contributing to the collapse of the CDO market and document several findings. First, the properties of the CDO collateral, including asset class and vintage, are the most important factor in explaining the variation in CDO performance. In particular, 1 According to CreditFlux Newsletter, as of January 8, 2008. 2 Moody’s, S&P, and Fitch. 3 According to financial consultant Mike Blum, underwriters would often pay for all three agencies to rate their deals to “convey the impression that these bonds were rock-solid.” 4 See Roger Lowenstein’s article, “Triple-A Failure,” for an overview of the criticism of the rating agencies. 5 ABS CDOs are CDOs whose collateral consists primarily of asset-backed securities, as opposed to CDOs backed by corporate bonds or whole loans. ABS CDOs accounted for more than 90% of the U.S. CDOs downgraded in 2007. 3
  • 4.
    CDOs with ahigh level of exposure to residential mortgage securities, specifically those backed by subprime and Alt-A adjustable-rate mortgages, consistently underperformed other CDOs. In addition, losses were higher for CDOs with a large amount of 2006 and 2007 vintage collateral. Secondly, the identity of the CDO underwriter is a significant predictor for CDO performance, even after controlling for collateral type. This finding shows that there was variation among banks’ underwriting standards, with some banks consistently more careful in their collateral selection. For example, J.P. Morgan’s CDOs consistently underperformed, while those from Goldman Sachs were among the top performers. Lastly, the original credit ratings assigned to CDOs failed to capture the true risks of these securities. There was a striking uniformity in the initial proportion of AAA given to all CDO deals, despite the wide variety in the characteristics of their collateral and the quality of their underwriters. On the whole, the original credit ratings of CDO bonds, most notably those given to the senior tranches, were grossly inflated. The structure of the paper is as follows: Section 2 gives an overview of CDOs, the role of the rating agencies, and the involvement of investment banks. Section 3 outlines guiding questions and hypotheses. Section 4 presents results of the multivariate regression analysis. Section 5 discusses key findings and Section 6 concludes. 4
  • 5.
    2. Background: TheRise and Fall of the CDO 2.1 The Evolution of Collateralized Debt Obligations The basic principle behind a CDO involves the re-packaging of fixed income securities and the division of their cash flows according to a strict waterfall structure. A CDO is constructed by creating a “brain-dead” company, a special purpose entity (SPE) or structured investment vehicle (SIV), which buys assets and issues bonds backed by the assets’ cash flows. The bonds are divided into a number of tranches with different claims on the principal and interest generated by the CDO’s assets. The mechanics of a typical CDO are illustrated in Diagram A. Diagram A: Mechanics of a CDO Source: Bionicturtle.com 5
  • 6.
    In order tounderstand the recent implosion of the CDO market, it is helpful to examine the factors that fueled the market’s explosive growth since 2004, as illustrated in Diagram B. There are two main factors that made the pooling and tranching of loans so attractive to the investors and investment banks that created CDOs – regulatory capital relief and risk reallocation.6 Diagram B: CDO Issuance in Billions Source: Asset-Backed Alert 6 Bluhm (2003) analyzes the different factors that have contributed to the success of CDO trading: spread arbitrage opportunities, regulatory capital relief, funding, and economic risk transfer. Mitchell (2004) argues that tranching only creates value in the presence of market imperfections, such as asymmetric information and adverse selection, and that originators can only profit from underwriting if they “possess some sort of comparative advantage…to the extent that other intermediaries can acquire identical assets, any potential profit form tranching may be quickly driven to zero”(Mitchell 11). 6
  • 7.
    Securitization helped manybanks to free up their balance sheets, allowing them to pool and tranche a bundle of loans and either sell the tranches to outside investors or put them in off-balance sheet vehicles. By removing loans from their books, underwriters of CDOs could decrease the capital charges imposed by the Basel Accords and their own internal risk requirements and thereby free up cash to make new loans.7 The second rationale for CDOs involved the pooling and re-allocation of risk. In theory, by pooling together a number of imperfectly correlated assets, it is possible to use diversification to decrease idiosyncratic risk. Furthermore, tranching the cash flows made it possible to create securities with different risk profiles appropriate to specific investors.8 This was especially important for institutional investors, many of who can purchase only investment-grade securities (defined as those with a credit rating of BBB- or higher). CDOs allowed these investors to gain exposure to assets that, on their own, had been too risky, while investors looking to take more risk and receive potentially higher returns could buy the most junior or “equity” CDO tranches.9 Table 1 summarizes the typical liability structures of ABS CDOs, showing the average subordination levels and yields for each rated tranche. The average number of tranches is 7.4 and the most common structure is the following: three AAA-rated tranches (2 of which are super senior bonds), one A-rated tranche, one BBB-rated tranche, and one unrated tranche. The average transaction size is $829 million and the average tranche size is $109 million. 7 Basel I required that banks hold capital of at least 8% of their loans. Basel II modified this slightly by imposing different charges based on the riskiness of the asset, often determined by the assets’ credit ratings. See Garcia et. al. (2008) for a more detailed explanation of capital requirement calculations. 8 Krahnen (2005) finds that the senior tranches bear the highest degree of systematic risk, and Gibson (2004) shows that most of the credit risk is contained in the equity tranche, regardless of the size of its notional amount. 9 According to Lehman Brother’s estimates, as of November 13, 2007, the biggest holders of AAA-rated CDO tranches included bond insurers, insurance companies, CDO commercial paper put providers, SIV and ABCP conduits, and investment banks. 7
  • 8.
    Table 1: CapitalStructure in CDOs This table summarizes the average liability structure of 735 ABS CDOs issued from 1999-2007. The % with tranche is the percent of CDOs that contained a tranche with the given rating at its issuance. The average number of tranches refers to the number per CDO with the given rating. The yield refers to the average coupon paid to the tranches, and the subordination refers to the percent of credit enhancement of the given tranche. Source: Lehman Live Rating % With Tranche Average # of Tranches Yield Subordination AAA 100.0% 2.5 3.4% 21.5% AA+ 7.4% 0.1 16.8% AA 81.7% 0.9 4.1% 14.0% AA- 12.7% 0.1 11.0% A+ 8.1% 0.1 16.8% A 59.6% 0.6 4.3% 11.0% A- 25.5% 0.3 12.0% BBB+ 11.3% 0.1 14.5% BBB 80.1% 0.9 4.4% 6.8% BBB- 19.3% 0.2 10.2% Below BBB- 37.2% 0.5 -- Unrated 86.3% 1.1 -- -- 7.4 -- Initially, it seemed that every player was benefiting from CDOs and issuance exploded, reaching $50 billion in 2006.10 The rating agencies were making record profits as the demand for rated structured products skyrocketed.11 Institutional investors loved the high-yielding AAA securities created from ABS CDOs, CDO underwriters collected fees and achieved regulatory capital relief by off-loading their assets, and CDO collateral managers earned hefty returns by retaining the equity tranches, benefiting from the low cost of funding senior tranches. However, by 2003, several changes in CDOs were working to create the perfect storm that was unleashed upon financial markets in 2007. 10 Source: Securities Industry and Financial Markets Association 11 According to a PBS special report, structured finance represented at least 40% of the revenues at the CRAs since 2000. Over that time, Moody’s went public, saw its stock increase six fold, and its earnings grow by 900%. 8
  • 9.
    First, the collateralcomposition of CDOs changed as collateral managers looked for ways to earn higher yields. The managers began investing more heavily in structured finance securities, most notably subprime RMBS, as opposed to corporate bonds. Furthermore, they invested in the mezzanine tranches of these securities, moves designed to create higher-yielding collateral pools. Table 2 documents the evolution of ABS CDO assets from 1999-2007, illustrating the profound increase in subprime RMBS (HEL) collateral, with 36% of the 2007 CDO collateral comprised of HEL bonds. Figure 1 depicts a detailed breakdown of the collateral backing the 2005-2007 vintage ABS CDOs and shows that the majority of collateral came from subprime and midprime RMBS. Table 2: Average Principal Allocations by Asset-Class This table summarizes the average collateral composition for of 735 ABS CDO deals originated between 1999-2007. The abbreviations stand for: HEL – home equity loan (includes all RMBS less than prime), RMBS – residential mortgage-backed securities (by prime borrowers), CMBS – commercial mortgage- backed securities, other ABS – other asset-backed securities (including auto-loans, credit-cards, etc.). Source: Lehman Live Year of Origination Deals % HEL % RMBS % CMBS % CDO % Other ABS 1999 1 0% 14% 9% 3% 74% 2000 16 5% 1% 2% 12% 80% 2001 28 7% 6% 8% 18% 61% 2002 47 16% 6% 7% 8% 63% 2003 44 29% 14% 3% 18% 37% 2004 101 35% 14% 6% 17% 28% 2005 153 37% 16% 10% 11% 25% 2006 217 33% 16% 7% 9% 35% 2007 135 36% 12% 8% 14% 29% TOTAL 742 34% 14% 8% 12% 32% 9
  • 10.
    Figure 1: CollateralComposition of ABS CDOs, 2005-2007 Vintage This Figure presents the collateral makeup of 2005-2007 ABS CDOs. Abbreviations – ARM: adjustable- rate mortgage, CES: closed-end second lien. Source: OpenSource Model. In response to the explosion in CDO issuance, the increased demand for subprime mezzanine bonds began to outpace their supply.12 Figure 2 shows the percentage of subprime bonds that were repackaged into CDOs, illustrating the drastic increase in subprime demand by CDOs. This surge in demand for subprime mezzanine bonds helped to push spreads down – so much so that the bond insurers and real estate investors that had traditionally held this risk were priced out of the market. The CDO managers that now purchased these mortgage bonds were often less stringent in their risk analysis than the previous investors, and willingly purchased bonds backed by ever-more exotic 12 Deng et. al. (2008) find that the demand for subprime mezzanine bonds for CDOs was so great that it was a significant factor in causing a tightening in the subprime ABS-treasury spread prior to 2007. 10
  • 11.
    mortgage loans.13 Figure3 looks specifically at the performance of the subprime collateral, comparing the rating downgrades of the subprime bonds that were in CDOs versus those that were not put in CDOs. Clearly, the bonds in the CDOs have performed worse, indicating that there might have been a degree of adverse selection in choosing the subprime bonds for CDOs 14 Figure 2: Repackaging of Subprime Bonds into CDOs This figure shows the percent of subprime bonds repackaged into CDOs. “In CDO” includes bonds listed in either Lehman Live (LL) or Open Source (OS). “Not in CDO” includes all bonds in ABSNet database not in either LL or OS CDOs. 13 A recent note by Adelson and Jacob (2008) argues that CDOs’ increasing demand for subprime bonds was the key event that fundamentally changed the market. 14 However, this result needs further investigation as it may be a result of the fact that the mezzanine tranches, most common in CDOs, have all performed the worst, or that the rating agencies had an incentive to monitor subprime bonds in CDOs more carefully, leading to a higher level of downgrades. 11
  • 12.
    Figure 3: RatingDowngrades of Subprime Bonds This Figure plots the number of notches of the average downgrade for subprime bonds in CDOs vs. those never repackaged. Sources: Lehman Live, Open Source, ABSNet. In addition to the increased investment in risky mortgage collateral, the next development was the creation of the notorious “CDO squared,” (and the occasional “CDO cubed”), which repackaged the hard-to-sell mezzanine CDO tranches to create more AAA bonds for institutional investors. Figure 4 shows the amount of CDO tranches that were repackaged into new CDOs, creating CDO squareds. The x-axis gives the tranche category by waterfall priority (i.e. seniority, 1 = first paid, last loss), and the y- axis shows the number of total tranches that were issued and repackaged. As expected, the highest percent of repackaging occurred with lower seniority CDO tranches, with few of the most senior tranches being resecuritized. 12
  • 13.
    Figure 4: Repackagingof CDO Tranches This Figure illustrates the total number of tranches issued with a given waterfall priority (1 being most senior) and the number of those tranches that were resecuritized into a CDO squared. Source: Open Source. Lastly, the advent of synthetic CDOs significantly altered the evolution of the CDO market. Rather than investing in cash bonds, synthetic CDOs were created from pools of credit-default swap contracts (CDS), essentially insurance contracts protecting against default of specific asset-backed securities.15 The use of CDS could give the same payoff profile as cash bonds, but did not require the upfront funding of buying a cash bond. Furthermore, using CDS as opposed to cash bonds gave CDO managers the freedom to securitize any bond without the need to locate, purchase, or own it prior to 15 The advent of certain CDS indices with reference to pools of asset-backed securities encouraged this trend. The ABX Index is a series of credit-default swaps based on 20 bonds that consist of subprime mortgages. ABX contracts are commonly used by investors to speculate on or to hedge against the risk that the underling mortgage securities are not repaid as expected. The ABX swaps offer protection if the securities are not repaid as expected, in return for regular insurance-like premiums. The CMBX is a similar index referencing a basket of commercial mortgage-backed securities. 13
  • 14.
    issuance.16 Figure 5shows two changes in CDO investments since 1999: the decrease in collateral backed by fixed-rate assets and the increased use of synthetic assets (i.e. CDS). Taken together, these observations indicate that CDOs began to invest in more risky assets over time, especially in subprime floating rate assets. Essentially, CDOs became a dumping ground for bonds that could not be sold on their own – bonds now referred to as “toxic waste.” As former Goldman Sachs CMBS surveillance expert Mike Blum explains: Wall Street reaped huge profits from “creating filet mignon AAAs out of BB manure.” Figure 5: Collateral Composition Trends in ABS CDOs This Figure shows the historical changes in CDO bond collateral among fixed rate, floating rate, and synthetic bond types. Source: Lehman Live. 16 The demand for ABS bonds for CDOs was so high, that underwriters and managers often had trouble securing enough bonds for a CDO. Several former CDO managers described this situation as “extremely frustrating,” as they would often spend significant amounts of time analyzing new bond issues, only to find out that they were oversold or that they could purchase just a small amount. Using CDS guaranteed that CDO managers could take “bets” on any bond they found desirable, regardless of its limited supply. 14
  • 15.
    The deterioration inCDO collateral quality was matched by a decrease in the credit support of the rated tranches, leaving investors more exposed to losses on the collateral. Figure 6 gives a graphical presentation of the subordination levels over time: the subordination levels have decreased slightly for all tranches, with the most pronounced decline visible in the AAA-rated tranches, which went from an average of 25% subordination in 2002 to less than 15% in 2007. Figure 6: CDO Weighted Average Subordination Levels This Figure plots the annual average percentage of subordination by bond class for 697 CDOs originated between 2002-2007. Source: Lehman Live. With the issuance of CDOs growing unabated and the quality of their collateral declining, both the rating agencies and the investment banks failed to recognize the 15
  • 16.
    amount of riskinherent in these products. Figure 7 shows the dramatic increase in realized default levels of ABS CDOs, with over 40% of the 2007 CDO assets in default. Figure 7: Historical Realized Default Levels This Figure plots the default rates of CDO assets in ABS CDOs by year of origination. The default rates were calculated using data obtained from Lehman Live. 2.2 Credit Rating Agencies (CRAs) The credit rating agencies were formed nearly a century ago to help investors gauge the risk of fixed-income securities. Credit ratings have been vital to the development of the CDO market, as investors felt more confident purchasing the new structures if they were rated according to scales that were comparable to those for more familiar corporate bonds. Investors came to rely almost exclusively on ratings to assess CDO investments: in essence substituting a letter grade for their own due diligence.17 In 17 In a report to shareholders, UBS cites over-reliance on ratings as a cause of their massive write-downs, saying that their risk committee “relied on the AAA rating of certain subprime positions, although the 16
  • 17.
    addition, credit ratingsfrom agencies deemed to be “nationally recognized statistical organizations” (NRSRO) were used for regulatory purposes by the SEC. While there are five credit rating agencies with the NRSRO qualification, only three were major players in the U.S. structured finance market: Moody’s, Fitch, and Standard and Poor’s (S&P).18 Figure 8 shows the percent of CDO deals that contained a rating by the each of these three rating agencies (the sum is greater than 100% because many deals were rated by more than one agency). While S&P and Moody’s rated almost all CDO deals, Fitch’s market share declined to less than 10% by 2007. The rating agencies earned high fees from the CDO underwriters for rating structured finance deals, generating record profits as seen in Diagram C. Table 3 shows the amount of CDO business each of the CRAs did with the various CDO originators.19 Problems with CDO ratings rapidly developed as the rating agencies came under enormous pressure to quickly crank out CDO ratings and the market exploded faster than the number or knowledge of analysts. Analysis of CDOs came to rely almost completely on automated models, with very little human intervention and little incentive to check the accuracy of the underlying collateral ratings.20 CDOs were built from lower-rated tranches of RMBS. This appears to have been common across the industry. A comprehensive analysis of the portfolios may have indicated that the positions would not necessarily perform consistent with their ratings”(UBS 39). 18 The other two NRSROs are A.M. Best and Dominion Bond Rating Service (DBRS). 19 Not surprisingly, all three CRAs did the most CDO ratings for Merrill Lynch, the biggest CDO originator. After Merrill Lynch, the ranks of S&P and Moody’s clients are almost identical. However, Fitch derived more of their CDO business from non-U.S. originators such as Calyon, UBS, and WestLB. 20 In his testimony before congress, Frank Raiter, a former RMBS analyst at S&P, testified that he was often asked to give RMBS ratings for CDOs without essential credit information. According to Raiter, the managing director of CDO ratings, Richard Gugliada, said: “Any request for loan level tapes is TOTALLY UNREASONABLE!! Most investors don’t have it and can’t provide it. Nevertheless we MUST produce a credit estimate…It is your responsibility to provide those credit estimates and your responsibility to devise some method to do so.” (Testimony before the Committee on Oversight and Government Reform, October 22, 2008). 17
  • 18.
    Figure 8: CreditRating Agency’s Market Share in CDO Ratings This Figure plots the percent of all CDOs (both ABS and corporate) rated by each of the three rating agencies. Source: UBS CDO Research. Diagram C: Revenue of the Big 3 Rating Agencies, 2002-2007 Source: thismatter.com/money 18
  • 19.
    Table 3: BiggestClients of the Credit Rating Agencies This table shows the amount of business each CDO originator did with the three main CRAs. Ranks are based on the total par amount of CDO tranches rated by the agency: the higher ranks correspond to more business. The total amount rated by the agency is shown in parentheses under the rank. The results are sorted by average ranking. Average Moody's Fitch Rank S&P Rank Originator Rank Rank ($mm) ($mm) ($mm) Merrill Lynch 1 1 1 1 ($76,908) ($31,269) ($77,275) Citigroup 2 2 6 2 ($28,497) ($2,972) ($29,106) UBS 3 6 2 4 ($17,124) ($6,962) ($20,396) Wachovia 4 4 7 5 ($20,328) ($2,527) ($20,337) Calyon 5 7 3 7 ($16,877) ($4,656) ($16,848) Goldman Sachs 6 3 14 3 ($22,477) ($0,798) ($22,617) Deutsche Bank 7 10 5 8 ($12,251) ($3,390) ($14,471) Various Small Banks 8 5 13 6 ($18,742) ($0,947) ($18,689) Credit Suisse 9 8 8 9 ($13,330) ($1,893) ($14,088) RBS 10 12 9 12 ($10,686) ($1,673) ($11,704) Lehman Brothers 11 11 12 11 ($11,985) ($1,085) ($12,024) Bear Stearns 12 9 16 10 ($13,252) ($0,296) ($13,530) Unknown 13 13 11 13 ($10,596) ($1,248) ($10,566) Bank of America 14 14 10 14 ($7,994) ($1,259) ($8,412) WestLB 15 17 4 19 ($4,178) ($3,935) ($1,345) Dresdner Bank 16 15 none 15 ($7,732) ($7,732) Morgan Stanley 17 16 17 16 ($6,091) ($0,242) ($6,091) Barclays Capital 18 18 15 17 ($3,005) ($0,479) ($3,417) JP Morgan 19 19 none 18 ($1,769) ($1,755) 19
  • 20.
    According to MarkAdelson, now Chief Credit Officer at S&P: The advent of CDOs in the mid-1980s was a watershed event for the evolution of rating definitions. Until the first CDOs, rating agencies were only producers of ratings; they were not consumers. With the arrival of CDOs, rating agencies made use of their previous ratings as ingredients for making new ratings – they had to eat their own cooking. For rating CDOs, the agencies used ratings as the primary basis for ascribing mathematical properties (e.g., default probabilities or expected losses) to bonds.21 Not only did the rating agencies fail to examine the accuracy of their own prior collateral ratings, but in many cases, they also used other agency’s ratings without checking for accuracy. To correct for any shortcomings in the other agency’s rating methodology, they created the practice of “notching,” whereby they would simply decrease the rating of any collateral security that they did not rate by one notch.22 In other words, if Moody’s rated a CDO that was composed of collateral rated BB+ by Fitch only, Moody’s would instead use a rating of BB in their own CDO model because it was not their rating. They never went back and reanalyzed the other rating agency’s rating, conveniently assuming that decreasing it by a notch would compensate for any shortcomings in the initial risk analysis. The inputs and definitions associated with the models were frequently changed, generating confusion and inconsistencies in the ratings: Fitch’s model showed such unreliable results using its own correlation matrix that it was dubbed the “Fitch’s Random Ratings Model.”23 Furthermore, it became clear that similarly rated bonds from different sectors (i.e. ABS vs. corporate bonds, RMBS vs. CMBS) had markedly different track records of realized default probabilities, and the agencies began to adjust their meanings and models haphazardly in an attempt to correct their previous mistakes. In 21 Adelson (2006), pg. 5 22 SEC Report on Rating Agencies 23 Tavakoli (2005), pg. 3 20
  • 21.
    S&P’s 3.0 versionof the CDO Evaluator, released in December 2005, the agency published complete tables of default probabilities for ABS/MBS, corporate bonds, and CDOs with conflicting definitions depending on the asset it was used to rate. Adelson voiced concerns about this lack of consistency in 2006, stating that: The different meanings had some bizarre implications. Suppose you have a seven-year ABS rated AA+. According to the tables, the instrument has an idealized default probability of 0.168%. If we repackage the security (all by itself) and call the repackaged instrument a CDO, it ought to get a rating of AAA because the idealized default rate for a AAA-rated CDO is 0.285%.24 This seems simply an affront to common sense. It illustrates why variable definitions of rating symbols are a problem.25 However, investors thought, and were encouraged to believe, that the ratings of CDOs corresponded to similar default distributions as individual corporate bonds, thereby further fueling the asset-backed frenzy. Lastly, as CDO structures became more complex, incorporating features such as super senior tranches, payment-in-kind (PIK) provisions,26 and a diversity of trigger events that could change the priority of liability payments, CDO ratings became even less meaningful.27 In addition to the problems with the accuracy of the ratings, there was also the fact that the ratings themselves were not meaningful indicators for assessing portfolio risk. As Coval et. al. (2009) notes, credit ratings, “by design only provide an assessment of the risks of the security’s expected payoff, with no information regarding whether the security is particularly likely to default at the same time as there is a large scale decline in 24 This means that a CDO was allowed to have a higher default rate (worse performance) than other securities, and still garner an AAA rating. 25 Adelson (2006), pg. 6 26 In the case of an interest shortfall, PIK provisions say that investors can be paid with more bonds, instead of cash. Thus, investors accrue principal as opposed to receiving their interest. 27 According to Tavakoli, the CRAs did not acknowledge the existence of super senior tranches. They were only concerned with solving for the proper AAA attachment point. In reality though, an investor should not be indifferent to owning the AAA tranche from a CDO with a super senior and one without, for the former tranche is a first-loss tranche supporting the super senior. 21
  • 22.
    the stock marketor that the economy is in recession.” 28 Furthermore, ratings are a static measure, designed to give a representation of expected losses at a certain point in time with given assumptions. It is not possible for a single rating to encompass all the information about the probability distribution that investors need to assess its risk. Dr. Clarida, an executive vice president at PIMCO, points out that, “distributions are complicated beasts – they have means, variances, skews, and tails that can be skinny or, more often, fat. Also – they have kurtosis, fourth moments, and transition probabilities.”29 Investors often overcame these limitations by looking at ratings history, filling in their missing information with data about the track record of defaults for a given rating. Since there was little historical data for CDOs, investors instead looked at corporate bond performance. However, as noted above, asset-backed ratings have proven to have very different default distributions than corporate bonds, leading to false assessments. The heavy reliance on CDO credit ratings made it more devastating when problems with the models and processes used to rate structured finance securities became apparent.30 The Bank for International Settlements commissioned a report summarizing the difficulties in rating subprime RMBS.31 They found that the credit rating agencies underestimated the severity of the housing market downturn, which in turn caused a sharp increase in both the correlation among subprime mezzanine tranche defaults and their overall level of realized defaults, while decreasing the amount recovered in the event of a 28 Coval et. al. (2007) find that “in fixed income markets, many investors focus exclusively on estimates of expected payoffs, without considering the state of the economy in which default is likely to occur,” and show that “many structured finance instruments can be characterized as economic catastrophe bonds, but offer far less compensation than alternatives with comparable payoff profiles.” 29 PIMCO Global Perspectives, March 2009. 30 For a detailed explanation of the rating methodologies of the three CRAs, see Fender and Kiff (2004). 31 See BIS Committee on the Financial System (2008). 22
  • 23.
    default (i.e. lossgiven default). In addition, the ratings of subprime RMBS relied on historical data confined to a relatively benign economic environment, with very little data on periods of significant declines in house prices. Figure 9 reveals the level of optimism of original CDO ratings, showing the credit ratings of the CDO tranches and of their collateral asset pools, both at issuance and currently.32 This Figure shows that the CRAs somehow manufactured huge amounts of AAA CDO securities from collateral with much lower ratings, confirming that one of the reason CDOs were so profitable in 2005-2007 was that it was possible to manufacture a high proportion of highly rated securities from lower quality assets. That practice has backfired, resulting in massive downgrades of the CDO tranches as it became apparent that the rating agencies had been overly optimistic. While in 2005-2007, the initial ratings given to CDO tranches were on average better than the ratings of their underlying collateral assets, current CDO tranche ratings for these years are now significantly worse than their associated collateral pool ratings. Figure 10 provides a display of the devastating level of downgrades associated with CDO bonds, showing the average tranche downgrade of each CDO vintage grouped by initial tranche rating. The AAA tranches have suffered a profound increase in downgrades; while the average downgrade for AAA tranches of the 2002 vintage was just 3 notches (to a rating of AA-), the average downgrade for AAA tranches from 2007 is 16 notches, meaning AAA tranches now carry an average rating of CCC+, 7 notches below the minimum investment-grade ranking (BBB-). 32 The numbers on the y-axis correspond with the rating scores in Appendix B (1=AAA, 22=D). 23
  • 24.
    Figure 9: Evolutionof CDO Tranche and Collateral Asset Ratings This Figure shows the weighted average ratings of the CDO tranches and their underlying asset pools in the high information sample both at issuance and currently, broken down by CDO vintage. The numbers on the y-axis correspond to the rating scale outlined in Appendix B, with lower numbers equal to higher-quality ratings (1=AAA, 22=D). Figure 10: Downgrades of CDO Tranches Across Time This Figure shows the average downgrade of CDO ratings from each CDO vintage, by initial tranche rating. The numbers on the y-axis correspond to the rating scale outlined in Appendix B, with lower numbers equal to higher-quality ratings (1=AAA, 22=D). 24
  • 25.
    While all threerating agencies severely underestimated the true risk of CDO bonds, there has been some distinction in the ex-post performance of CDOs rated by different combinations of the three CRAs. Figure 11 shows the percent of CDOs rated by each agency combination that experienced an event of default (EOD) as of June 2008. This shows that CDOs rated by Fitch generally had less defaults than those without a Fitch rating. However, this result is not conclusive, as a number of other factors could be responsible for the lower level of defaults in Fitch-rated CDOs. Figure 11: Event of Default Frequency by Rating Combination This Figure plots the percent of CDOs that experienced an event of default as a function of the agencies who rated it. Source: UBS CDO Research. 25
  • 26.
    Overall, the creditratings of CDOs have been an utter disaster. According to Arturo Cifuentes: “The rating agencies failed twice…first when they misrated a huge number of subprime securitizations; and a second time, when they misrated CDOs of ABS. And to cap it all: they all failed together…making the same mistakes at the same time.”33 2.3 Investment Banks Wall Street quickly pounced on CDOs, seeing an opportunity to offload unwanted risks and make a fortune in the process.34 Table 5 presents a list of the top CDO underwriters for each year. Merrill Lynch was by far the biggest underwriter of ABS CDOs, with a total of 107 deals, and Citigroup came in second with 80 deals. Table 4: Top CDO Underwriters This table presents the number of ABS CDO deals underwritten by the top 10 underwriters between 2002-2007. The data were obtained from S&P’s CDO Interface. Underwriter 2002 2003 2004 2005 2006 2007 TOTAL Merrill Lynch 0 3 20 22 33 18 107 Citigroup 3 7 13 14 27 14 80 Credit Suisse 10 7 8 9 14 6 64 Goldman Sachs 3 2 6 17 24 7 62 Bear Stearns 5 2 5 13 11 15 60 Wachovia 5 6 9 16 11 5 52 Deutsche Bank 6 3 7 10 16 5 50 UBS 5 2 5 10 16 6 46 Lehman Brothers 3 4 3 6 5 6 35 Bank of America 2 2 4 9 10 2 32 TOTAL DEALS 47 44 101 153 217 135 697 33 Testimony of Cifuentes (2008), pg. 2 34 Merrill was rumored to have made between $400-$500 million in fees from its CDO business in 2006, according to a former employee. 26
  • 27.
    As the CDOwave continued, Wall Street banks tired of relying on mortgage banks and other loan originators to provide them with CDO collateral acquired mortgage subsidiaries and began repackaging their own collateral into CDOs. Table 5 shows the amount of in-house RMBS and CDO collateral used by each CDO underwriter.35 Panel A shows that Bear Stearns underwrote CDOs with as much as 30% of the collateral issued by their in-house RMBS business, and Merrill Lynch itself bought 32% of all of its in- house RMBS used in CDOs. However, Countrywide remained the biggest RMBS supplier to almost every CDO underwriter. Panel B shows that Merrill Lynch created CDO squareds with as much as 15% of the assets from their prior CDO transactions, and that Merrill bought 59% of its CDO tranches that were resold into CDO squareds. As the complexity of CDOs increased, the amount of CDO repackaging multiplied. In Panel B, the column “Level” summarizes the amount of repackaging done by the various banks. On average, Merrill Lynch’s CDO assets were made of CDOs that had undergone 4.79 iterations of securitization. This illustrates the high level of complexity apparent in these securities and shows why performing analysis of the collateral was very difficult. 35 Both tables show the average and maximum percent of each CDO originator’s CDO collateral issued by itself or a subsidiary. In addition, they show how much of the originator’s CDO bonds they put in their own CDOs as well as listing the largest buyers and sellers between each originator/originator pair. 27
  • 28.
    Table 5: Banksas CDO Originators and Collateral Originators Panel A: Bank’s RMBS Originators This table looks at whether CDO originator’s used their own RMBS assets in CDOs. Columns 3- 4 show how much of the bank’s CDO collateral came from their own originator, Column 5 looks at the share of the originator’s bonds in ABS CDOs that are in their parent bank’s CDOs, Column 5 gives the name of the largest RMBS originator that contributed bonds to each bank’s CDOs. Bank Name of Avg. % Max % % of bonds in Largest RMBS Bank’s RMBS from from parent’s Supplier to Bank’s Originator originator originator CDOs CDOs BoA ABFC 2.9% 7.7% 3.7% Countrywide BoA Countrywide 7.4% 17.9% 3.2% Countrywide Barclays Securitized 2.6% 4.7% 3.6% ABR. Countrywide Barclays EquiFirst 0.1% 0.4% 0.8% Countrywide Bear Bear Stearns 7.0% 30.7% 7.9% Countrywide Bear Encore 0.3% 1.4% 4.1% Countrywide Citigroup Citigroup 2.5% 10.0% 13.9% Countrywide Credit S. HEAT 4.1% 10.0% 8.4% Countrywide Credit S. DLJ Mortgage 2.0% 5.2% 7.5% Countrywide Deutsche Deutsche Bank 0.3% 5.2% 20.8% Countrywide Goldman GSAA 2.2% 10.1% 22.2% Countrywide Goldman Goldman Sachs 3.8% 10.5% 10.6% Countrywide JP Morgan JPMorganChase 4.2% 6.5% 0.8% Goldman Sachs Lehman SASCO 5.5% 13.4% 6.5% Countrywide Merrill First Franklin 3.1% 9.5% 25.6% Countrywide Merrill Merrill Lynch 3.3% 9.7% 32.8% Countrywide Morgan Ixis 0.5% 2.6% 3.7% Countrywide Morgan Morgan Stanley 5.7% 15.9% 2.5% Countrywide Morgan Saxon 0.3% 2.0% 1.5% Countrywide RBS HarborView 1.6% 10.0% 18.3% Morgan Stanley RBS SoundView 2.6% 11.4% 8.9% Morgan Stanley UBS MASTR 4.3% 12.3% 19.7% Bear Stearns UBS UBS 0.5% 6.5% 6.7% Bear Stearns Wachovia Wachovia 1.4% 6.7% 22.7% Countrywide 28
  • 29.
    Panel B: Banksusing their own CDOs as collateral for CDO-squared deals This table looks at the amount of CDO collateral underwriters repackaged into subsequent CDO deals (CDO squareds). “Total # of tranches” equals the number of tranches per underwriter that were put into subsequent securitizations. The next two columns (Avg. % and Max %) show the average and maximum amount of the bank’s CDO collateral that came from their own CDO securities. Column 5 (% of originator’s CDO bonds) shows the percent of the total number of tranches (from Column 2) that ended up in the underwriter’s own CDO squared deals. Column 6 gives the name of the largest buyer of each bank’s CDO bonds used in CDO squared deals. Column 7 provides the name of the largest provider of CDO bonds to each bank used in their CDO squared deals. Lastly, Column 7 (“Level”) shows the average number of resecuritizations of the CDO collateral used by each underwriter, calculated as the weighted average number of CDO repackaging iterations in each underwriter’s CDOs (for example, 3 would mean that on average their CDOs had collateral that had undergone 3 securitizations: these assets would be CDOs containing CDO collateral which itself had CDO collateral). Avg. % Max % Largest Total # % of of of CDO of originator's Largest CDO collateral collateral Supplier Bank Tranches CDO Buyer of LEVEL from from to in any bonds in Bank’s CDOs own own Bank’s CDO own CDOs CDOs CDOs CDOs BoA 7 1.2% 12.8% 6.3% Citigroup Bank of 3.00 America Barclays 2 0.2% 0.9% 22.4% Merrill Lynch Barclays 2.79 Capital Bear 10 0.5% 0.3% 4.6% Citigroup Bear 3.94 Stearns Stearns Calyon 10 0.3% 1.9% 10.2% Merrill Lynch Calyon 3.73 Citigroup 117 1.7% 11.1% 32.5% Citigroup Citigroup 4.17 Credit 15 0.9% 7.4% 7.2% Merrill Lynch Credit 2.07 Suisse Suisse Deutsche 6 0.2% 3.8% 1.6% Merrill Lynch Deutsche 1.62 Bank Bank Dresdner 1 0.0% 0.2% 2.2% Citigroup Dresdner 4.91 Bank Bank Goldman 41 0.9% 5.0% 34.5% Goldman Sachs Goldman 2.32 Sachs Sachs JP 2 0.3% 1.0% 5.3% Merrill Lynch JP 2.79 Morgan Morgan Lehman 7 0.2% 1.1% 4.4% Merrill Lynch Lehman 2.99 Brothers Merrill 384 3.4% 15.3% 59.3% Merrill Lynch Merrill 4.79 Lynch Lynch Morgan 1 0.1% 0.7% 1.0% Citigroup Morgan 2.13 Stanley Stanley RBS 15 0.4% 3.3% 4.3% Merrill Lynch RBS 5.32 UBS 10 0.4% 6.3% 3.3% Merrill Lynch UBS 1.27 Wachovia 18 0.8% 4.1% 17.1% Goldman Sachs Wachovia 2.05 WestLB 7 0.0% 0.0% 0.0% Goldman Sachs WestLB 2.19 29
  • 30.
    While the investmentbanks earned what they thought to be “riskless” profits from CDOs, they were actually loading up on more CDO risk than they realized thanks to so- called “super senior” tranches, created in part to generate even higher-yielding AAA tranches for CDO investors. To manufacture a super senior tranche, the AAA portion of a CDO was chopped up into smaller AAA tiers, enabling the “subordinate” AAA tranche to yield more and the “super senior” AAA tranche to carry an extremely low level of credit risk. Many banks found it convenient to simply retain the super senior tranches, as the Basel Accords imposed only a small capital charge for AAA securities.36 In addition, a significant amount of super senior exposure was retained not by choice, but rather because underwriters had difficulty selling these bonds.37 While certainly not all CDO underwriters held super senior tranches, a JP Morgan report released in 2007 estimated that banks alone held around $216 billion worth of super senior tranches of ABS CDOs issued in 2006 and 2007.38 Many of these banks were untroubled by the increasing amounts of SS exposure on their books, assuming that the risk of default was almost zero; as one economist described it: In order to cause a hit on a super senior tranche, the economy has to turn down so heavily that it is very likely that problems will have reached a level where an upper senior swap hit is just the tip of the iceberg of a heavy global financial crisis.39 36 In the beginning days of CDOs, it was common for underwriters to keep the most junior or equity piece of their CDOs as a way to protect against adverse selection and moral hazard. However, the Basel Accords imposed a 100% capital charge against equity tranches, deterring banks from holding these bonds. 37 Krahen and Wilde (2005) gave a warning to regulators in 2005 about the increasing number of banks retaining senior tranches, saying that: “To the extent that senior tranches absorb extreme systematic losses, banks should be encouraged to sell these tranches to outside investors. In the interest of financial system stability, these outside buyers of bank risk should not be financial intermediaries themselves. Only if this requirement is fulfilled will the bank and the financial system be hedged against systematic shocks. Since this is supposedly one of the macroeconomic objectives of regulators, one would expect that regulatory requirements stipulate the sale of senior tranches, rather than encouraging their retention. 38 Quoted in: “Super-senior blundering.” The Economist, December 6, 2007. 39 Bluhm (2003), pg. 2. 30
  • 31.
    Some banks simplychose to “forget” certain super senior tranches for the purposes of risk-management – assuming that the risk of default was so insignificant that they could be treated as if they were perfectly hedged. Other SS tranches were only partially hedged – usually by way of credit-default swaps.40 However, this method of hedging left the banks exposed to counter-party risk from other financial institutions. UBS explains how partially hedged CDOs led to 63% of their CDO write-downs: “we used a hedging methodology that enabled [the CDO desk] to buy relatively low levels of market loss protection but consider the position as fully hedged.”41 In the end, these positions, once considered “riskless,” were responsible for creating the majority of bank’s write-downs. After reporting a $7.9 billion dollar write-down in the third quarter of 2007, Merrill Lynch described their rationale behind the $13.6 billion in SS tranches they kept, saying, The bottom line is that we got it wrong by being over-exposed to subprime. As the market for these (subprime) securities began to deteriorate, we began substantially reducing our warehouse risk by constructing CDOs and retaining the highest parts of the capital structure, which we expected then to be more resistant to market disruptions in terms of both liquidity and price…our hedging of the higher-rated tranches was not sufficiently aggressive nor was it fast enough.42 The survival of some of Wall Street’s big investment banks became bound to the quality of their CDO underwriting. Figures 12 and 13 give a snapshot of different underwriters’ CDOs. The first shows the amount of subprime and CDO collateral used by specific underwriters and the second shows the realized default rates of underwriters’ 40 Many banks actually obtained this protection by issuing its own CDS contracts through off-balance sheet conduits, which sold the bank CDS contracts and pooled the obligations into an SIV, issuing asset-backed commercial paper (ABCP) against them. These ABCP conduits had to be taken back on-balance sheet when the market for commercial paper dried up. 41 UBS had three categories for CDO hedging. In negative basis trades, they bought 100% protection, but were exposed to counterparty risk. Amplified mortgage portfolio (AMPs) trades were partially hedged, and the remainder was unhedged in anticipation of buying protection before the market crashed. 42 Merrill Lynch 3Q Earnings Conference Call. Oct. 27, 2007. 31
  • 32.
    CDOs. While thebanks with the highest combined amounts of CDO and subprime assets, Merrill Lynch, Citigroup, and Lehman Brothers, took write-downs of $51.2, $46.8, and $15.3 billion as of November 2008,43 the superior performance of Goldman Sachs has mirrored that of its CDOs. CDO losses have spread far beyond the investment banks on Wall Street, affecting every pool of investment money from pension funds to Norwegian villages.44 The ultimate principal losses on these CDO positions will not be known until the CDO bonds mature or are liquidated,45 but the mark-to-market losses have been staggering.46 The massive write-downs of AAA CDO positions has caused irreparable damage to many financial institutions, helping to destroy Merrill Lynch, and leaving others like AIG and Citigroup on the brink of disaster.47 While much has been written about why market participants made crucial misjudgments about CDO risk,48 it is still unclear how their mistakes resulted in the exponential losses that have wrought havoc on the global economy. In this paper, I show that it was a combination of poor collateral quality, lax underwriting standards, and inaccurate credit ratings that allowed the construction of a trillion-dollar CDO “house of cards.” 43 Source: Asset-Backed Alert, November 18, 2008. 44 In the CNBC documentary, “House of Cards,” reporter David Faber travels to the small town of Narvik, Norway, which invested $200 million in American CDOs, lured in by their AAA ratings and the assurance by Citigroup of their safety. These CDO bonds are now essentially worthless, and the town has had to close schools, slash expenditure to the elderly, and cut back on fire department hours. The Mayor of Narvik says that she has “learned not to trust nice man in Armani suit,” although this lesson has come too late to save her city’s budget. 45 Some CDOs that experienced an event of default have chosen not to liquidate their assets, hoping that the housing market will eventually recover. According to Moody’s CDO research, as of June 2008, only 38 CDOs had been liquidated, out of 758 CDOs (including both ABS and cash CDOs) that had experienced an event of default (EOD). 46 FASB 157 requires many financial institutions to mark their positions at “fair value,” defined as “the price that would be received to sell an asset or paid to transfer a liability in an orderly transaction between market participants at the measurement date.” As the market for CDOs dried up, positions had to be marked to “fire-sale” prices, leading to the billions in paper losses. There has been an active debate surrounding mark-to-market accounting, but the SEC decided in December 2008 not to suspend the practice. 47 AIG suffered mainly from having sold CDS protection on senior CDO tranches, valuing them with their own faulty models. Citigroup’s troubles have been mainly a result of having to take their SIVs back on their balance sheet, many of which contained senior CDO tranches. 48 For an overview of the credit crisis, see Brunnermeier (2008), Gorton (2008), and Calomiris (2008). 32
  • 33.
    Figure 12: Percentof Underwriters’ CDO Assets that are Subprime or CDO This Figure plots the percent of collateral that is classified as CDO or subprime in all deals underwritten by the bank. Source: S&P CDO Interface, Lehman Live. Figure 13: Performance of Underwriters’ CDO’s This Figure plots the percent of CDO collateral that had defaulted as of December 2008 broken down by underwriter. Source: S&P CDO Interface, Lehman Live. 33
  • 34.
    3. Questions andHypothesis Development In the following sections of this paper, I conduct a broad investigation of the factors that engendered the rise and fall of the CDO market – a process that has destroyed the credibility and the financial strength of some of the world’s largest financial institutions. While there has been a wealth of opinions from the media, politicians, economists, and market practitioners about what went wrong with CDOs, there is a noticeable absence of empirical analysis surrounding the CDO market. This is most likely due to the difficulty in obtaining data as well as the complexity of CDO securities. The purpose of this paper is to use empirical data to provide one of the first windows inside the world of CDOs, looking at the factors that can explain their poor performance as well as the roles played by underwriting banks, collateral originators, and credit rating agencies. This broad analysis, meant to clarify some of the mystique currently surrounding the arcane CDO market,49 will focus on three guiding questions: 1) How much of the poor performance of CDO securities is explained by the properties of their assets and liabilities?; 2) Has CDO performance varied across different underwriters and collateral originators?; and 3) How well did original CDO credit ratings forecast realized performance? In order to answer these questions, it is necessary to find a variable that quantifies CDO “performance.” Since there is no direct measure of CDO loss available, I will use two different dependent variables as proxies for CDO performance.50 The first measure is the percentage of CDO collateral that has defaulted as of December 2008, calculated as 49 CDOs are most commonly referred to in the popular press as “toxic assets” or “highly complex securities,” with little explanation of why they are toxic or what makes them so complex. 50 If it were possible to calculate an accurate measure of loss for a CDO, the banks would arguably not be facing many of the current problems in regards to CDOs. One of the major problems facing financial institutions is the challenge in putting a present value on their CDO holdings. 34
  • 35.
    the par valueof defaulted securities over the total par value of the CDO collateral. There are several weaknesses with using asset defaults as a proxy for CDO performance. First, CDOs are actively managed instruments that buy and sell collateral; the identity of the collateral applies to a specific point in time and does not necessarily represent the collateral at issuance or the collateral that will be present at the time the CDO is terminated. Second, losses on specific tranches depend not only on the performance of the CDO collateral, but also on the liability structure of the CDO; tranches from CDOs with a high level of defaulted collateral may nevertheless be paid in full depending on the amount of subordination they have to absorb losses. Lastly, the actual monetary losses in a CDO will depend not only on the number of assets that have defaulted, but also on the recovery rate of those assets. For instance, it is possible that some defaulted assets may recover much of their value after their underlying collateral is seized and liquidated. The second measure of performance used in this study is the severity of credit rating downgrades of the CDO tranches. This measure of performance has an obvious weakness: the accuracy of credit ratings is highly questionable and downgrades may not translate into actual losses. Despite these weaknesses, using both defaults and downgrades as a proxy for CDO performance can give a general idea of the expected losses that will eventually materialize for a CDO transaction. I will now outline the specific questions and hypotheses that guide the remainder of my analysis. 35
  • 36.
    3.1 General CDOcharacteristics A CDO is essentially a corporate entity, constructed to purchase assets and sell the cash flows to investors. Like any business, the properties of a CDO’s assets and liabilities will affect its ability to remain solvent and generate a profit for its equity holders. CDO assets can include any type of fixed-income security, but my analysis focuses on a specific type of CDO that invests in asset-backed securities, which are themselves structured products backed by collateral assets such as mortgages, credit-card payments, or even other CDO bonds. The liabilities of a CDO are the bonds it issues to fund its asset purchases, and consist of a series of “tranches” with unique risk and return profiles. The most senior tranches are paid before subordinate tranches, with the equity tranche exposed to the first losses. The types of assets held by a CDO as well as their issuance date (“vintage”) are likely to explain much of the variation in CDO performance. First, it is widely known that residential mortgage collateral has performed poorly, caused by a combination of declining underwriting standards by mortgage originators and the collapse in home values [Mayer et. al. (2008), Gan (2006), Mian et. al. (2008)].51 Hypothesis 1A: “The Housing Effect” Increasing exposure to residential mortgages, specifically subprime and Alt-A RMBS, is associated with worse CDO performance as measured by defaults. 51 For example, The Federal Reserve Board found that “the main factors underlying the rise in mortgage defaults appear to be declines in house prices and deteriorated underwriting standards, in particular an increase in loan-to-value ratios and in the share of mortgages with little or no documentation.” 36
  • 37.
    Second, collateral from2006 and 2007 vintages is expected to show worse performance. In addition to the declines in underwriting standards during 2006 and 2007, these assets have had little time to amortize, leaving a greater amount of their principal at risk of defaults associated with the overall deterioration in economic conditions. Furthermore, liquidity for refinancing has dried up due to the credit crunch, leaving fewer options for troubled borrowers and exacerbating the effects of interest rate increases. Hypothesis 1B: “The Vintage Effect” Increasing exposure to 2006 and 2007 vintage collateral, particularly assets with floating interest rates, is associated with worse CDO performance as measured by defaults. Lastly, increasing complexity in CDO assets might be associated with poor performance. Increasing the complexity of CDO assets makes it harder for investors to perform accurate risk assessments, increasing the likelihood that bad assets go unnoticed or overall risk is underestimated. Multiple repackaging of structured products increases this complexity, and Coval, Jurek, and Stafford (2009) show that losses become exponentially more sensitive to small imprecision in evaluating the probability of default on the underlying collateral with each new round of securitization. Hypothesis 1C: “The Complexity Effect” Increasing the amount of synthetic collateral, the amount of pre-securitized CDO collateral, and the overall number of collateral assets is associated with worse CDO performance as measured by defaults. 37
  • 38.
    The liability structureof a CDO can be as unique as its asset pool, with variation in the number and sizes of the tranches, the rules for distributing proceeds (the “waterfall”), the credit support of the tranches, and the coupon payments offered to various note holders. The size and subordination levels of the individual tranches will affect their performance, as measured by the severity of credit rating downgrades, as these factors determine the amount of asset losses a certain class of note holder must absorb. It is also possible that the overall CDO default rate might be associated with certain liability characteristics, such as the number of tranches issued or the overall size of the deal. 3.2 Underwriters and Originators The underwriter of a CDO, often an investment bank, plays a central role in the development and marketing of the CDO, earning a fee for its service and often retaining some of the CDO securities. The underwriter is responsible for structuring the tranches, setting criteria for the collateral assets, and making sure that the risks are appropriately communicated to investors. The amount of due diligence conducted by the underwriter is likely to influence the ultimate performance of the CDO transaction. Hypothesis 2A: “The Underwriter Effect” Holding constant general CDO characteristics, CDO performance varies based on the underwriting bank. 38
  • 39.
    While certain banksmight have been “better” CDO underwriters for unknown reasons, it is possible that the variation in underwriting standards is a function of the size of the bank’s CDO business. For instance, the most aggressive CDO underwriters may have spent less time understanding each transaction, decreasing their level of due diligence. It is also possible that very small CDO underwriters had less experience in understanding CDOs, causing less accurate risk-assessments. Hypothesis 2B: “The Size Effect” The performance of an underwriter’s CDOs varies according to the size of their CDO business, with overly-aggressive or very inexperienced banks issuing worse CDOs, as measured by their ex-post defaults and rating downgrades. In addition to the CDO underwriter, an equally important party in determining the success of a CDO is the originator of its collateral assets. I will limit my examination to originators of residential mortgage collateral; these originators range from small residential mortgage banks to the same large investment banks underwriting the CDOs. The lending standards of the originating entity will affect the ultimate performance of the CDO assets. Hypothesis 2C: “The Originator Effect” Controlling for the type of mortgages issued, as measured by average FICO, CLTV, and DTI scores, the performance of a CDO depends on the specific entities that originated its collateral assets. 39
  • 40.
    Lastly, I willlook at whether CDO performance was affected by the emergence of banks that acted as both CDO underwriters and collateral originators. This became the norm as the market for CDOs exploded, with new issuance limited only by the underwriter’s ability to access fresh collateral, in particular the high-yielding RMBS securities so sought after by CDOs. It is not a coincidence, therefore, that the biggest CDO underwriters either had an in-house mortgage business or acquired a mortgage bank subsidiary. In addition to repackaging their own mortgage collateral, underwriters also used retained tranches of their previous CDO transactions as assets for new CDOs. It is reasonable to assume that a CDO underwriter would have had inside information about its own assets, leading to a situation of asymmetric information between the underwriting bank and the investors. It is unclear whether this asymmetry would lead to better or worse selection in CDO collateral. On the one hand, the CDO underwriter might choose the best collateral for its CDOs in order to uphold its reputation and encourage investors to continue buying its CDOs. However, the asymmetric information problem could lead to adverse selection or moral hazard, causing worse performance in CDOs with collateral issued by the underwriting bank. It seems likely that banks might use CDOs as a vehicle to unload unwanted assets from their balance sheet – the lack of transparency in the CDO allowing bad assets to go unnoticed by investors. Furthermore, if the bank is also the servicer of the asset, it might have less incentive to monitor its performance after it has been sold, leading to a moral hazard problem. Several papers find evidence of adverse selection and 40
  • 41.
    moral hazard associatedwith the securitization of loans [Gan (2006), Mian et. al. (2008), Drucker (2008)].52 Hypothesis 2D: “The Asymmetric Information Effect” CDO performance will be affected if it contains collateral originated by its underwriter, although the performance might improve or decline, depending on the importance of reputation vs. adverse selection and moral hazard. 3.3 Credit Ratings Perhaps the most important players in the CDO market were the credit rating agencies, whose ratings helped investors to gauge the risk of CDO bonds. There are two main rating methodologies used in rating CDOs: 1) the binomial expansion technique (BET); or 2) Monte Carlo simulations.53 In both methods, rating agencies simplified their models to require only five inputs on the underlying CDO collateral: current credit rating, maturity, asset type, country, and industry. These inputs are then used to determine the three assumptions that went into the loss model: default probability, recovery rate, and asset correlation. The CRAs have been widely blamed for mis-rating CDOs [Griffin et. al. (2008), Mason et. al. (2007), Benmelech et. al. (2008), An et. al. (2006)].54 The SEC 52 Gan et al. (2006) shows that mortgage servicing is more efficient in deals where servicers have retained an equity stake. See Mian et al. (2008) and Keys et al. (2008) for empirical evidence that increased securitization caused a decline in loan quality. Drucker et al. (2008) show that when an underwriter declines to submit a bid at a secondary market sale, delinquent loans are up to four times more likely to be reported as missing their next payment and that when they do bid on the securities, the underlying mortgage pools have higher payoff rates in the subsequent four months. 53 See BIS Working Paper 163 for a detailed explanation of ratings methodologies. 54 Griffin and Tang (2008) explore what drove the mismatch between initial CDO credit ratings and subsequent performance, and find evidence of assumption errors, misleading inputs, and conflicts of interests playing a role in CDO ratings. Mason and Rosner (2007) investigate CDOs backed by non-agency MBS and find that even investment grade rated CDOs experience significant losses as a result of home price depreciation. Benmelech and Dlugosz (2008) examine collateralized loan obligations (a specific type of CDO backed by whole loans) and find a mismatch between the rating of CDO tranches and the credit quality of the underlying assets, saying that “while the credit rating of the majority of tranches is AAA, the 41
  • 42.
    investigated claims againstthe rating agencies and found significant problems, observing that “there was a substantial increase in the number and complexity of RMBS and CDO deals since 2002, and some of the rating agencies appear to have struggled with the growth,” and that “significant aspects of the ratings process were not disclosed, including the rationale for deviations from their models.” Most troubling, they found extensive evidence that employees were aware of the shortcomings in their models, but did nothing about them. For instance, one employee wrote an email about how the rating agencies were creating an “even bigger monster – the CDO market. Let’s hope we are all wealthy and retired by the time this house of cards falters. ;)”55 In this section, I will investigate four major questions surrounding CDO credit ratings: 1) What factors were important in determining initial CDO credit ratings?; 2) What factors have driven the wave of CDO downgrades?; 3) How well did original collateral asset and CDO tranche ratings predict performance?; and 4) What factors explain the mistakes made in forecasting performance? To answer the first question, I will look at the percent of each CDO that was given a AAA rating by Fitch, S&P, and Moody’s. When rating CDOs, it has been found that the rating agencies relied almost exclusively on the prior ratings of the underlying collateral, without making sufficient distinctions for different asset types.56 average credit rating of the collateral is B+”(Benmelech 1). Finally, An et. al. (2006) examine the subordination levels in commercial mortgage-backed securities (CMBS) and find that expected losses can explain less then 30% of the variation in subordination levels, indicating the difficulty in determining appropriate subordination for structured finance tranches apriori. 55 Summary Report of Issues Identified in the Commission Staff’s Examinations of Select Credit rating Agencies (2008). 56 The SEC report found that the credit analysis “does not include an analysis of the underlying asset pools in the RMBS,” instead relying on the underlying assets’ prior credit ratings. 42
  • 43.
    Hypothesis 3A: “RecycledRatings Effect” The most important factor in explaining initial levels of AAA given to a CDO are the credit ratings of their collateral pool. Another factor that might affect the initial percent of AAA assigned to a CDO is the number of rating agencies rating the deal. Multiple ratings might have encouraged the agencies to spend more time judging the risks, causing a more conservative rating. However, it might also be the case that the CRAs were worried about “ratings shopping,” causing more liberal ratings when they knew another agency was also rating the deal, in fear that they would loose business if their rating were less desirable than their competitors. Hypothesis 3B: “Peer Pressure Effect” The % of AAA given to a CDO will depend on the number of rating agencies rating the deal. In looking at the tranche downgrades, it has been noted that the senior tranches have been disproportionately affected by CDO losses, due to the sensitivity of these tranches to initial risk miscalculations [Heitfield (2008)].57 57 Heitfield (2008) shows the sensitivity of different tranches to changes in correlation and probability of default inputs in a Gaussian Copula model, and finds that CDO notes with greater seniority are more sensitive to model parameters that describe the distribution of collateral losses. He notes that, “even small errors in estimating these parameters have significant effects on measures of credit risk for senior CDO notes. Typically, it is more difficult to estimate such parameters when collateral defaults are rare”(Heitfield 37). 43
  • 44.
    Hypothesis 3C: “SeniorityEffect” Controlling for the default rate of the CDO collateral, senior tranches have experienced more severe downgrades. To answer the third question, I will first look at how well CDO collateral asset ratings predicted asset default rates. It is likely that lower initial collateral ratings of certain asset classes (such as subprime) translated into more realized defaults. Hypothesis 3D: “The Asset-Class Effect” The realized defaults associated with a given credit grade varies based on the asset type. In addition to looking at the predictive power of the collateral ratings, I will look at how the AAA losses relate to the initial percent of the CDO rated AAA. As a proxy for AAA losses, I will use the default rate on the collateral assets minus the current amount of AAA subordination. Hypothesis 3E: “The Super-Senior Effect” Rating agencies were overly optimistic in giving AAA ratings. CDOs given more initial AAA ratings, in terms of number of AAA tranches and percent of the transaction rated AAA, are now exposed to larger losses. Lastly, I will look at the factors that explained the difference between the collateral default rate predicted by its credit ratings and the realized default rate. The results to all four questions in this section will help to address the possibility that there might be a conflict of interest arising from the fee system of the rating agencies. Many 44
  • 45.
    people have allegedthat this system, in which the rating agencies are paid directly by the banks whose products they are rating, gives them an incentive to assign more “desirable” ratings to the products of their biggest clients, in order to retain market share and continue to drive business. 58 For example, the SEC investigation concluded that analysts appeared to be aware, when rating an originator’s products, of the rating agency’s business interest in securing the rating of the deal and the importance of increasing market share.59 Hypothesis 3F: “Conflicts of Interest” Conflicts of interest caused by the fee system of credit ratings would result in more aggressive initial ratings, subsequently more downgrades, and worse accuracy in prediction for the CDOs of large underwriters. If these conflicts exist, we would expect the results to questions (1)-(4) to depend on the amount of business done between the CDO underwriter and the rating agency, 58 Several people have conducted studies regarding conflicts of interest at the CRA’s. Covitz (2003) finds that reputation incentives outweigh the desire to please big originators and that conflicts of interest are not a problem. 59 Summary Report of Issues Identified in the Commission Staff’s Examinations of Select Credit rating Agencies (2008). 45
  • 46.
    4. Regression Analysis This section uses multivariate regression analysis to answer the questions and hypotheses outlined in Section 3. Each sub-section corresponds to one of my three guiding questions: 1) How much of the poor performance of CDO securities is explained by the properties of their assets and liabilities?; 2) Has CDO performance varied across different underwriters and collateral originators?; and 3) How well do the CDO credit ratings capture their performance? 4.1 Data Description The data used in this study comes from several sources. The first source is LehmanLive, a web-based platform that provides access to Lehman’s (now Barclay’s) research and fixed income, credit, and equities markets analytics. This database contains detailed surveillance information on virtually the entire population of U.S. CDOs issued from January 1, 1999 through the present. The data used from this source consists of 735 ABS CDOs, and will be referred to as the “full sample.” The next source of data is the “OpenSource Model,” compiled by the hedge fund Pershing Capital Management, which contains detailed information on the 2005-2007 vintage ABS CDOs. While the data from this source only includes information on 430 of the 735 ABS CDOs in the full sample, it provides much more detail about each CDO in terms of their collateral composition. I refer to this dataset as the “high-information sample.” Lastly, the datasets were supplemented by information from S&P Ratings Direct, CreditFlux, and proprietary CDO research from UBS. 46
  • 47.
    Summary statistics forthe variables of interest are presented in Appendix A, as well as detailed definitions of these variables. Panel A describes variables that are observed at the CDO level; Panel B describes variables that are observed at the tranche level; Panel C describes variables that are observed about the assets within the CDOs; Panel D summarizes the CDOs of the top underwriting banks; and Panel E summarizes the RMBS collateral of the biggest RMBS originators of the CDO collateral. Appendix B gives the credit rating grades used by the three CRAs and translates them into numerical scores that I use throughout my analysis.60 4.2 The Effects of Asset and Liability Characteristics on CDO Performance Methodology To test for the effects of general CDO characteristics on CDO performance, I perform a number of regressions relating CDO asset and liability properties to CDO performance. These are shown in Table 6 (Panels A.1, A.2, and B). The OLS regressions in Panels A.1 and A.2 are run at the CDO level, using Default as the performance measure (the percent of defaulted collateral per CDO), while those in Panel B are run at the tranche level, using credit rating downgrades as the performance measure (translated into numerical notches according to the rating scale in Appendix B).61 As a robustness check, the OLS specifications are supplemented by Probit regressions using binary dependent variables: regressions (5) in Panels A.1 and A.2 use a dummy dependent variable, Default Dummy, that equals one if the CDO’s Default is higher than the median Default (16% for the full sample and 36% for the high-information sample), and zero 60 See Appendix C for the probability of default associated with the letter grades. 61 For CDO-level regressions, the unit of observation is the entire CDO transaction, while for tranche-level regressions, the unit of observation is a single CDO tranche. 47
  • 48.
    otherwise; regressions (2)and (4) in Panel B use a dummy variable, Downgrade Dummy, that equals one if the CDO tranche experienced a downgrade of any severity and zero if the tranche rating was upgraded or unchanged. All regressions are performed separately on the full sample and on the high-information sample. The high-information sample regressions contain more independent variables but fewer observations. Year fixed effect variables are added to control for changes in market conditions over the sample periods (1999-2007 for the full sample, 2004-2007 for the high-information sample). T-statistics and significance levels are computed using standard errors clustered by the CDO underwriter. Panel A.1 presents the results of the CDO-level regressions on Default and Default Dummy using the full sample of 735 CDOs. The independent variables describing the CDO’s liability properties are Original CDO Balance, Number of Tranches, Average initial CDO rating (a weighted average of the tranche ratings), and WAC (a weighted average of the tranche coupons). The independent variables describing the CDO’s assets include Number of assets, variables giving the percent invested in each asset class: HEL, CDO, RMBS, CMBS (Other is excluded),62 the percent of synthetic collateral (Synthetic), and the percent of collateral paying a fixed-rate coupon (Fixed Rate). The specification of the initial model is: (1) Defaulti = α + ß1(Original CDO Balance)i + ß2(Number of assets)i + ß3(Number of Tranches)i + ß4(Average Initial CDO Rating)i + ß5(WAC)i + ß7(IYear_) + εi 62 The full sample only divides residential mortgage securities into two buckets: HEL (home equity loan) securities include those backed by non-prime mortgages, while RMBS securities are those backed by prime mortgages. The high-information has seven RMBS categories, splitting the HEL category into securities backed by subprime, midprime, Alt-A fixed-rate, Alt-A ARM, HELOC (home equity line of credit), and CES (closed-end second) mortgages. 48
  • 49.
    Panel A.2 presentssimilar regressions, instead using the high-information sample of 430 CDOs. This sample includes more independent variables describing the CDO assets: RMBS and HEL securities are broken into seven asset classes (Prime, Midprime, Subprime, Alt-A Fixed Rate, Alt-A ARM, HELOC, and CES), and variables are added for the average initial credit rating of the collateral (Average Initial Collateral Rating) and the percent of the collateral issued in 2006 and 2007 (2006-vintage collateral, 2007- vintage collateral). Panel B of Table 6 presents the results of the tranche-level regressions relating asset and liability properties to tranche credit rating changes or Downgrade Dummy. The asset variables are the same as those in Panels A.1 and A.2, but the liability variables are replaced for tranche-specific variables: % Subordination (the initial level of the tranche’s credit support), Tranche Coupon, Original Tranche Balance, and % of Transaction (the size or “width” of the tranche). In addition, dummy variables are added to control for the initial rating of the tranche (AAA-Below IG). Results Overall, the regressions in Table 6 show the importance of CDO asset and liability properties in determining CDO performance – properties which account for approximately half of the variation in CDO defaults and credit rating downgrades. In terms of collateral defaults, the highest adjusted R-squared from A.1 is 41%, while in A.2, the additional detail provided by the high-information sample variables gives a value of 68%. In Panel B, the adjusted R-squared values from both samples show that the asset and liability properties explain 57-58% of the variation in tranche credit-rating changes. 49
  • 50.
    Looking at theliability variables, we see that Original Balance has a significant negative coefficient in Panel A.1, indicating that smaller CDOs performed worse after controlling for other factors. One interpretation might be that these smaller CDOs were made up of “left-over” assets from other transactions that the bank needed to dispose of and were not purposefully selected. However, the coefficient becomes less significant when we add the amount of synthetic and fixed rate collateral; this could still be consistent with the “left-over” interpretation if small CDOs had more synthetic collateral and were created by banks needing to hedge certain positions, or wanting to get rid of previously written CDS contracts. As expected, the amount of tranche subordination is negatively related to downgrades in Panel B, as is the size of the tranche, with thinner tranches experiencing more downgrades. The CDO coupon payment is only significant in the probit specifications of Panels A.1 and B, but they are positive, indicating that the market correctly demanded a higher yield for CDOs that were “riskier than average.” Lastly, the CDO’s initial credit rating is inversely proportional to defaults and is significant in Panel A.2, indicating that CDOs with more favorable credit ratings later faced more defaults; Panel B shows that the more senior CDO tranches have faced more severe downgrades. Turning to CDO asset characteristics, we find support for hypothesis 1A: there is a significant and consistently negative “housing effect,” with low quality RMBS assets associated with worse CDO performance. The coefficient on % HEL is highly significant in every specification, with an increase of one standard deviation (S.D.) in % HEL (25%) associated with an increase of 9% (or 1/3 of a S.D.) in Default and a two-notch increase in downgrades. The high-information sample splits HEL securities into more detailed 50
  • 51.
    categories, revealing thatit is specifically the Alt-A ARM mortgages that have the most pronounced effect on CDO performance. Panel A.2 of Table 6 provides support for the “vintage effect” of hypothesis 1B, showing that CDOs with more collateral from 2006 and 2007 have had increased defaults and the effect is significant in all specifications. The economic significance of the 2006-vintage collateral is worse than for 2007: when all the control variables are included, a one S.D. increase in % 2006-vintage collateral (29%) is associated with a 10% increase in Default, while increasing % 2007-vintage collateral by one S.D. (13.5%) is associated with a 5% increase in Default. Also as predicted, we find that floating-rate collateral is associated with worse performance, although the coefficient is only significant in the probit specifications. Lastly, there is a negative “complexity effect,” as predicted by hypothesis 1C: the coefficients on Number of Assets, % Synthetic, and % CDO are all positive. A higher number of CDO assets is associated with higher Default and more rating downgrades, supporting the interpretation that a larger number of assets made it easier for bad assets to go unnoticed by decreasing the CDO’s transparency. The coefficient is statistically significant, except when % Synthetic is added in Panels A.1 and A.2. However, since % Synthetic is also related to the level of complexity in the CDO, perhaps this variable now picks up the negative “complexity effect.” Both % Synthetic and % CDO are associated with worse performance in most specifications, although the coefficient on %CDO is not consistently significant. Taken together, the results in Table 6 indicate that adverse CDO performance was due primarily to the inclusion of poor quality 2006 and 2007-vintage RMBS assets backed by subprime and Alt-A ARM mortgages, assets whose risks were easily overlooked amidst the high level of complexity in the CDOs. 51
  • 52.
    Table 6: Determinantsof CDO Performance - General CDO Characteristics Panel A: Results based on Collateral Defaults These tables present the results of the regressions for section 5.1. The dependent variable “Default” refers to the percent of the CDOs collateral in default as of January 2009. All regressions are OLS except for (5), which uses a Probit regression on a dummy variable that equals 1 if the variable “Default” is greater than the median “Default” (16% for the full sample and 36% for the high-information sample), and zero otherwise. The unit of observation is the entire CDO, thus no tranche-specific variables are included. Standard errors are clustered by CDO Underwriter. Coefficients are significant at the +10%, *5%, **1% significance level. 1. Full-Sample Results, n = 735 (1) (2) (3) (4) (5) Dependent variable: Default Default Default Default Default Dummy REGRESSOR: OLS OLS OLS OLS Probit Original CDO Balance -.000073** -0.0001** -0.0001** -0.00003* -0.00007 (.000017) (0.00002) (0.00001) (0.00001) (0.00004) Number of assets .0007799** 0.00059** 0.00042* 0.00017 0.00032 (.000146) (0.00016) (0.00016) (0.00019) (0.00047) Number of Tranches -.00736 0.00006 0.00263 0.0071+ 0.01159 (.00482) (0.00563) (0.00444) (0.00389) (0.01155) Average initial CDO rating -0.00411 -0.009 -0.01119 -0.01044 -0.01005 (0.01061) (0.00952) (0.0092) (0.00995) (0.02744) WAC -0.00371 -0.00234 0.00243 0.0010 0.04598* (0.0114) (0.01106) (0.01027) (0.00787) (0.02154) % HEL __ 0.29273** 0.23393** 0.35219** 0.84396** (0.06171) (0.06739) (0.05559) (0.16486) % CDO __ 0.06614 -0.02133 0.08007 0.20596 (0.07051) (0.0751) (0.05959) (0.16726) % RMBS __ __ -0.1149* 0.03151 0.38458+ (0.04948) (0.05568) (0.21857) % CMBS __ __ -0.3208** -0.16394* -0.50782 (0.07443) (0.07207) (0.31586) % Synthetic __ __ __ 0.32089** 0.70235** (0.1022) (0.21271) % Fixed Rate __ __ __ -0.04315 -0.17871+ (0.03438) (0.10663) IYear2001 0.08262* 0.04505 0.04106 0.05033 0.59573** (0.03833) (0.03472) (0.03682) (0.03415) (0.03617) IYear2002 0.02913 -0.03147 -0.03445 -0.04553+ 0.63248** (0.02875) (0.03062) (0.03128) (0.02483) (0.03531) IYear2003 0.04042 -0.05269 -0.03969 -0.07246 0.61793** (0.04430) (0.05422) (0.05554) (0.05078) (0.03684) IYear2004 -0.0006 -0.10759* -0.06889+ -0.1192** 0.71464** (0.03522) (0.03959) (0.03584) (0.02686) (0.03117) IYear2005 0.11137* -0.00424 0.03141 -0.04046 0.82197** (0.04753) (0.04773) (0.04433) (0.03438) (0.02464) IYear2006 0.24766** 0.13581** 0.16536** 0.057 0.92947** (0.05092) (0.047) (0.04658) (0.04527) (0.01756) IYear2007 0.42614** 0.30813** 0.33452** 0.21686** 0.84737** (0.05750) (0.05396) (0.04492) (0.0436) (0.02424) Intercept 0.06203 0.02461 0.05353 -0.02267 -0.02267 Regression summary statistics Adj. R2 0.3058 0.3600 0.3878 0.4125 __ SER 0.2280 0.2189 0.2141 0.2098 __ 52
  • 53.
    2. High-Information SampleResults, n = 430 (1) (2) (3) (4) (5) Dependent variable: Default Default Default Default Default Dummy REGRESSOR: OLS OLS OLS OLS Probit Original CDO Balance 0.00001 0.00002 -0.00002 0.0000 -0.0001 (0.00003) (0.0001) (0.0001) (0.0001) (0.00007) Number of assets 0.00072* 0.00041 0.00068* 0.00031 0.00209** (0.0003) (0.0003) (0.0003) (0.0002) (0.00076) Number of Tranches -0.00052 -0.00129 -0.00701 -0.004 -0.01008 (0.00804) (0.0046) (0.0094) (0.0045) (0.02023) Average Initial CDO Rating -0.046** -0.030** -0.040** -0.0258* -0.14894** (0.01275) (0.0105) (0.0116) (0.0098) (0.05571) 0.0507** 0.04174* 0.0644** 0.0478** 0.21422** Average Initial Collateral Rating (0.01823) (0.0171) (0.0156) (0.0149) (0.04342) -0.0036 0.00882 -0.00719 0.00743 0.03583 WAC (0.01279) (0.0118) (0.0143) (0.0111) (0.03751) 0.3645** -0.11709 __ -0.24477 -0.22927 % Subprime (0.12454) (0.2985) (0.2265) (1.576) 0.02609 0.10733 __ -0.10481 1.71031 % Alt-A Fixed Rate (0.21156) (0.2808) (0.2295) (1.72197) 0.702* 0.79671* __ 0.44669 3.72806* % Alt-A ARM (0.27614) (0.3528) (0.3004) (1.7405) 0.3711** 0.44547 __ 0.2154 1.57222 % CDO (0.08841) (0.3154) (0.2484) (1.63275) __ -0.28299 __ -0.37225 -0.00754 % Prime RMBS (0.2934) (0.2268) (1.70039) __ 0.35639 __ 0.23627 1.6933 % Midprime RMBS (0.2824) (0.2174) (1.51327) __ 0.5629 __ 0.25367 1.28413 % CES RMBS (0.3480) (0.2898) (1.51272) __ -0.05239 __ 0.90136 -7.31818 % HELOC (2.0859) (1.7005) (5.53717) __ -0.902** __ -0.996** -2.31828 % CLO (0.3068) (0.2453) (1.72703) __ -0.50936 __ -0.5851+ -0.16002 % CMBS (0.3816) (0.3094) (1.91292) __ -0.00529 __ -0.02481 -0.4151** % Fixed Rate (0.0337) (0.0383) (0.15021) __ 0.05301 __ 0.08675 0.35217 % Synthetic (0.0999) (0.0825) (0.23053) __ __ 0.4129** 0.3530** 0.79254** % 2006-vintage collateral (0.0449) (0.0352) (0.18029) __ __ 0.3065** 0.3932** 1.34165** % 2007-vintage collateral (0.0917) (0.0868) (0.39527) 0.0268 -0.0795* 0.01866 -0.0620* 0.77072 IYear2005 (0.033) (0.0321) (0.0265) (0.0289) (0.68969) 0.2441** 0.02278 0.05938+ -0.0913* 0.76903 IYear2006 (0.03711) (0.0376) (0.0315) (0.0359) (0.83893) 0.3948** 0.1846** 0.13432* -0.04017 0.75362 IYear2007 (0.04569) (0.0412) (0.0567) (0.0515) (0.67228) Intercept -0.3400* -0.04102 -0.2351+ 0.04292 __ Regression Summary Statistics Adj. R2 0.4478 0.6256 0.4859 0.6823 __ SER 0.2171 0.1752 0.2053 0.1614 __ 53
  • 54.
    Panel B: Resultsbased on Credit Ratings The dependent variables in these regressions are 1) the overall change in the tranche credit using notches outlined in Table 2, and 2) a dummy variable that equals 1 if the tranche has been downgraded, and equals zero if the rating was unchanged or upgraded. Dummy variables are included for the initial rating of the tranche. The observations here are the individual CDO tranches, making the sample size much larger than in Panel A. Standard errors are clustered by CDO Underwriter. Coefficients are significant at the +10%, *5%, **1% significance level. Full Sample High-Information Sample Dependent Variable Change in Downgrade Change in Downgrade credit rating Dummy credit rating Dummy (# Notches) (# Notches) REGRESSOR: OLS Probit OLS Probit -5.516** -0.142 -6.031** -0.036 % Subordination (1.24) (0.10) (1.20) (0.02) -0.091 0.017* -0.102 0.008** Tranche Coupon (0.07) (0.01) (0.06) (0.00) 1E-04 -6E-05 -0.001 -3E-06 Original Tranche Balance (0.00) (0.00) (0.00) (0.00) -3.847** -0.048 -2.653* -0.009 % of Transaction (1.06) (0.06) (1.27) (0.02) 0.013** 0.001** 0.010* 0.000** Number of assets (0.00) (0.00) (0.00) (0.00) -0.065 0.006 -0.069 -0.002 Number of Tranches (0.06) (0.01) (0.09) (0.00) 8.245** 0.618** % HEL (1.96) (0.15) - - 3.102+ 0.224* % RMBS (1.65) (0.11) - - -4.801** -0.041 -5.795 0.035 % CMBS (1.29) (0.08) (10.36) (0.09) 4.100* 0.267** 10.420 0.166+ % CDO (1.68) (0.09) (10.67) (0.10) 1.370* 0.091 0.470 -0.008 % Fixed Rate (0.67) (0.05) (0.86) (0.02) 2.948 0.226* -0.375 0.029* % Synthetic (2.07) (0.09) (0.74) (0.01) 3.214 0.105 % Subprime - - (10.33) (0.09) 1.106 0.114 % Alt-A Fixed Rate - - (10.85) (0.11) 26.939* 0.573** % Alt-A ARM - - (10.10) (0.18) -2.881 0.054 % Prime RMBS - - (10.94) (0.09) 11.411 0.187* % Midprime RMBS - - (10.20) (0.09) 17.252 0.229 % CES RMBS - - (10.71) (0.16) 28.985 1.060 % HELOC - - (18.68) (0.80) -10.741 0.002 % CLO - - (10.58) (0.10) -0.220 -0.007 Average initial collateral rating - - (0.32) (0.01) 0.254** 0.012** 0.106 0.008** Average current collateral rating (0.07) (0.00) (0.10) (0.00) 54
  • 55.
    Full Sample High-Information Sample Dependent Variable Change in Downgrade Change in Downgrade credit rating Dummy credit rating Dummy (# Notches) (# Notches) REGRESSOR: OLS Probit OLS Probit -2.379 -0.476** IYear2001 (2.04) (0.14) - - -5.003** -0.717** IYear2002 (1.52) (0.10) - - -6.329** -0.841** IYear2003 (1.51) (0.05) - - -6.556** -0.831** IYear2004 (1.63) (0.07) - - -3.661* -0.600** -0.301 0.008 IYear2005 (1.71) (0.16) (0.60) (0.01) -1.376 -0.468** 1.052+ 0.019+ IYear2006 (1.69) (0.15) (0.55) (0.01) -1.147 -0.550** 1.426* 0.024* IYear2007 (1.67) (0.17) (0.56) (0.01) Initial Tranche Rating Dummies 1.831+ -0.084 4.656** 0.000 AAA (0.96) (0.06) (0.64) (0.01) 1.064 3.969** 0.006 AA+ (0.86) (0.78) (0.01) 1.887* -0.016 4.188** 0.015 AA (0.88) (0.06) (0.47) (0.01) 1.673+ 0.051 3.076** 0.011 AA- (0.85) (0.04) (0.35) (0.01) -0.038 3.485** A+ omit (0.08) (0.91) -0.289 -0.055 1.608** 0.008 A (0.82) (0.07) (0.45) (0.01) -0.826 -0.109 1.417** 0.011 A- (0.94) (0.09) (0.42) (0.01) -1.135 -0.001 0.018** BBB+ (0.82) (0.06) omit (0.01) -1.477+ -0.046 -0.535 0.005 BBB (0.83) (0.06) (0.46) (0.01) -2.778** -0.222** -2.503** -0.074* BBB- (0.70) (0.09) (0.49) (0.05) -3.923** -0.357** -3.192** -0.145** Below IG (0.75) (0.10) (0.41) (0.06) 6.127** 4.895 Intercept (2.05) - (10.25) - Regression Summary Statistics Adj. R2 0.585 - 0.572 - SER 4.68 - 3.83 - n 4511 4511 2711 2711 55
  • 56.
    4.3 The Effectsof CDO Underwriters and Collateral Originators Next, I investigate the link between CDO performance and specific CDO underwriters and collateral originators. The first series of regressions looks at whether variation in CDO performance across underwriters is merely a result of the asset and liability properties of those CDOs, or whether the identity of the underwriter is a significant predictor of CDO performance after controlling for CDO properties (hypothesis 2A).63 To do this, I rerun certain regressions from Section 4.2, adding fixed effect dummies for the largest 17 CDO underwriters. Panels A.1 and A.2 of Table 7 rank the underwriters from 1-17 according to the performance of their CDOs (after controlling for the CDO characteristics), with 1 being the “best” underwriter and 17 being the “worst.” The regression specifications for (1) –(4) in Panel A.1 are identical to regressions (4)-(5) in Panels A.1 and A.2 of Table 6, and regressions (1)-(4) in Panel A.2 are identical to (1)-(4) in Panel B of Table 6, with the addition of the underwriter fixed effect dummies. The estimated regression coefficients are shown in parentheses underneath the ranking of the underwriter. The t-statistics used to calculate significance levels are based on standard errors clustered by the CDO underwriter. The results in Panel A support hypothesis 2A, showing evidence of an “underwriter effect” on CDO performance. The adjusted R-squared values of all regressions are higher with the added underwriter dummies than those from Table 6 – in A.1 (1), the value increases by 0.03 to 0.44, in (3) by 0.02 to 0.70, in A.2 (1) and (3) the value increases to by 0.01, to 0.59 and 0.58 respectively. The specific underwriter coefficients are most consistently significant for the best or the worst underwriters, and it 63 In other words, we want to ask whether Bank A’s CDOs were bad because, for example, they used bad assets (subprime) or whether their CDOs were worse than Bank B’s CDOs, who had the same amount of subprime. This would indicate a lesser ability or lower amount of due diligence on the part of Bank A. 56
  • 57.
    is interesting thatthe rankings based on Default are not always the same as those based on credit rating changes. Based on the rankings in A.1, we can say that the CDOs of Goldman Sachs consistently outperformed, and are associated with a decrease of 6% in Default after controlling for CDO asset and liability characteristics. Among the consistent underperformers are Morgan Stanley, Merrill Lynch, Deutsche Bank, and JP Morgan – JP Morgan’s CDOs are associated with a staggering 18% increase in Default on average, after controlling for CDO asset and liability characteristics. Panel B examines whether the size of the bank’s CDO underwriting practice is related to the performance of their CDOs (hypothesis 2B). In Panels B.1 and B.2 of Table 7, the underwriter fixed effect dummies are replaced with two variables describing the size of the CDO underwriter: Underwriter Market Share is equal to the number of CDOs underwritten by the bank divided by the total number of CDOs, and Par Value of Underwriter’s CDO Issuance is equal to the natural log of the total dollar balance (in millions) of all CDOs underwritten by the bank. The results of Panel B show evidence supporting the “size effect” of hypothesis 2B. The coefficients on Underwriter Market Share indicate that the more aggressive the underwriter, in terms of the number of CDOs issued, the worse their CDO’s performance. However, the coefficient on Balance of Total Issuance is consistently negative, indicating that for a given level of aggressiveness, more CDO issuance is better. The interpretation of this result is ambiguous, but it could support the experience portion of hypothesis 2B, namely that CDO quality improves with the experience of the underwriter. Taken together, the results of Table 7 provide strong evidence in favor of an “underwriter effect,” and suggest that at least part of the variation 57
  • 58.
    in CDO underwritingquality was due to the size of the bank’s CDO business, with larger banks underwriting lower quality CDOs. The next series of regressions ranks specific RMBS originators based on the performance of CDOs containing their collateral (hypothesis 2C). Originator variables are created for the largest 56 RMBS originators in the high-information sample CDO asset pools, equal to the percent of the CDO’s assets they issued. Table 8 shows the rankings of the RMBS originators, based on the same regression specifications as Table 7, replacing the underwriter dummy variables with the RMBS originator variables. In addition, control variables are added for the average FICO, DTI, and CLTV of the RMBS collateral, whose coefficients are shown at the bottom of Panel A. The results of these rankings indicate the effect of a specific originator’s collateral on CDO performance, holding constant the observable characteristics of their mortgages. Like the rankings of the CDO underwriters, it is noteworthy that the rankings of the originators are different according to the regressions based on Default and those based on credit ratings. For the analysis here, I will again focus on the Default rankings, saving the analysis of credit rating accuracy for section 4.4. There are only a few originators that show statistically significant effects on CDO performance, indicating that most of the originator effects are a result of observable characteristics of the mortgages they issued, rather than a difference in originator ability or due diligence. In particular, the coefficient on the average CLTV of the originator’s mortgages is significant and positive, confirming that CDOs containing RMBS collateral with high combined loan-to- value ratios have been adversely affected. Even after controlling for FICO, DTI, and CLTV, there are several originators that are associated with significant 58
  • 59.
    underperformance in termsof CDO defaults. CDOs with more collateral issued by HSBC, Cairn, Deutsche Bank, and RALI (owned by GMAC), all experienced higher levels of defaults, controlling for other CDO asset and liability characteristics. Overall, Table 8 provides only weak support for a specific “originator effect” proposed in hypothesis 2C. In Table 9, I explore the relationship between banks that acted as both CDO underwriters and as suppliers of CDO collateral, specifically looking at the effect of banks “rolling over” their CDO tranches into new CDOs (hypothesis 2D). I introduce interaction terms into the regression analysis, equal to the percent of CDO collateral that is invested in CDO bonds underwritten by the same bank underwriting the current CDO. The regression specifications are identical to those run on the high-information sample in Table 7, with the addition of the interaction terms. Table 9 gives the coefficients on both the underwriter fixed effect dummy (F.E.) as well as the interaction term measuring the effects of re-used collateral from the underwriter (Int.). The fixed effect coefficient reflects the overall effect of a certain underwriter on CDO performance (due to their ability, due diligence, and other unobservable factors), while the interaction terms show whether the underwriter’s CDOs are improved or weakened by using their own CDO bonds as collateral. Like the results in Tables 7-8, the results that use Default as the dependent variable do not match those that use credit rating changes. Basing the analysis on the Default results, we see that the effect of an underwriter using its own collateral (for which it is assumed to possess an informational advantage) is contingent on the specific underwriter, with some interaction coefficients positive and others negative. For 59
  • 60.
    underwriters with negativeinteraction coefficients, the over-riding incentive seems to be maintaining their reputation, with the asymmetric information situation leading to higher quality CDOs (thus a lower value for Default). This is the case for Barclays, Bear Stearns, Calyon, Credit Suisse, Lehman Brothers, and RBS. Note that this does not mean that these bank’s CDOs showed better performance overall, only that the additional effects of using their own collateral enhanced CDO performance. For example, Bear Stearns had an overall adverse effect on its CDOs, which were associated with a 9% increase in Default; however, among the Bear Stearns CDOs, those that used in-house CDO collateral performed relatively better than its other CDOs. Unlike the banks with a “positive asymmetric information effect,” the interaction terms of other banks support the theories of adverse selection and moral hazard: the CDOs of Bank of America, Citigroup, Goldman Sachs, JP Morgan, and Morgan Stanley were adversely affected by the inclusion of in-house CDO collateral. Incorporating all of the results from Tables 7-9, we can say that while the actions of the CDO underwriters had a big effect on the performance of their CDOs, the specific identity of the collateral originator was not as important as the characteristics of the mortgages they issued. The fact that the “underwriter effect” is more important in determining CDO performance than the “originator effect” could be due to the relatively high level of time and expertise needed to structure CDOs as compared to issuing mortgages. While Table 7 distinguishes among the best and worst CDO underwriters, it does not explain why some of these banks were destroyed by CDO write-downs while others remained untainted by ABS CDOs. It is impossible to directly explain the ABS CDO 60
  • 61.
    write-downs of specificbanks, as they have not disclosed the exact nature of their exposures. It is possible that bank CDO write-downs are completely unrelated to their own CDO underwriting if they did not retain their own securities and/or bought CDOs from other underwriters. However, the anecdotal evidence in Section 2 suggests that for the banks hit worst by CDO write-downs, the bulk of the blame fell on retained CDO securities from their underwriting business. To further clarify the link between CDO underwriting quality and ultimate write-downs, I perform regressions looking at the ABS CDO write-downs (as of February 2009) of the 17 largest CDO underwriters. The dependent variable used is the dollar value of the bank’s write-downs divided by the bank’s total assets at year-end 2007. Independent variables (shown in all capital letters) are calculated by taking the dollar-weighted average of the CDO independent variables using all of the underwriter’s CDOs. The specification used for the initial model is: (2) (Write-down/Total Assets)i = α + ß1DEFAULTi + ß2DOWNGRADEi + ß3AAASUBi + ß5YR2005i + ß6YR2006i + ß7YR2007i + εi The variables YR200_ represent the total CDO issuance of each underwriter in the given year. The results of these write-down regressions are presented in Table 10. These regressions show that bank write-downs are surprisingly unrelated to the quality of their own CDOs, as measured by the average DEFAULT and DOWNGRADE of their CDOs. In fact, the most significant predictor of CDO write-downs is the dollar amount of CDOs a bank underwrote in the year 2007. To gauge the economic significance of the coefficient on YR2007, we can look at the average effect of underwriting ten more CDOs in 2007 (with a balance of $1 billion): an increase in YR2007 by $ 1 billion is associated 61
  • 62.
    with an increasein ABS CDO write-downs of .05% of total assets, and with the average value of the banks’ assets equal to 1.5 trillion, this .05% translates into a $735 million increase in write-downs. Continuing this line of analysis, we can say that on average, 2007 CDOs caused their underwriters write-downs of 74% of their par value. This number is consistent with the statements presented in Section 2 that showed banks suffered the most write-downs from retained AAA portions of their own CDO securitizations. When the market for CDOs broke down in 2007, the most aggressive underwriters were stuck holding almost 100% of these AAA securities, which have been marked down to an average of 10 cents on the dollar according to CreditFlux. The key takeaway in this preliminary analysis is that bank CDO write-downs are not necessarily an accurate reflection of the underwriting quality of their CDO business. Instead, write- downs were primarily a result of the complete destruction of demand for CDO securities, which, combined with mark-to-market accounting, forced banks to realize losses of almost 100% of the par amount of retained AAA CDO securities.64 64 The implications of these results are not straightforward. On the one hand, it might seem that certain banks were unfairly punished by mark-to-market accounting, causing them to mark their CDO securities to reflect the worst CDOs (essentially throwing out the baby with the bath-water so to speak), and that this exacerbated the financial crisis by overstating the capital needs of banks. However, the purpose of mark-to- market accounting is to accurately reflect the current financial strength of the institution: if they had to liquidate today, these securities would be worth virtually nothing. Furthermore, these banks violated the first rule of responsible underwriting: never complete a transaction before you have investors to buy the securities. 62
  • 63.
    Table 7: Effectsof Underwriter on CDO Performance Panel A: Regression Rankings These tables are the results of section 5.3. Each underwriter is ranked according to the performance of their CDOs, using either defaults or ratings as the measure of performance. The regressions used are identical to (4)-(5) in Panels A.1 and A.2 of Table 6, and Panel B of Table 6, adding in underwriter fixed effect dummies. Regression coefficients are given under ranking. Ranking based on CDO defaults Ranking based on CDO downgrades Originator Average OLS Full Probit OLS Probit Originator Average OLS Full Probit OLS Probit Rank Full H.I. H.I. Rank Full H.I. H.I. Goldman 1 2 3 2 2 Calyon 1 6 4 2 2 (-0.06**) (-0.180*) (-0.060*) (-0.210+) (0.38) (0.001) (-1 . 1 6 ) (-. 1 9 * * ) Lehman 2 5 7 1 1 Wachovia 2 1 1 15 6 (0.008) (0.050) (-0.09**) (-0.32**) (-0 . 3 9 ) (-0 . 0 3 ) ( 0 . 4 6 ) (-. 0 7 + ) Dresdner 3 1 1 3 10 Deutsche 3 2 3 9 11 (-0 . 0 8 * ) (-0.300**) (-0 . 0 0 8 ) (0.290) (-0 . 3 8 ) (-0 . 0 0 4 ) ( 0 . 0 6 ) (-0 . 0 3 ) Barclays 4 3 5 8 omit Dresdner 4 16 8 1 1 (-0 . 0 3 0 ) (-0 . 0 4 5 ) (0.018) (2.28+) (0.04) (-1 . 4 + ) (-. 3 * * ) Bank of America 5 6 10 7 3 Barclays 5 11 2 12 3 (0.024) (0.080) (0.016) (-0 . 0 2 2 ) (1.1) (-0 . 0 2 ) ( 0 . 2 4 ) (-. 1 8 * * ) 63 Wachovia 6 4 2 6 14 Bear Stearns 6 5 5 8 10 (-0.030+) (-0.250**) (0.012) (0.415**) (0.2) ( 0 . 0 2 ) (0.0033) (-0 . 0 4 ) Credit S. 7 7 8 5 7 UBS 7 7 10 5 7 (0.030) (0.050) (0.005) (0.160) (0.44) (0.06) (-0 . 6 ) (-0 . 0 7 ) UBS 8 8 9 4 6 Bank of America 8 12 11 3 4 (0.050*) (0.060) (-0 . 0 0 4 ) (0.090) (1.19+) (.056+) (-1 . 1 3 ) (-. 1 1 3 * ) Citigroup 9 9 6 9 5 Citigroup 9 8 7 7 9 (0.060**) (0.030) (0.030) (0.030) (0.7) (0.04) (-0 . 0 3 ) (-0 . 0 5 ) RBS 10 12 4 11 12 Lehman 10 4 9 13 omit (0.07**) (-0 . 0 5 6 ) (0.050*) (0.406**) (0.17) (0.056) (0.255) WestLB 11 10 11 16 4 Goldman 11 3 12 10 13 (0.060*) (0.093) (0.160**) (-0 . 0 1 0 ) (-0 . 0 7 ) (.07*) (0.19) (-0 . 0 2 ) Bear Stearns 12 11 13 13 9 JP Morgan 12 15 15 6 8 (0.07**) (0.110) (0.073*) (0.200+) (2.16**) (.11**) (-0 . 3 1 ) (-0 . 0 7 ) Calyon 13 16 12 10 8 Credit S. 13 14 13 14 5 (0.130**) (0.100) (0.045) (0.170) (1.33+) (.08**) ( 0 . 2 7 ) (-. 0 9 + ) Morgan 14 14 14 15 11 RBS 14 9 6 16 16 (0.09**) (0.130) (0.132**) (0.380**) (0.78) (0.02) ( 0 . 4 8 ) (-0 . 0 0 1 ) Merrill 15 15 16 12 13 WestLB 15 17 14 4 12 (0.100**) (0.230**) (0.050*) (0.409**) (2.4**) (.1**) (-0 . 6 9 ) (-0 . 0 4 ) Deutsche 16 13 15 14 15 Merrill 16 13 17 11 15 (0.080**) (0.160*) (0.075*) (0.460**) (1.2+) (.144**) ( 0 . 2 3 ) (-0 . 0 1 ) JP Morgan 17 17 17 17 16 Morgan 17 10 16 17 14 (0.170**) (0.300**) (0.190**) (0.460**) (1.03) (.117**) (1.1) (-0 . 0 2 )
  • 64.
    Panel B: Effectsof Underwriter Size and Market Share These regressions examine the effects of the market share of each Underwriter and the overall issuance on CDO performance. Underwriter market share is defined as the number of CDOs per Underwriter divided by the total number of CDOs. The par value of the Underwriter’s issuance is the sum of all their CDO par values. In the regression, I use the natural log of total issuance. The tables below display only these two coefficients of interest from the set of regressions. The specifications in the first table are identical to those in Panel A, replacing the underwriter dummies with the variables presented below. Clustered standard errors are given in parentheses under estimated coefficients. Coefficients are significant at the +10%, *5%, **1% significance level. 1. Results based on Collateral Defaults Full Sample High-Information Sample Dependent Variable Default Default Default Default Dummy Dummy REGRESSOR OLS Probit OLS Probit Underwriter Market Share 2.3558** 6.3339** 1.6261** 5.9599** (by # of CDOs) (0.6107) (1.3171) (0.2951) (1.4985) Par value of Underwriter’s -0.1160** -0.2979** -0.118** -0.3428** CDO Issuance (natural log) (0.0296) (0.0590) (0.0210) (0.1052) 2. Results based on Credit Ratings Full Sample High-Information Sample Dependent Variable Change in Downgrade Change in Downgrade credit rating Dummy credit rating Dummy (# Notches) (# Notches) REGRESSOR OLS Probit OLS Probit Underwriter Market Share 23.274** 2.574** 4.1483 0.3005* (by # of CDOs) (8.37615) (0.7615) (5.5567) (0.1667) Par value of Underwriter’s -1.2312* -0.0922+ -0.1139 -0.0073 CDO Issuance (natural log) (0.5044) (0.5044) (0.4237) (0.0117) 64
  • 65.
    Table 8: Effectsof Collateral Originators – Ranking RMBS Originators This table examines the effect of the collateral’s Underwriter on the performance of the CDO using the H-I sample. For each CDO, a variable is created for the percent of collateral issued by each of the top 56 originators. The specifications are identical to those in Table 7, replacing the underwriter dummies with the originator variables, and adding variables based on the average FICO, CLTV, and DTI of the RMBS collateral (their coefficients are shown at bottom). Coefficients are significant at the +10%, *5%, **1% significance level. The final column gives the name of the CDO underwriter who bought the largest share of each originator’s collateral. The data are sorted by originator rank from best to worst. Originator Average Default Default Rating Downgrade Largest Buyer Rank Dummy Change Dummy OLS Probit OLS Probit EquiFirst 1 2 1** 1 3 Merrill Lynch (Barclays) (-1.44 ) (-33.89) (-52.33 ) (-0.45 ) Ixis 2 4 6* 8 1* Merrill Lynch (Morgan Stanley) (-1.13 ) (-14.92) (-22.49 ) (-0.51) ACA 3 14 5** 4* 8 Merrill Lynch (-0.58 ) (-16.63) (-32.60) (-0.16 ) Delta 4 8 3** 3* 20 Merrill Lynch (-0.98 ) (-24.83) (-37.60) (0.04 ) RAMP 5 21 9+ 9* 9 Merrill Lynch (GMAC) (-0.24 ) (-6.06) (-20.23) (-0.15 ) Carrington 6 9 10+ 27 5 Merrill Lynch (-0.95 ) (-5.66) (-4.01 ) (-0.21 ) UBS 7 3 4** 14 34 Goldman Sachs (-1.40 ) (-19.32) (-13.97 ) (0.14 ) Long Beach 8 15 13+ 13* 18 Merrill Lynch (WAMU) (-0.56 ) (-5.29) (-14.79) (0.01 ) Encore 9 7 12 19 39 UBS (Bear Stearns) (-1.03 ) (-5.43 ) (-8.60 ) (0.20 ) MASTR 10 20 18 20 24 Merrill Lynch (UBS) (-0.32 ) (-2.93 ) (-7.25 ) (0.06 ) Citigroup 11 29 31 11 12 Merrill Lynch (-0.13 ) (1.57 ) (-14.95 ) (-0.11 ) Goldman Sachs 12 25 20 16 22 Merrill Lynch (-0.17 ) (-1.73 ) (-10.44 ) (0.05 ) First Franklin 13 32 15+ 32 6* Merrill Lynch (Merrill Lynch) (-0.01 ) (-4.22) (-1.60 ) (-0.19) WAMU 14 13 11+ 47 17 Merrill Lynch (-0.73 ) (-5.47) (8.98 ) (-0.02 ) HEAT 15 35 14 22 19 Merrill Lynch (Credit Suisse) (0.15 ) (-4.99 ) (-6.50 ) (0.03 ) Wells Fargo 16 10** 19 35 26 UBS (-0.91) (-2.66 ) (-0.51 ) (0.07 ) Wachovia 17 44 22 5+ 21 Wachovia (0.37 ) (-0.43 ) (-31.68) (0.04 ) Aegis 18 18 26 37 14 Merrill Lynch (-0.49 ) (0.28 ) (-0.20 ) (-0.06 ) ACE 19 12 8** 30 46* Merrill Lynch (-0.78 ) (-7.63) (-1.81 ) (0.35) Saxon 20 6 7** 28 55+ Merrill Lynch (Morgan Stanley) (-1.05 ) (-14.63) (-3.69 ) (0.56) Ameriquest 21 36 24 21 16 Merrill Lynch (0.19 ) (0.01 ) (-6.69 ) (-0.05 ) 65
  • 66.
    Originator Average Default Default Rating Downgrade Largest Buyer Rank Dummy Change Dummy OLS Probit OLS Probit SASCO 22 17 16* 38 27 Merrill Lynch (Lehman Brothers) (-0.50 ) (-3.74) (1.28 ) (0.07 ) ABFC 23 34 21 24 23 Merrill Lynch (Bank of America) (0.15 ) (-1.30 ) (-5.76 ) (0.06 ) New Century 24 46 30 15+ 13 Merrill Lynch (0.50 ) (1.30 ) (-13.17) (-0.06 ) Popular 25 41 49* 12+ 4 UBS (0.33 ) (9.86) (-14.82) (-0.22 ) DLJ Mortgage 26 11 17 29 52 Merrill Lynch (Credit Suisse) (-0.81 ) (-3.05 ) (-1.89 ) (0.46 ) BayView 27 5 51* 31 25 Merrill Lynch (-1.10 ) (11.01) (-1.60 ) (0.07 ) Fremont 28 39 34 26 15 Merrill Lynch (0.32 ) (1.75 ) (-4.32 ) (-0.06 ) RALI 29 55* 53** 6* 2** Merrill Lynch (GMAC) (1.64) (11.70) (-26.19) (-0.47) RASC 30 22 54** 33 7+ Merrill Lynch (GMAC) (-0.22 ) (12.08) (-1.50 ) (-0.19) Merrill Lynch 31 40 41 10* 29 Merrill Lynch (0.32 ) (3.68 ) (-16.79) (0.09 ) OWNIT 32 24 42 17 49* Merrill Lynch (-0.19 ) (4.13 ) (-10.32 ) (0.40) C-Bass 33 27 25 46+ 37 Bank of (-0.14 ) (0.06 ) (8.49) (0.15 ) America Option One 34 28 43 56 11 Merrill Lynch (-0.14 ) (4.22 ) (19.49 ) (-0.12 ) Aames Mortgage 35 54 50+ 25 10 Merrill Lynch (1.54 ) (11.00) (-4.52 ) (-0.12 ) Countrywide 36 42 37+ 34 30+ Merrill Lynch (0.34 ) (2.40) (-1.25 ) (0.10) Deutsche Bank 37 53* 48* 18 28 Deutsche Bank (1.33) (8.65) (-9.48 ) (0.08 ) NovaStar 38 43 28 44 36+ Merrill Lynch (0.36 ) (0.55 ) (7.16 ) (0.14) GSAA 39 16 44 59** 33 Goldman Sachs (Goldman Sachs) (-0.51 ) (4.87 ) (35.48) (0.13 ) Impac 40 58+ 52 7 35 Merrill Lynch (2.96) (11.50 ) (-24.14 ) (0.14 ) JPMorganChase 41 48 32 42 31+ Merrill Lynch (0.65 ) (1.63 ) (5.54 ) (0.11) IndyMac 42 23 35 57** 41+ Merrill Lynch (-0.19 ) (1.88 ) (24.50) (0.23) Park Place 43 26 45 53 32+ Merrill Lynch (-0.17 ) (5.25 ) (16.01 ) (0.13) Morgan Stanley 44 33 39* 43+ 44** Merrill Lynch (0.07 ) (2.81) (6.32) (0.25) Cairn 45 57+ 59** 2* 47** Merrill Lynch (2.45) (36.97) (-47.24) (0.35) Bear Stearns 46 38 40+ 45+ 43* Merrill Lynch (0.27 ) (3.39) (7.27) (0.24) Argent 47 45 23 50* 51** Merrill Lynch (Citigroup) (0.40 ) (-0.27 ) (14.37) (0.43) Residential Asset 48 31 33 58** 48** Merrill Lynch (GMAC) (-0.02 ) (1.66 ) (28.73) (0.38) SoundView 49 50 36 48+ 40+ Merrill Lynch (RBS) (0.95 ) (1.89 ) (11.59) (0.21) 66
  • 67.
    Originator Average Default Default Rating Downgrade Largest Buyer Rank Dummy Change Dummy OLS Probit OLS Probit Barclays 50 37 46 55 42 Merrill Lynch (0.21 ) (5.31 ) (18.47 ) (0.24 ) HarborView 51 49 27 51+ 53** RBS (RBS) (0.67 ) (0.53 ) (14.48) (0.51) Accredited Mortgage 52 51 38 54 38 Merrill Lynch (1.07 ) (2.69 ) (16.61 ) (0.19 ) Terwin 53 47 29 49+ 56** Merrill Lynch (0.53 ) (0.93 ) (12.66) (0.87) Fieldstone 54 30 57** 41 54* Merrill Lynch (-0.08 ) (18.48) (4.53 ) (0.56) Nomura 55 52 55** 40 50+ Merrill Lynch (1.24 ) (14.71) (2.93 ) (0.42) HSBC 56 56+ 56** 52 45** Merrill Lynch (2.09) (15.26) (15.75 ) (0.27) MORTGAGE CHARACTERISTICS FICO - -0.0048 -0.0172 0.0477 -0.0002 - (0.0051) (0.0195) (0.0684) (0.0006) CLTV - 0.0190+ 0.2269** -0.1681 0.0022 - (0.0103) (0.0569) (0.2003) (0.0015) DTI - 0.0091 -0.0182 -0.0171 0.0085 - (0.0068) (0.0378) (0.1073) (0.0015) 67
  • 68.
    Table 9: AsymmetricInformation: Effects of Banks using their own CDOs as Collateral This table examines whether there is a relationship between CDO performance and the amount of CDO collateral that is issued by the bank that acts as the CDOs Underwriter. The regressions are identical those in Table 7 using the high-information sample, with the addition of interaction terms equal to the percent of CDO collateral coming from the underwriter times the underwriter fixed effect dummy. The coefficients are given for the effect of the fixed effect underwriter dummies (F.E.) and the interaction of the percent of CDO collateral coming from the CDOs underwriter (Int.). Coefficients are significant at the +10%, *5%, **1% significance level. Bank Coefficient Default Default Rating Rating Type OLS Probit OLS Probit Bank of America F.E -0.01 -0.19 -1.21+ -0.13** Int. 2.16** drop -35.70** -1.50 Barclays F.E 0.09+ drop -0.80 -0.32** Int. -20.86** drop 372.48** drop Bear Stearns F.E 0.09* -0.24+ -0.78 -0.10* Int. -5.15** 37.77** 98.52** 1.96** Calyon F.E 0.09* 0.43** -1.21+ -0.18** Int. -7.92** -129.53** -81.07** -2.14** Citigroup F.E 0.01 -0.22* -0.54 -0.08* Int. 1.17+ 12.13* 11.24 0.05 Credit Suisse F.E 0.09** 0.47** 0.11 -0.12* Int. -3.69** -14.32** 16.57+ drop Deutsche Bank F.E 0.06+ 0.41** 0.27 -0.04 Int. -0.82 drop -6.02 drop Dresdner Bank F.E 0.00 0.41* -1.91* -0.34** Int. 2.62 drop 15.75 -11.32** Goldman Sachs F.E -0.08* -0.33 -0.61 -0.07+ Int. 3.85** 25.65** 32.37** 0.45+ JP Morgan F.E 0.15** 0.54** -1.13 -0.33** Int. 12.93+ -156.79 276.85** drop Lehman Brothers F.E -0.02 -0.10 -0.21 drop Int. -17.84** drop 124.78** drop Merrill Lynch F.E 0.04 0.23 -0.09 -0.04+ Int. 0.47 5.37** 1.46 0.84** Morgan Stanley F.E 0.12** 0.34** 0.54 -0.03 Int. 28.84** drop -120.05 -5.44+ RBS F.E 0.05 0.48** -0.09 -0.04 Int. -4.87* -86.96** 31.09 -0.45 UBS F.E 0.02 -0.05 -1.05+ -0.13* Int. -1.29 drop 64.00** drop Wachovia F.E 0.05 0.40* -0.27 -0.15+ Int. -2.30 8.05 14.93 0.80 WestLB F.E 0.18** 0.01 -0.62 -0.09 Int. drop drop drop drop 68
  • 69.
    Table 10: Determinantsof Banks’ ABS CDO Writedowns These regressions look at how each Underwriter’s CDO characteristics relate to the total amount of write-downs they reported on ABS CDOs. The value of their ABS CDO write-downs is taken from CreditFlux and includes all information reported as of February 6, 2009. The dependent variable is the total amount of ABS CDO writedowns as a percent of the total assets on each bank’s balance sheet at year-end 2007. All of the independent variables are weighted averages of the characteristics of each bank’s CDOs. Heteroskedasticity robust standard errors are given in parentheses under estimated coefficients. Coefficients are significant at the +10%, *5%, **1% significance level. Dependent Variable: ABS CDO write-downs($) divided by total assets($), by underwriting bank (1) (2) (3) (4) (5) REGRESSOR: OLS OLS OLS OLS OLS Permarket __ 0.0520** 0.0494* 0.0481+ 0.051* (6.28E-08) (5.05E-03) (1.03E-02) (5.90E-03) DEFAULT -0.010 0.01160 0.00273 0.0031 9.03E-03 (1.89E-02) (6.23E-03) (6.48E-03) (1.43E-02) (1.03E-02) AAASUB -9.11E-03 -0.00230 -0.0093 -0.0373 -1.05E-02 (2.72E-02) (9.79E-03) (6.62E-03) (1.38E-02) (1.21E-02) DOWNGRADE -5.03E-04 8.00E-05* -5.157-04 -1.17E-03 -9.26E-04 (1.30E-03) (3.17E-04) (3.17E-04) (7.15E-04) (6.63E-04) NUMBER OF ASSETS __ __ -1.25E-05 -3.32E-06 8.30E-04 (1.35E-05) (3.03E-05) (3.60E-04) NUMBER OF TRANCHES __ __ 0.00103* 1.08E-03 0.0013+ (2.36E-04) (5.48E-04) (3.60E-04) % HEL __ __ __ 4.28E-03 __ (1.46E-02) % CMBS __ __ __ 0.0291 __ (2.06E-02) % RMBS __ __ __ -1.29E-02 __ (1.36E-02) % CDO __ __ __ -1.33E-02 __ (1.25E-02) % SYNTHETIC __ __ __ __ -5.85E-03 (2.75E-02) % FIXED RATE __ __ __ __ -4.42E-04 (1.11E-02) Issuance -1.16E-06 2.63E-07 -1.60E-07 -7.93E-07 -3.51E-07 2005 ($mm) (1.07E-06) (2.31E-07) (2.13E-07) (4.06E-07) (3.35E-07) Issuance 6.85E-07 -2.02E-07+ -7.15E-08 3.26E-09 4.49E-07+ 2006 ($mm) (6.44E-07) (2.01E-07) (1.19E-07) (1.96E-07) (1.71E-07) Issuance 5.74E-07* 4.26E-07** 5.83E-07* 6.13E-07* 5.83E-07* 2007 ($mm) (3.15E-07) (8.01E-08) (6.64E-08) (9.10E-08) (8.44E-08) Intercept 1.16E-02 8.04E-03 5.77E-03 1.62E-02 5.96E-03 (2.28E-02) (7.53E-03) (3.94E-03) (7.71E-03) (5.94E-03) Regression summary statistics Adj. R2 0.671 0.898 0.915 0.914 0.913 SER 0.004 0.001 0.001 0.001 0.001 n 17 17 17 17 17 69
  • 70.
    4.4 CDO CreditRatings This final section analyzes the credit ratings given to CDO tranches and their collateral assets by Moody’s, Fitch, and S&P. It is organized around the four questions given in Section 3: 1) What factors were important in determining initial CDO credit ratings?; 2) What factors have driven the wave of CDO downgrades?; 3) How well did original collateral asset and CDO tranche ratings predict performance?; and 4) What factors explain the mistakes made in forecasting performance? Original CDO Credit Ratings First, I consider the factors explaining the percent of the CDO that was initially rated AAA by each of the three agencies, essentially trying to “back-out” those factors that were important in the agencies’ models. I limit my analysis to the CDOs in the high- information sample, because I have data on the original credit ratings of their collateral, which was an important input used by the CRAs for determining CDO ratings. There are three different dependent variables, one for the %AAA assigned by each agency. One complicating factor is that for most CDOs, a given CRA rated only a portion of the tranches; because of this, CDOs are only included in the regressions if the rating agency assigned ratings to 75% or more of the tranches. This means that for the regression using Fitch % AAA as the dependent variable, there are only 86 observations. The initial specification for these regressions is: (3) %AAA (M/F/SP)i = α + ß1Original Balancei + ß2HGi + ß3# Assetsi + ß4# Tranchesi + ß5Average initial collateral ratingi + ß6WACi + ß7IYear2005i + ß8IYear2006i + ß9IYear2007i +εi 70
  • 71.
    The results ofthese regressions are presented in Panel A of Table 11. The most notable finding from Table 11 is that much of the variation in the % AAA can be explained by the initial credit ratings of the underlying collateral. This finding strongly supports the “recycled ratings effect” of hypothesis 3A. Reliance on prior ratings is seen in two variables – HG (a dummy that equals 1 if the CDO had an original weighted average rating factor of less than 180 and zero otherwise) and average initial collateral rating. For S&P, an HG CDO is associated with a 6% increase in % AAA, and a one S.D. decrease in average initial collateral rating (3.5 notches) is associated with a 5.6% increase in %AAA; both of these variables on their own explain approximately half of the S.D. of %AAA. Perhaps this finding is less impressive given that there is a very low level of variation in the %AAA of the CDOs in the sample – the standard deviation is only around 10%. However, the heavy reliance on just two input variables implies that either the agencies’ rating models had been incredibly simplified, or that inputs to the models were “tweaked” until they gave the desired amount of AAA. The inclusion of additional independent variables to the regressions only slightly increases the adjusted R-squared for S&P and Moody’s, and none at all for Fitch, and the coefficients on HG and average initial collateral rating are relatively unchanged. The other interesting finding from Table 11 is the positive coefficient on % Collateral rated by Agency, although this effect is only statistically significant for S&P. This effect might reflect the CRAs’ use of “notching.” Notching refers to the practice of incorporating the ratings of another CRA into a CRA’s own rating model. Because it was rare that a single CRA had rated all CDO assets and since it was too expensive to re-rate all the CDO’s underlying assets, a CRA would instead use ratings 71
  • 72.
    given by itscompetitors, but “adjust” these ratings downward before using them in their own CDO models. This would explain why a CDO would receive a higher fraction of AAA from a CRA when more of its assets were rated by that agency, as their ratings did not have to be “notched.” It also shows that CDOs could receive the most AAA if they were rated by the CRA who had rated the highest percent of its collateral. This could explain the near elimination of Fitch from the CDO rating business by 2005; Fitch had a significantly lower market share in rating subprime RMBS securities, which became the main collateral for CDOs. Next, I add underwriter fixed effects to test for differential treatment among the banks. Panel B of Table 11 ranks the underwriters based on their effect on % AAA, after controlling for observable CDO asset and liability properties. Deutsche Bank CDOs were associated with statistically significant smaller % AAA by all three CRAs, while CDOs from Citigroup, RBS, and Bank of America had a larger % AAA by Moody’s and S&P. The reasons for these variations in % AAA across underwriters arise from some unobservable variable. Likely candidates include the correlation inputs associated with the underwriter’s CDO asset pools or the type of relationship between the underwriter and the CRA. Lastly, Panel C of Table 11 shows the effects of certain CRA combinations and the overall number of ratings on the % AAA, through the addition of independent variables equal to the percent of a CDO’s par value rated by the given rating agency combination, and a variable equal to the average number of ratings on the CDO tranches (0-3). The results in Panel C provide evidence for a negative “peer pressure effect” (discussed in hypothesis 3B) on % AAA. The number of ratings is negatively correlated 72
  • 73.
    with the %AAA, indicating that having fewer CRAs per CDO led to more generous AAA allotments. However, this effect might be due solely to the influence of a Fitch rating; while CDOs rated by Fitch + Moody’s or Fitch + S&P were given less AAA, CDOs rated by Moody’s + S&P were given more AAA. One possible explanation for this “Fitch effect” is that a Fitch rating decreased the “recycled ratings effect.” Given that Fitch had rated relatively few of the assets used as CDO collateral, it would not normally be desirable to get a Fitch rating because of the notching effects. Presumably, CDO underwriters would use Fitch only if: 1) Moody’s or S&P would not give an agreeable rating; or 2) most of the collateral assets had no rating and Fitch would re-rate all of the assets at a lesser cost than would the other two CRAs. Both of these actions might be the reason why the association of Fitch + Moody’s and Fitch + S&P CDOs are correlated with lower % AAA. Determinants of CDO Tranche Downgrades Having ascertained the determinants of the initial CDO credit ratings, I next revisit the factors that have affected the magnitude of downgrades on CDO tranches. These regressions are similar to those performed in section 4.2; however, the dependent variables used here are specific to each rating agency, rather than the average downgrade. Fitch is not included in the present analysis because there are very few CDO tranches that carry both an original and a current Fitch rating. Also, Default is included as an independent variable. The results are presented in Panel A of Table 12. There is strong evidence supporting the “seniority effect” of hypothesis 3C; controlling for Default, the more senior tranches have experienced most downgrades. For example, the AAA 73
  • 74.
    tranches rated byMoody’s are associated with a 4-notch increase in downgrades. The coefficients of the other independent variables repeat many of the results from Section 4.2. One somewhat surprising result from Panel A is the fact that even using all of these independent variables, the regressions only account for 53% of the variation in Moody’s Downgrades and 54% in S&P Downgrades, as seen by the adjusted R-squared values. Adding the underwriter fixed effect dummy variables in Panel B only increases these values by 1%, indicating that primary unobservable variables are not related to CDO underwriter. One plausible explanation for the mismatch between observable CDO variables and credit-rating downgrades is that downgrades usually come after some time lag, as rating agencies wait to see a “trend” in performance before changing the rating. Further regression analysis could test for this by adding lags of the Default variables; unfortunately, I only had Default data for a single point in time. A second possible explanation for the mismatch of observable CDO performance and tranche downgrades is that the rating agencies only periodically conduct surveillance analysis on previously rated deals. Perhaps some CDO deals have not been recently revisited, or perhaps the level of post-issuance CDO surveillance is related to the amount of publicity or investor concern surrounding certain CDOs or CDO types. How well did initial ratings predict outcomes? Table 13 addresses the relationship between ex-ante credit ratings and ex-post performance. Panel A looks specifically at the relationship between the ratings of the CDO collateral assets and the realized asset default rate, while Panel B explores the 74
  • 75.
    relationship between initialAAA CDO tranche ratings and current losses on AAA tranches. Panel A regresses the average initial collateral rating by each agency (separately) on the realized Default. Control variables are added for the percent of assets that were rated by the CRA in question, as it would be expected that the predictive power of the average rating would be much less if the CRA only rated a few assets. In the second regression specifications for each CRA, I add interaction terms to test if the effect of a given average rating on Default varies depending on the asset characteristics. Overall, the results in Panel A provide support for the “asset-class effect” discussed in hypothesis 3D. In other words, the same credit rating translated into a different effect on Default depending on observable characteristics of the asset, indicating that the credit ratings did not incorporate this information. Specifically, a lower credit rating led to a less pronounced increase in Default if it described a CMBS asset, but led to a much higher increase in Default if it described an RMBS backed by Alt-A ARM mortgages. These findings confirm allegations mentioned in Section 2 that credit ratings have had inconsistent meanings over time and across different asset types. Finally, Panel B examines the relationship between AAA losses and the amount of initial AAA given to a CDO. As discussed in Section 3, there is no direct measure for realized losses on individual tranches. For the purpose of these regressions, I create a variable that calculates the exposure of the AAA bondholders to losses on the underlying collateral: the variable Loss is calculated as (Default – Current Credit Support). I regress the %AAA and the number of AAA tranches given by each agency on Loss, with the addition of the CDO asset and liability control variables. 75
  • 76.
    The results inPanel B partially support the “super-senior effect” of hypothesis 3E. While the initial %AAA is not a significant predictor of Loss, the number of AAA tranches is positively correlated to Loss. This indicates that the losses facing AAA bondholders are related to the number of AAA tranches originally issued, and that the more AAA tranches, the more losses facing the note-holders. However, the Loss measure is based on the AAA tranche with the lowest level of current credit enhancement, thus overstating losses to the holders of super-senior tranches. Therefore, the average measure of Loss may not depend on the number of initial AAA tranches, but the Loss to different classes of AAA tranches will depend on the number of AAA tranches, with higher Loss to the least senior AAA note-holders in CDOs with super-senior tranches. It is possible that investors failed to realize the nonequivalence of a AAA tranche of a CDO with super-senior tranches and a tranche from a CDO without super-seniors. On the other hand, the underwriting bank often retained the super-senior tranches and many were never rated, making it difficult for an outside AAA investor to ascertain the number or existence of such tranches. Why did CDO credit ratings fail? The final regressions take a first look at some possible reasons for the inaccuracy of the CDO credit ratings. In order to quantify the level of credit-rating accuracy, I create a variable based on the discrepancy of predicted and realized default levels. Using the default matrix from S&P’s CDO Evaluator, version 3 (see Appendix C), I calculate the 76
  • 77.
    predicted value forDefault.65 The regressions presented in Table 14 use the difference in Default and predicted default for the CDO collateral by each agency as the dependent variable. The most striking result in Panel A is the association of credit-rating failures with the presence of 2006 and 2007-vintage collateral, whose coefficients are large and significant in all specifications. This finding supports earlier evidence showing that collateral quality declined significantly in those years, and furthermore shows that the rating agencies failed to identify this decline in quality. Also of interest are the negative and significant coefficients on % CLO and % CMBS, showing that these assets had more accurate ratings.66 Lastly, the coefficient on % Collateral rated by Fitch is negative and significant, while the coefficient on % Collateral rated by Moody’s is positive and significant. However, it is hard to compare the accuracy of Fitch against S&P and Moody’s due to Fitch’s markedly lower participation in the CDO rating business. The apparent superiority of Fitch ratings might result simply because Fitch had fewer opportunities to make mistakes with CDO ratings. They were no longer significant participants in CDOs when the most pronounced deterioration in collateral quality and increases in CDO complexity were occurring. In Panel B, I rerun the regressions from Panel A with the addition of underwriter fixed effect dummies, to see if the severity of rating “mistakes” varied across underwriters. The results from these regressions show that the severity of rating “mistakes” was dependent on the identity of the underwriter. However, this does not 65 It is difficult to ascertain whether the values used from the S&P matrix in Appendix C were the intended probability of default numbers for all three CRAs, or even for S&P, due to the lack of clear ratings definitions from the CRA publications. 66 However, the default data is only current as of February 2009. The CMBS market has very recently experienced a prolific increase in defaults, which is not captured by my data. 77
  • 78.
    mean that certainunderwriters received differential treatment by the rating agencies; on the other hand, it is actually evidence that the underwriters didn’t receive differential treatment, but that this lack of differentiation among underwriters was itself the problem. Looking at the average rankings in Panel B, we see that the severity of the rating mistakes directly mirror the quality of the underwriter’s CDOs, with the “best” underwriters like Goldman Sachs associated with smaller mistakes, and the “worst” underwriters with more mistakes. Similar to the lack of variation in the % AAA, these results show that the rating agencies failed to realize that some underwriters were doing a better job than others. However, it might have been impossible for the rating agencies to quantify “underwriter quality,” given the finding of Section 4.3 that the “underwriter effect” is not easily explained by any observable CDO asset and liability properties or by the size of the underwriter.67 Finally, Table 15 begins a cursory investigation of the potential “conflict of interest” problems discussed in hypothesis 3F. I create variables to indicate the amount of CDO business a CRA received for each underwriter, equal to the total par value of all of the underwriter’s tranches rated by the CRA. Since the rating agencies are paid a fee based on the par value of the securities they rate, conflicts of interest would suggest that they would give more desirable ratings to bigger underwriters in order to increase their own profits. I rerun the regressions from Table 11 – Table 14, adding in the variables for the amount of business between the underwriter and CRA, and present their coefficients in Table 15. 67 One solution might have been to use the historical performance of the underwriter’s CDOs to proxy for “underwriter quality,” but this too would be problematic in that the history of most underwriters only spanned a few years. 78
  • 79.
    The signs ofthe coefficients for Moody’s and S&P are consistent with the conflict of interest problem: bigger underwriters were associated with a higher initial % AAA, resulting in a subsequent higher level of downgrades, AAA Loss, and an overall higher level of prediction mistakes as calculated by the difference in predicted and actual levels of Default. However, these results could just as easily be caused by the fact that the most prolific underwriters were producing worse CDOs, and that rather than receive preferential treatment by the rating agencies, the problem was merely that these originators were treated the same as other underwriters, although in reality they were producing worse CDOs. Given the striking uniformity of initial CDO credit ratings and the fact that the prediction value of the asset credit ratings depended mainly on the quality of the underwriter, the latter explanation seems more likely, suggesting that the conflicts of interest is not as much to blame as simply a failure to distinguish among underwriter quality. 79
  • 80.
    Table 11: Determinantsof %AAA by each CRA Panel A: Effect of CDO Characteristics This table examines the factors that affected the initial amount of each CDO that was given an AAA rating by each of the three CRAs. The dependent variables are the % of AAA by S&P, Fitch, or Moody’s at issuance. Standard errors, clustered by CDO underwriter, are shown in parentheses under estimated coefficients. Coefficients are significant at the +10%, *5%, **1% significant level. (1) (2) (3) (4) (5) (6) Dependent Variable S&P S&P F %AAA F %AAA M %AAA M %AAA %AAA %AAA 0.0641** 0.0728** 0.0574+ 0.0414 0.0669** 0.0801** HG (0.0126) (0.0124) (0.0301) (0.0404) (0.0157) (0.0154) 2E-05** 2E-05** 3E-05 4E-05 2E-05** 1E-05** Original CDO Balance (0.0000) (0.0000) (0.0000) (0.0000) (0.0000) (0.0000) 0.0001+ 0.0001+ -0.0001 -0.0001 0.0002** 0.0002* Number of assets (0.0001) (0.0001) (0.0002) (0.0002) (0.0001) (0.0001) -0.0036+ -0.0048* -0.0004 -0.0002 -0.0039+ -0.0053* Number of Tranches (0.0018) (0.0018) (0.0025) (0.0029) (0.0019) (0.0021) Average initial collateral -0.0161** -0.0143** -0.0163* -0.0172* -0.0161** -0.0126** rating (0.0033) (0.0033) (0.0061) (0.0081) (0.0038) (0.0039) -0.0054 -0.0048 0.0053 0.0006 -0.0059 -0.0042 WAC (0.0043) (0.0032) (0.0076) (0.0114) (0.0041) (0.0030) -0.1088* 0.0044 -0.1093+ % Subprime - (0.0411) - (0.0694) - (0.0594) -0.0781+ 0.0118 -0.0947 % Alt-A Fixed Rate - (0.0429) - (0.0909) - (0.0738) -0.0753 -0.0145 -0.1379 % Alt-A ARM - (0.1007) - (0.2287) - (0.1218) -0.1395** -0.0061 -0.1176* % CDO - (0.0263) - (0.0850) - (0.0507) -0.1900** -0.0621 -0.0960+ % Prime - (0.0467) - (0.1201) - (0.0497) -0.1363** -0.0358 -0.1088* % Midprime - (0.0297) - (0.0586) - (0.0526) -0.2389+ -0.0453 -0.2168 % CES RMBS - (0.1190) - (0.1861) - (0.1310) -0.0248 -1.6955 -0.2736 % HELOC - (0.6567) - (1.8949) - (0.7329) -0.3533** -0.0307 -0.3347** % CLO - (0.0464) - (0.3230) - (0.0729) -0.1056 -0.0164 -0.0783 % CMBS - (0.0657) - (0.0822) - (0.0830) -0.0197 -0.0195 -0.0195 % Fixed Rate - (0.0157) - (0.0393) - (0.0149) 0.0003 -0.0297 0.0021 % Synthetic - (0.0143) - (0.0196) - (0.0165) 0.0021 -0.0622 0.0036 % 2006-vintage collateral - (0.0146) - (0.0368) - (0.0113) 0.0152 -0.0209 0.0128 % 2007-vintage collateral - (0.0175) - (0.0659) - (0.0174) % Collateral rated by 0.1019+ 0.1275 0.0604 Agency - (.0615) - (0.1211) - (0.0500) Intercept 0.8974** 1.0498** 0.8911** 0.9350** 0.8930** 1.0173** Regression Summary Statistics Adj. R2 0.72355642 0.77984287 0.63409497 0.63409497 0.74993314 0.79321172 SER 0.05272 0.04705 0.05237 0.05237 0.05056 0.04598 80
  • 81.
    Panel B: Effectof CDO Underwriter This table examines whether the identity of the CDO underwriter affected the amount of AAA given to a CDO. The regressions are identical to (2), (4), and (6) in Panel A, with the addition of fixed effect dummies for the underwriter. The results are listed according to the average rank of the underwriter, with lower numbers corresponding to lower amounts of AAA given to the bank’s CDOs. The estimated coefficients shown in parentheses underneath the ranking are significant at the +10%, *5%, **1% level. Underwriter Average Rank S&P %AAA F %AAA M %AAA Deutsche Bank 1 1* 1* 2** (-0.0181) (-0.1626) (-0.0247) Dresdner Bank 2 3 omit 3 (-0.0031) (-0.0116) UBS 3 2 6 4 (-0.0110) (-0.0329) (-0.0060) WestLB 4 14+ 3 1** (0.0164) (-0.0787) (-0.0530) Lehman Brothers 5 5 11 5 (0.0059) (-0.0024) (0.0033) Barclays Capital 6 4 14 6 (0.0022) (0.0230) (0.0041) JP Morgan 7 7 omit 9 (0.0090) (0.0108) Merrill Lynch 8 10 8 8 (0.0128) (-0.0260) (0.0095) Credit Suisse 9 13* 7 7 (0.0157) (-0.0309) (0.0063) Morgan Stanley 10 11+ 4 12+ (0.0133) (-0.0651) (0.0139) Calyon 11 8 10 11 (0.0117) (-0.0200) (0.0123) Bear Stearns 12 6 15 10 (0.0079) (0.0454) (0.0112) Wachovia 13 9 12 13+ (0.0120) (-0.0008) (0.0143) Citigroup 14 12+ 9 15* (0.0148) (-0.0245) (0.0164) RBS 15 17* 2* 17** (0.0217) (-0.1229) (0.0321) Bank of America 16 16** 5 16* (0.0217) (-0.0595) (0.0184) Goldman Sachs 17 15* 13 14 (0.0202) (0.0041) (0.0148) 81
  • 82.
    Panel C: Effectof Specific CRA Combinations and # Ratings This panel shows the effect of specific CRA ratings on the average % AAA per CDO. The regression is identical to (2) in panel A, with the addition of dummies based on the combination and number of ratings of the CDO. The dependent variable is the average % AAA of S&P, F, and Moody’s. REGRESSOR Coefficient F only 0.0519 SP only 0.0409** F/M only -0.0316** F/SP only -0.0069 M/SP only 0.0040 M/SP/F 0.0081+ # Ratings -0.0123* Table 12: Determinants of Downgrades by Moody’s and S&P Panel A: Effect of CDO Characteristics This table examines the factors that determined the magnitude of tranche downgrades by Moody’s and S&P. Fitch is not included because very few tranches contain an initial and current rating from Fitch. The dependent variables are the number of notches the tranche was downgraded by Moody’s or S&P. Standard errors, clustered by CDO underwriter, are shown in parentheses under estimated coefficients. Coefficients are significant at the +10%, *5%, **1% significant level. Dependent Variable M Downgrade S&P Downgrade REGRESSOR: OLS OLS 1.6197* 3.2437** Default (0.7418) (0.8744) -6.3645** -6.3076** % Subordination (1.3163) (1.0485) -0.1590* -0.1382** Tranche coupon (0.0649) (0.0472) -0.0006 -0.0006 Original Tranche Balance (0.0008) (0.0009) -3.9982** -2.8395* % of Transaction (1.2180) (1.2626) -0.2442 -0.8938 HG (0.4379) (0.6558) 0.0093* 0.0084* Number of assets (0.0036) (0.0039) -0.0261 -0.0792 Number of Tranches (0.1189) (0.1280) 1.5494 4.3683 % Subprime (10.1112) (9.0855) -2.5218 1.9671 % Alt-A Fixed Rate (11.0595) (8.9815) 17.2572 21.8594* % Alt-A ARM (10.1751) (9.7084) 7.5923 10.0938 % CDO (10.5940) (9.2455) 82
  • 83.
    S&P Dependent Variable M Downgrade Downgrade REGRESSOR: OLS OLS 15.0931 12.3975 % CES RMBS (10.6224) (8.0916) 9.7576 41.6293+ % HELOC (28.6049) (22.1986) -12.7820 -8.9135 % CLO (10.5058) (9.4269) -9.6451 -2.9709 % CMBS (10.4932) (9.1305) 0.5802 0.1781 % Fixed Rate (0.8780) (0.8294) -0.8205 -1.0549 % Synthetic (0.6243) (0.7566) Change in average -0.0906 -0.1415* collateral rating (0.0856) (0.0554) % 2006-vintage 2.5242** 1.2596 collateral (0.5617) (0.7656) % 2007-vintage 1.5900 -0.0911 collateral (1.6712) (1.5429) 0.0423 0.4651 Number of ratings (0.3165) (0.4277) -1.4905** 0.5336 IYear2005 (0.5141) (0.6801) 0.1350 2.1820** IYear2006 (0.6283) (0.5409) 0.3591 2.1227** IYear2007 (0.7140) (0.6715) Initial Tranche Rating Dummies 4.0069** 1.5041+ AAA (0.6860) (0.7869) 2.0619* 0.4176 AA+ (0.9674) (0.8148) 3.7332** 1.3306+ AA (0.5615) (0.6850) 2.6571** 0.1168 AA- (0.6612) (0.7816) 3.4266** A+ (0.8303) omit 1.7604** -1.5958* A (0.5387) (0.7396) 1.4577+ -1.5122* A- (0.7273) (0.7058) -3.2824** BBB+ omit (0.7680) -0.2509 -3.7138** BBB (0.5642) (0.8029) -2.1127** -5.6114** BBB- (0.5083) (0.6355) -3.0050** -6.3979** Below IG (0.4817) (0.6657) Intercept 6.5363 4.3406 Regression Summary Statistics Adj. R2 0.52907397 0.5283653 SER 3.9859 3.9849 n 2542 2555 83
  • 84.
    Panel B: Effectof CDO Underwriter This table examines whether the identity of the CDO underwriter affected the magnitude that a tranche was downgraded by Moody’s and S&P. The regressions are identical to those in Panel A, with the addition of fixed effect dummies for the underwriter. The results are listed according to the average rank of the underwriter, with lower numbers corresponding to fewer downgrades. The estimated coefficients shown in parentheses underneath the ranking are significant at the +10%, *5%, **1% level. Underwriter Average Rank M Downgrade S&P Downgrade Dresdner Bank 1 1* 2** (-1.6759) (-2.6149) Bank of America 2 3 3+ (-0.7140) (-1.6657) Calyon 3 2 4 (-0.9431) (-1.1587) WestLB 4 5 1** (-0.4627) (-2.6855) JP Morgan 5 6 5 (-0.1211) (-0.4372) UBS 6 7 7 (-0.0472) (-0.2726) Bear Stearns 7 9 8 (0.2398) (-0.0339) Wachovia 8 8 9 (0.0300) (0.0434) Lehman Brothers 9 12 6 (0.6000) (-0.3736) Deutsche Bank 10 4 17 (-0.5001) (0.7837) Citigroup 11 11 11 (0.3886) (0.0925) RBS 12 13 10 (0.6419) (0.0552) Goldman Sachs 13 10 14 (0.2572) (0.3960) Barclays Capital 14 15 13 (0.9504) (0.3728) Credit Suisse 15 17* 12 (1.7464) (0.3214) Merrill Lynch 16 14 15 (0.6985) (0.6638) Morgan Stanley 17 16 16 (1.0870) (0.7457) 84
  • 85.
    Table 13: PredictivePower of Original Credit Ratings of the CRAs Panel A: Significance of ex-ante collateral pool ratings in forecasting ex-post default rate This table looks at the relationship between the original collateral ratings of the CDO assets by each of the three CRAs (“Moody”, “Fitch”, or “S&P”) and the realized default rate. The dependent variable is the realized default rate of the assets in each CDO collateral pool. The interaction terms are computed as the collateral rating by agency “x” times the given variable. Standard errors, clustered by CDO underwriter, are shown in parentheses under estimated coefficients. Coefficients are significant at the +10%, *5%, **1% significant level. M (1) M (2) F (1) F (2) SP (1) SP (2) Dependent Variable: Default Default Default Default Default Default 0.0511** 0.0324+ Moody (0.0083) (0.0163) - - - - 0.0499** 0.0242 Fitch - - (0.0081) (0.0160) - - 0.0520** 0.0281 S&P - - - - (0.0085) (0.0165) -3E-05 -3E-05 -4E-05 -4E-05 -3E-05 -3E-05 Original Balance (0.0000) (0.0000) (0.0000) (0.0000) (0.0000) (0.0000) 0.0003 0.0004 0.0004 0.0005+ 0.0003 0.0005 Number of assets (0.0002) (0.0003) (0.0002) (0.0003) (0.0002) (0.0003) % Collateral rated by 0.1937** 0.1477+ 0.1760* 0.1019 0.1705* 0.1131 Moody's (0.0623) (0.0782) (0.0703) (0.0951) (0.0664) (0.0811) % Collateral rated by -0.2908** -0.3058** -0.2706** -0.2690** -0.2853** -0.3025** Fitch (0.0805) (0.0842) (0.0815) (0.0823) (0.0816) (0.0817) % Collateral rated by 0.0615 0.1056 0.0075 0.0687 0.0501 0.1073 S&P (0.1372) (0.1160) (0.1272) (0.1032) (0.1363) (0.1225) -0.3176 -0.2907 -0.2531 -0.4059+ -0.2941 -0.3095 % Subprime (0.2092) (0.2374) (0.2215) (0.2326) (0.2057) (0.2366) -0.0096 0.1498 0.0614 0.1395 0.0014 0.1353 % Alt-A Fixed Rate (0.2092) (0.1910) (0.2316) (0.1978) (0.2076) (0.1985) -0.0818 -1.5674* 0.0600 -0.8442 -0.1422 -1.5358** % Alt-A ARM (0.3111) (0.6014) (0.3295) (0.6402) (0.3003) (0.5424) 0.0766 0.2269 0.1374 0.2247 0.0823 0.1961 % CDO (0.2472) (0.1548) (0.2552) (0.1601) (0.2426) (0.1572) -0.3153 -0.2106 -0.2601 -0.2372+ -0.3104 -0.2393 % Prime RMBS (0.2056) (0.1417) (0.2122) (0.1388) (0.1993) (0.1403) 0.1543 0.1562 0.2365 0.1678 0.2090 0.1698 % Midprime RMBS (0.2003) (0.1568) (0.2044) (0.1641) (0.1932) (0.1541) 0.3001 0.3372 0.3010 0.2683 0.2841 0.2860 % CES RMBS (0.2646) (0.2768) (0.2751) (0.2703) (0.2592) (0.2716) 0.4927 -0.9796 0.8706 -0.6648 0.7884 -0.4542 % HELOC (1.8882) (1.8946) (1.8050) (1.8893) (1.8900) (1.8660) -0.7043+ -0.0314 -0.6561+ -0.0702 -0.7080+ -0.0780 % CMBS (0.3494) (0.2656) (0.3503) (0.2658) (0.3459) (0.2761) -1.2661** -1.1220+ -1.1627** -1.1630** -1.2732** -1.1413+ % CLO (0.2415) (0.6363) (0.2099) (0.3399) (0.2333) (0.6315) -0.0638 -0.0727+ -0.0540 -0.0625 -0.0615 -0.0691+ % Fixed Rate (0.0400) (0.0406) (0.0404) (0.0405) (0.0401) (0.0401) 0.0665 0.0745 0.0704 0.0790 0.0643 0.0743 % Synthetic (0.0798) (0.0686) (0.0789) (0.0679) (0.0797) (0.0689) % 2006-vintage 0.3297** 0.3590** 0.3307** 0.3526** 0.3251** 0.3425** collateral (0.0371) (0.0894) (0.0366) (0.0986) (0.0375) (0.0898) % 2007-vintage 0.3919** 0.4206** 0.3999** 0.4162** 0.3827** 0.4202** collateral (0.0839) (0.1192) (0.0773) (0.1037) (0.0851) (0.1181) 85
  • 86.
    M (1) M (2) F (1) F (2) SP (1) SP (2) Dependent Variable: Default Default Default Default Default Default -0.1240** -0.1456** -0.0951* -0.1452** -0.1290** -0.1511** IYear2005 (0.0386) (0.0521) (0.0352) (0.0289) (0.0390) (0.0538) -0.1560** -0.1898** -0.1179** -0.1823** -0.1552** -0.1891** IYear2006 (0.0405) (0.0523) (0.0375) (0.0328) (0.0409) (0.0539) -0.1030+ -0.1339+ -0.0673 -0.1286* -0.1061+ -0.1356+ IYear2007 (0.0533) (0.0676) (0.0515) (0.0531) (0.0530) (0.0695) 0.0164 -0.0493 -0.0119 0.0311 0.0394 0.0014 Intercept (0.2324) (0.1817) (0.2289) (0.1851) (0.2252) (0.1872) Interaction Variables % 2004-vintage -0.0148 -0.0110 -0.0098 collateral*x - (0.0151) - (0.0148) - (0.0153) % 2005-vintage 0.0211+ 0.0275* 0.0281* collateral*x - (0.0119) - (0.0120) - (0.0119) % 2006-vintage 0.0103 0.0163 0.0181 collateral*x - (0.0181) - (0.0200) - (0.0188) % 2007-vintage 0.0051 0.0141 0.0075 collateral*x - (0.0290) - (0.0245) - (0.0279) 0.0314 0.0467+ 0.0324 % Subprime*x - (0.0251) - (0.0251) - (0.0263) 0.2739** 0.1875+ 0.2376** % Alt-A ARM*x - (0.0915) - (0.1020) - (0.0693) -0.0802** -0.0789** -0.0817** % CMBS*x - (0.0207) - (0.0215) - (0.0213) 0.0040 0.0146 0.0010 % CLO*x - (0.0632) - (0.0296) - (0.0605) Regression Summary Statistics Adj. R2 0.6784 0.7027 0.6739 0.6969 0.6785 0.7025 SER 0.1625 0.1562 0.1636 0.1577 0.1624 0.1563 n 430 430 430 430 430 430 86
  • 87.
    Panel B: Therelationship between AAA losses and initial tranche credit ratings This table looks at the relationship between the amount and number of AAA tranches given to a CDO by each by each of the three CRAs (M/F/SP) and the potential AAA tranche losses. The dependent variable (loss) is defined as the % of defaulted assets minus the current amount of AAA subordination. Standard errors, clustered by CDO underwriter, are shown in parentheses under estimated coefficients. Coefficients are significant at the +10%, *5%, **1% significant level. Dependent Variable Loss (M) Loss (F) Loss (SP) 0.2883+ 0.3388 0.2043 M or F or SP %AAA (0.1417) (0.2635) (0.1262) 0.0412** 0.0689* 0.0441** M or F or SP # AAA Tranches (0.0079) (0.0243) (0.0078) -3E-05* -0.0001 0.0002** Original Balance (0.0000) (0.0001) (0.0001) 0.0003+ 0.0004 0.0000 Number of assets (0.0002) (0.0003) (0.0001) -0.0071 -0.0101 -0.0066 Number of Tranches (0.0059) (0.0075) (0.0060) 0.0216** 0.0029 0.0278** Average initial collateral rating (0.0062) (0.0183) (0.0052) 0.0270** -0.0306 0.0231* WAC (0.0093) (0.0202) (0.0083) 0.1979 0.0068 0.2072+ % Subprime (0.1325) (0.1114) (0.1109) 0.3187 0.6366** 0.1697 % Alt-A Fixed Rate (0.2139) (0.1400) (0.1743) 0.5894** -1.1181* 0.7328** % Alt-A ARM (0.1908) (0.4492) (0.1867) 0.5497** -0.0469 0.5463** % CDO (0.1340) (0.3654) (0.1137) 0.1759 0.0357 0.1108 % Prime RMBS (0.1355) (0.1239) (0.0876) 0.5048** 0.5547** 0.4760** % Midprime RMBS (0.1072) (0.1552) (0.1079) 0.5730+ 0.0325 0.5639* % CES RMBS (0.2865) (0.4032) (0.2207) -0.3777 -1.8354 -0.6061 % HELOC (1.0480) (1.4551) (0.7254) -0.1777 0.4522 -0.2195 % CLO (0.1559) (1.2401) (0.1356) 0.2193 0.0514 0.1850 % CMBS (0.1960) (0.2156) (0.1870) 0.2562** 0.3418** 0.2373** % 2006-vintage collateral (0.0430) (0.0869) (0.0404) 0.2347** 0.0701 0.2018* % 2007-vintage collateral (0.0750) (0.2215) (0.0744) 0.0221 0.0857 -0.0084 % Synthetic (0.0385) (0.0743) (0.0300) -0.0066 -0.2389** 0.0006 % Fixed Rate (0.0362) (0.0766) (0.0345) Intercept -0.8017** -0.2588 -0.7957** Regression Summary Statistics Adj. R2 0.5548 0.5854 0.5756 SER 0.1513 0.1298 0.1469 n 384 85 401 87
  • 88.
    Table 14: Explainingthe Rating Agency’s Mistakes Panel A: Mistakes due to general CDO Characteristics This table looks at the factors explaining the difference in the probability of default predicted by the initial collateral ratings of CDO assets given by each agency and the actual default rate (M, F, and S&P difference). The regressions use only CDOs from the high-information sample with n=430. Standard errors, clustered by CDO underwriter, are shown in parentheses under estimated coefficients. Coefficients are significant at the +10%, *5%, **1% significant level. Dependent Variable M Difference F Difference S&P Difference -3E-05 -3E-05 -2E-05 Original Balance (0.0000) (0.0000) (0.0000) 0.0004 0.0004+ 0.0004 Number of assets (0.0002) (0.0002) (0.0002) -0.2982** -0.2829** -0.2929** % Collateral rated by Fitch (0.0809) (0.0807) (0.0821) 0.2063** 0.1911* 0.1855** % Collateral rated by Moody's (0.0607) (0.0698) (0.0647) 0.0914 0.0545 0.0823 % Collateral rated by S&P (0.1330) (0.1238) (0.1306) 0.0358* 0.0299* 0.0366* Moody or Fitch or S&P (0.0142) (0.0126) (0.0148) 0.0011 0.0014 0.0010 WAC (0.0093) (0.0094) (0.0095) -0.3139 -0.2404 -0.2941 % Subprime RMBS (0.2166) (0.2233) (0.2132) -0.0036 0.0602 0.0061 % Alt-A Fixed Rate (0.2098) (0.2188) (0.2095) -0.1161 -0.0072 -0.1618 % Alt-A ARM (0.3094) (0.3086) (0.3055) 0.1150 0.1942 0.1225 % CDO (0.2510) (0.2569) (0.2487) -0.3154 -0.2500 -0.3112 % Prime RMBS (0.2097) (0.2138) (0.2054) 0.1766 0.2664 0.2270 % Midprime RMBS (0.2066) (0.2080) (0.1985) 0.2862 0.3194 0.2724 % CES RMBS (0.2807) (0.2813) (0.2778) 0.5213 0.9819 0.7918 % HELOC (1.7991) (1.6962) (1.7717) -1.2791** -1.1854** -1.2864** % CLO (0.2559) (0.2204) (0.2482) -0.7035+ -0.6454+ -0.7081+ % CMBS (0.3569) (0.3551) (0.3554) -0.0622 -0.0547 -0.0603 % Fixed Rate (0.0392) (0.0397) (0.0392) 0.0667 0.0706 0.0658 % Synthetic (0.0800) (0.0804) (0.0805) 0.3339** 0.3311** 0.3298** % 2006-vintage collateral (0.0331) (0.0332) (0.0339) 0.3677** 0.3606** 0.3607** % 2007-vintage collateral (0.0894) (0.0890) (0.0913) Intercept 0.0764 0.0687 0.0982 Regression Summary Statistics Adj. R2 0.6748 0.6727 0.6766 SER 0.1624 0.1634 0.1627 88
  • 89.
    Panel B: Effectof CDO Underwriter on CRA Mistakes This table examines whether the identity of the underwriter affected the accuracy of credit ratings. The regressions are identical to those in Panel A with the addition of fixed effect dummies for the identity of the CDO underwriter. The data are sorted according to average ranking, with lower numbers corresponding to fewer credit rating mistakes. Estimated coefficients, shown in parentheses under the ranking, are significant at the +10%, *5%, **1% significant level. Average S&P Underwriter M Difference F Difference Rank Difference Lehman Brothers 1 1* 1* 1* (-0.0713) (-0.0813) (-0.0756) Goldman Sachs 2 2+ 2* 2* (-0.0540) (-0.0422) (-0.0468) Dresdner Bank 3 3 3* 3+ (0.0002) (-0.0070) (-0.0006) Barclays Capital 4 4 4 4+ (0.0098) (0.0090) (0.0164) Credit Suisse 5 6 6 5 (0.0269) (0.0273) (0.0287) UBS 6 5 7** 6** (0.0266) (0.0294) (0.0297) Bank of America 7 7 5* 7* (0.0312) (0.0250) (0.0319) Citigroup 8 8+ 8 8 (0.0416) (0.0491) (0.0438) Wachovia 9 9+ 9** 9** (0.0435) (0.0559) (0.0475) RBS 10 10* 10** 10** (0.0609) (0.0611) (0.0613) Calyon 11 11+ 11 11 (0.0622) (0.0699) (0.0624) Merrill Lynch 12 12** 12** 12** (0.0677) (0.0727) (0.0690) Deutsche Bank 13 13** 14 13 (0.0876) (0.0943) (0.0884) Bear Stearns 14 14** 13 14 (0.0931) (0.0926) (0.0938) Morgan Stanley 15 15** 15** 15** (0.1306) (0.1372) (0.1369) WestLB 16 16** 16** 16** (0.1995) (0.1927) (0.2024) JP Morgan 17 17** 17* 17* (0.2092) (0.2086) (0.2127) 89
  • 90.
    Table 15: PotentialConflicts of Interest at the Rating Agencies This table looks at whether ratings were affected by the amount of business done with the underwriter. The coefficients are shown for the amount ($mm) of the underwriter’s CDOs rated by the CRA (“Balance”). The regressions specifications are: for (1) - (2) (4) and (6) in Table 11; for (2) – Table 12 panel A; for (3) – Table 13 Panel B; and for (4) – Table 14, panel A. Coefficients are significant at +10%, *5%, **1%. (1) (2) (3) (4) Dependent Variable % AAA (M/F/SP) Downgrades (M/F/SP) AAA Loss P.D. Diff (M/F/SP) Balance Moody's 6E-08 9E-06+ 5E-07+ 5E-07 Balance Fitch 3E-07 - -5E-07 -1E-06 Balance S&P 8E-08 1E-05** 5E-07+ 9E-07* 5. Discussion: What caused the CDO Market Meltdown? While surely not the whole story, the results in Section 4 offer insights into the CDO market meltdown, illustrating the factors that caused adverse CDO performance and highlighting the role of various market participants. Table 16 summarizes the major findings from the regression results. First, adverse CDO performance resulted primarily from the inclusion of low quality collateral originated in 2006 and 2007. The worst of these assets were the mezzanine (BBB-rated) tranches of residential mortgage securities backed by borrowers with poor credit, most specifically the Alt-A adjustable-rate mortgages. While this finding is not surprising, it is a stark illustration of the consequences of the excessive (and sometimes fraudulent) mortgage lending that occurred in 2006 and 2007 – lending that first fueled, but ultimately destroyed CDOs. The high level of CDO complexity helped to hide the true credit quality (or lack thereof) of these assets from investors, encouraging the production of even more bad assets to satiate the CDO feeding frenzy. 90
  • 91.
    Table 16: Summaryof Important Results This table summarizes the main findings of the regressions presented in Section 4. **Effects of CDO Properties** Result Explanation Possible Interpretations CDO Assets Increased defaults in CDOs with high levels of Negative house-price appreciation "The Housing subprime and Alt-A ARM RMBS, most significant and decline in underwriting Effect" for Alt-A ARM standards produced more defaults Increased defaults in CDOs with collateral Decline in underwriting standards; "The Vintage originated in 2006 and 2007; magnitude outweighs originated at peak of credit boom Effect" the "housing effect" (had farthest to fall) "The Consistently higher defaults in CDOs with more Complexity decreased Complexity assets; less consistent association of increased transparency hiding bad assets and Effect" defaults with synthetic and CDO collateral hindering risk assessments Liabilities Smaller deals created from bank's Transaction Smaller CDO deals associated with more left-over reject assets; small deals size downgrades created by inexperienced underwriters For a given rating, thinner tranches associated with Thin tranche more likely to be Tranche size more downgrades wiped out by single asset defaults Subordination For a given rating, tranches with lower amounts of Less credit support exposes bond- levels subordination experience more downgrades holder to more of the asset losses **Underwriters** Result Explanation Interpretation Underwriters varied in ability, "Underwriter CDO performance varies across underwriters, after level of due diligence, and effect" controlling for asset and liability properties philosophy Banks with larger market share of CDO Overly aggressive underwriters "Size effect" underwriting produce CDOs with worse had less time for each transaction performance Identity of most RMBS originators not important in CLTV, FICO, DTI, and other "Originator explaining defaults after controlling for mortgage borrower characteristics more effect" characteristics important than originator "ability" "Asymmetric Different balance of adverse Effect of using in-house assets as CDO collateral Information selection and moral hazard vs. depends on the specific bank Effect" reputation incentives among banks Write-downs best explained by the amount of The market dried up and 2007 Writedowns CDOs underwritten in 2007 CDOs could not be sold 91
  • 92.
    **Credit Ratings** Result Explanation Interpretation "Recycled Most important determinant of original CDO ratings No incentive to re-rate underlying ratings were ratings of the underlying assets collateral effect" Due diligence increased by more "Peer CDOs rated by more agencies were given less AAA agency ratings; Fitch only rated Pressure in general, but effect limited to addition of Fitch deals rejected by Moody's/S&P Effect" rating which were inherently inferior "Seniority More senior CDO tranches faced most severe Initial level of optimism was most effect" downgrades for a given level of CDO defaults inflated for AAA tranches Ratings did not fully capture all "Asset-class The meaning of a single credit rating grade varies information about the risk of a Effect" with asset type security "Super- AAA bondholders in CDOs with AAA losses are positively associated with a higher senior super seniors are not the first in the number of initial AAA tranches effect" waterfall priority No strong evidence that credit ratings were affected Primary reasons for rating agency "Conflicts of by the amount of fees brought by the CDO problems not associated with fee interest" underwriter system Uniformity High reliance on software that Original CDO ratings showed little variation despite of original banks learned to manipulate to give variation in asset types and underwriter quality ratings desired results Accuracy of defaults predicted by original credit Prediction Little information contained in rating depends on realized CDO performance since power original CDO credit ratings original ratings were very similar Second, not all CDO underwriters were equally responsible for the problems in the CDO market. Controlling for observable CDO asset and liability properties, it is clear that CDO performance was as much a product of the underwriting bank as it was the type of collateral. This means that even for CDOs with identical amounts of 2007, BBB, Alt-A RMBS, there was consistent variation in performance associated with the identity of the underwriter, most significant for the best and worst CDO underwriters. Some of the variation in underwriter quality is associated with the bank’s market share in underwriting CDOs, with the most prolific underwriters on average producing worse CDOs. Another source of underwriter variation might be the level of sophistication used 92
  • 93.
    to distinguish amongsuperficially identical securities with the same rating, vintage, and asset class, perhaps by selecting higher quality originators. However, better originator selection, at least with respect to RMBS collateral, is not enough to explain all the variation amongst CDO underwriters. The best and worst CDO underwriters used mostly the same RMBS suppliers for their CDOs; furthermore, the quality of RMBS assets is not highly correlated with the identity of specific originators after controlling for observable mortgage characteristics. It is also possible that underwriter quality is linked to the use of collateral that was originated by the underwriting firm, collateral for which the underwriter would likely have an informational advantage. Overall though, the effects associated with the use of in-house CDO collateral are inconsistent, leading to worse performance for some banks’ CDOs and better performance for others. While the causes of variation amongst CDO underwriters are unclear, the “underwriter effect” is most likely a combination of the bank’s ability, effort, and overall philosophy used to structure and select assets for its CDOs. Lastly, credit ratings failed to capture the true amounts of risk associated with different CDOs. There was a pronounced lack of variation in original CDO ratings, with most transactions awarded similar amounts of AAA, despite differences in the asset and liability characteristics and the identity of the underwriter. Initial CDO ratings had little relationship to the type or vintage of the collateral or the quality of the underwriter, despite the fact that this information has proved important in explaining ex-post CDO performance. This lack of variation was most likely a result of the rating agencies’ over- reliance on computer models. The investment banks were given access to the software used by the rating agencies, and became skilled at selecting collateral that would give the 93
  • 94.
    highest amount ofAAA possible. Presumably, underwriters found ways to garner similar ratings for a multitude of CDOs by manipulating certain modeling inputs, most easily the correlation number. The realized accuracy of the original credit ratings is a direct result of the realized performance of the CDO; since most CDOs were initially treated equally, only the highest quality CDOs have performed as predicted by their initial credit ratings. The errors of the rating agencies stemmed from neither conflicts of interest nor preferential treatment given to certain banks. The true culprit behind the rating agencies’ failure was the outsourcing of credit analysis to computer models and the low level of human input used to rate CDOs. Using the anecdotal and empirical evidence presented in this paper, I offer the following interpretation of the CDO market meltdown. CDOs were flawed from the outset, used too often as a junkyard for risky and substandard assets. CDOs survived because of changes in the credit markets that produced an excess quantity of these assets and herds of investors hungry for higher yields. The first CDO underwriters entered the market before the peak of the credit boom, and many of their CDOs performed poorly. For instance, JP Morgan’s CDOs, 80% of which were issued before 2005, showed the greatest underperformance among the top CDO underwriters. However, JP Morgan virtually exited the CDO market in 2005, possibly disheartened by its first failed creations. In contrast, for banks that discovered CDOs post-2005, the situation was markedly different. The U.S. was experiencing an unprecedented housing boom, kindling the belief that home prices would rise indefinitely, a belief which in turn incited the creation of previously unimaginable types of high-yielding mortgage loans. These new 94
  • 95.
    mortgages provided theperfect raw material for CDOs, intoxicating underwriters and rating agencies with record profits. The marriage of the CDO and subprime was thus consummated and Wall Street became inextricably linked with the riskiest homebuyers in America. In 2006, Merrill Lynch, Citigroup, and Bear Stearns plunged headfirst into the CDO business, loading up on the steady supply of questionable mortgages coming from a milieu of mortgage brokers located mostly in Orange County California (prime among them the now defunct lending giant Countrywide). The CDOs manufactured in 2006 and 2007 were in large part a direct manifestation of their ingredients - pools of tainted assets precariously situated atop a wave of home-price appreciation. As investors became addicted to the higher yields of investment-grade CDOs, their rose-colored glasses focused on the AAA rating rather than the pool of shoddy subprime mortgages they were really buying. The rating agencies put too much faith in their formulas, conveniently forgetting that a model is only as good as its inputs. Since there was little historical data on subprime or CDO performance, especially during times of economic distress, the inputs were essentially pulled from thin air, adjusted by the underwriters to maximize their AAA allotment. “Diversification” was the magic word that could justify the inclusion of anything remotely resembling a legitimate fixed-income asset, as Wall Street and the rating agencies claimed that even the lowest quality bonds would not all default at the same time. However, that is exactly what happened. The trillion-dollar CDO market, built atop a single assumption, crumbled to ruins when house prices did the impossible: they first stopped rising and then they fell. In the end, who was hurt worst when the CDO 95
  • 96.
    market crashed hadless to do with what they were doing than with when they were doing it. The best predictor of banks’ write-downs was not the quality of their CDOs, but instead the amount of CDOs they issued in 2007, for very few of these CDOs would ever leave the balance sheets of their creators. The CDO market was a game of musical chairs and the winners were those who sat down early on. The losers were those that lived by the philosophy of Citigroup’s ex-CEO, Charles Prince, that, “as long as the music is playing, you’ve got to get up and dance.” Unfortunately, certain players in the CDO market, including Merrill Lynch, Citigroup, Bear Stearns, Countrywide, S&P, and Moody’s, were having too much fun to notice when the music ended, never pausing from their CDO craze for long enough to see the warning signs develop. Once the conveyor belt stopped, it turned out that the hot potato, which had so efficiently been passed along the chain from mortgage broker to Wall Street and beyond, had been leaving pieces of itself along the way. Once investors no longer wanted to buy CDOs, Wall Street banks were left holding the excess of unsold CDOs and yet-to-be- securitized CDO assets. And once Wall Street CDOs no longer wanted to buy subprime mortgages, mortgage originators were left holding a huge number of mortgage loans they knew had little chance of ever being repaid. And once mortgage companies no longer wanted to originate risky mortgages, homebuyers were left holding the subprime mortgages they had planned to refinance. And once homebuyers began to default on their mortgages in mass, it became clear that the credit rating agencies had made a colossal mistake, and Moody’s, Fitch, and S&P were left holding the burden of a shattered reputation in a business built on the necessity of trust. 96
  • 97.
    While the storyof this collapse is now familiar to many, the details of the CDOs behind it are still becoming known. The empirical analysis of this paper has served to elucidate the factors that contributed to the collapse of the CDO market, many of which were already presume to be true, but some of which were not fully understood. At the broadest level, we can say that the CDO was killed by excess. The excess of complexity, the excess of subprime, the excess of bets on subprime using credit default swaps, the excess of AAA ratings, the excess of bad mortgages, even the excess of wealth – all contributed to the creation of CDOs preordained to a future of adverse performance. At this point, perhaps the only question that really matters is what to do with the remains of these excesses that are slowly poisoning the world economy. The key to cleaning up the CDO mess is to unravel the layers of complexity to the point at which investors can once again make informed risk assessments; until there is increased transparency, investors will assume everything to be worth zero. This paper has begun the process, documenting the composition of ABS CDOs and evaluating their performance, but it looks only at broad asset classes and vintages. Given that almost all of the problem CDOs were composed of 2006/2007-vintage RMBS and CDO collateral, the analysis needs to go a step further, conducting detailed analysis of the individual securities inside the CDOs. At this time, few investors have the resources or incentives to undertake this grueling ordeal.68 Many market participants have suggested that the government create an aggregator bank, the so-called “bad-bank” structure, to buy the CDOs and then sell their assets individually.69 This may be the best option, as few 68 However, it is rumored that certain hedge funds are once again becoming interested in purchasing CDO and RMBS assets, whose quality might be low, but whose prices are even lower. As the dust settles, more investors will find ways to spot deals amongst these disfavored assets. 69 See Appendix D for one such proposal. 97
  • 98.
    investors will everfeel confident in computer models or their own ability to properly value a CDO. 70 6. Conclusions In this paper, I have used empirical data to illuminate some of the causes of the CDO market collapse. The results show that problems in the CDO market arose from a combination of poorly constructed CDOs, irresponsible underwriting practices, and flawed credit rating procedures. One of the main factors associated with the underperformance of CDOs was the inclusion of low quality collateral originated in 2006 and 2007 that was exposed to the residential housing market. The majority of CDOs issued after 2005 contained remarkably high levels of this collateral, allowing the decline in housing prices to cause a rapid deterioration in the financial health of CDOs. Second, the CDO underwriters played an important role in determining CDO performance, even after controlling for the asset and liability characteristics of their CDOs. The unobserved causes for this underwriter effect might be the ability, diligence, or philosophy of the underwriting bank. Lastly, the credit ratings of CDOs failed in their stated purpose, namely to provide a reflection of the CDO’s ability to make timely payments of principal and interest. This failure arose from a combination of over-automation and heavy reliance on inputs whose accuracy was not easily judged. While the findings of this paper begin to sort through the wreckage of the CDO market, much more analysis is warranted in order to fully understand the causes of this profound event in financial history. My preliminary investigation into CDOs has 70 In an interview with David Faber in the CNBC documentary, “House of Cards,” Alan Greenspan admitted that he did not fully comprehend CDOs. 98
  • 99.
    unearthed far morequestions than it has answered: 1) What explains the variation in performance found among superficially identical assets within the CDOs, assets that carried the same vintage, rating, and underlying collateral?; 2) Was the “underwriter effect” due to the ability, technology, diligence, or philosophy of the underwriter, or something else altogether?; 3) What explains the elimination of Fitch from the CDO rating business, and was it related to the apparent conservatism of its ratings?; and lastly, 4) What allowed a relatively arcane market to grow to such proportions that it was able to contribute to the loss of billions of dollars and the destruction of large financial institutions? The CDO may be unequivocally dead, but answering these questions is nevertheless important. While the collateralized debt obligation will not be the cause of another financial maelstrom, it is likely that the same combination of market imperfections, misaligned incentives, and human excesses that spawned this financial monster will not disappear. By understanding the story of the CDO market meltdown, we can develop more effective regulatory and economic practices to prevent history from repeating. 99
  • 100.
    Bibliography Adelson, Mark (2006),“Bond Rating Confusion.” Nomura Fixed Income Research, June 29, 2006. Adelson, Mark, and D. Jacob (2008), “The subprime problem: causes and lessons.” January 8, 2008. An, Xudong, et. al. (2006), “Subordinations Levels in Structured Financing.” University of California at Berkeley, August 15, 2006. Benmelech, Efraim and Jennifer Dlugosz (2008), “The Alchemy of CDO Credit Ratings.” Harvard University and NBER. Bethel, Jennifer, et. al. (2008), “Law and Economic Issues in Subprime Litigation.” SSRN: Harvard John M. Olin Discussion Paper Series, March, 2008. BIS Committee on the Global Financial System (2008), “Ratings in structured finance: what went wrong and what can be done to address shortcomings?” Bank for International Settlements, July 2008. Bluhm, Christian (2003), “CDO Modeling: Techniques, Examples and Applications. HypoVerinsbank, December 10, 2003. Brennan, Michael J. et al. (2008), “Tranching and Rating.” SSRN, http://ssrn.com/abstract=1108556, March 10, 2008. Brunnermeier, Markus K. (2008), “Deciphering the Liquidity and Credit Crunch 2007- 08.” http://www.princeton.edu/~markus/, November 15, 2008. Calomiris, Charles (2008), The Subprime Turmoil: What’s Old, What’s New, and What’s Next.” Columbia Business School, August 20, 2008. Coval, Joshua D. et. al. (2007), “Economic Catastrophe Bonds.” Working Paper, June 2007. Coval, Joshua et. al. (2009), “The Economics of Structured Finance.” Harvard Business School. Deng, Yongheng et. al. (2008), “CDO Market Implosion and the Pricing of CMBS and Sub-Prime ABS.” University of Southern California, April, 2008. Drucker, S (2008), “Inside Information and Market Making in Secondary Mortgage Markets.” Forthcoming, Review of Financial Studies. 100
  • 101.
    Fender, Ingo andJohn Kiff (2004), “CDO rating methodology: Some thoughts on model risk and its implications.” BIS Working Papers, No. 163, November 2004. Gan, Yingjin and Christopher Mayer (2006), “Agency Conflicts, Asset Substitution, and Securitization.” Working Paper 12359, http://www.nber.org/papers/w12359, July 2006. Garcia, Joao et. al. (2008), “Dynamic Credit Portfolio Management: Linking Credit Risk Systems, Securitization and Standardized Credit Indices.” Dexia Bank, January 31, 2008. Gibson, Michael S. (2004), “Understanding the Risk of Synthetic CDOs.” Federal Reserve Board: Division of Research and Statistics, July 2004. Gorton, Gary (2008), “The Panic of 2007.” NBER, August 25, 2008. Griffin, John M. and Dragon Yongjun Tang (2008), “What Drove the Mismatch between Initial CDO Credit Ratings and Subsequent Performance?” Working paper, University of Texas. Heitfield, Erik (2008), “Parameter Uncertainty and the Credit Risk of Collateralized Debt Obligations.” Federal Reserve Board, working paper. Jiangli, Wenying, and Matt Pritsker (2008), “The Impacts of Securitization on US Bank Holding Companies.” SSRN, http://ssrn.com/abstract=1102284, March, 2008. Kane, Edward (2008), “Regulation and Supervision: An Ethical Perspective.” NBER Working Paper 13895, http://www.nber.org/papers/w13895, March, 2008. Krahnen, Jan Pieter, and Christian Wilde (2005), “Risk Transfer with CDOs.” Goethe- University, March 15, 2005. Lowenstein, Roger (2008), “Triple-A Failure.” New York Times Sunday Magazine, April 22, 2008. Mayer, Chris, Karen Pence, and Shane Sherlund (2008), “The Rise in Mortgage Defaults.” The Federal Reserve Board: Finance and Economics Discussion Series, November 20, 2008. Mason, Joseph R. and Joshua Rosner (2007), “Where did the risk go? How Misapplied Bond Ratings cause Mortgage Backed Securities and Collateralized Debt Obligation Market Disruptions.” SSRN, http://ssrn.com/abstract=1027475, May 14, 2007. Mian, Atif and Amir Sufi (2008), “The Consequences of Mortgage Credit Expansion: Evidence from the 2007 Mortgage Default Crisis.” Working Paper 13936, http://www.nber.org/papers/w13936, April 2008. 101
  • 102.
    Mitchell, Janet (2004),“Financial Intermediation Theory and the Sources of Value in Structured Finance Markets.” National Bank of Belgium, December, 2004. Muolo, Paul, and Mathew Padilla (2008). Chain of Blame: How Wall Street Caused the Mortgage and Credit Crisis. Hoboken, N.J.: John Wiley & Sons, 2008. Raynes, Sylvain, and Ann Rutledge (2003). The Analysis of Structured Securities, Oxford University Press, 2003. SEC (2008), “Summary Report of Issues Identified in the Commission Staff’s Examinations of Select Credit Rating Agencies.” July 2008. Tavakoli, Janet (2005), “Structured Finance: Rating the Rating Agencies.” GARP Risk Review, Issue 22, January/February 2005. U.S. Senate (2008), “Turmoil in U.S. Credit Markets: The Role of the Credit Rating Agencies.” Testimony of Arturo Cifuentes before the Senate Committee on Banking, Housing and Urban Affairs, April 22, 2008. UBS (2008), “Shareholder Report on UBS’s Write-Downs,” April 18, 2008. 102
  • 103.
    Appendix A.1: VariableDefinitions **CDO-Level Variables** Variable Description General Characteristics Year Year in which CDO was issued Original CDO Balance Original par amount of liabilities issued by CDO in millions of dollars Current CDO Balance Current par amount of outstanding liabilities issued by CDO in millions of dollars Original Collateral Par Par amount of CDO collateral at time of issuance (before ramp-up) in millions of dollars Current Collateral Par Par amount of CDO collateral as of December 2008 in millions of dollars Number of assets Number of assets held as collateral in CDO Number of Tranches Number of tranches issued by CDO WAC Weighted average of tranche coupon payments % AAA Subordination Original amount of subordination for the AAA CDO tranche (as a % of total) Collateral % Fixed Rate Percent of CDO collateral that pays fixed rate coupons % Synthetic Percent of CDO collateral that is synthetic (credit default swaps) % HEL Percent of total CDO collateral made up of tranches of residential mortgage- backed securities (RMBS) backed by home equity loans (equivalent to subprime) % RMBS Percent of total CDO collateral made up of tranches of residential mortgage- backed securities (RMBS) backed by all mortgages not classified as home equity loans % CMBS Percent of total collateral made up commercial mortgage-backed securities % CDO Percent of total CDO collateral made up of other CDO’s tranches % Alt-A Fixed Rate Percent of total CDO collateral made up of tranches of residential mortgage- backed securities (RMBS) backed by Alt-A fixed rate mortgages % Alt-A ARM Percent of total CDO collateral made up of RMBS tranches backed by Alt-A adjustable rate mortgages % Prime Percent of total CDO collateral made up of RMBS tranches backed by prime mortgages % Midprime Percent of total CDO collateral made up of RMBS tranches backed by midprime mortgages (FICO 625-700) % Subprime Percent of total CDO collateral made up of RMBS tranches backed by subprime mortgages (FICO below 625) 103
  • 104.
    Variable Description % HELOC Percent of total CDO collateral made up of tranches from home equity line of credit securitizations % CLO Percent of total CDO collateral made up of tranches from collateralized loan obligations % CES Percent of total CDO collateral made up of RMBS tranches backed by closed-end second lien mortgages % Other Percent of total CDO collateral made up of tranches from other asset-backed securities (including auto loans, credit cards, manufactured housing, etc.) % 2006-vintage Percent of total CDO collateral that was originated in 2006 % 2007-vintage Percent of total CDO collateral that was originated in 2007 Credit Ratings Original Fitch Rating Weighted average original rating of CDO tranches by Fitch on a numeric scale Original S&P Rating Weighted average original rating of CDO tranches by S&P on a numeric scale Original Moody Rating Weighted average original rating of CDO tranches by Moody’s on a numeric scale Current Fitch Rating Weighted average current rating of CDO tranches by Fitch on a numeric scale Current S&P Rating Weighted average current rating of CDO tranches by S&P on a numeric scale Current Moody Rating Weighted average current rating of CDO tranches by Moody’s on a numeric scale Fitch Downgrade Weighted average of CDO downgrades by Fitch S&P Downgrade Weighted average of CDO downgrades by S&P Moody Downgrade Weighted average of CDO downgrades by Moody's % AAA Fitch* Average % AAA given by Fitch to CDOs; includes only those CDOs with at least 75% of tranches rated by Fitch % AAA S&P* Average % AAA given by S&P to CDOs; includes only those CDOs with at least 75% of tranches rated by S&P % AAA Moody* Average % AAA given by Moody's to CDOs; includes only those CDOs with at least 75% of tranches rated by Moody's % Rated Fitch Percent of CDO tranches that were originally assigned a rating by Fitch % Rated S&P Percent of CDO tranches that were originally assigned a rating by S&P % Rated Moody Percent of CDO tranches that were originally assigned a rating by Moody’s Performance Fitch Default -P.D. The difference in realized CDO asset defaults and the probability of default given by original Fitch ratings S&P Default -P.D. The difference in realized CDO asset defaults and the probability of default given by original S&P ratings Moody’s Default -P.D. The difference in realized CDO asset defaults and the probability of default given by original Moody's ratings EOD Dummy variable that is equal to 1 if the CDO experienced an event of default as of May 2008 Default Percent of CDO collateral that has defaulted as of February 2008 104
  • 105.
    ** Tranche-Level Variables** Variable Description Tranche # Number of tranche in capital structure Coupon Fixed rate equivalent of tranche coupon payment as of December 2008 Original Balance Original tranche balance in millions of dollars Current Balance Current tranche balance in millions of dollars % of Transaction Current tranche balance as a percent of all outstanding CDO liabilities % Subordination Current tranche subordination **Other Variables** Variable Description Fitch Estimated P.D. Cumulative probability of default predicted by asset's original Fitch rating, according to matrix in Appendix C S&P Estimated P.D. Cumulative probability of default predicted by asset's original S&P rating, according to matrix in Appendix C Moody’s Estimated P.D. Cumulative probability of default predicted by asset's original Moody's rating, according to matrix in Appendix C Originator Concentration Average number of CDO assets originated by a single originator FICO Average FICO score for all mortgages securitized by the given originator and vintage CLTV Average combined loan to value score for all mortgages securitized by the given originator and vintage DTI Average debt-to-income ratio for all mortgages securitized by the given originator and vintage WALA Weighted average life off all mortgages in months 30-60d DQ Percent of loans that were either 30-day or 60-day past due as of October 2008 REO or FC Percent of loans that were real-estate owned or in foreclosure as of October 2008 Cum. Loss Weighted average net cumulative loss on underlying collateral pools as of October 2008 % HG Percent of CDOs classified as high grade; high grade CDOs are those whose assets had an original weighted average rating factor of less than 180, otherwise classified as mezzanine Write Down Total write-downs reported on ABS CDOs as of February 6, 2009, in millions of dollars WD/Assets Write Down divided by the total assets of the bank at year-end 2007 105
  • 106.
    Appendix A.2: SummaryStatistics Panel A: CDO Level Statistics **General Characteristics** High Information Sample Full Sample Variable Obs. Mean S.D. Min Max Obs. Mean S.D. Min Max Year 430 2005.97 0.75 2004 2007 735 2004.95 1.78 1999 2007 Original CDO 430 971.23 665.71 96 5000 735 829.44 682.63 57 6000 Balance Current CDO 430 904 647.87 68 4976 735 741.28 682.83 28 6000 Balance Original 430 969.57 659.72 0 4985 735 842.59 699.9 0 6920 Collateral Par Current 430 1079.03 774.69 5 5701 735 874.28 819.46 5 6640 Collateral Par Number of 430 152.17 62.24 34 366 735 150.42 86.81 1 552 assets Number of 430 7.74 1.76 3 16 735 7.51 2.28 2 16 Tranches WAC 430 2.79 1.2 0 6 735 3.12 1.34 0 10 % AAA 430 0.19 0.13 0 1 735 0.22 0.16 0 1 Subordination **Collateral** High Information Sample Full Sample Variable Obs. Mean S.D. Min Max Obs. Mean S.D. Min Max % Fixed Rate 430 36.73% 28.51% 0% 100% 735 43.10% 32.04% 0% 100% % Synthetic 430 21.48% 26.91% 0% 100% 735 13.65% 23.55% 0% 100% % HEL 430 - - - - 735 33.04% 25.46% 0% 100% % RMBS 430 - - - - 735 13.21% 17.70% 0% 100% % CMBS 430 4.12% 10.19% 0% 90% 735 6.75% 16.78% 0% 100% % CDO 430 16.38% 19.76% 0% 100% 735 13.52% 20.08% 0% 100% % Alt-A 430 3.51% 6.57% 0% 64% - - - - - Fixed Rate % Alt-A 430 2.24% 4.12% 0% 44% - - - - - ARM % Prime 430 9.37% 12.88% 0% 92% - - - - - % Midprime 430 30.01% 18.88% 0% 78% - - - - - % Subprime 430 25.37% 16.14% 0% 100% - - - - - % HELOC 430 0.14% 0.43% 0% 3% - - - - - % CLO 430 2.59% 9.05% 0% 66% - - - - - % CES 430 1.85% 3.22% 0% 18% - - - - - % Other 430 3.77% 7.95% 0% 73% - - - - - % 2006- 430 37.42% 28.97% 0% 100% - - - - - vintage % 2007- 430 8.12% 13.41% 0% 83% - - - - - vintage 106
  • 107.
    **Credit Ratings** High Information Sample Full Sample Variable Obs. Mean S.D. Min Max Obs. Mean S.D. Min Max Original Fitch 94 2.16 1.16 1.1 6.4 270 2.36 1.29 0 7.6 Rating Original S&P 426 2.06 0.94 1 6.4 717 2.13 1.19 0.18 13.06 Rating Original 406 2.04 0.93 1 5.5 681 2.13 1.11 0.18 13.06 Moody Rating Current Fitch 94 2.16 1.15 1.1 6.4 268 2.8 2.15 1 15.88 Rating Current S&P 428 14.27 6.05 1 22 715 10.85 7.08 1 22 Rating Current 406 14.2 6.11 1.1 21 680 10.97 7.02 1 21 Moody Rating Fitch 94 0 0 0 0 268 0.43 1.79 -0.3 13.9 Downgrade S&P 426 12.23 6.01 -0.9 19.8 713 8.72 7.12 -2.4 19.8 Downgrade Moody 406 12.15 6.02 -0.8 19.8 679 8.85 7.01 -2.3 19.8 Downgrade % AAA 86 81.80% 8.70% 57% 96% 237 79.20% 9.10% 50.30% 97% Fitch* % AAA 408 82.60% 10.10% 52% 99% 665 81.60% 9.90% 50.30% 99% S&P* % AAA 389 82.80% 10.10% 52% 99% 632 81.70% 10.10% 50.30% 99% Moody* % Rated 430 17.70% 34.10% 0% 100% 735 30.00% 40.30% 0% 100% Fitch % Rated S&P 430 80.20% 14.00% 0% 100% 735 77.70% 20.10% 0% 100% % Rated 430 76.90% 22.30% 0% 100% 735 74.10% 24.80% 0% 100% Moody **Performance** High Information Sample Full Sample Variable Obs. Mean S.D. Min Max Obs. Mean S.D. Min Max Fitch 430 36.24% 28.57% -5.3% 99.60% - - - - - Default -P.D. - - - - - S&P 430 36.27% 28.61% -5.1% 99.70% - - - - - Default -P.D - - - - - Moody’s 430 35.94% 28.48% -5.1% 99.70% - - - - - Default -P.D EOD 430 0.32 0.47 0 1 735 0.26 0.44 0 1 Default 430 37.60% 28.60% 0% 100% 735 26.50% 27.30% 0% 100% Downgrade 430 11.77 6.01 -1 20 732 8.62 6.76 -1 19.86 107
  • 108.
    Panel B: TrancheLevel Statistics Variable Obs. Mean S.D. Min Max Tranche # 5558 4.60 2.76 1 16 Coupon 4797 4.83% 2.5% 0% 30% Original Balance 5557 109.41 266.15 0 5400 Current Balance 5558 97.88 256.74 0 5400 % of Transaction 5558 13% 20% 0% 100% % Subordination 5551 15.97% 19.2% 0% 100% Original Fitch Rating 1685 5.11 3.85 1 15 Original S&P Rating 4347 4.70 3.77 1 16 Original Moody’s Rating 4123 4.62 3.72 1 16 Current Fitch Rating 4161 14.27 7.45 1 21 Current S&P Rating 4379 13.79 7.24 1 22 Current Moody’s Rating 1685 5.57 4.51 1 21 Change in Fitch Rating 4088 9.60 7.22 -7 20 Change in S&P Rating 1685 0.46 2.07 -3 17 Change in Moody’s Rating 4305 9.07 7.23 -6 21 Panel C: Individual Collateral Asset Statistics* Variable Obs. Mean S.D. Min Max Original Fitch Rating 27355 6.22 3.66 1 16 Original S&P Rating 60672 5.99 3.35 1 16 Original Moody’s Rating 59011 6.32 3.52 1 16 Current Fitch Rating 26169 7.43 4.55 1 22 Current S&P Rating 64018 6.86 4.19 1 22 Current Moody’s Rating 62551 7.75 4.99 1 22 Fitch Estimated P.D. 27158 1.35% 1.28% 0.02% 34.94% S&P Estimated P.D. 60313 1.23% 1.29% 0.02% 34.97% Moody’s Estimated P.D. 58673 1.46% 1.50% 0.02% 34.94% Originator Concentration 65394 466.97 431.61 1 1501 FICO 34131 625.50 14.00 570 670 LTV 34131 81.05% 1.95% 73.5% 87.5% CLTV 34131 85.45% 3.46% 73.5% 93.4% DTI 29952 40.51% 3.08% 28% 44% * Based on CDOs from the high-information sample. 108
  • 109.
    Panel D: CDOUnderwriter Summary Statistics Originator # of Assets Avg. Asset R a t i n g % Fi x % Syn % HEL % RMB S % CMB S % CDO % 2006 % 2007 D e f a u l t Bank of America 142 4.89 31% 8% 33% 13% 11% 18% 39% 7% 28% Barclays 182 2.84 22% 4% 30% 34% 8% 10% 51% 3% 16% Bear Stearns 125 7.43 47% 30% 32% 9% 3% 12% 45% 14% 57% Calyon 207 5.13 37% 24% 36% 22% 3% 10% 56% 7% 45% Citigroup 179 5.54 30% 20% 41% 11% 3% 19% 42% 8% 41% Credit S. 150 5.49 36% 25% 30% 16% 2% 20% 42% 10% 38% Deutsche 126 7.68 41% 23% 43% 17% 2% 7% 40% 6% 45% Dresdner 204 2.60 10% 2% 46% 21% 2% 22% 33% 8% 21% Goldman 166 5.35 34% 10% 36% 13% 26% 8% 30% 3% 15% JP Morgan 118 6.77 61% 52% 20% 12% 2% 26% 42% 3% 68% Lehman 180 6.55 26% 10% 43% 12% 7% 16% 42% 8% 35% Merrill 218 4.62 30% 19% 43% 18% 3% 15% 48% 13% 45% Morgan 122 8.01 49% 32% 36% 11% 10% 9% 34% 5% 52% RBS 158 6.16 64% 31% 37% 14% 5% 12% 40% 8% 37% UBS 206 7.72 47% 44% 32% 19% 4% 5% 30% 5% 38% Wachovia 171 4.68 31% 15% 34% 18% 8% 10% 25% 11% 19% WestLB 143 2.71 34% 0% 30% 13% 8% 17% 23% 10% 19% small 144 3.27 10% 5% 30% 38% 1% 11% 45% 25% 24% unknown 109 4.74 50% 39% 14% 2% 20% 18% 56% 18% 38% 109 Total CDO WD/ # of # of Tranche % Write Originator Balance Size Coupon % AAA E O D Downgrade Assets CDOs Tranches Rating HG Down ($mm ) ($mm) ($mm) (%) Bank of America 29 14,982 761.84 3.17 7.55 1.61 85% 56% 0% 13.75 9,089 0.53% Barclays 9 13,999 2041.14 3.26 6.97 2.40 93% 96% 45% 14.14 3,254 0.13% Bear Stearns 54 26,046 831.56 3.16 7.81 2.10 77% 20% 37% 12.97 2,300 0.58% Calyon 15 19,575 1602.78 2.69 8.72 1.79 87% 62% 47% 14.50 3,400 0.42% Citigroup 80 75,088 1583.38 2.75 7.74 2.37 87% 60% 68% 15.18 3,4106 1.56% Credit S. 63 34,808 944.74 2.72 6.89 1.86 85% 52% 40% 14.40 3,427 0.29% Deutsche 47 23,442 798.12 3.02 7.89 2.57 67% 14% 0% 12.02 2,092 0.07% Dresdner 7 8,882 1552.33 3.65 10.66 1.34 91% 100% 0% 14.94 1,604 0.29% Goldman 59 79,202 1760.99 2.55 8.98 2.36 75% 72% 5% 11.77 0 0.00% JP Morgan 10 5,558 756.12 3.00 7.35 2.53 82% 55% 82% 14.07 1,300 0.08% Lehman 30 21,627 1222.29 3.49 7.35 2.28 82% 35% 53% 15.42 200 0.03% Merrill 104 100,478 1504.75 3.03 8.39 1.54 89% 75% 44% 15.54 26,100 2.56% Morgan 20 12,983 849.44 2.57 8.39 2.62 78% 14% 60% 11.48 7,800 0.75% RBS 32 22,808 874.27 2.40 7.72 2.35 84% 42% 40% 15.18 3,609 0.10% UBS 45 32,651 1218.71 2.62 7.87 2.69 78% 16% 26% 13.15 21,870 1.08% Wachovia 49 36,810 1313.86 3.14 7.66 1.97 89% 81% 16% 10.09 1,860 0.24% WestLB 8 8,160 1096.39 2.94 5.91 2.60 88% 90% 0% 9.30 0 0.00% small 31 30,989 2224.06 3.19 7.62 1.70 91% 81% 25% 9.81 N/A N/A unknown 43 41,551 1477.98 2.50 7.94 1.85 88% 71% 58% 13.63 N/A N/A
  • 110.
    Panel E.1: RMBSOriginator Summary Statistics 1 Originator Parent Total Total WALA 30-60d REO Cum. # Par ($m) DQ or FC Loss Aames Mortgage 187 975 41.54 9.0% 25.3% 3.1% ABFC Bank of America 1,121 7,122 42.41 4.2% 12.7% 2.3% Accredited Mortgage 417 2,293 35.78 5.1% 14.5% 2.6% ACE 1,607 8,655 45.92 8.6% 27.6% 5.1% Aegis 270 1,337 46.50 8.8% 19.1% 5.6% Ameriquest 939 5,645 40.67 5.1% 17.9% 1.9% Argent Citigroup 652 4,188 38.23 6.3% 31.9% 3.7% BayView 379 1,255 69.84 5.5% 10.5% 5.0% Bear Stearns 2,342 13,716 45.00 7.0% 14.8% 5.2% Carrington 694 4,439 41.75 8.3% 26.4% 1.5% C-Bass 699 3,538 39.90 9.7% 17.9% 3.6% Citigroup 1,194 8,335 37.75 6.2% 18.2% 7.4% Countrywide Bank of America 4,390 30,078 43.32 8.4% 12.9% 1.5% Delta 201 1,059 35.61 10.0% 13.0% 1.9% Deutsche Bank 221 1,171 38.45 4.5% 12.5% 9.2% DLJ Mortgage Credit Suisse 772 4,324 41.91 10.0% 23.0% 3.1% Encore Bear Stearns 169 1,059 34.12 8.4% 23.8% 2.3% EquiFirst Barclays 124 549 43.39 5.8% 21.8% 3.2% Fieldstone 310 1,902 10.2% 29.1% 7.7% First Franklin Merrill Lynch 1,678 10,220 33.52 7.9% 23.8% 4.4% Fremont 709 3,887 34.82 10.5% 29.8% 6.5% Goldman Sachs 1,837 12,330 36.45 9.3% 22.3% 4.7% GSAA Goldman Sachs 553 3,187 39.66 5.5% 18.7% 1.5% HarborView RBS 344 2,094 42.06 6.6% 16.1% 8.3% HEAT Credit Suisse 1,837 11,436 181.39 3.2% 7.2% 5.0% HSBC 500 2,855 6.6% 23.8% 7.9% IndyMac 682 3,923 40.70 4.8% 5.1% 0.4% Ixis Morgan Stanley 243 1,470 9.6% 40.7% 5.3% JPMorganChase JP Morgan 1,886 14,064 35.49 5.5% 12.3% 6.5% Long Beach Washington Mutual 1,293 8,197 35.47 7.8% 13.1% 4.0% MASTR UBS 1,184 6,059 62.83 4.7% 9.0% 4.5% Merrill Lynch 1,346 7,974 37.39 6.0% 16.1% 8.5% Morgan Stanley 3,224 18,273 44.94 6.7% 16.9% 4.8% New Century 821 5,390 42.58 7.2% 19.2% 2.3% Nomura 570 2,977 38.78 7.3% 19.9% 8.4% NovaStar 522 3,029 28.05 7.7% 17.5% 3.4% Option One 547 2,774 36.20 6.9% 22.5% 3.1% Other 15,084 103,938 57.80 6.6% 15.4% 5.7% OWNIT 310 1,666 5.6% 9.3% 1.6% Park Place 719 4,409 46.87 7.5% 19.1% 4.5% Popular 343 1,632 22.21 6.9% 17.9% 3.7% RALI GMAC 476 3,324 31.43 7.7% 13.6% 6.7% RAMP GMAC 687 3,571 34.67 6.1% 15.4% 12.3% RASC GMAC 1,024 5,601 37.97 8.4% 22.4% 6.8% Residential Asset GMAC 1,086 6,477 32.76 7.6% 18.0% 3.9% SASCO Lehman Brothers 2,721 16,632 32.96 7.2% 18.6% 6.0% Saxon Morgan Stanley 392 2,022 36.85 7.4% 21.9% 2.8% Securitized ABR. Barclays 916 5,476 38.58 6.4% 23.1% 4.6% SoundView RBS 1,031 5,809 34.89 8.3% 23.1% 3.7% Terwin 468 2,358 49.00 5.1% 11.2% 3.5% UBS 180 1,544 0.1% 0.2% 0.0% Wachovia 339 3,077 27.55 1.5% 3.9% 3.0% Wells Fargo 552 4,203 39.67 4.2% 5.4% 1.0% 110
  • 111.
    Panel E.2: RMBSOriginator Summary Statistics 2 Originator Parent FICO Com. Sub Mid AltA Orig Avg. LTV prime prime ARM Rating Change Aames Mortgage 611 82 0.0% 0.0% 0.0% 7.2 2.9 ABFC Bank of America 648 86 10.4% 16.0% 0.0% 5.1 3.5 Accredited Mortgage 631 85 92.9% 0.0% 0.0% 6.4 2.9 ACE 37.0% 7.6% 22.7% 6.1 3.8 Aegis 618 83 100% 0.0% 0.0% 6.9 2.8 Ameriquest 640 90 0.0% 100% 0.0% 6.0 0.9 Argent Citigroup 617 86 100% 0.0% 0.0% 5.6 3.3 BayView 100% 0.0% 0.0% 6.5 1.4 Bear Stearns 618 85 36.3% 63.7% 0.0% 7.0 3.9 Carrington 613 87 5.7% 83.6% 10.4% 7.6 2.0 C-Bass 634 80 0.0% 95.3% 0.0% 6.6 2.9 Citigroup 24.8% 54.6% 0.0% 5.8 2.9 Countrywide Bank of America 606 83 100% 0.0% 0.0% 6.2 3.3 Delta 618 76 100% 0.0% 0.0% 5.7 1.1 Deutsche Bank 100% 0.0% 0.0% 6.8 2.9 DLJ Mortgage Credit Suisse 2.5% 84.8% 0.8% 6.5 1.7 Encore Bear Stearns 0.0% 0.0% 0.0% 7.2 1.7 EquiFirst Barclays 35.2% 0.0% 0.0% 3.5 0.3 Fieldstone 89.7% 10.3% 0.0% 7.7 3.8 First Franklin Merrill Lynch 651 92 45.6% 2.3% 0.0% 4.6 4.9 Fremont 624 88 0.0% 100% 0.0% 4.5 3.7 Goldman Sachs 627 88 90.9% 9.1% 0.0% 7.5 4.0 GSAA Goldman Sachs 53.3% 16.6% 4.8% 6.3 2.0 HarborView RBS 100% 0.0% 0.0% 6.9 1.7 HEAT Credit Suisse 627 87 17.5% 27.9% 0.0% 4.7 3.6 HSBC 100% 0.0% 0.0% 7.2 3.3 IndyMac 617 83 0.0% 0.0% 0.0% 1.7 2.7 Ixis Morgan Stanley 626 81 31.3% 8.8% 3.2% 5.3 3.5 JPMorganChase JP Morgan 631 82 82.8% 17.2% 0.0% 7.3 2.4 Long Beach Washington Mutual 636 90 9.9% 90.1% 0.0% 7.7 2.2 MASTR UBS 624 86 34.8% 8.0% 23.6% 4.6 4.5 Merrill Lynch 641 88 20.7% 78.8% 0.0% 6.2 4.7 Morgan Stanley 624 82 23.0% 77.0% 0.0% 7.8 2.2 New Century 625 84 0.0% 100% 0.0% 7.7 2.0 Nomura 630 87 0.9% 27.9% 20.2% 4.5 4.0 NovaStar 615 85 71.5% 13.0% 0.0% 7.2 2.1 Option One 609 82 34.3% 18.8% 2.0% 6.5 3.7 Other 21.9% 78.1% 0.0% 7.1 3.2 OWNIT 665 84 56.5% 2.8% 2.3% 5.5 7.0 Park Place 0.0% 100% 0.0% 7.2 0.8 Popular 621 85 0.0% 0.0% 54.4% 3.6 1.7 RALI GMAC 39.1% 11.8% 23.7% 6.4 2.5 RAMP GMAC 11.4% 17.3% 0.0% 5.1 2.9 RASC GMAC 618 86 0.0% 1.2% 58.7% 4.4 2.5 Residential Asset GMAC 70.0% 30.0% 0.0% 7.9 3.4 SASCO Lehman Brothers 626 86 93.9% 6.1% 0.0% 6.9 3.1 Saxon Morgan Stanley 612 82 100% 0.0% 0.0% 6.4 1.8 Securitized ABR. Barclays 0.0% 100% 0.0% 7.3 2.2 SoundView RBS 635 89 100% 0.0% 0.0% 5.6 3.3 Terwin 648 82 100.0% 0.0% 0.0% 6.5 6.9 UBS 6.3% 3.2% 28.7% 4.2 2.7 Wachovia 50.4% 42.2% 0.0% 6.9 4.5 Wells Fargo 625 82 5.4% 8.3% 0.0% 3.8 5.6 111
  • 112.
    Appendix B: CreditRating Scale Moodys S&P Fitch Score Aaa AAA AAA 1 Aa1 AA+ AA+ 2 Aa2 AA AA 3 Aa3 AA- AA- 4 A1 A+ A+ 5 A2 A A 6 A3 A- A- 7 Baa 1 BBB+ BBB+ 8 Baa 2 BB B BB B 9 Baa 3 BB B - BB B - 10 Ba1 BB + BB + 11 Ba2 BB BB 12 Ba3 BB - BB - 13 B1 B+ B+ 14 B2 B B 15 B3 B- B- 16 Caa 1 CCC+ CCC+ 17 Caa 2 CC C CC C 18 Caa 3 CC C - CC C - 19 Ca CC CC 20 C C C 21 D D D 22 NR NR NR 0 112
  • 113.
    Appendix C: S&PDefault Matrix Source: S&P CDO Evaluator 3.0, Year AAA AA+ AA AA- A+ A A- BBB+ BBB BBB- BB+ BB BB- B+ B B- CCC+ CCC CCC- 1 0.0004 0.002 0.013 0.024 0.027 0.033 0.049 0.234 0.353 0.967 1.632 2.525 3.803 4.51 5.824 8.138 23.582 45.56 66.413 2 0.009 0.017 0.062 0.078 0.097 0.121 0.185 0.514 0.825 2.142 3.211 4.946 7.26 8.885 11.751 16.674 38.104 59.145 79.233 3 0.03 0.05 0.135 0.166 0.212 0.263 0.396 0.85 1.405 3.415 4.758 7.23 10.401 12.96 17.152 24.004 46.752 64.835 82.905 4 0.065 0.104 0.232 0.29 0.372 0.459 0.676 1.246 2.073 4.728 6.276 9.38 13.265 16.694 21.921 30.025 52.288 68.078 84.581 5 0.118 0.182 0.356 0.452 0.578 0.709 1.02 1.704 2.812 6.046 7.763 11.403 15.886 20.087 26.089 34.945 56.158 70.313 85.65 6 0.19 0.287 0.512 0.654 0.83 1.013 1.424 2.221 3.607 7.352 9.216 13.31 18.291 23.156 29.725 38.996 59.071 72.019 86.454 7 0.285 0.42 0.701 0.897 1.128 1.368 1.883 2.792 4.443 8.635 10.632 15.11 20.503 25.929 32.903 42.374 61.383 73.396 87.105 8 0.405 0.584 0.927 1.182 1.472 1.774 2.395 3.413 5.31 9.891 12.007 16.81 22.544 28.435 35.692 45.227 63.284 74.546 87.653 9 0.552 0.781 1.191 1.509 1.859 2.226 2.954 4.076 6.198 11.116 13.34 18.418 24.432 30.702 38.151 47.666 64.886 75.529 88.124 10 0.728 1.013 1.493 1.876 2.29 2.724 3.557 4.777 7.103 12.309 14.631 19.941 26.182 32.76 40.331 49.776 66.261 76.383 88.535 11 0.934 1.28 1.833 2.285 2.762 3.263 4.198 5.51 8.017 13.471 15.881 21.386 27.809 34.633 42.275 51.62 67.459 77.133 88.899 12 1.173 1.583 2.213 2.733 3.273 3.841 4.873 6.269 8.937 14.602 17.091 22.758 29.326 36.343 44.018 53.245 68.512 77.799 89.223 13 1.445 1.923 2.631 3.219 3.822 4.454 5.578 7.05 9.86 15.704 18.261 24.064 30.744 37.91 45.589 54.691 69.448 78.396 89.515 14 1.75 2.3 3.086 3.742 4.404 5.099 6.309 7.85 10.783 16.776 19.394 25.307 32.073 39.353 47.014 55.985 70.287 78.935 89.779 15 2.089 2.712 3.577 4.299 5.018 5.773 7.063 8.664 11.704 17.822 20.491 26.494 33.323 40.685 48.313 57.154 71.045 79.426 90.02 113 16 2.463 3.16 4.102 4.887 5.662 6.473 7.836 9.49 12.621 18.841 21.555 27.629 34.501 41.92 49.504 58.214 71.733 79.875 90.241 17 2.87 3.643 4.659 5.506 6.332 7.195 8.624 10.325 13.534 19.836 22.587 28.716 35.614 43.07 50.6 59.183 72.363 80.288 90.445 18 3.311 4.158 5.247 6.152 7.026 7.937 9.426 11.167 14.441 20.808 23.589 29.759 36.67 44.145 51.614 60.073 72.943 80.671 90.634 19 3.784 4.704 5.863 6.823 7.741 8.696 10.238 12.013 15.342 21.757 24.563 30.761 37.674 45.153 52.557 60.895 73.479 81.028 90.81 20 4.289 5.281 6.506 7.516 8.475 9.47 11.059 12.862 16.235 22.686 25.51 31.727 38.63 46.102 53.438 61.658 73.978 81.362 90.974 21 4.823 5.885 7.172 8.229 9.225 10.256 11.886 13.713 17.121 23.596 26.434 32.658 39.545 46.998 54.263 62.37 74.445 81.675 91.129 22 5.386 6.514 7.86 8.961 9.989 11.053 12.718 14.563 17.999 24.487 27.334 33.558 40.42 47.848 55.04 63.036 74.883 81.971 91.275 23 5.975 7.168 8.567 9.707 10.765 11.857 13.552 15.413 18.869 25.361 28.213 34.429 41.261 48.655 55.774 63.663 75.296 82.252 91.413 24 6.59 7.843 9.292 10.468 11.552 12.668 14.389 16.261 19.731 26.218 29.071 35.273 42.07 49.426 56.47 64.256 75.686 82.518 91.544 25 7.229 8.538 10.032 11.24 12.346 13.484 15.226 17.105 20.584 27.06 29.911 36.093 42.851 50.162 57.132 64.817 76.057 82.773 91.67 26 7.889 9.25 10.786 12.022 13.147 14.303 16.062 17.947 21.428 27.887 30.733 36.89 43.605 50.868 57.764 65.351 76.411 83.017 91.789 27 8.568 9.979 11.55 12.811 13.954 15.125 16.897 18.784 22.264 28.7 31.538 37.667 44.335 51.546 58.369 65.86 76.75 83.251 91.904 28 9.266 10.721 12.325 13.608 14.764 15.947 17.729 19.616 23.092 29.499 32.327 38.423 45.043 52.2 58.95 66.348 77.074 83.476 92.015 29 9.98 11.475 13.108 14.409 15.576 16.77 18.559 20.443 23.911 30.286 33.102 39.162 45.731 52.832 59.508 66.816 77.386 83.693 92.121 30 10.708 12.24 13.897 15.213 16.39 17.591 19.385 21.265 24.721 31.061 33.863 39.884 46.4 53.443 60.047 67.266 77.687 83.903 92.224
  • 114.
    Appendix D: PolicyRecommendations Letters to Ben Bernanke The following letter was written by Michael Blum, President of Michael Blum Consulting, a company that provides risk analysis and valuation services for complex structured products. This letter gives one proposal for cleaning up the toxic assets left by the CDO collapse. Letter to Federal Reserve Chairman, Ben Bernanke Jan. 19, 2008 Dear Governor of the Federal Reserve, My name is Michael Blum. I am writing you as a private citizen, as a loyal American as well as a Goldman Sachs alumnus with over 20 years experience in the structured finance markets. I am concerned by the current credit crisis, and have a suggestion which I believe would help navigate out of it. CDOs are like love. When they're good, they're great, but when they're bad, watch out. They resemble options on options, which regulators would hardly permit in the public equity markets. They should not have been issued with dubious collateral, but the crux of the credit crisis is that they have been, and no one knows how bad mortgage defaults are going to get. When you buy something at a store, and discover after opening it up at home that there is something wrong with the product, you take it back to the store and return it. The store will take it back, although they may give you back something less than the price you paid. My proposal is along these lines. Since the trustee's responsibility is to make bond payments, a CDO's bondholders can be identified by its trustee, If the dollar majority of the CDO's bondholders approve, I would make repurchase by the underwriter of all bonds in the CDO mandatory, so that the underwriter can then collapse the deal and sell the underlying collateral. There is a simple and intuitive method to calculate the repurchase price at which the underwriter makes no money on the transaction; the Fed may choose to allow the underwriter a profit as an incentive to cleaning up the market, or subtract a penalty for the underwriter's prior faulty bond origination. The fundamental theory of mortgage securitization is that bonds can be sold at a premium to the cost of their underlying collateral. The problem arose when greedy originators and underwriters increased their revenues by introducing dubious collateral. This means that, even if dubious, the underlying collateral is now worth more than the bonds are, because CDO technology guaranteed that bond losses would be magnified. To some extent, this collapse is already happening, as some CDOs have had an "event of default" triggered by their collateral's dismal performance. However, as this was hardly foreseen by the underwriters who prepared the offering documents, the mechanics of who gets which proceeds are murky and often, litigation is the result. There is no longer a functioning CDO market. CDO bond prices, if marked at all, have been marked to distressed levels, or zero, by virtue of being in a CDO. Since owning all of the bonds in a CDO is akin to ownership of the collateral pool, my suggestion is to make it mandatory for underwriters to buy back all bonds in a CDO when a dollar majority of bondholders approve, so they can sell the collateral RMBS, CMBS, ABS, etc. for which there are still functioning markets. In fact, the underwriters can put the collateral up for bid for forward settlement, which allows time to set up a transaction where the bonds are bought, the collateral sold and the CDO is collapsed instantaneously. Once the aggregate proceeds at which the collapsed-CDO collateral can be sold 114
  • 115.
    are known, proceedscan be allocated either according to the offering memorandum or else, based on each CDO bond's percentage of the total collateral balance. This may mean ratings are meaningless, but as a forward-looking measure of likely repayment of principal, we now know that anyway. Removing leverage from the system by mandating the collapse of toxic CDOs would be a vital step in restoring normal capital flow to the securitized debt markets. Thank you for your time and attention. Sincerely, Michael Blum 115