Download as PDF, PPTX


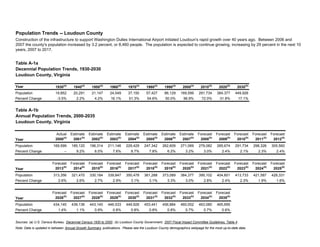
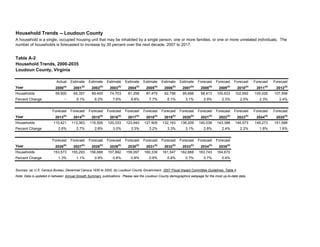
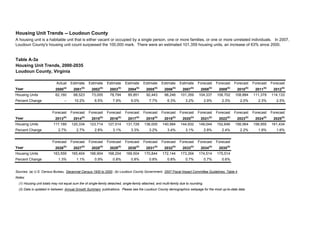
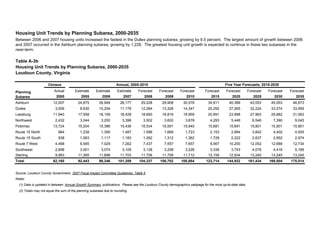
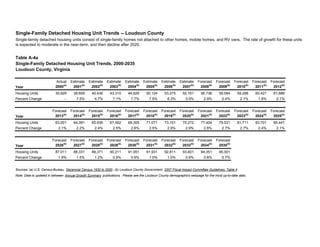
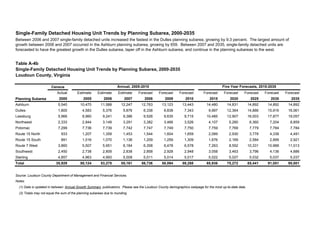
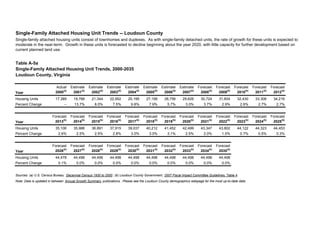
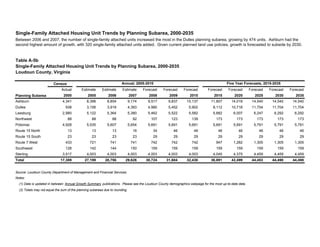
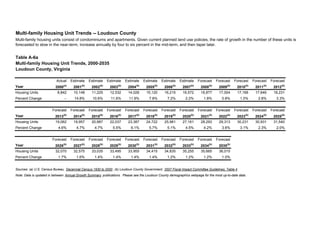
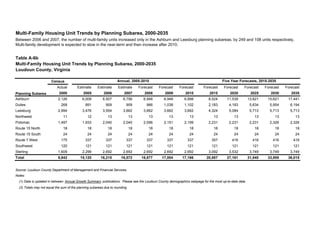
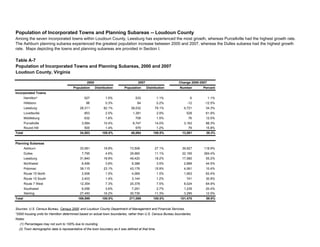
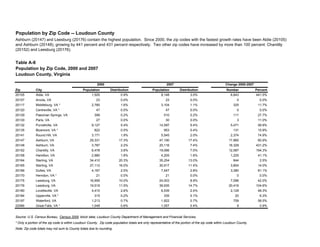
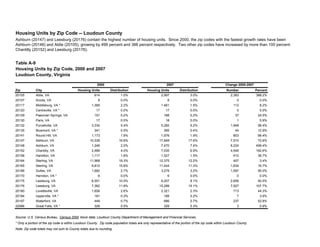
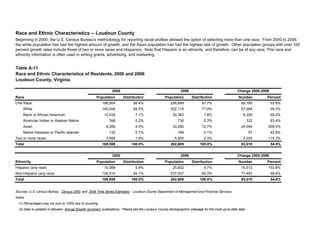
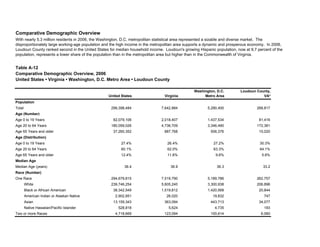
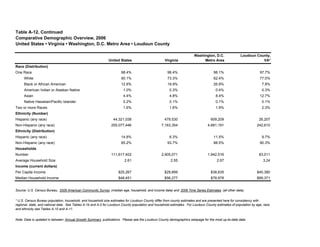
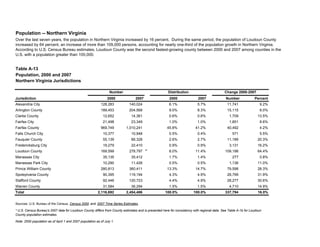
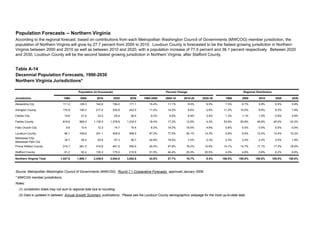
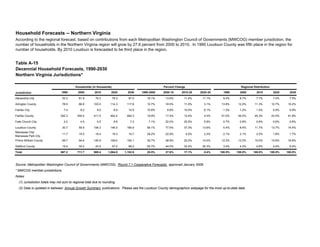
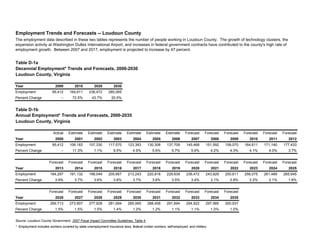
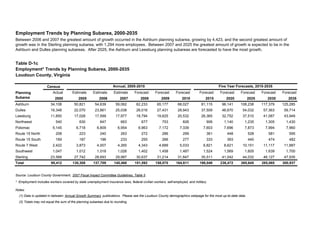
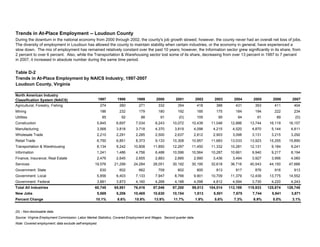
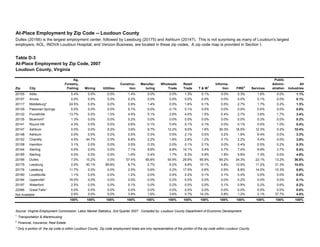
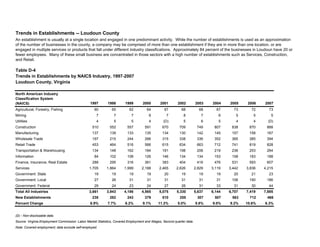
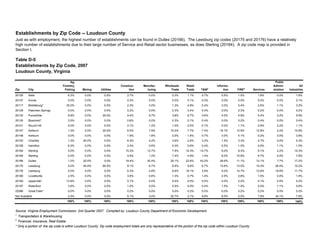
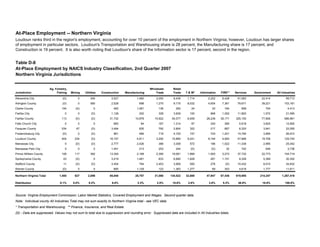
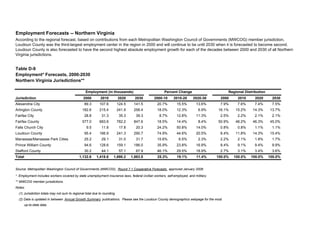
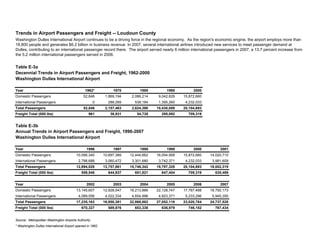
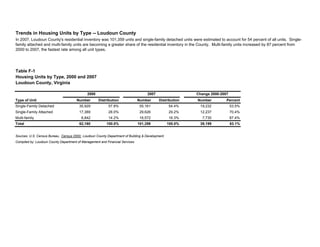
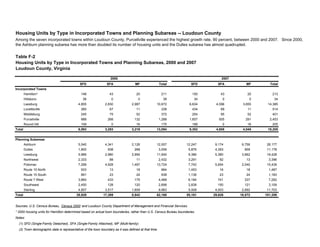
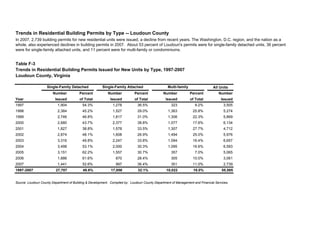
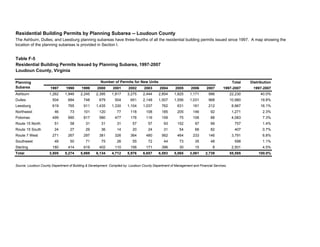
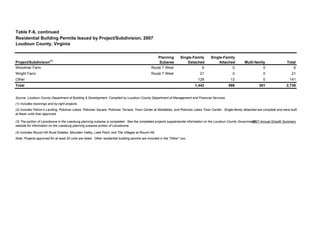
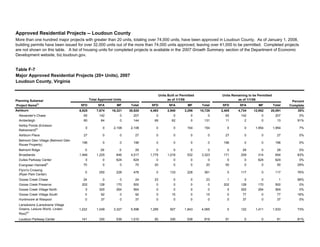
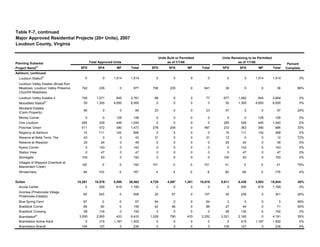
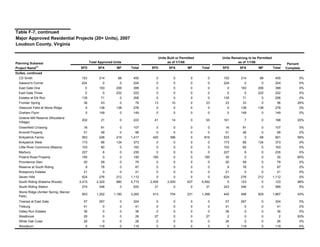
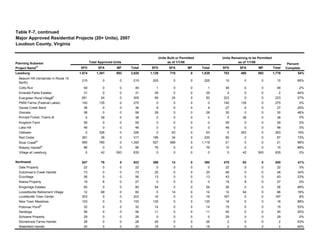
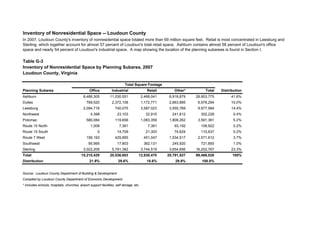

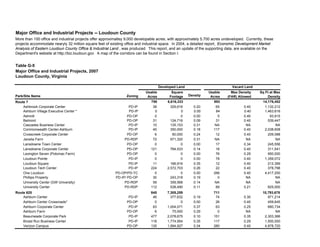
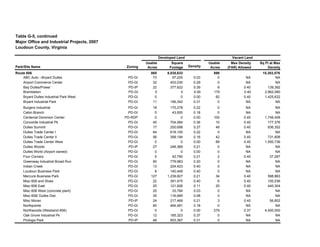
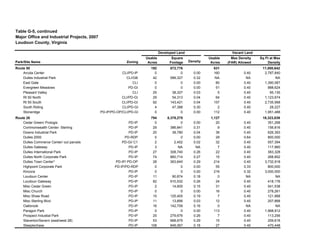
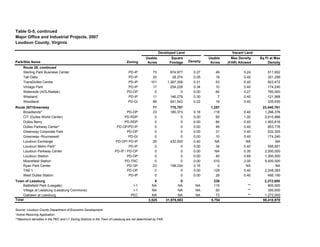
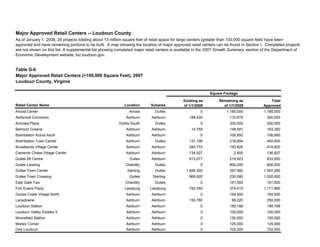
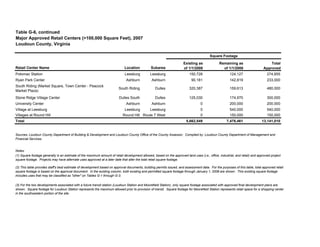
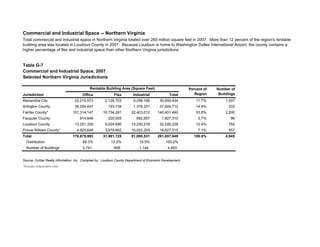
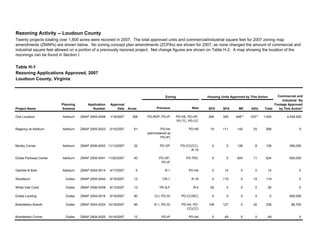
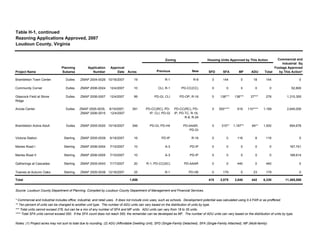
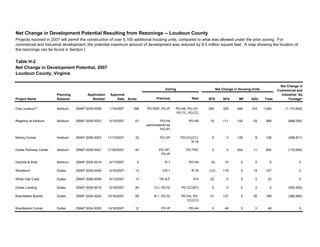


This document provides an annual report on demographic and economic trends in Loudoun County, Virginia. Some key highlights include: - Loudoun County's population grew 3.2% between 2006 and 2007 to over 271,000 people, and is projected to continue rapid growth, increasing 29% over the next decade. - The number of households in Loudoun County is projected to increase 30% between 2007 and 2017, reaching over 123,000 households. - The number of housing units surpassed 101,000 in 2007, up 63% from 2000, and is projected to reach over 169,000 units by 2030.


