2 June Daily market report
•
0 likes•298 views

The QSE Index in Qatar gained 0.1% to close at 12,184.8, led by gains in the Industrials and Consumer Goods & Services indices. Aamal Co. and Gulf Warehousing Co. were the top gainers, rising 6.1% and 2.7% respectively, while Islamic Holding Group fell 2.0%. Trading volume fell 21.3% compared to the previous day. Regional indices were mixed, with Saudi Arabia and Oman up 0.2% and 0.7% respectively, while Dubai gained 1.2%.

Recommended
More Related Content
What's hot
What's hot (20)
Viewers also liked
Viewers also liked (11)
Similar to 2 June Daily market report
Similar to 2 June Daily market report (20)
More from QNB Group
More from QNB Group (20)
Recently uploaded
Recently uploaded (20)
2 June Daily market report
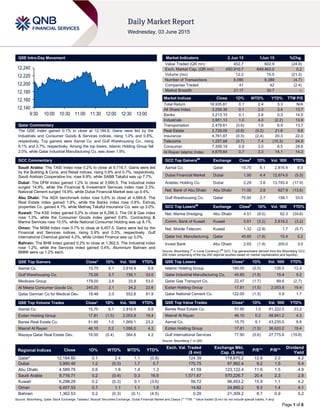
- 1. Page 1 of 6 QSE Intra-Day Movement Qatar Commentary The QSE Index gained 0.1% to close at 12,184.8. Gains were led by the Industrials and Consumer Goods & Services indices, rising 1.0% and 0.8%, respectively. Top gainers were Aamal Co. and Gulf Warehousing Co., rising 6.1% and 2.7%, respectively. Among the top losers, Islamic Holding Group fell 2.0%, while Qatar Industrial Manufacturing Co. was down 1.9%. GCC Commentary Saudi Arabia: The TASI Index rose 0.2% to close at 9,716.7. Gains were led by the Building & Cons. and Retail indices, rising 0.9% and 0.7%, respectively. Saudi Arabian Cooperative Ins. rose 9.9%, while SABB Takaful was up 7.7%. Dubai: The DFM Index gained 1.2% to close at 3,990.5. The Industrial index surged 14.9%, while the Financial & Investment Services index rose 2.3%. National Cement surged 14.9%, while Dubai Financial Market was up 4.4%. Abu Dhabi: The ADX benchmark index rose 0.6% to close at 4,589.8. The Real Estate index gained 1.8%, while the Banks index rose 0.8%. Eshraq properties Co. gained 4.1%, while Methaq Takaful Insurance Co. was up 3.0%. Kuwait: The KSE Index gained 0.2% to close at 6,298.3. The Oil & Gas index rose 1.3%, while the Consumer Goods index gained 0.6%. Contracting & Marine Services rose 10.0%, while National Consumer Holding was up 8.1%. Oman: The MSM Index rose 0.7% to close at 6,457.5. Gains were led by the Financial and Services indices, rising 0.9% and 0.3%, respectively. Gulf International Chemical gained 4.2%, while United Finance was up 3.0%. Bahrain: The BHB Index gained 0.2% to close at 1,362.5. The Industrial index rose 1.2%, while the Services index gained 0.4%. Aluminium Bahrain and BMMI were up 1.2% each. QSE Top Gainers Close* 1D% Vol. ‘000 YTD% Aamal Co. 15.75 6.1 2,816.4 8.8 Gulf Warehousing Co. 75.00 2.7 156.1 33.0 Medicare Group 179.00 2.6 33.9 53.0 Al Meera Consumer Goods Co. 245.20 2.1 34.2 22.6 Qatar German Co for Medical Dev. 18.46 2.0 552.8 81.9 QSE Top Volume Trades Close* 1D% Vol. ‘000 YTD% Aamal Co. 15.75 6.1 2,816.4 8.8 Ezdan Holding Group 17.81 (1.5) 2,053.8 19.4 Barwa Real Estate Co. 51.60 1.0 1,569.1 23.2 Masraf Al Rayan 46.10 0.2 1,056.0 4.3 Mazaya Qatar Real Estate Dev. 19.00 (0.4) 564.8 4.2 Market Indicators 2 Jun 15 1Jun 15 %Chg. Value Traded (QR mn) 452.7 602.9 (24.9) Exch. Market Cap. (QR mn) 650,910.7 649,462.0 0.2 Volume (mn) 12.2 15.5 (21.3) Number of Transactions 6,090 6,389 (4.7) Companies Traded 41 42 (2.4) Market Breadth 21:17 30:7 – Market Indices Close 1D% WTD% YTD% TTM P/E Total Return 18,935.81 0.1 2.4 3.3 N/A All Share Index 3,258.39 0.1 2.3 3.4 13.7 Banks 3,213.10 0.1 2.6 0.3 14.5 Industrials 3,951.13 1.0 4.0 (2.2) 13.9 Transportation 2,479.61 (0.6) 1.6 6.9 13.7 Real Estate 2,729.05 (0.6) (0.2) 21.6 9.6 Insurance 4,761.87 (0.3) (2.4) 20.3 22.0 Telecoms 1,257.68 (0.7) 7.4 (15.3) 24.9 Consumer 7,359.19 0.8 3.0 6.5 28.6 Al Rayan Islamic Index 4,679.64 0.7 3.3 14.1 14.2 GCC Top Gainers## Exchange Close# 1D% Vol. ‘000 YTD% Aamal Co. Qatar 15.75 6.1 2,816.4 8.9 Dubai Financial Market Dubai 1.90 4.4 12,674.6 (5.5) Arabtec Holding Co. Dubai 2.29 3.6 13,793.4 (17.9) Nat. Bank of Abu Dhabi Abu Dhabi 11.00 2.8 627.9 (13.6) Gulf Warehousing Co. Qatar 75.00 2.7 156.1 33.0 GCC Top Losers## Exchange Close# 1D% Vol. ‘000 YTD% Nat. Marine Dredging Abu Dhabi 4.51 (8.0) 62.3 (34.6) Comm. Bank of Kuwait Kuwait 0.61 (3.2) 2,618.2 (3.2) Nat. Mobile Telecom. Kuwait 1.32 (2.9) 1.7 (5.7) Qatar Ind. Manufacturing Qatar 45.60 (1.9) 15.4 5.2 Invest Bank Abu Dhabi 2.65 (1.9) 200.0 3.0 Source: Bloomberg ( # in Local Currency) ( ## GCC Top gainers/losers derived from the Bloomberg GCC 200 Index comprising of the top 200 regional equities based on market capitalization and liquidity) QSE Top Losers Close* 1D% Vol. ‘000 YTD% Islamic Holding Group 140.00 (2.0) 126.5 12.4 Qatar Industrial Manufacturing Co. 45.60 (1.9) 15.4 5.2 Qatar Gas Transport Co. 22.47 (1.7) 89.6 (2.7) Ezdan Holding Group 17.81 (1.5) 2,053.8 19.4 Qatar National Cement Co. 122.00 (1.5) 0.9 1.7 QSE Top Value Trades Close* 1D% Val. ‘000 YTD% Barwa Real Estate Co. 51.60 1.0 81,222.5 23.2 Masraf Al Rayan 46.10 0.2 48,941.2 4.3 Aamal Co. 15.75 6.1 43,235.0 8.8 Ezdan Holding Group 17.81 (1.5) 36,620.2 19.4 Gulf International Services 77.90 (0.6) 27,775.8 (19.8) Source: Bloomberg (* in QR) Regional Indices Close 1D% WTD% MTD% YTD% Exch. Val. Traded ($ mn) Exchange Mkt. Cap. ($ mn) P/E** P/B** Dividend Yield Qatar* 12,184.80 0.1 2.4 1.1 (0.8) 124.39 178,870.2 12.8 2.0 4.2 Dubai 3,990.46 1.2 (0.3) 1.7 5.7 170.75 97,982.4 9.2 1.5 5.4 Abu Dhabi 4,589.78 0.6 1.6 1.4 1.3 41.59 123,122.4 11.6 1.5 4.9 Saudi Arabia 9,716.71 0.2 (0.4) 0.3 16.6 1,571.67 570,226.7 20.4 2.3 2.8 Kuwait 6,298.29 0.2 (0.3) 0.1 (3.6) 56.72 96,453.2 15.9 1.1 4.2 Oman 6,457.53 0.7 1.1 1.1 1.8 14.82 24,660.2 9.3 1.4 4.1 Bahrain 1,362.53 0.2 (0.3) (0.1) (4.5) 0.20 21,309.2 8.7 0.9 5.2 Source: Bloomberg, Qatar Stock Exchange, Tadawul, Muscat Securities Exchange, Dubai Financial Market and Zawya (** TTM; * Value traded ($ mn) do not include special trades, if any) 12,140 12,160 12,180 12,200 12,220 12,240 9:30 10:00 10:30 11:00 11:30 12:00 12:30 13:00
- 2. Page 2 of 6 Qatar Market Commentary The QSE Index gained 0.1% to close at 12,184.8. The Industrials and Consumer Goods & Services indices led the gains. The index rose on the back of buying support from non-Qatari and GCC shareholders despite selling pressure from Qatari shareholders. Aamal Co. and Gulf Warehousing Co. were the top gainers, rising 6.1% and 2.7%, respectively. Among the top losers, Islamic Holding Group fell 2.0%, while Qatar Industrial Manufacturing Co. was down 1.9%. Volume of shares traded on Tuesday fell by 21.3% to 12.2mn from 15.5mn on Monday. Further, as compared to the 30-day moving average of 16.4mn, volume for the day was 25.6% lower. Aamal Co. and Ezdan Holding Group were the most active stocks, contributing 23.0% and 16.8% to the total volume, respectively. Source: Qatar Stock Exchange (* as a % of traded value) Global Economic Data Global Economic Data Date Market Source Indicator Period Actual Consensus Previous 06/02 US Bloomberg IBD/TIPP Economic Optimism June 48.1 49.8 49.7 06/02 US Census Bureau Factory Orders April -0.40% -0.10% 2.20% 06/02 EU Eurostat PPI MoM April -0.10% 0.10% 0.20% 06/02 EU Eurostat PPI YoY April -2.20% -2.00% -2.30% 06/02 EU Eurostat CPI Estimate YoY May 0.30% 0.20% 0.00% 06/02 EU Eurostat CPI Core YoY May 0.90% 0.70% 0.60% 06/02 Germany Deutsche Bundesbank Unemployment Rate May 6.40% 6.40% 6.40% 06/02 UK Bank of England Net Consumer Credit April 1.2B 1.0B 1.3B 06/02 UK Bank of England Money Supply M4 MoM April 0.40% – 0.30% 06/02 UK Bank of England M4 Money Supply YoY April 0.00% – -0.60% 06/02 UK Bank of England M4 Ex IOFCs 3M Annualised April 4.00% 4.00% 3.30% 06/02 UK Markit Markit/CIPS UK Construction PMI May 55.9 55.0 54.2 06/02 Spain Spanish Labour Ministry Unemployment MoM Net ('000s) May -118.0 -115.8 -118.9 Source: Bloomberg (s.a. = seasonally adjusted; n.s.a. = non-seasonally adjusted; w.d.a. = working day adjusted) News Qatar QCB auctions T-bills worth QR4bn on June 2 – The Qatar Central Bank (QCB) has auctioned treasury bills worth QR4bn on June 2, for which it received bids totaling QR8.51bn. T-bills worth QR2bn with a three-month maturity period were auctioned at a yield of 0.92%. T-bills worth QR1bn with a six-month maturity period were sold at a yield of 0.94%, while T-bills worth QR1bn with a nine-month maturity period were auctioned at a yield of 1.04%. (QCB) GDI takes steps to employ idle drilling rigs – Gulf Drilling International (GDI), a wholly-owned subsidiary of Gulf International Services (GISS), has leased out one of the two jack-up drilling rigs whose contracts had gone idle and is also considering leasing out the second one. GDI said that two of its rigs were idle but one had already been booked for short-term work in 2015 and a long-term contract starting in 1Q2016. The second rig is also being considered for work that is scheduled to commence in early 2016. The company also said its customers had negotiated cuts of between 10-15% in daily operating rates of drilling rigs. (QSE, Zawya) SGSS signs cooperation agreement with QNB Al Ahli – Societe Generale Securities Services (SGSS) has signed a cooperation agreement with Qatar National Bank Al Ahli (QNB Al Ahli), a subsidiary of QNB Group (QNBK), to provide securities services to international institutional investors and corporate enterprises in Egypt. The agreement is part of SGSS’ strategy to develop its overall securities services offer to the increasing number of international investors and corporate enterprises present in the country. QNB Al Ahli will combine its local expertise and knowledge of the Egyptian market with SGSS’ commercial support, operational management and extensive international coverage. Meanwhile, QNBK received several awards from two banking magazines, The Asian Banker and Banker Middle East, in recognition of its “exceptional banking performance and continued progress in 2014”. (SocGen Press Release, Gulf-Times.com) BCG: Qatar outperforms GCC, rest of world in SEDA scores – According to a latest report released by The Boston Consulting Group (BCG), Qatar has outperformed the GCC and the rest of the world in most dimensions – including income, employment, health, infrastructure, income equality, civil society, and governance – when it comes to its current-level of Sustainable Economic Development Assessment (SEDA) scores. Qatar has topped the average scores of both the GCC and the rest of the world across all the above dimensions. However, the dimensions in which Qatar lags behind are environment and economic stability. In terms of education, Qatar Overall Activity Buy %* Sell %* Net (QR) Qatari 60.49% 68.35% (35,605,399.94) GCC 11.05% 7.19% 17,490,271.84 Non-Qatari 28.46% 24.46% 18,115,128.10
- 3. Page 3 of 6 underperforms relative to the GCC yet exceeds the median score of the rest of the world. The fact-based, comprehensive analysis measured the relative well-being of 149 countries and their performance in converting wealth into well-being along social and economic indicators. (Peninsula Qatar) Qatar to soon award tender to build five new hospitals – The Minister of Public Health, HE Abdullah bin Khalid Al Qahtani said it will soon issue a tender to build five new hospitals in the country. The hospitals will be built and operated by the private sector. He added that the management of some healthcare facilities will also be outsourced to the private sector. Moreover, three hospitals will be opened by early 2016 exclusively for expatriate single workers in Qatar. The three hospitals will be located in the Industrial Area, Mesaieed Industrial City and Ras Laffan. (Peninsula Qatar) Barwa Bank AGM approves 10% cash dividend – Barwa Bank’s annual general meeting (AGM) has approved distribution of 10% cash dividend for the fiscal year ended December 31, 2014. Shareholders at the AGM also signed off the development and registration of an EMTN (Euro Medium Term Note) program to facilitate the issuance of non-convertible senior unsecured Sukuk, with a cap standing at $2bn or its equivalent in other currencies. The planned issue will be carried out through the establishment of a special purpose vehicle in full compliance with the instructions of the Qatari Central Bank and in accordance with the provisions and amendments of the 2002 commercial companies law number 5. (Zawya) Qatar's real estate trades exceed QR757.5mn last week – According to statistics released by the Land Registry Department of the Ministry of Justice, the combined trading value of real estate transactions (sales contracts) registered during last week reached QR757.5mn. The real estate sales included lands, shopping centers, houses residential complexes and towers. The sales were distributed in the municipalities of Doha, Umm Salal, Al Khor, Al Dhakira, Al Rayyan, Al Zain, Al Wakra and Al Shamal. (Bloomberg) International US factory orders decline; robust auto sales a bright spot – According to data published by the US Commerce Department, new orders for factory goods fell in April on weak demand for transportation equipment and other goods, suggesting that manufacturing remained constrained due to a strong dollar and spending cuts in the energy sector. New orders for manufactured goods slipped 0.4% after increasing 2.2% in March. Factory orders have declined in eight of the last nine months. Orders for non-defense capital goods excluding aircraft, which are seen as a measure of business confidence and spending plans, fell 0.3% in April instead of the 1.0% advance reported in March. On the other hand, auto sales rose to a seasonally adjusted annual rate of 17.79mn units in May, the strongest since summer 2005, up from a 16.50mn-unit pace in April. Strong auto sales could buoy May consumer spending, which was flat in April after households cut back on purchases of motor vehicles. A rebound in consumer spending is being eyed after slowing down sharply in 1Q2015. (Reuters) Eurozone returns to inflation in May – The eurozone returned to inflation in May with a higher than expected increase in consumer prices after five months of falls and stagnation, due to rising food costs and the waning impact of cheap energy. The European Union's statistics office, Eurostat said that consumer prices in the 19 countries sharing the euro rose 0.3% YoY after a flat reading in April, beating market expectations of a 0.2% increase. Excluding the volatile energy prices, which were 5% lower in May than 12 months earlier, consumer prices rose 1.0%. Core inflation, excluding energy and unprocessed food, rose 0.9%, a nine-month high, accelerating from a revised 0.7% in April. However, prices at factory gates in April added some uncertainty to the inflation outlook, falling 0.1% MoM and 2.2% YoY. (Reuters) China services sector activity accelerates in May – Activity in China's services sector accelerated in May as new business rose at the fastest pace in three years, a rare piece of good news for policymakers struggling to reviving a cooling economy. The headline HSBC/Markit Purchasing Managers' Index (PMI) for May reached 53.5, up from 52.9 in April and well above the 50-point level that separates expansion from contraction. The latest data represented the fourth straight month of acceleration. The new business sub-component stood at 54.4, up from 52.8 in April and recording the highest reading since 54.7 in May 2012. Employment at services firms grew at the fastest rate since January 2013, another encouraging sign for policymakers as layoffs continue in the manufacturing sector. However, economists still remain cautious on China's overall economic outlook, as credit growth remains weak and manufacturing stagnates, reinforcing views that authorities will have to roll out more stimulus to avert a sharper slowdown. (Reuters) Australia grows above forecast in 1Q2015 on higher exports – Australia grew faster than forecast in 1Q2015 as newly built mines boosted exports, validating the central bank’s decision to keep interest rates steady. The GDP advanced 0.9% QoQ above the median forecast for a 0.7% gain. The economy was spurred by a 5% jump in exports in 1Q2015 even as commodity prices fell. The economy expanded 2.3% YoY in 1Q2015, faster than the median forecast for a 2.1% rise but below the economy’s 30-year average rate of 3.3%. Exports added 1.1 percentage points to GDP growth. Household spending advanced 0.5%, adding 0.3% to the expansion while non- dwelling construction fell 4.9%, subtracting 0.4 percentage point from the rate of growth. (Bloomberg) India’s central bank cuts rate for third time in 2015 – India's central bank cut interest rates for a third time in 2015 on Tuesday, taking advantage of subdued inflation to lend more support to an economy that the bank itself says is not doing as well as latest impressive growth numbers suggest. The Reserve Bank of India (RBI) also left open the possibility of further cuts later this year, even with forecasts of a below-average monsoon that could put pressure on food prices. The RBI reduced the repo rate by a quarter points to 7.25%. Previous cuts in January and March had also been by 25 basis points. The reduction showed policymakers recognized the need to put the economy on a sounder footing, regardless of data released on May 29 that showed India outpaced China by growing 7.5% in the March quarter. (Reuters) Regional SASCO completes selling fractions shares – Saudi Automotive Services Company (SASCO) has completed the selling of 1,231 fractions shares arising out of the company's capital increase. The company had sold the shares on May 25, 2015 for a value of SR33,113.90, at an average price of SR26.90 per share. Meanwhile, the Saudi Fransi Bank will deposit the fractional shares’ amount into the company shareholders’ accounts on June 10, 2015. (Tadawul) AIG Insurance announces latest developments regarding capital increase – Metlife AIG ANB Cooperative Insurance Company (AIG Insurance) has announced latest developments regarding the board of directors’ recommendations to increase the company’s capital by SR175mn through rights issuance. The company said that it had received a letter from the Saudi
- 4. Page 4 of 6 Arabian Monetary Agency (SAMA) on May 7, 2015, and it is working to meet the capital increase requirements. (Tadawul) SEDCO Capital signs three real estate deals worth $145.5mn – SEDCO Capital has signed three real estate deals worth $145.5mn, boosting its investments in the US. These new deals underscore SEDCO’s powerful partnerships across the US, where it aims to not only continue its legacy, but also bring excellent investment opportunities for its clients. (GulfBase.com) IMF lifts outlook for Saudi GDP, expects bigger budget gap in 2015 – The International Monetary Fund (IMF) has raised its outlook for Saudi Arabia's economic growth in 2015 but also predicted a much bigger state budget deficit after talks with the Saudi officials. The IMF said that the Saudi economy will keep expanding strongly in 2015, showing little effect from the oil price drop; however, the growth will slow down in 2016 as lower oil revenues hit state spending. Meanwhile, the GDP is projected to grow by 3.5% in 2015, unchanged from 2014, marking an upgrade from May 2015, when the IMF forecasted 3.0% growth for Saudi Arabia in 2015. Further, the IMF said that the government spending in 2015 is expected to remain strong, partly due to a number of one-off factors, while oil revenues have declined; however, the growth may slow down to 2.7% in 2016 as government spending will start adjusting to the lower oil price environment. Moreover, the growth is expected to be around 3.0% over the medium-term. The IMF also projected that the government would run a fiscal deficit of around 20.0% of GDP in 2015, which is the biggest deficit since at least 1999, and much larger than the 14.2% gap that it had forecasted in May 2015. (Reuters) Five Saudi stocks to be closed to foreign investors – Shares in five listed Saudi Arabian companies will not be open to foreign investments when the market permits direct stock purchases by foreign institutions in June 2015. The five companies are Jabal Omar Development, Taiba Holding Company, Knowledge Economic City, National Shipping Co. of Saudi Arabia (Bahri) and Makkah Construction & Development Company. Meanwhile, Jabal Omar, Makkah Construction and Taiba are focusing on the holy cities of Mecca and Medina; Saudi media has previously reported that this could be a major reason for the restrictions on ownership of their shares. There are about 170 companies listed on the exchange. (Reuters) Sahara Petrochemical MD retires – Sahara Petrochemical Company has announced the retirement of its Managing Director (MD), Eng. Esam Fuad Himdy Sahara, effective June 15, 2015. Eng. Esam shall continue as the board member until June 26, 2015, the day when the 3rd Sahara’s board of directors session period will be ending. (Tadawul) SAICO secures SAMA temporary approval for insurance product – Saudi Arabian Cooperative Insurance Company (SAICO) has obtained temporary approval from the Saudi Arabian Monetary Agency (SAMA) to use motor third party liability product for a period of three months from June 2, 2015. (Tadawul) SDF grants $30mn for four Jordan industrial cities – The Jordanian government and the Saudi Development Fund (SDF) have signed a funding grant agreement worth $30mn, to finance infrastructure project for new industrial cities in Jordan. These industrial cities will be established in the governorates of Tafila, Madaba, Jerash and Balqa. Jordan Industrial Estates Corporation (JIEC) intends to implement and finance these through the fund and the company's self-revenue. JIEC CEO Ali Madadha said that the grant comes within the framework of joint cooperation between the governments of Jordan and Saudi Arabia, as it is part of the second phase of SDF’s grant agreement with Jordan. (GulfBase.com) AIF signs a MoU with University of Bolton – Aafaq Islamic Finance (AIF) has signed a MoU with the University of Bolton’s Center for Islamic Finance. As per the MoU, both parties will collaborate on a series of projects and initiatives, which include conducting and commissioning joint research in the field of Islamic Finance; developing and promoting a new Islamic Banking Professional Certification program and organizing an annual Islamic finance-based event. (GulfBase.com) DSI mandates banks for dollar Sukuk issue – Drake & Scull International (DSI) has mandated Emirates NBD Capital and HSBC as the joint global coordinators; and Al Hilal Bank, Emirates NBD Capital, HSBC and Standard Chartered Bank as joint lead managers, to arrange a series of fixed income investor meetings in the Middle East and Europe. These meeting will begin on June 4, 2015, and may follow an unrated dollar- denominated regulation S senior perpetual Sukuk offering, depending on the market conditions. (DFM) Marka confirms short-term acquisition – Marka has confirmed that it will carry out acquisition shortly. However, no fixed date is said to have been set as the company is awaiting the approval of the Securities and Commodities Authority (SCA). The company has also confirmed that it is planning for more than one acquisition over the short and medium terms. (DFM) Emirates 24/7: Emaar Properties sells units in Forte – Emirates 24/7 reported that Emaar Properties has sold units in Forte in Downtown – Opera District with a full Dubai Opera view for AED2,700 per square feet (psf). The front-facing apartments were sold at the launch for AED2,700 psf, while the rest were sold for AED2,100 psf. (GulfBase.com) Dana Gas concludes participation agreement with BP in Egypt – Dana Gas has concluded an agreement with BP for drilling and exploration well in El Matariya onshore concession area in Egypt’s Nile Delta. The well was awarded to BP and Dana, during the EGAS 2014 International Bid Round. Under the agreement’s terms, BP as operator will carry Dana Gas for its 50% share in the well’s cost, subject to an agreed cap of $39mn (Dana Gas share). Meanwhile, in consideration for the carry, BP has the option, subject to government’s approval, to farm in parts of Dana Gas’s West El Manzala (WEM) Concession Area; while retaining WEM Operatorship, and ownership of the existing and future shallow gas business with Dana Gas. In addition, BP has a further option, again subject to government’s approval, to farm in other areas of Dana Gas’s WEM Concession and in the recently-awarded North El Salhiya Concession Area, for a 50% participating interest in each case, if it elects to drill a second exploration well and carry Dana Gas’s 50% share of the related well costs, again subject to a similar agreed cap. As with the first farm-in option, operatorship and ownership of the existing and future shallow gas business of the farm-in areas will remain with Dana Gas. (ADX) ADIA manages more of its funds in-house in 2014 – Abu Dhabi Investment Authority (ADIA) had managed more of its money in-house in 2014, as it strengthened its capabilities and added staff in some areas. ADIA, in its annual review, said that the proportion of its assets managed by external fund managers had fallen to 65% in 2014, from 75% in 2013. The authority invests across the world - from developed and emerging market equities, fixed income and private equity to real estate and infrastructure. 55% of the ADIA’s assets are invested via index- replicating strategies. Further, its 20-year annualized rate of return had risen from 7.2% to 7.4% during 2013-end to 2014-
- 5. Page 5 of 6 end respectively; while ADIA’s 30-year annualized rate of return had risen to 8.4% from 8.3%. (Reuters) NBK: Kuwait inflation ticks up to 3.4% in April, core inflation eases – According to a report released by the National Bank of Kuwait (NBK), Kuwait’s consumer price index (CPI) rose slightly from 3.3% YoY in March 2015 to 3.4% YoY in April 2015. The rising inflation was mainly due to a rise in local food inflation. However, local food inflation remains relatively low and is expected to trend lower, given the continued decline in international food prices. Meanwhile, the NBK expects overall inflation to average at a rate close to 3.5% in 2015. As per the report, core inflation slowed down marginally in April 2015 but remains relatively high at 3.7% YoY. Inflation in the food price index climbed from 1.7% YoY in March 2015 to 2.3% YoY in April 2015. (GulfBase.com) NMWC to sell Wadi Kabir-based asset – At the extraordinary general meeting (EGM), National Mineral Water Company’s (NMWC) board has recommended to sell a proposed asset of the company, situated at Wadi Kabir, to Al Hail Investment. (MSM) Tilal signs OMR30mn financing agreement with Meethaq – Tilal Development Company has signed a financing agreement worth OMR30mn with Meethaq, the Islamic banking arm of Bank Muscat. The funds will be utilised for the expansion of Muscat Grand Mall and the Millennium Executive Apartments at the Tilal Complex, which is the first mixed-use development in Oman. (GulfBase.com) Ibdar Bank reports $3mn net profit in 1Q2015 – Bahrain- based Ibdar Bank reported a net profit of $3mn in 1Q2015, reflecting an increase of 200% YoY. Meanwhile, the bank’s total income stood at $6.3mn in 1Q2015, showing an increase of 65.8% YoY. The strong profit growth was aided by a 1,778% increase in the bank’s income generated from investment banking services over the previous year; and income generated from the gains in the trading of investments & securities and profitable exits from existing investments. Moreover, total owners’ equity increased by 1.4% in 1Q2015 while the total asset base grew by 3.3% reaching $441mn by March 31, 2015. (GulfBase.com)
- 6. Contacts Saugata Sarkar Sahbi Kasraoui QNB Financial Services SPC Head of Research Head of HNI Contact Center: (+974) 4476 6666 Tel: (+974) 4476 6534 Tel: (+974) 4476 6544 PO Box 24025 saugata.sarkar@qnbfs.com.qa sahbi.alkasraoui@qnbfs.com.qa Doha, Qatar Disclaimer and Copyright Notice: This publication has been prepared by QNB Financial Services SPC (“QNBFS”) a wholly-owned subsidiary of QNB SAQ (“QNB”). QNBFS is regulated by the Qatar Financial Markets Authority and the Qatar Exchange QNB SAQ is regulated by the Qatar Central Bank. This publication expresses the views and opinions of QNBFS at a given time only. It is not an offer, promotion or recommendation to buy or sell securities or other investments, nor is it intended to constitute legal, tax, accounting, or financial advice. QNBFS accepts no liability whatsoever for any direct or indirect losses arising from use of this report. Any investment decision should depend on the individual circumstances of the investor and be based on specifically engaged investment advice. We therefore strongly advise potential investors to seek independent professional advice before making any investment decision. Although the information in this report has been obtained from sources that QNBFS believes to be reliable, we have not independently verified such information and it may not be accurate or complete. QNBFS does not make any representations or warranties as to the accuracy and completeness of the information it may contain, and declines any liability in that respect. For reports dealing with Technical Analysis, expressed opinions and/or recommendations may be different or contrary to the opinions/recommendations of QNBFS Fundamental Research as a result of depending solely on the historical technical data (price and volume). QNBFS reserves the right to amend the views and opinions expressed in this publication at any time. It may also express viewpoints or make investment decisions that differ significantly from, or even contradict, the views and opinions included in this report. This report may not be reproduced in whole or in part without permission from QNBFS COPYRIGHT: No part of this document may be reproduced without the explicit written permission of QNBFS. Page 6 of 6 Rebased Performance Daily Index Performance Source: Bloomberg Source: Bloomberg Source: Bloomberg Source: Bloomberg (*$ adjusted returns) 80.0 100.0 120.0 140.0 160.0 180.0 200.0 220.0 May-11 May-12 May-13 May-14 May-15 QSE Index S&P Pan Arab S&P GCC 0.2% 0.1% 0.2% 0.2% 0.7% 0.6% 1.2% 0.0% 0.4% 0.8% 1.2% 1.6% SaudiArabia Qatar Kuwait Bahrain Oman AbuDhabi Dubai Asset/Currency Performance Close ($) 1D% WTD% YTD% Global Indices Performance Close 1D%* WTD%* YTD%* Gold/Ounce 1,192.99 0.3 0.2 0.7 MSCI World Index 1,782.39 0.2 0.2 4.3 Silver/Ounce 16.79 0.1 0.3 6.9 DJ Industrial 18,011.94 (0.2) 0.0 1.1 Crude Oil (Brent)/Barrel (FM Future) 65.49 0.9 (0.1) 14.2 S&P 500 2,109.60 (0.1) 0.1 2.5 Crude Oil (WTI)/Barrel (FM Future) 61.26 1.8 1.6 15.0 NASDAQ 100 5,076.52 (0.1) 0.1 7.2 Natural Gas (Henry Hub)/MMBtu 2.62 0.9 (0.7) (12.4) STOXX 600 396.45 1.3 1.0 6.9 LPG Propane (Arab Gulf)/Ton 45.38 0.0 2.8 (7.4) DAX 11,328.80 1.4 1.1 6.2 LPG Butane (Arab Gulf)/Ton 59.25 2.2 4.9 (5.6) FTSE 100 6,928.27 0.8 (0.2) 4.0 Euro 1.12 2.0 1.5 (7.8) CAC 40 5,004.46 1.9 1.8 8.2 Yen 124.11 (0.5) (0.0) 3.6 Nikkei 20,543.19 0.6 (0.0) 13.4 GBP 1.53 0.9 0.3 (1.5) MSCI EM 999.87 (0.3) (0.4) 4.6 CHF 1.07 1.4 0.8 6.6 SHANGHAI SE Composite 4,910.53 1.6 6.3 52.0 AUD 0.78 2.2 1.7 (4.9) HANG SENG 27,466.72 (0.5) 0.1 16.3 USD Index 95.84 (1.6) (1.1) 6.2 BSE SENSEX 27,188.38 (2.5) (2.3) (1.8) RUB 52.85 (1.4) 1.0 (13.0) Bovespa 54,236.43 3.9 4.5 (8.2) BRL 0.32 1.3 1.6 (15.3) RTS 973.45 2.1 0.5 23.1 175.1 142.5 129.2